UNITED STATES
SECURITIES AND EXCHANGE COMMISSION
Washington, D.C. 20549
FORM N-CSR
CERTIFIED SHAREHOLDER REPORT OF
REGISTERED MANAGEMENT INVESTMENT COMPANIES
Investment Company Act file number 811-05440
MFS INTERMEDIATE INCOME TRUST
(Exact name of registrant as specified in charter)
111 Huntington Avenue, Boston, Massachusetts 02199
(Address of principal executive offices) (Zip code)
Christopher R. Bohane
Massachusetts Financial Services Company
111 Huntington Avenue
Boston, Massachusetts 02199
(Name and address of agents for service)
Registrant’s telephone number, including area code: (617) 954-5000
Date of fiscal year end: October 31
Date of reporting period: October 31, 2020
| ITEM 1. | REPORTS TO STOCKHOLDERS. |
Annual Report
October 31, 2020

MFS® Intermediate Income Trust

Beginning on January 1, 2021, as permitted by regulations adopted by the U.S. Securities and Exchange Commission, paper copies of the fund’s annual and semiannual shareholder reports will no longer be sent by mail, unless you specifically request paper copies of the reports. Instead, the complete reports will be made available on the fund’s Web site, and you will be notified by mail each time a report is posted and provided with a Web site link to access the report.
If you are already signed up to receive shareholder reports by email, you will not be affected by this change and you need not take any action. You may sign up to receive shareholder reports and other communications from the fund by email by contacting your financial intermediary (such as a broker-dealer or bank) or, if you hold your shares directly with the fund, by calling 1-800-637-2304 or by logging into your Investor Center account at www.computershare.com/investor.
Beginning on January 1, 2019, you may elect to receive all future reports in paper free of charge. Contact your financial intermediary to request that you continue to receive paper copies of your shareholder reports. If you invest directly with the fund, you can call 1-800-637-2304 to let the fund know that you wish to continue receiving paper copies of your shareholder reports. Your election to receive reports in paper will apply to all funds held in your account if you invest through your financial intermediary or all funds held with the MFS fund complex if you invest directly.
MIN-ANN
MANAGED DISTRIBUTION POLICY DISCLOSURE
The MFS Intermediate Income Trust’s (the fund) Board of Trustees adopted a managed distribution policy. The fund seeks to pay monthly distributions based on an annual rate of 8.50% of the fund’s average monthly net asset value. The primary purpose of the managed distribution policy is to provide shareholders with a constant, but not guaranteed, fixed minimum rate of distribution each month. You should not draw any conclusions about the fund’s investment performance from the amount of the current distribution or from the terms of the fund’s managed distribution policy. The Board may amend or terminate the managed distribution policy at any time without prior notice to fund shareholders. The amendment or termination of the managed distribution policy could have an adverse effect on the market price of the fund’s shares.
With each distribution, the fund will issue a notice to shareholders and an accompanying press release which will provide detailed information regarding the amount and composition of the distribution and other related information. The amounts and sources of distributions reported in the notice to shareholders are only estimates and are not being provided for tax reporting purposes. The actual amounts and sources of the amounts for tax reporting purposes will depend upon the fund’s investment experience during its fiscal year and may be subject to changes based on tax regulations. The fund will send you a Form 1099-DIV for the calendar year that will tell you how to report these distributions for federal income tax purposes. Please refer to “Tax Matters and Distributions” under Note 2 of the Notes to Financial Statements for information regarding the tax character of the fund’s distributions.
Under a managed distribution policy the fund may at times distribute more than its net investment income and net realized capital gains; therefore, a portion of your distribution may result in a return of capital. A return of capital may occur, for example, when some or all of the money that you invested in the fund is paid back to you. Any such returns of capital will decrease the fund’s total assets and, therefore, could have the effect of increasing the fund’s expense ratio. In addition, in order to make the level of distributions called for under its managed distribution policy, the fund may have to sell portfolio securities at a less than opportune time. A return of capital does not necessarily reflect the fund’s investment performance and should not be confused with ‘yield’ or ‘income’. The fund’s total return in relation to changes in net asset value is presented in the Financial Highlights.
MFS® Intermediate Income Trust
New York Stock Exchange Symbol: MIN
NOT FDIC INSURED • MAY LOSE VALUE • NO BANK GUARANTEE

LETTER FROM THE EXECUTIVE CHAIR
Dear Shareholders:
Markets experienced dramatic swings this year as the coronavirus pandemic brought the global economy to a standstill for several months early in the year, though
optimism over the development of vaccines and therapeutics later brightened the economic and market outlook. However, a great deal of uncertainty remains as case counts in the United States and Europe remain very high and it is still unclear when a vaccine will become widely available. In the United States, political uncertainty eased after former Vice President Joe Biden was projected the winner of the presidential election, though whether his party also gains control of Congress will not be known until two Senate runoff elections in Georgia in early January.
Global central banks have taken aggressive steps to cushion the economic and market fallout related to the virus, and
governments are deploying unprecedented levels of fiscal support, though in the U.S. some of those measures were allowed to lapse at the end of July as negotiators found themselves at an impasse over the scope of additional funding. The measures already put in place have helped build a supportive environment and are encouraging economic recovery; however, if markets disconnect from fundamentals, they can also sow the seeds of instability. In the aftermath of the crisis, societal changes may be likely as households, businesses, and governments adjust to a new reality, and any such alterations could affect the investment landscape. For investors, events such as the COVID-19 outbreak demonstrate the importance of having a deep understanding of company fundamentals, and we have built our global research platform to do just that.
Here at MFS®, we aim to help our clients navigate the growing complexity of the markets and world economies. Our long-term investment philosophy and commitment to the responsible allocation of capital allow us to tune out the noise and uncover what we believe are the best, most durable investment opportunities in the market. Through our unique global investment platform, we combine collective expertise, thoughtful risk management, and long-term discipline to create sustainable value for investors.
Respectfully,

Robert J. Manning
Executive Chair
MFS Investment Management
December 16, 2020
The opinions expressed in this letter are subject to change and may not be relied upon for investment advice. No forecasts can be guaranteed.
1
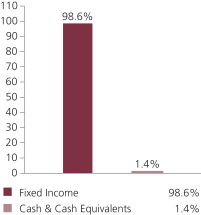
PORTFOLIO COMPOSITION
Portfolio structure (i)
| | | | |
| Fixed income sectors (i) | | | | |
| Investment Grade Corporates | | | 55.2% | |
| U.S. Treasury Securities | | | 31.4% | |
| Municipal Bonds | | | 4.9% | |
| Emerging Markets Bonds | | | 2.5% | |
| High Yield Corporates | | | 1.1% | |
| Commercial Mortgage-Backed Securities | | | 1.0% | |
| Mortgage-Backed Securities | | | 0.9% | |
| Collateralized Debt Obligations | | | 0.6% | |
| Non-U.S. Government Bonds | | | 0.5% | |
| Residential Mortgage-Backed Securities | | | 0.3% | |
| U.S. Government Agencies | | | 0.1% | |
| Asset-Backed Securities | | | 0.1% | |
| | | | |
| Composition including fixed income credit quality (a)(i) | |
| AAA | | | 2.7% | |
| AA | | | 3.8% | |
| A | | | 23.3% | |
| BBB | | | 32.7% | |
| BB | | | 2.6% | |
| B | | | 0.7% | |
| D | | | 0.4% | |
| U.S. Government | | | 31.4% | |
| Federal Agencies | | | 1.0% | |
| Cash & Cash Equivalents | | | 1.4% | |
| |
| Portfolio facts (i) | | | | |
| Average Duration (d) | | | 4.1 | |
| Average Effective Maturity (m) | | | 4.6 yrs. | |
2
Portfolio Composition – continued
| (a) | For all securities other than those specifically described below, ratings are assigned to underlying securities utilizing ratings from Moody’s, Fitch, and Standard & Poor’s rating agencies and applying the following hierarchy: If all three agencies provide a rating, the middle rating (after dropping the highest and lowest ratings) is assigned; if two of the three agencies rate a security, the lower of the two is assigned. If none of the 3 rating agencies above assign a rating, but the security is rated by DBRS Morningstar, then the DBRS Morningstar rating is assigned. Ratings are shown in the S&P and Fitch scale (e.g., AAA). Securities rated BBB or higher are considered investment grade. All ratings are subject to change. U.S. Government includes securities issued by the U.S. Department of the Treasury. Federal Agencies includes rated and unrated U.S. Agency fixed-income securities, U.S. Agency mortgage-backed securities, and collateralized mortgage obligations of U.S. Agency mortgage-backed securities. The fund may or may not have held all of these instruments on this date. The fund is not rated by these agencies. |
| (d) | Duration is a measure of how much a bond’s price is likely to fluctuate with general changes in interest rates, e.g., if rates rise 1.00%, a bond with a 5-year duration is likely to lose about 5.00% of its value due to the interest rate move. |
| (i) | For purposes of this presentation, the components include the value of securities, and reflect the impact of the equivalent exposure of derivative positions, if any. These amounts may be negative from time to time. Equivalent exposure is a calculated amount that translates the derivative position into a reasonable approximation of the amount of the underlying asset that the portfolio would have to hold at a given point in time to have the same price sensitivity that results from the portfolio’s ownership of the derivative contract. When dealing with derivatives, equivalent exposure is a more representative measure of the potential impact of a position on portfolio performance than value. The bond component will include any accrued interest amounts. |
| (m) | In determining each instrument’s effective maturity for purposes of calculating the fund’s dollar-weighted average effective maturity, MFS uses the instrument’s stated maturity or, if applicable, an earlier date on which MFS believes it is probable that a maturity-shortening device (such as a put, pre-refunding or prepayment) will cause the instrument to be repaid. Such an earlier date can be substantially shorter than the instrument’s stated maturity. |
Where the fund holds convertible bonds, they are treated as part of the equity portion of the portfolio.
Cash & Cash Equivalents includes any cash, investments in money market funds, short-term securities, and other assets less liabilities. Please see the Statement of Assets and Liabilities for additional information related to the fund’s cash position and other assets and liabilities.
Percentages are based on net assets as of October 31, 2020.
The portfolio is actively managed and current holdings may be different.
3
MANAGEMENT REVIEW
Summary of Results
For the twelve months ended October 31, 2020, shares of the MFS Intermediate Income Trust (fund) provided a total return of 6.96%, at net asset value and a total return of 8.24% at market value. This compares with a return of 5.67% for the fund’s benchmark, the Bloomberg Barclays U.S. Intermediate Government/Credit Bond Index (Bloomberg Index).
The performance commentary below is based on the net asset value performance of the fund, which reflects the performance of the underlying pool of assets held by the fund. The total return at market value represents the return earned by owners of the shares of the fund, which are traded publicly on the exchange.
Market Environment
Markets experienced an extraordinarily sharp selloff and, in many cases, an unusually rapid recovery late in the period. Central banks and fiscal authorities undertook astonishing levels of stimulus to offset the economic effects of government-imposed social-distancing measures implemented to slow the spread of the COVID-19 virus. At this point, the global economy looks to have experienced the deepest, steepest and possibly shortest recession in the postwar period. However, the recovery remains subject to more than the usual number of uncertainties due to questions about the evolution of the virus, what its continued impact will be and when vaccines or medicines will become available to prevent or treat it.
Around the world, central banks responded quickly and massively to the crisis with programs to improve liquidity and support markets. These programs proved largely successful in helping to restore market function, ease volatility and stimulate a continued market rebound. Late in the period, the US Federal Reserve adopted a new, flexible average-inflation-targeting framework, which is expected to result in policy rates remaining at low levels for a longer period. In developed countries, monetary easing measures were complemented by large fiscal stimulus initiatives, although late in the period there was uncertainty surrounding the timing and scope of additional US recovery funding. Due to relatively manageable external liabilities and balances of payments in many countries, along with persistently low inflation, even emerging market countries were able to implement countercyclical policies – a departure from the usual market-dictated response to risk-off crises.
Compounding market uncertainty earlier in the pandemic was a crash in the price of crude oil due to a sharp drop in global demand and a disagreement between Saudi Arabia and Russia over production cuts, which resulted in a price war. The subsequent decline in prices undercut oil exporters, many of which are in emerging markets, as well as a large segment of the high-yield credit market. The OPEC+ group later agreed on output cuts, with shale oil producers in the United States also decreasing production, which, along with the gradual reopening of some major economies and the resultant boost in demand, helped stabilize the price of crude oil.
As has often been the case in a crisis, market vulnerabilities have been revealed. For example, companies that have added significant leverage to their balance sheets in
4
Management Review – continued
recent years by borrowing to fund dividend payments and stock buybacks have, in many cases, halted share repurchases and cut dividends, while some firms have been forced to recapitalize.
Factors Affecting Performance
Relative to the Bloomberg Index, the fund’s greater exposure to both the industrials and financial institutions sectors, and its lesser exposure to the treasury sector, strengthened relative returns. Additionally, favorable bond selection within the industrials sector, particularly within “BBB” rated (r) securities, further benefited relative results.
Conversely, the fund’s out-of-benchmark exposure to the municipal sector held back relative performance.
Respectfully,
Portfolio Manager(s)
Geoffrey Schechter and Alexander Mackey
| (r) | Bonds rated “BBB”, “Baa”, or higher are considered investment grade; bonds rated “BB”, “Ba”, or below are considered non-investment grade. The source for bond quality ratings is Moody’s Investors Service, Standard & Poor’s and Fitch, Inc. and are applied using the following hierarchy: If all three agencies provide a rating, the middle rating (after dropping the highest and lowest ratings) is assigned; if two of the three agencies rate a security, the lower of the two is assigned. If none of the 3 Rating Agencies above assign a rating, but the security is rated by DBRS Morningstar, then the DBRS Morningstar rating is assigned. Ratings are shown in the S&P and Fitch scale (e.g., AAA). For securities which are not rated by any of the three agencies, the security is considered Not Rated. |
The views expressed in this report are those of the portfolio manager(s) only through the end of the period of the report as stated on the cover and do not necessarily reflect the views of MFS or any other person in the MFS organization. These views are subject to change at any time based on market or other conditions, and MFS disclaims any responsibility to update such views. These views may not be relied upon as investment advice or an indication of trading intent on behalf of any MFS portfolio. References to specific securities are not recommendations of such securities, and may not be representative of any MFS portfolio’s current or future investments.
5
PERFORMANCE SUMMARY THROUGH 10/31/20
The following chart presents the fund’s historical performance in comparison to its benchmark(s). Investment return and principal value will fluctuate, and shares, when sold, may be worth more or less than their original cost; current performance may be lower or higher than quoted. The performance shown does not reflect the deduction of taxes, if any, that a shareholder would pay on fund distributions or the sale of fund shares. Performance data shown represents past performance and is no guarantee of future results.
Price Summary for MFS Intermediate Income Trust
| | | | | | | | | | | | |
| | | | | | | Date | | | Price | | |
| | | | | | |
Year Ended 10/31/20 | | | | Net Asset Value | | | 10/31/20 | | | $3.95 | | |
| | | | | | | 10/31/19 | | | $4.04 | | |
| | | | New York Stock Exchange Price | | | 10/31/20 | | | $3.73 | | |
| | | | | | | 8/17/20 | (high) (t) | | $3.92 | | |
| | | | | | | 3/18/20 | (low) (t) | | $3.35 | | |
| | | | | | | 10/31/19 | | | $3.77 | | |
Total Returns vs Benchmark(s)
| | | | | | | | |
| | | | | |
Year Ended 10/31/20 | | | | MFS Intermediate Income Trust at | | | | |
| | | | New York Stock Exchange Price (r) | | 8.24% | | |
| | | | Net Asset Value (r) | | 6.96% | | |
| | | | Bloomberg Barclays U.S. Intermediate Government/Credit Bond Index (f) | | 5.67% | | |
| (f) | Source: FactSet Research Systems Inc. |
| (r) | Includes reinvestment of all distributions. |
| (t) | For the period November 1, 2019 through October 31, 2020. |
Benchmark Definition(s)
Bloomberg Barclays U.S. Intermediate Government/Credit Bond Index (a) – a market capitalization-weighted index that measures the performance of investment-grade debt obligations of the U.S. Treasury and U.S. government agencies, as well as U.S. corporate and foreign debentures and secured notes, with maturities from 1 year up to (but not including) 10 years.
It is not possible to invest directly in an index.
| (a) | BLOOMBERG® is a trademark and service mark of Bloomberg Finance L.P. and its affiliates (collectively “Bloomberg”). BARCLAYS® is a trademark and service mark of Barclays Bank Plc (collectively with its affiliates, “Barclays”), used under license. Bloomberg or Bloomberg’s |
6
Performance Summary – continued
| | licensors, including Barclays, own all proprietary rights in the Bloomberg Barclays Indices. Neither Bloomberg nor Barclays approves or endorses this material, or guarantees the accuracy or completeness of any information herein, or makes any warranty, express or implied, as to the results to be obtained therefrom, and, to the maximum extent allowed by law, neither shall have any liability or responsibility for injury or damages arising in connection therewith. |
Notes to Performance Summary
The fund’s shares may trade at a discount or premium to net asset value. When fund shares trade at a premium, buyers pay more than the net asset value underlying fund shares, and shares purchased at a premium would receive less than the amount paid for them in the event of the fund’s concurrent liquidation.
The fund’s target annual distribution rate is calculated based on an annual rate of 8.50% of the fund’s average monthly net asset value, not a fixed share price, and the fund’s dividend amount will fluctuate with changes in the fund’s average monthly net assets.
Net asset values and performance results based on net asset value per share do not include adjustments made for financial reporting purposes in accordance with U.S. generally accepted accounting principles and may differ from amounts reported in the Statement of Assets and Liabilities or the Financial Highlights.
From time to time the fund may receive proceeds from litigation settlements, without which performance would be lower.
In accordance with Section 23(c) of the Investment Company Act of 1940, the fund hereby gives notice that it may from time to time repurchase shares of the fund in the open market at the option of the Board of Trustees and on such terms as the Trustees shall determine.
7
INVESTMENT OBJECTIVE, PRINCIPAL INVESTMENT STRATEGIES, PRINCIPAL INVESTMENT TYPES AND PRINCIPAL RISKS
Investment Objective
The fund’s investment objective is to seek high current income, but may also consider capital appreciation. The fund’s objective may be changed without shareholder approval.
Principal Investment Strategies
MFS (Massachusetts Financial Services Company, the fund’s investment adviser) normally invests the fund’s assets primarily in debt instruments.
MFS generally invests substantially all of the fund’s assets in investment grade quality debt instruments.
The fund’s dollar-weighted average effective maturity will normally be between three and ten years. In determining an instrument’s effective maturity, MFS uses the instrument’s stated maturity or, if applicable, an earlier date on which MFS believes it is probable that a maturity-shortening device (such as a call, put, pre-refunding, prepayment or redemption provision, or an adjustable coupon) will cause the instrument to be repaid. Such an earlier date can be substantially shorter than the instrument’s stated maturity.
MFS may invest the fund’s assets in foreign securities.
MFS normally invests the fund’s assets across different industries and sectors, but MFS may invest a significant percentage of the fund’s assets in issuers in a single industry or sector.
The fund seeks to make a monthly distribution at an annual fixed rate of 8.50% of the fund’s average monthly net asset value.
While MFS may use derivatives for any investment purpose, to the extent MFS uses derivatives, MFS expects to use derivatives primarily to increase or decrease exposure to a particular market, segment of the market, or security, to increase or decrease interest rate or currency exposure, or as alternatives to direct investments.
MFS uses an active bottom-up investment approach to buying and selling investments for the fund. Investments are selected primarily based on fundamental analysis of individual instruments and their issuers in light of the issuers’ financial condition and market, economic, political, and regulatory conditions. Factors considered may include the instrument’s credit quality and terms, any underlying assets and their credit quality, and the issuer’s management ability, capital structure, leverage, and ability to meet its current obligations. MFS may also consider environmental, social, and governance (ESG) factors in its fundamental investment analysis. Quantitative screening tools that systematically evaluate the structure of a debt instrument and its features may also be considered. In structuring the fund, MFS also considers top-down factors, including sector allocations, yield curve positioning, duration, macroeconomic factors, and risk management factors.
If approved by the fund’s Board of Trustees, the fund may use leverage through the issuance of preferred shares, borrowing from banks, and/or other methods of creating
leverage, and investing the proceeds pursuant to its investment strategies.
8
Investment Objective, Principal Investment Strategies, Principal Investment Types and Principal Risks – continued
MFS may engage in active and frequent trading in pursuing the fund’s principal investment strategies.
In response to market, economic, political, or other conditions, MFS may depart from the fund’s principal investment strategies by temporarily investing for defensive purposes.
Principal Investment Types
The principal investment types in which the fund may invest are:
Debt Instruments: Debt instruments represent obligations of corporations, governments, and other entities to repay money borrowed, or other instruments believed to have debt-like characteristics. The issuer or borrower usually pays a fixed, variable, or floating rate of interest, and must repay the amount borrowed, usually at the maturity of the instrument. Debt instruments generally trade in the over-the-counter market and can be less liquid than other types of investments, particularly during adverse market and economic conditions. During certain market conditions, debt instruments in some or many segments of the debt market can trade at a negative interest rate (i.e., the price to purchase the debt instrument is more than the present value of expected interest payments and principal due at the maturity of the instrument). Some debt instruments, such as zero coupon bonds or payment-in-kind bonds, do not pay current interest. Other debt instruments, such as certain mortgage-backed securities and other securitized instruments, make periodic payments of interest and/or principal. Some debt instruments are partially or fully secured by collateral supporting the payment of interest and principal.
Securitized Instruments: Securitized instruments are debt instruments that generally provide payments of principal and interest based on the terms of the instrument and cash flows generated by the underlying assets. Underlying assets include residential and commercial mortgages, debt instruments, loans, leases, and receivables. Securitized instruments are issued by trusts or other special purpose entities that hold the underlying assets. Certain securitized instruments offer multiple classes that differ in terms of their priority to receive principal and/or interest payments under the terms of the instrument. Securitized instruments include mortgage-backed securities, collateralized debt obligations, and other asset-backed securities. Certain mortgage-backed securities are issued on a delayed delivery or forward commitment basis where payment and delivery take place at a future date.
Corporate Bonds: Corporate bonds are debt instruments issued by corporations or similar entities.
U.S. Government Securities: U.S. Government securities are securities issued or guaranteed as to the payment of principal and interest by the U.S. Treasury, by an agency or instrumentality of the U.S. Government, or by a U.S. Government-sponsored entity. Certain U.S. Government securities are not supported as to the payment of principal and interest by the full faith and credit of the U.S. Treasury or the ability to borrow from the U.S. Treasury. Some U.S. Government securities are supported as to the payment of principal and interest only by the credit of the entity issuing or guaranteeing the security. U.S. Government securities include mortgage-backed
9
Investment Objective, Principal Investment Strategies, Principal Investment Types and Principal Risks – continued
securities and other types of securitized instruments guaranteed by the U.S. Treasury, by an agency or instrumentality of the U.S. Government, or by a U.S. Government-sponsored entity.
Foreign Government Securities: Foreign government securities are debt instruments issued, guaranteed, or supported, as to the payment of principal and interest, by foreign governments, foreign government agencies, foreign semi-governmental entities or supranational entities, or debt instruments issued by entities organized and operated for the purpose of restructuring outstanding foreign government securities. Foreign government securities may not be supported as to the payment of principal and interest by the full faith and credit of the foreign government.
Municipal Instruments: Municipal instruments are issued by or for states, territories, or possessions of the United States or by their political subdivisions, agencies, authorities, or other government entities, to raise money for a variety of public and private purposes, including general financing for state and local governments, or financing for a specific project or public facility. Municipal instruments include general obligation bonds of municipalities, state or local governments, project or revenue-specific bonds, municipal lease obligations, and prerefunded or escrowed bonds. Municipal instruments may be fully or partially supported by the state or local governments, by the credit of a private issuer, by the current or anticipated revenues from a specific project or assets, by the issuer’s pledge to make annual appropriations for lease payments, or by domestic or foreign entities providing credit support, such as insurance, letters of credit, or guarantees. Many municipal instruments are supported by insurance, which typically guarantees the timely payment of all principal and interest due on the underlying municipal instrument.
Derivatives: Derivatives are financial contracts whose value is based on the value of one or more underlying indicators or the difference between underlying indicators. Underlying indicators may include a security or other financial instrument, asset, currency, interest rate, credit rating, commodity, volatility measure, or index. Derivatives often involve a counterparty to the transaction. Derivatives include futures, forward contracts, options, swaps, and certain complex structured securities.
Principal Risks
The share price of the fund will change daily based on changes in market, economic, industry, political, regulatory, geopolitical, environmental, public health, and other conditions. As with any mutual fund, the fund may not achieve its objective and/or you could lose money on your investment in the fund. An investment in the fund is not a bank deposit and is not insured or guaranteed by the Federal Deposit Insurance Corporation or any other governmental agency. The significance of any specific risk to an investment in the fund will vary over time depending on the composition of the fund’s portfolio, market conditions, and other factors. You should read all of the risk information below carefully, because any one or more of these risks may result in losses to the fund.
The principal risks of investing in the fund are:
Investment Selection Risk: MFS’ investment analysis and its selection of investments may not produce the intended results and/or can lead to an investment focus that
10
Investment Objective, Principal Investment Strategies, Principal Investment Types and Principal Risks – continued
results in the fund underperforming other funds with similar investment strategies and/or underperforming the markets in which the fund invests. In addition, MFS or the fund’s other service providers may experience disruptions or operating errors that could negatively impact the fund.
Debt Market Risk: Debt markets can be volatile and can decline significantly in response to, or investor perceptions of, issuer, market, economic, industry, political, regulatory, geopolitical, environmental, public health, and other conditions. These conditions can affect a single instrument, issuer, or borrower, a particular type of instrument, issuer, or borrower, a segment of the debt markets, or debt markets generally. Certain changes or events, such as political, social, or economic developments, including increasing and negative interest rates or the U.S. government’s inability at times to agree on a long-term budget and deficit reduction plan (which has in the past resulted and may in the future result in a government shutdown); market closures and/or trading halts; government or regulatory actions, including the imposition of tariffs or other protectionist actions and changes in fiscal, monetary, or tax policies; natural disasters; outbreaks of pandemic and epidemic diseases; terrorist attacks; war; and other geopolitical changes or events can have a dramatic adverse effect on debt markets and may lead to periods of high volatility and reduced liquidity in a debt market or a segment of a debt market.
Interest Rate Risk: The price of a debt instrument typically changes in response to interest rate changes. Interest rates can change in response to the supply and demand for credit, government and/or central bank monetary policy and action, inflation rates, and other factors. In general, the price of a debt instrument falls when interest rates rise and rises when interest rates fall. Interest rate risk is generally greater for
instruments with longer maturities, or that do not pay current interest. In addition, short-term and long-term interest rates, and interest rates in different countries, do not necessarily move in the same direction or by the same amount. An instrument’s reaction to interest rate changes depends on the timing of its interest and principal payments and the current interest rate for each of those time periods. Instruments with floating interest rates can be less sensitive to interest rate changes. The price of an instrument trading at a negative interest rate responds to interest rate changes like other debt instruments; however, an instrument purchased at a negative interest rate is expected to produce a negative return if held to maturity. Changes in government and/or central bank monetary policy may affect the level of interest rates.
Credit Risk: The price of a debt instrument depends, in part, on the issuer’s or borrower’s credit quality or ability to pay principal and interest when due. The price of a debt instrument is likely to fall if an issuer or borrower defaults on its obligation to pay principal or interest, if the instrument’s credit rating is downgraded by a credit rating agency, or based on other changes in, or perceptions of, the financial condition of the issuer or borrower. For certain types of instruments, including derivatives, the price of the instrument depends in part on the credit quality of the counterparty to the transaction. For other types of debt instruments, including securitized instruments, the price of the debt instrument also depends on the credit quality and adequacy of the
11
Investment Objective, Principal Investment Strategies, Principal Investment Types and Principal Risks – continued
underlying assets or collateral as well as whether there is a security interest in the underlying assets or collateral. Enforcing rights, if any, against the underlying assets or collateral may be difficult.
Foreign Risk: Investments in securities of foreign issuers, securities of companies with significant foreign exposure, and foreign currencies can involve additional risks relating to market, economic, industry, political, regulatory, geopolitical, environmental, public health, and other conditions. Political, social, diplomatic, and economic developments, U.S. and foreign government action such as the imposition of currency or capital blockages, controls, or tariffs, economic and trade sanctions or embargoes, security suspensions, entering or exiting trade or other intergovernmental agreements, or the expropriation or nationalization of assets in a particular country, can cause dramatic declines in certain or all securities with exposure to that country and other countries. In the event of nationalization, expropriation, or other confiscation, the fund could lose its entire foreign investment in a particular country. Economies and financial markets are interconnected, which increases the likelihood that conditions in one country or region can adversely impact issuers in different countries and regions. Less stringent regulatory, accounting, auditing, and disclosure requirements for issuers and markets are more common in certain foreign countries. Enforcing legal rights can be difficult, costly, and slow in certain foreign countries, and can be particularly difficult against foreign governments. Changes in currency exchange rates can significantly impact the financial condition of a company or other issuer with exposure to multiple countries as well as affect the U.S. dollar value of foreign currency investments and investments denominated in foreign currencies. Additional risks of foreign investments include trading, settlement, custodial, and other operational risks, and withholding and other taxes. These factors can make foreign investments, especially those tied economically to emerging and frontier markets (emerging markets that are early in their development), more volatile and less liquid than U.S. investments. In addition, foreign markets can react differently to market, economic, industry, political, regulatory, geopolitical, environmental, public health, and other conditions than the U.S. market.
Focus Risk: Issuers in a single industry, sector, country, or region can react similarly to market, currency, political, economic, regulatory, geopolitical, environmental, public health, and other conditions. These conditions include business environment changes; economic factors such as fiscal, monetary, and tax policies; inflation and unemployment rates; and government and regulatory changes. The fund’s performance will be affected by the conditions in the industries, sectors, countries and regions to which the fund is exposed.
Prepayment/Extension Risk: Many types of debt instruments, including mortgage-backed securities, securitized instruments, certain corporate bonds, and municipal housing bonds, and certain derivatives, are subject to the risk of prepayment and/or extension. Prepayment occurs when unscheduled payments of principal are made or the instrument is called or redeemed prior to an instrument’s maturity. When interest rates decline, the instrument is called, or for other reasons, these debt instruments may be repaid more quickly than expected. As a result, the holder of the debt instrument may not be able to reinvest the proceeds at the same interest rate or on the same terms, reducing the potential for gain. When interest rates increase or for other reasons, these
12
Investment Objective, Principal Investment Strategies, Principal Investment Types and Principal Risks – continued
debt instruments may be repaid more slowly than expected, increasing the potential for loss. In addition, prepayment rates are difficult to predict and the potential impact of prepayment on the price of a debt instrument depends on the terms of the instrument.
Municipal Risk: The price of a municipal instrument can be volatile and significantly affected by adverse tax changes or court rulings, legislative or political changes, market and economic conditions and developments, issuer, industry-specific and other conditions, including as the result of events that cannot be reasonably anticipated or controlled such as social conflict or unrest, labor disruption and natural disasters. Municipal instruments can be less liquid than other types of investments and there may be less publicly available information about the issuers of municipal instruments compared to other issuers. If the Internal Revenue Service or a state taxing authority determines that an issuer of a municipal instrument has not complied with applicable tax requirements, interest from the instrument could become taxable (including retroactively) and the instrument could decline significantly in price. Because many municipal instruments are issued to finance similar projects, especially those relating to education, health care, housing, utilities, and water and sewer, conditions in these industries can significantly affect the fund and the overall municipal market. In addition, changes in the financial condition of an individual municipal insurer can affect the overall municipal market.
Municipal instruments may be more susceptible to downgrades or defaults during economic downturns or similar periods of economic stress, which in turn could affect the market values and marketability of many or all municipal obligations of issuers in a state, U.S. territory, or possession. For example, the novel coronavirus (COVID-19) pandemic has significantly stressed the financial resources of many municipal issuers, which may impair a municipal issuer’s ability to meet its financial obligations when due and may adversely impact the value of its bonds, which could negatively impact the
performance of the fund. Factors contributing to the economic stress on municipal issuers may include an increase in expenses associated with combatting the COVID-19 pandemic and a decrease in revenues supporting the issuer’s bonds due to factors such as lower sales tax revenue as a result of decreased consumer spending, lower income tax revenue due to higher unemployment, and a decrease in the value of collateral backing revenue bonds due to closures and/or curtailment of services and/or changes in consumer behavior. In light of the uncertainty surrounding the magnitude, duration, reach, costs and effects of the COVID-19 pandemic, as well as actions that have been or could be taken by governmental authorities or other third parties, it is difficult to predict the level of financial stress and duration of such stress municipal issuers may experience.
Managed Distribution Plan Risk: The fund may not be able to maintain a monthly distribution at an annual fixed rate of up to 8.50% of the fund’s average monthly net asset value due to many factors, including but not limited to, changes in market returns, fluctuations in market interest rates, and other factors. If income from the fund’s investments is less than the amount needed to make a monthly distribution, portfolio investments may be sold at less than opportune times to fund the distribution. Distributions that are treated as tax return of capital will have the effect of reducing the fund’s assets and could increase the fund’s expense ratio. If a portion of the fund’s
13
Investment Objective, Principal Investment Strategies, Principal Investment Types and Principal Risks – continued
distributions represents returns of capital over extended periods, the fund’s assets may be reduced over time to levels where the fund is no longer viable and might be liquidated.
Leveraging Risk: If the fund utilizes investment leverage, there can be no assurance that such a leveraging strategy will be successful during any period in which it is employed. The use of leverage is a speculative investment technique that results in greater volatility in the fund’s net asset value. To the extent that investments are purchased with the proceeds from the borrowings from a bank, the issuance of preferred shares, or the creation of tender option bonds, the fund’s net asset value will increase or decrease at a greater rate than a comparable unleveraged fund. If the investment income or gains earned from the investments purchased with the proceeds from the borrowings from a bank, the issuance of preferred shares, or the creation of tender option bonds, fails to cover the expenses of leveraging, the fund’s net asset value is likely to decrease more quickly than if the fund weren’t leveraged. In addition, the fund’s distributions could be reduced. The fund is currently required under the 1940 Act to maintain asset coverage of 200% on outstanding preferred shares and 300% on outstanding indebtedness. The fund may be required to sell a portion of its investments at a time when it may be disadvantageous to do so in order to redeem preferred shares or to reduce outstanding indebtedness to comply with asset coverage or other restrictions including those imposed by the 1940 Act and the rating agencies that rate the preferred shares. The expenses of leveraging are paid by the holders of common shares. Borrowings from a bank or preferred shares may have a stated maturity. If this leverage is not extended prior to maturity or replaced with the same or a different form of leverage, distributions to common shareholders may be decreased.
Certain transactions and investment strategies can result in leverage. Because movements in a fund’s share price generally correlate over time with the fund’s net asset value, the market price of a leveraged fund will also tend to be more volatile than
that of a comparable unleveraged fund. The costs of an offering of preferred shares and/or borrowing program would be borne by shareholders.
Under the terms of any loan agreement or of a purchase agreement between the fund and the investor in the preferred shares, as the case may be, the fund may be required to, among other things, limit its ability to pay distributions in certain circumstances, incur additional debts, engage in certain transactions, and pledge some or all of its assets. Such agreements could limit the fund’s ability to pursue its investment strategies. The terms of any loan agreement or purchase agreement could be more or less restrictive than those described.
Under guidelines generally required by a rating agency providing a rating for any preferred shares, the fund may be required to, among other things, maintain certain asset coverage requirements, restrict certain investments and practices, and adopt certain redemption requirements relating to preferred shares. Such guidelines or the terms of a purchase agreement between a fund and the investor in the preferred shares could limit the fund’s ability to pursue its investment strategies. The guidelines imposed with respect to preferred shares by a rating agency or an investor in the preferred shares could be more or less restrictive than those described.
14
Investment Objective, Principal Investment Strategies, Principal Investment Types and Principal Risks – continued
Derivatives Risk: Derivatives can be highly volatile and involve risks in addition to, and potentially greater than, the risks of the underlying indicator(s). Gains or losses from derivatives can be substantially greater than the derivatives’ original cost and can sometimes be unlimited. Derivatives can involve leverage. Derivatives can be complex instruments and can involve analysis and processing that differs from that required for other investment types used by the fund. If the value of a derivative does not change as expected relative to the value of the market or other indicator to which the derivative is intended to provide exposure, the derivative may not have the effect intended. Derivatives can also reduce the opportunity for gains or result in losses by offsetting positive returns in other investments. Derivatives can be less liquid than other types of investments.
Anti-Takeover Provisions Risk: The fund’s declaration of trust includes provisions that could limit the ability of other persons or entities to acquire control of the fund, to convert the fund to an open-end fund, or to change the composition of the fund’s Board of Trustees. These provisions could reduce the opportunities for shareholders to sell their shares at a premium over the then-current market price.
Market Discount/Premium Risk: The market price of shares of the fund will be based on factors such as the supply and demand for shares in the market and general market, economic, industry, political or regulatory conditions. Whether shareholders will realize gains or losses upon the sale of shares of the fund will depend on the market price of shares at the time of the sale, not on the fund’s net asset value. The market price may be lower or higher than the fund’s net asset value. Shares of closed-end funds frequently trade at a discount to their net asset value.
Counterparty and Third Party Risk: Transactions involving a counterparty other than the issuer of the instrument, including clearing organizations, or a third party responsible for servicing the instrument or effecting the transaction, are subject to the credit risk of the counterparty or third party, and to the counterparty’s or third party’s
ability or willingness to perform in accordance with the terms of the transaction. If a
counterparty or third party fails to meet its contractual obligations, goes bankrupt, or otherwise experiences a business interruption, the fund could miss investment opportunities, lose value on its investments, or otherwise hold investments it would prefer to sell, resulting in losses for the fund.
Liquidity Risk: Certain investments and types of investments are subject to restrictions on resale, may trade in the over-the-counter market, or may not have an active trading market due to adverse market, economic, industry, political, regulatory, geopolitical, environmental, public health, and other conditions, including investors trying to sell large quantities of a particular investment or type of investment, or lack of market makers or other buyers for a particular investment or type of investment. At times, all or a significant portion of a market may not have an active trading market. Without an active trading market, it may be difficult to value, and it may not be possible to sell, these investments and the fund could miss other investment opportunities and hold investments it would prefer to sell, resulting in losses for the fund. In addition, the fund may have to sell certain of these investments at prices or times that are not advantageous in order to meet redemptions or other cash needs, which could result in
15
Investment Objective, Principal Investment Strategies, Principal Investment Types and Principal Risks – continued
dilution of remaining investors’ interests in the fund. The prices of illiquid securities may be more volatile than more liquid investments.
Defensive Investing Risk: When MFS invests defensively, different factors could affect the fund’s performance and the fund may not achieve its investment objective. In addition, the defensive strategy may not work as intended.
Frequent Trading Risk: Frequent trading increases transaction costs, which may reduce the Fund’s return. Frequent trading can also result in the realization of a higher percentage of short-term capital gains and a lower percentage of long-term capital gains as compared to a fund that trades less frequently. Because short-term capital gains are distributed as ordinary income, this would generally increase your tax liability unless you hold your shares through a tax-advantaged or tax-exempt vehicle.
16
PORTFOLIO MANAGERS’ PROFILES
| | | | | | |
| Portfolio Manager | | Primary Role | | Since | | Title and Five Year History |
| Geoffrey Schechter | | Lead Portfolio
Manager | | 2017 | | Investment Officer of MFS; employed in the investment management area of MFS since 1993. |
| | | |
| Alexander Mackey | | Investment Grade
Debt Instruments
Portfolio Manager | | 2017 | | Investment Officer of MFS; employed in the investment management area of MFS since 2001. |
17
DIVIDEND REINVESTMENT AND CASH PURCHASE PLAN
The fund offers a Dividend Reinvestment and Cash Purchase Plan (the “Plan”) that allows common shareholders to reinvest either all of the distributions paid by the fund or only the long-term capital gains. Generally, purchases are made at the market price unless that price exceeds the net asset value (the shares are trading at a premium). If the shares are trading at a premium, purchases will be made at a price of either the net asset value or 95% of the market price, whichever is greater. You can also buy shares on a quarterly basis in any amount $100 and over. The Plan Agent will purchase shares under the Cash Purchase Plan on the 15th of January, April, July, and October or shortly thereafter.
If shares are registered in your own name, new shareholders will automatically participate in the Plan, unless you have indicated that you do not wish to participate. If your shares are in the name of a brokerage firm, bank, or other nominee, you can ask the firm or nominee to participate in the Plan on your behalf. If the nominee does not offer the Plan, you may wish to request that your shares be re-registered in your own name so that you can participate. There is no service charge to reinvest distributions, nor are there brokerage charges for shares issued directly by the fund. However, when shares are bought on the New York Stock Exchange or otherwise on the open market, each participant pays a pro rata share of the transaction expenses, including commissions. The tax status of dividends and capital gain distributions does not change whether received in cash or reinvested in additional shares – the automatic reinvestment of distributions does not relieve you of any income tax that may be payable (or required to be withheld) on the distributions.
If your shares are held directly with the Plan Agent, you may withdraw from the Plan at any time by going to the Plan Agent’s website at www.computershare.com/investor, by calling 1-800-637-2304 any business day from 9 a.m. to 5 p.m. Eastern time or by writing to the Plan Agent at P.O. Box 505005, Louisville, KY 40233-5005. Please have available the name of the fund and your account number. For certain types of registrations, such as corporate accounts, instructions must be submitted in writing. Please call for additional details. When you withdraw from the Plan, you can receive the value of the reinvested shares in one of three ways: your full shares will be held in your account, the Plan Agent will sell your shares and send the proceeds to you, or you may transfer your full shares to your investment professional who can hold or sell them. Additionally, the Plan Agent will sell your fractional shares and send the proceeds to you.
If you have any questions or for further information or a copy of the Plan, contact the Plan Agent Computershare Trust Company, N.A. (the Transfer Agent for the fund) at 1-800-637-2304, at the Plan Agent’s website at www.computershare.com/investor, or by writing to the Plan Agent at P.O. Box 505005, Louisville, KY 40233-5005.
18
PORTFOLIO OF INVESTMENTS
10/31/20
The Portfolio of Investments is a complete list of all securities owned by your fund. It is categorized by broad-based asset classes.
| | | | | | | | |
| | |
| Issuer | | Shares/Par | | | Value ($) | |
| Bonds - 97.8% | | | | | | |
| Aerospace - 0.6% | | | | | | |
| Huntington Ingalls Industries, Inc., 3.844%, 5/01/2025 (n) | | $ | 2,486,000 | | | $ | 2,735,449 | |
| | |
| Apparel Manufacturers - 0.6% | | | | | | |
| NIKE, Inc., 2.75%, 3/27/2027 | | $ | 2,600,000 | | | $ | 2,863,265 | |
| | |
| Asset-Backed & Securitized - 2.0% | | | | | | |
| Chesapeake Funding II LLC, 2017-3A, “A2”, FLR, 0.488% (LIBOR - 1mo. + 0.34%), 8/15/2029 (n) | | $ | 620,701 | | | $ | 620,701 | |
| Commercial Mortgage Trust, 2017-COR2, “A3”, 3.51%, 9/10/2050 | | | 1,676,352 | | | | 1,867,181 | |
| Falcon Franchise Loan LLC, 20.604%, 1/05/2023 (i)(n) | | | 16,189 | | | | 848 | |
| GS Mortgage Securities Trust, 2010-C1, “A2”, 4.592%, 8/10/2043 (n) | | | 487,762 | | | | 487,661 | |
| JPMorgan Chase & Co., 4.717%, 2/15/2046 (n) | | | 1,151,526 | | | | 1,154,441 | |
| Loomis, Sayles & Co., CLO, 2015-2A, “A1R”, FLR, 1.175% (LIBOR - 3mo. + 0.9%), 4/15/2028 (n) | | | 940,374 | | | | 932,237 | |
| Shackleton CLO Ltd., 2015-8A, “A1R”, FLR, 1.138% (LIBOR - 3mo. + 1.51%), 10/20/2027 (n) | | | 1,800,772 | | | | 1,781,952 | |
| Tricon American Homes Trust, 2015-SFR1, “1A”, 2.589%, 11/17/2033 (n) | | | 1,219,473 | | | | 1,220,212 | |
| UBS Commercial Mortgage Trust, 2017-C1, “A4”, 3.544%, 11/15/2050 | | | 875,000 | | | | 982,479 | |
| | | | | | | | |
| | | | | | | $ | 9,047,712 | |
| Automotive - 2.7% | | | | | | |
| BMW U.S. Capital LLC, 3.1%, 4/12/2021 (n) | | $ | 1,770,000 | | | $ | 1,790,939 | |
| Ford Motor Credit Co. LLC, 5.085%, 1/07/2021 | | | 1,074,000 | | | | 1,095,158 | |
| Ford Motor Credit Co. LLC, 5.75%, 2/01/2021 | | | 1,250,000 | | | | 1,259,750 | |
| Hyundai Capital America, 2.375%, 2/10/2023 (n) | | | 577,000 | | | | 593,249 | |
| Hyundai Capital America, 5.875%, 4/07/2025 (n) | | | 2,094,000 | | | | 2,438,345 | |
| Lear Corp., 3.5%, 5/30/2030 | | | 3,000,000 | | | | 3,128,741 | |
| Volkswagen Group of America Co., 2.85%, 9/26/2024 (n) | | | 1,765,000 | | | | 1,872,296 | |
| | | | | | | | |
| | | | | | | $ | 12,178,478 | |
| Broadcasting - 0.7% | | | | | | |
| Walt Disney Co., 2.65%, 1/13/2031 | | $ | 3,150,000 | | | $ | 3,386,840 | |
| | |
| Brokerage & Asset Managers - 2.4% | | | | | | |
| E*TRADE Financial Corp., 2.95%, 8/24/2022 | | $ | 3,500,000 | | | $ | 3,644,211 | |
| Low Income Investment Fund, 3.386%, 7/01/2026 | | | 705,000 | | | | 750,986 | |
| Low Income Investment Fund, 3.711%, 7/01/2029 | | | 1,905,000 | | | | 2,080,531 | |
19
Portfolio of Investments – continued
| | | | | | | | |
| | |
| Issuer | | Shares/Par | | | Value ($) | |
| Bonds - continued | | | | | | |
| | |
| Brokerage & Asset Managers - continued | | | | | | |
| National Securities Clearing Corp., 1.5%, 4/23/2025 (n) | | $ | 1,117,000 | | | $ | 1,147,608 | |
| TD Ameritrade Holding Corp., 3.3%, 4/01/2027 | | | 3,150,000 | | | | 3,508,334 | |
| | | | | | | | |
| | | | | | | $ | 11,131,670 | |
| Building - 0.7% | | | | | | |
| Martin Marietta Materials, Inc., 3.5%, 12/15/2027 | | $ | 2,946,000 | | | $ | 3,297,021 | |
| | |
| Business Services - 1.1% | | | | | | |
| Equinix, Inc., 2.9%, 11/18/2026 | | $ | 3,000,000 | | | $ | 3,228,695 | |
| Tencent Holdings Ltd., 1.81%, 1/26/2026 (n) | | | 1,737,000 | | | | 1,761,141 | |
| | | | | | | | |
| | | | | | | $ | 4,989,836 | |
| Cable TV - 1.0% | | | | | | |
| Charter Communications Operating LLC/Charter Communications Operating Capital Corp., 4.908%, 7/23/2025 | | $ | 1,350,000 | | | $ | 1,555,327 | |
| Time Warner Cable, Inc., 4%, 9/01/2021 | | | 2,770,000 | | | | 2,824,302 | |
| | | | | | | | |
| | | | | | | $ | 4,379,629 | |
| Computer Software - 1.4% | | | | | | |
| Dell International LLC/EMC Corp., 5.85%, 7/15/2025 (n) | | $ | 399,000 | | | $ | 468,765 | |
| Dell International LLC/EMC Corp., 4.9%, 10/01/2026 (n) | | | 2,054,000 | | | | 2,338,997 | |
| Microsoft Corp., 3.125%, 11/03/2025 | | | 3,110,000 | | | | 3,456,253 | |
| | | | | | | | |
| | | | | | | $ | 6,264,015 | |
| Computer Software - Systems - 0.7% | | | | | | |
| Apple, Inc., 3.35%, 2/09/2027 | | $ | 2,700,000 | | | $ | 3,058,218 | |
| | |
| Conglomerates - 0.6% | | | | | | |
| Roper Technologies, Inc., 2.8%, 12/15/2021 | | $ | 651,000 | | | $ | 667,013 | |
| Westinghouse Air Brake Technologies Corp., 4.95%, 9/15/2028 | | | 1,760,000 | | | | 2,030,902 | |
| | | | | | | | |
| | | | | | | $ | 2,697,915 | |
| Consumer Products - 1.5% | | | | | | |
| Reckitt Benckiser Treasury Services PLC, 3.625%, 9/21/2023 (n) | | $ | 2,274,000 | | | $ | 2,447,231 | |
| Reckitt Benckiser Treasury Services PLC, 2.75%, 6/26/2024 (n) | | | 4,000,000 | | | | 4,277,082 | |
| | | | | | | | |
| | | | | | | $ | 6,724,313 | |
| Consumer Services - 2.4% | | | | | | |
| Alibaba Group Holding Ltd., 2.8%, 6/06/2023 | | $ | 1,605,000 | | | $ | 1,688,955 | |
| Booking Holdings, Inc., 3.55%, 3/15/2028 | | | 2,737,000 | | | | 3,016,320 | |
| Conservation Fund, 3.474%, 12/15/2029 | | | 563,000 | | | | 585,402 | |
| Mastercard, Inc., 3.3%, 3/26/2027 | | | 2,750,000 | | | | 3,112,895 | |
| Toll Road Investors Partnership II LP, Capital Appreciation, NATL, 0%, 2/15/2026 (n) | | | 480,000 | | | | 397,774 | |
20
Portfolio of Investments – continued
| | | | | | | | |
| | |
| Issuer | | Shares/Par | | | Value ($) | |
| Bonds - continued | | | | | | |
| Consumer Services - continued | | | | | | |
| Toll Road Investors Partnership II LP, Capital Appreciation, NATL, 0%, 2/15/2027 (n) | | $ | 1,525,000 | | | $ | 1,103,679 | |
| Toll Road Investors Partnership II LP, Capital Appreciation, NATL, 0%, 2/15/2029 (n) | | | 1,392,000 | | | | 903,797 | |
| Toll Road Investors Partnership II LP, Capital Appreciation, NATL, 0%, 2/15/2031 (n) | | | 480,000 | | | | 290,543 | |
| | | | | | | | |
| | | | | | | $ | 11,099,365 | |
| Electronics - 1.2% | | | | | | |
| Broadcom Corp./Broadcom Cayman Finance Ltd., 3.875%, 1/15/2027 | | $ | 3,900,000 | | | $ | 4,305,138 | |
| Microchip Technology, Inc., 3.922%, 6/01/2021 | | | 1,213,000 | | | | 1,235,948 | |
| | | | | | | | |
| | | | | | | $ | 5,541,086 | |
| Emerging Market Quasi-Sovereign - 0.2% | | | | | | |
| Sinopec Capital (2013) Ltd. (People’s Republic of China), 3.125%, 4/24/2023 (n) | | $ | 733,000 | | | $ | 766,718 | |
| | |
| Emerging Market Sovereign - 0.2% | | | | | | |
| Republic of Poland, 5%, 3/23/2022 | | $ | 772,000 | | | $ | 822,628 | |
| | |
| Energy - Integrated - 1.4% | | | | | | |
| BP Capital Markets PLC, 4.742%, 3/11/2021 | | $ | 1,810,000 | | | $ | 1,838,231 | |
| Eni S.p.A., 4%, 9/12/2023 (n) | | | 1,327,000 | | | | 1,434,770 | |
| Exxon Mobil Corp., 3.294%, 3/19/2027 | | | 3,000,000 | | | | 3,341,726 | |
| | | | | | | | |
| | | | | | | $ | 6,614,727 | |
| Financial Institutions - 1.7% | | | | | | |
| AerCap Ireland Capital DAC, 4.875%, 1/16/2024 | | $ | 1,719,000 | | | $ | 1,798,222 | |
| AerCap Ireland Capital DAC, 6.5%, 7/15/2025 | | | 2,326,000 | | | | 2,562,672 | |
| Avolon Holdings Funding Ltd., 3.95%, 7/01/2024 (n) | | | 3,123,000 | | | | 3,062,133 | |
| Avolon Holdings Funding Ltd., 3.25%, 2/15/2027 (n) | | | 583,000 | | | | 532,157 | |
| | | | | | | | |
| | | | | | | $ | 7,955,184 | |
| Food & Beverages - 0.8% | | | | | | |
| Constellation Brands, Inc., 4.4%, 11/15/2025 | | $ | 3,306,000 | | | $ | 3,821,771 | |
| | |
| Gaming & Lodging - 1.1% | | | | | | |
| GLP Capital LP/GLP Financing II, Inc., 4%, 1/15/2031 | | $ | 3,055,000 | | | $ | 3,194,186 | |
| Marriott International, Inc., 2.3%, 1/15/2022 | | | 1,686,000 | | | | 1,706,208 | |
| Marriott International, Inc., 5.75%, 5/01/2025 | | | 271,000 | | | | 301,315 | |
| | | | | | | | |
| | | | | | | $ | 5,201,709 | |
21
Portfolio of Investments – continued
| | | | | | | | |
| | |
| Issuer | | Shares/Par | | | Value ($) | |
| Bonds - continued | | | | | | |
| Industrial - 0.3% | | | | | | |
| Howard University, Washington D.C., AGM, 2.757%, 10/01/2027 | | $ | 1,250,000 | | | $ | 1,276,594 | |
| | |
| Insurance - 0.1% | | | | | | |
| AIA Group Ltd., 3.375%, 4/07/2030 (n) | | $ | 563,000 | | | $ | 624,573 | |
| | |
| Insurance - Property & Casualty - 1.4% | | | | | | |
| Allied World Assurance Co. Holdings Ltd., 4.35%, 10/29/2025 | | $ | 3,110,000 | | | $ | 3,339,423 | |
| Fairfax Financial Holdings Ltd., 4.85%, 4/17/2028 | | | 2,971,000 | | | | 3,232,328 | |
| | | | | | | | |
| | | | | | | $ | 6,571,751 | |
| International Market Quasi-Sovereign - 0.6% | | | | | | |
| Dexia Credit Local S.A. (Kingdom of Belgium), 1.875%, 9/15/2021 (n) | | $ | 2,510,000 | | | $ | 2,541,882 | |
| | |
| Internet - 0.3% | | | | | | |
| Baidu, Inc., 3.875%, 9/29/2023 | | $ | 1,361,000 | | | $ | 1,461,593 | |
| | |
| Machinery & Tools - 1.0% | | | | | | |
| CNH Industrial Capital LLC, 4.2%, 1/15/2024 | | $ | 472,000 | | | $ | 510,895 | |
| CNH Industrial Capital LLC, 3.85%, 11/15/2027 | | | 3,066,000 | | | | 3,328,092 | |
| Deere & Co., 2.75%, 4/15/2025 | | | 813,000 | | | | 884,790 | |
| | | | | | | | |
| | | | | | | $ | 4,723,777 | |
| Major Banks - 12.6% | | | | | | |
| Bank of America Corp., 3.124% to 1/20/2022, FLR (LIBOR - 3mo. + 1.16%) to 1/20/2023 | | $ | 5,400,000 | | | $ | 5,563,075 | |
| Bank of America Corp., 4.125%, 1/22/2024 | | | 2,876,000 | | | | 3,179,176 | |
| Bank of New York Mellon Corp., 3.5%, 4/28/2023 | | | 3,446,000 | | | | 3,712,550 | |
| Barclays PLC, 4.61%, 2/15/2023 | | | 3,857,000 | | | | 4,039,941 | |
| Credit Suisse Group AG, 3.574%, 1/09/2023 (n) | | | 1,500,000 | | | | 1,549,593 | |
| Credit Suisse Group AG, 6.5%, 8/08/2023 (n) | | | 915,000 | | | | 1,030,519 | |
| Credit Suisse Group AG, 3.869%, 1/12/2029 (n) | | | 2,250,000 | | | | 2,504,231 | |
| Goldman Sachs Group, Inc., 5.75%, 1/24/2022 | | | 1,924,000 | | | | 2,047,895 | |
| Goldman Sachs Group, Inc., 3%, 4/26/2022 | | | 1,720,000 | | | | 1,741,190 | |
| Goldman Sachs Group, Inc., 2.908% to 6/05/2022, FLR (LIBOR - 3mo. + 1.053%) to 6/05/2023 | | | 1,750,000 | | | | 1,813,195 | |
| Goldman Sachs Group, Inc., 3.5%, 4/01/2025 | | | 1,500,000 | | | | 1,652,768 | |
| HSBC Holdings PLC, 3.262% to 3/13/2022, FLR (LIBOR - 3mo. + 1.055%) to 3/13/2023 | | | 4,000,000 | | | | 4,134,907 | |
| HSBC Holdings PLC, 3.033% to 11/22/2022, FLR (LIBOR - 3mo. + 0.923%) to 11/22/2023 | | | 1,500,000 | | | | 1,570,010 | |
| JPMorgan Chase & Co., 3.125%, 1/23/2025 | | | 3,500,000 | | | | 3,817,706 | |
| JPMorgan Chase & Co., 2.005% to 3/13/2025, FLR (SOFR + 1.585%) to 3/13/2026 | | | 2,500,000 | | | | 2,591,522 | |
22
Portfolio of Investments – continued
| | | | | | | | |
| | |
| Issuer | | Shares/Par | | | Value ($) | |
| Bonds - continued | | | | | | |
| Major Banks - continued | | | | | | |
| Mitsubishi UFJ Financial Group, Inc., 2.95%, 3/01/2021 | | $ | 382,000 | | | $ | 385,345 | |
| Morgan Stanley, 3.875%, 1/27/2026 | | | 5,400,000 | | | | 6,137,792 | |
| NatWest Markets PLC, 3.625%, 9/29/2022 (n) | | | 800,000 | | | | 841,993 | |
| State Street Corp., 2.901%, 3/30/2026 | | | 407,000 | | | | 441,652 | |
| Sumitomo Mitsui Financial Group, Inc., 3.102%, 1/17/2023 | | | 1,145,000 | | | | 1,208,942 | |
| UBS Group AG, 1.008% to 7/30/2023, FLR (CMT - 1yr. + 0.83%) to 7/30/2024 (n) | | | 770,000 | | | | 772,871 | |
| UBS Group Funding (Switzerland) AG, 4.253%, 3/23/2028 (n) | | | 2,449,000 | | | | 2,832,114 | |
| UBS Group Funding Ltd., 3%, 4/15/2021 (n) | | | 2,505,000 | | | | 2,535,183 | |
| UniCredito Italiano S.p.A., 6.572%, 1/14/2022 (n) | | | 1,500,000 | | | | 1,587,106 | |
| | | | | | | | |
| | | | | | | $ | 57,691,276 | |
| Medical & Health Technology & Services - 0.8% | | | | | | |
| Cigna Corp., FLR, 0.896% (LIBOR - 3mo. + 0.65%), 9/17/2021 | | $ | 2,000,000 | | | $ | 2,000,394 | |
| ProMedica Toledo Hospital, “B”, AGM, 5.75%, 11/15/2038 | | | 1,250,000 | | | | 1,447,087 | |
| | | | | | | | |
| | | | | | | $ | 3,447,481 | |
| Medical Equipment - 0.4% | | | | | | |
| Abbott Laboratories, 3.4%, 11/30/2023 | | $ | 1,600,000 | | | $ | 1,735,302 | |
| | |
| Metals & Mining - 1.4% | | | | | | |
| Anglo American Capital PLC, 5.375%, 4/01/2025 (n) | | $ | 1,250,000 | | | $ | 1,440,756 | |
| Glencore Funding LLC, 4.125%, 5/30/2023 (n) | | | 1,518,000 | | | | 1,624,269 | |
| Glencore Funding LLC, 3.875%, 10/27/2027 (n) | | | 1,887,000 | | | | 2,052,875 | |
| Newmont Corp., 2.25%, 10/01/2030 | | | 1,150,000 | | | | 1,186,169 | |
| | | | | | | | |
| | | | | | | $ | 6,304,069 | |
| Midstream - 1.8% | | | | | | |
| Enbridge, Inc., 3.125%, 11/15/2029 | | $ | 1,506,000 | | | $ | 1,583,709 | |
| MPLX LP, 3.5%, 12/01/2022 | | | 1,584,000 | | | | 1,657,145 | |
| MPLX LP, 4%, 3/15/2028 | | | 3,395,000 | | | | 3,683,954 | |
| Plains All American Pipeline LP, 3.8%, 9/15/2030 | | | 1,510,000 | | | | 1,459,656 | |
| | | | | | | | |
| | | | | | | $ | 8,384,464 | |
| Mortgage-Backed - 0.9% | | | | | | |
| Fannie Mae, 6.5%, 11/01/2031 | | $ | 549,450 | | | $ | 642,613 | |
| Freddie Mac, 6%, 5/01/2021 - 8/01/2034 | | | 9,113 | | | | 10,440 | |
| Freddie Mac, 3.064%, 8/25/2024 | | | 1,457,127 | | | | 1,574,395 | |
| Freddie Mac, 3.187%, 9/25/2027 | | | 550,000 | | | | 625,295 | |
| Freddie Mac, 3.92%, 9/25/2028 | | | 100,000 | | | | 119,440 | |
| Freddie Mac, 4.06%, 10/25/2028 | | | 582,000 | | | | 703,539 | |
| Ginnie Mae, 6%, 6/15/2033 - 10/15/2036 | | | 374,765 | | | | 451,535 | |
| Ginnie Mae, 5.87%, 4/20/2058 | | | 25,557 | | | | 29,774 | |
| | | | | | | | |
| | | | | | | $ | 4,157,031 | |
23
Portfolio of Investments – continued
| | | | | | | | |
| | |
| Issuer | | Shares/Par | | | Value ($) | |
| Bonds - continued | | | | | | |
| Municipals - 4.9% | | | | | | |
| Bridgeview, IL, Stadium and Redevelopment Projects, AAC, 5.06%, 12/01/2025 | | $ | 4,000,000 | | | $ | 3,952,760 | |
| California Department of Water Resources Rev. (Central Valley Project Water System), “BC”, 1.409%, 12/01/2029 | | | 595,000 | | | | 586,968 | |
| Florida State Board of Administration Finance Corp. Rev., “A”, 1.705%, 7/01/2027 | | | 1,709,000 | | | | 1,715,887 | |
| Gainesville, TX, Hospital District, “A”, 5.711%, 8/15/2033 | | | 2,330,000 | | | | 2,589,282 | |
| Michigan Finance Authority Hospital Refunding Rev. (Trinity Health Credit Group), “T”, 3.084%, 12/01/2034 | | | 2,500,000 | | | | 2,669,750 | |
| Michigan Finance Authority Tobacco Settlement Asset-Backed Rev. (2006 Sold Tobacco Receipts), “A-1”, 2.326%, 6/01/2030 | | | 425,000 | | | | 425,327 | |
| New Jersey Economic Development Authority State Pension Funding Rev., Capital Appreciation, “B”, AGM, 0%, 2/15/2023 | | | 3,704,000 | | | | 3,610,141 | |
| Puerto Rico Electric Power Authority Rev., “RR”, NATL, 5%, 7/01/2022 | | | 1,675,000 | | | | 1,682,688 | |
| Syracuse, NY, Industrial Development Agency PILOT Rev. (Carousel Center Project), “B”, 5%, 1/01/2036 | | | 3,635,000 | | | | 3,018,104 | |
| University of California, General Taxable Rev., “BG”, 1.614%, 5/15/2030 | | | 2,010,000 | | | | 1,967,308 | |
| | | | | | | | |
| | | | | | | $ | 22,218,215 | |
| Oils - 1.0% | | | | | | |
| Marathon Petroleum Corp., 3.625%, 9/15/2024 | | $ | 1,003,000 | | | $ | 1,064,327 | |
| Valero Energy Corp., 2.85%, 4/15/2025 | | | 1,052,000 | | | | 1,077,670 | |
| Valero Energy Corp., 3.4%, 9/15/2026 | | | 2,353,000 | | | | 2,479,076 | |
| | | | | | | | |
| | | | | | | $ | 4,621,073 | |
| Other Banks & Diversified Financials - 0.8% | | | | | | |
| BBVA USA, 2.875%, 6/29/2022 | | $ | 1,826,000 | | | $ | 1,889,109 | |
| SunTrust Banks, Inc., 2.7%, 1/27/2022 | | | 1,803,000 | | | | 1,851,982 | |
| | | | | | | | |
| | | | | | | $ | 3,741,091 | |
| Personal Computers & Peripherals - 0.2% | | | | | | |
| Equifax, Inc., 2.6%, 12/15/2025 | | $ | 832,000 | | | $ | 892,771 | |
| | |
| Pharmaceuticals - 1.3% | | | | | | |
| AbbVie, Inc., 3.45%, 3/15/2022 (n) | | $ | 3,000,000 | | | $ | 3,105,809 | |
| Bristol-Myers Squibb Co., 2.75%, 2/15/2023 (n) | | | 2,628,000 | | | | 2,762,194 | |
| | | | | | | | |
| | | | | | | $ | 5,868,003 | |
| Real Estate - Retail - 1.9% | | | | | | |
| Brixmor Operating Partnership LP, REIT, 4.05%, 7/01/2030 | | $ | 2,349,000 | | | $ | 2,538,810 | |
| Regency Centers Corp., 3.7%, 6/15/2030 | | | 3,000,000 | | | | 3,276,634 | |
| VEREIT Operating Partnership LP, REIT, 3.4%, 1/15/2028 | | | 2,875,000 | | | | 3,016,861 | |
| | | | | | | | |
| | | | | | | $ | 8,832,305 | |
24
Portfolio of Investments – continued
| | | | | | | | |
| | |
| Issuer | | Shares/Par | | | Value ($) | |
| Bonds - continued | | | | | | |
| Retailers - 1.9% | | | | | | |
| Alimentation Couche-Tard, Inc., 2.7%, 7/26/2022 (n) | | $ | 2,700,000 | | | $ | 2,787,289 | |
| Alimentation Couche-Tard, Inc., 2.95%, 1/25/2030 (n) | | | 2,755,000 | | | | 2,935,274 | |
| Home Depot, Inc., 2.5%, 4/15/2027 | | | 2,750,000 | | | | 2,977,941 | |
| | | | | | | | |
| | | | | | | $ | 8,700,504 | |
| Specialty Stores - 0.6% | | | | | | |
| Advance Auto Parts, 1.75%, 10/01/2027 | | $ | 3,000,000 | | | $ | 2,978,145 | |
| | |
| Supranational - 0.7% | | | | | | |
| Corporacion Andina de Fomento, 4.375%, 6/15/2022 | | $ | 2,950,000 | | | $ | 3,118,799 | |
| | |
| Telecommunications - Wireless - 2.0% | | | | | | |
| American Tower Corp., REIT, 3.55%, 7/15/2027 | | $ | 4,000,000 | | | $ | 4,455,148 | |
| Crown Castle International Corp., 3.65%, 9/01/2027 | | | 947,000 | | | | 1,053,329 | |
| Crown Castle International Corp., 2.25%, 1/15/2031 | | | 1,000,000 | | | | 1,004,989 | |
| T-Mobile USA, Inc., 3.875%, 4/15/2030 (n) | | | 2,500,000 | | | | 2,808,400 | |
| | | | | | | | |
| | | | | | | $ | 9,321,866 | |
| Tobacco - 0.5% | | | | | | |
| B.A.T. Capital Corp., 4.7%, 4/02/2027 | | $ | 2,000,000 | | | $ | 2,290,075 | |
| | |
| U.S. Government Agencies and Equivalents - 0.1% | | | | | | |
| Small Business Administration, 6.35%, 4/01/2021 | | $ | 7,600 | | | $ | 7,688 | |
| Small Business Administration, 6.34%, 5/01/2021 | | | 18,493 | | | | 18,638 | |
| Small Business Administration, 6.44%, 6/01/2021 | | | 13,903 | | | | 14,066 | |
| Small Business Administration, 6.625%, 7/01/2021 | | | 18,827 | | | | 19,055 | |
| Small Business Administration, 5.34%, 11/01/2021 | | | 71,915 | | | | 72,937 | |
| Small Business Administration, 4.93%, 1/01/2024 | | | 55,848 | | | | 58,341 | |
| Small Business Administration, 5.36%, 11/01/2025 | | | 132,036 | | | | 141,422 | |
| Small Business Administration, 5.39%, 12/01/2025 | | | 84,550 | | | | 90,557 | |
| | | | | | | | |
| | | | | | | $ | 422,704 | |
| U.S. Treasury Obligations - 31.2% | | | | | | |
| U.S. Treasury Notes, 1.75%, 11/30/2021 | | $ | 10,000,000 | | | $ | 10,172,656 | |
| U.S. Treasury Notes, 2.625%, 12/15/2021 | | | 12,500,000 | | | | 12,845,703 | |
| U.S. Treasury Notes, 1.75%, 2/28/2022 | | | 10,420,000 | | | | 10,641,832 | |
| U.S. Treasury Notes, 1.75%, 5/15/2022 | | | 3,250,000 | | | | 3,329,727 | |
| U.S. Treasury Notes, 2.125%, 12/31/2022 | | | 14,635,000 | | | | 15,254,701 | |
| U.S. Treasury Notes, 2.5%, 8/15/2023 | | | 12,710,000 | | | | 13,524,731 | |
| U.S. Treasury Notes, 2.75%, 2/15/2024 | | | 8,385,000 | | | | 9,079,055 | |
| U.S. Treasury Notes, 2.375%, 8/15/2024 | | | 9,230,000 | | | | 9,962,271 | |
| U.S. Treasury Notes, 2%, 2/15/2025 | | | 9,900,000 | | | | 10,608,469 | |
| U.S. Treasury Notes, 2%, 8/15/2025 | | | 5,225,000 | | | | 5,628,509 | |
| U.S. Treasury Notes, 2.25%, 11/15/2025 | | | 5,086,000 | | | | 5,557,250 | |
25
Portfolio of Investments – continued
| | | | | | | | |
| | |
| Issuer | | Shares/Par | | | Value ($) | |
| Bonds - continued | | | | | | |
| U.S. Treasury Obligations - continued | | | | | | |
| U.S. Treasury Notes, 2%, 11/15/2026 | | $ | 6,254,000 | | | $ | 6,803,668 | |
| U.S. Treasury Notes, 1.625%, 11/30/2026 | | | 7,750,000 | | | | 8,257,988 | |
| U.S. Treasury Notes, 2.375%, 5/15/2027 | | | 4,075,000 | | | | 4,545,694 | |
| U.S. Treasury Notes, 0.5%, 6/30/2027 | | | 6,500,000 | | | | 6,459,121 | |
| U.S. Treasury Notes, 1.75%, 11/15/2029 | | | 4,500,000 | | | | 4,877,226 | |
| U.S. Treasury Notes, 1.5%, 2/15/2030 | | | 5,043,500 | | | | 5,353,990 | |
| | | | | | | | |
| | | | | | | $ | 142,902,591 | |
| Utilities - Electric Power - 4.1% | | | | | | |
| Emera U.S. Finance LP, 2.7%, 6/15/2021 | | $ | 492,000 | | | $ | 497,828 | |
| Enel Americas S.A., 4%, 10/25/2026 | | | 252,000 | | | | 274,869 | |
| Enel Finance International N.V., 2.75%, 4/06/2023 (n) | | | 3,500,000 | | | | 3,656,140 | |
| FirstEnergy Corp., 3.9%, 7/15/2027 | | | 2,827,000 | | | | 3,019,352 | |
| ITC Holdings Corp., 2.95%, 5/14/2030 (n) | | | 3,000,000 | | | | 3,213,987 | |
| Liberty Utilities Finance Co., 2.05%, 9/15/2030 (n) | | | 3,000,000 | | | | 2,943,537 | |
| Oncor Electric Delivery Co., 4.1%, 6/01/2022 | | | 2,206,000 | | | | 2,310,419 | |
| Pacific Gas & Electric Co., 2.1%, 8/01/2027 | | | 952,000 | | | | 919,132 | |
| PPL WEM Holdings PLC, 5.375%, 5/01/2021 (n) | | | 546,000 | | | | 552,055 | |
| Transelec S.A., 4.625%, 7/26/2023 (n) | | | 927,000 | | | | 998,852 | |
| Transelec S.A., 4.25%, 1/14/2025 (n) | | | 228,000 | | | | 247,380 | |
| | | | | | | | |
| | | | | | | $ | 18,633,551 | |
| Total Bonds (Identified Cost, $423,599,396) | | | | | | $ | 448,039,035 | |
| | |
| Investment Companies (h) - 1.5% | | | | | | |
| Money Market Funds - 1.5% | | | | | | |
MFS Institutional Money Market Portfolio, 0.1% (v)
(Identified Cost, $6,790,424) | | | 6,790,424 | | | $ | 6,790,424 | |
| | |
| Other Assets, Less Liabilities - 0.7% | | | | | 3,014,885 | |
| Net Assets - 100.0% | | | | | | $ | 457,844,344 | |
| (h) | An affiliated issuer, which may be considered one in which the fund owns 5% or more of the outstanding voting securities, or a company which is under common control. At period end, the aggregate values of the fund’s investments in affiliated issuers and in unaffiliated issuers were $6,790,424 and $448,039,035, respectively. |
| (i) | Interest only security for which the fund receives interest on notional principal (Par amount). Par amount shown is the notional principal and does not reflect the cost of the security. |
| (n) | Securities exempt from registration under Rule 144A of the Securities Act of 1933. These securities may be sold in the ordinary course of business in transactions exempt from registration, normally to qualified institutional buyers. At period end, the aggregate value of these securities was $84,509,607, representing 18.5% of net assets. |
| (v) | Affiliated issuer that is available only to investment companies managed by MFS. The rate quoted for the MFS Institutional Money Market Portfolio is the annualized seven-day yield of the fund at period end. |
26
Portfolio of Investments – continued
The following abbreviations are used in this report and are defined:
| AAC | | Ambac Assurance Corp. |
| AGM | | Assured Guaranty Municipal |
| CLO | | Collateralized Loan Obligation |
| CMT | | Constant Maturity Treasury |
| FLR | | Floating Rate. Interest rate resets periodically based on the parenthetically disclosed reference rate plus a spread (if any). The period-end rate reported may not be the current rate. All reference rates are USD unless otherwise noted. |
| LIBOR | | London Interbank Offered Rate |
| NATL | | National Public Finance Guarantee Corp. |
| REIT | | Real Estate Investment Trust |
| SOFR | | Secured Overnight Financing Rate |
See Notes to Financial Statements
27
Financial Statements
STATEMENT OF ASSETS AND LIABILITIES
At 10/31/20
This statement represents your fund’s balance sheet, which details the assets and liabilities comprising the total value of the fund.
| | | | |
| Assets | | | | |
Investments in unaffiliated issuers, at value (identified cost, $423,599,396) | | | $448,039,035 | |
Investments in affiliated issuers, at value (identified cost, $6,790,424) | | | 6,790,424 | |
Receivables for | | | | |
Interest | | | 3,323,604 | |
Other assets | | | 18,960 | |
Total assets | | | $458,172,023 | |
| |
| Liabilities | | | | |
Payables for | | | | |
Distributions | | | $122,722 | |
Payable to affiliates | | | | |
Investment adviser | | | 18,124 | |
Administrative services fee | | | 569 | |
Transfer agent and dividend disbursing costs | | | 2,494 | |
Payable for independent Trustees’ compensation | | | 16 | |
Accrued expenses and other liabilities | | | 183,754 | |
Total liabilities | | | $327,679 | |
Net assets | | | $457,844,344 | |
| |
| Net assets consist of | | | | |
Paid-in capital | | | $434,198,009 | |
Total distributable earnings (loss) | | | 23,646,335 | |
Net assets | | | $457,844,344 | |
Shares of beneficial interest outstanding | | | 115,930,528 | |
Net asset value per share (net assets of $457,844,344 / 115,930,528 shares of beneficial interest outstanding) | | | $3.95 | |
See Notes to Financial Statements
28
Financial Statements
STATEMENT OF OPERATIONS
Year ended 10/31/20
This statement describes how much your fund earned in investment income and accrued in
expenses. It also describes any gains and/or losses generated by fund operations.
| | | | |
| Net investment income (loss) | | | | |
Income | | | | |
Interest | | | $13,754,469 | |
Dividends from affiliated issuers | | | 30,017 | |
Other | | | 6,231 | |
Total investment income | | | $13,790,717 | |
Expenses | | | | |
Management fee | | | $2,291,530 | |
Transfer agent and dividend disbursing costs | | | 82,536 | |
Administrative services fee | | | 72,351 | |
Independent Trustees’ compensation | | | 102,458 | |
Stock exchange fee | | | 113,908 | |
Custodian fee | | | 28,878 | |
Shareholder communications | | | 143,914 | |
Audit and tax fees | | | 84,465 | |
Legal fees | | | 13,739 | |
Miscellaneous | | | 46,483 | |
Total expenses | | | $2,980,262 | |
Net investment income (loss) | | | $10,810,455 | |
| |
| Realized and unrealized gain (loss) | | | | |
Realized gain (loss) (identified cost basis) | | | | |
Unaffiliated issuers | | | $11,615,689 | |
Affiliated issuers | | | 1,586 | |
Net realized gain (loss) | | | $11,617,275 | |
Change in unrealized appreciation or depreciation | | | | |
Unaffiliated issuers | | | $5,979,660 | |
Affiliated issuers | | | (336 | ) |
Net unrealized gain (loss) | | | $5,979,324 | |
Net realized and unrealized gain (loss) | | | $17,596,599 | |
Change in net assets from operations | | | $28,407,054 | |
See Notes to Financial Statements
29
Financial Statements
STATEMENTS OF CHANGES IN NET ASSETS
These statements describe the increases and/or decreases in net assets resulting from operations, any distributions, and any shareholder transactions.
| | | | | | | | |
| | | Year ended | |
| | | 10/31/20 | | | 10/31/19 | |
| Change in net assets | | | | | | |
| | |
| From operations | | | | | | | | |
Net investment income (loss) | | | $10,810,455 | | | | $12,212,459 | |
Net realized gain (loss) | | | 11,617,275 | | | | 104,762 | |
Net unrealized gain (loss) | | | 5,979,324 | | | | 28,519,123 | |
Change in net assets from operations | | | $28,407,054 | | | | $40,836,344 | |
Distributions to shareholders | | | $(17,493,874 | ) | | | $(12,403,691 | ) |
Tax return of capital distributions to shareholders | | | $(22,080,450 | ) | | | $(27,810,480 | ) |
Change in net assets from fund share transactions | | | $(3,410,552 | ) | | | $(1,777,421 | ) |
Total change in net assets | | | $(14,577,822 | ) | | | $(1,155,248 | ) |
| | |
| Net assets | | | | | | | | |
At beginning of period | | | 472,422,166 | | | | 473,577,414 | |
At end of period | | | $457,844,344 | | | | $472,422,166 | |
See Notes to Financial Statements
30
Financial Statements
FINANCIAL HIGHLIGHTS
The financial highlights table is intended to help you understand the fund’s financial performance for the past 5 years. Certain information reflects financial results for a single fund share. The total returns in the table represent the rate that an investor would have earned (or lost) on an investment in the fund share class (assuming reinvestment of all distributions) held for the entire period.
| | | | | | | | | | | | | | | | | | | | |
| | | Year ended | |
| | | | | |
| | | 10/31/20 | | | 10/31/19 | | | 10/31/18 | | | 10/31/17 | | | 10/31/16 | |
Net asset value, beginning of period | | | $4.04 | | | | $4.03 | | | | $4.46 | | | | $4.80 | | | | $5.05 | |
| | | | |
| Income (loss) from investment operations | | | | | | | | | | | | | | | | | |
Net investment income (loss) (d) | | | $0.09 | | | | $0.10 | | | | $0.10 | | | | $0.10 | (c) | | | $0.11 | |
Net realized and unrealized gain (loss) | | | 0.16 | | | | 0.25 | | | | (0.17 | ) | | | (0.05 | ) | | | 0.06 | |
Total from investment operations | | | $0.25 | | | | $0.35 | | | | $(0.07 | ) | | | $0.05 | | | | $0.17 | |
| | | | |
| Less distributions declared to shareholders | | | | | | | | | | | | | | | | | |
From net investment income | | | $(0.11 | ) | | | $(0.10 | ) | | | $(0.10 | ) | | | $(0.02 | ) | | | $(0.08 | ) |
From net realized gain | | | (0.04 | ) | | | — | | | | — | | | | — | | | | — | |
From tax return of capital | | | (0.19 | ) | | | (0.24 | ) | | | (0.26 | ) | | | (0.37 | ) | | | (0.34 | ) |
Total distributions declared to shareholders | | | $(0.34 | ) | | | $(0.34 | ) | | | $(0.36 | ) | | | $(0.39 | ) | | | $(0.42 | ) |
Net increase from repurchase of capital shares | | | $0.00 | (w) | | | $0.00 | (w) | | | $0.00 | (w) | | | $— | | | | $0.00 | (w) |
Net asset value, end of period (x) | | | $3.95 | | | | $4.04 | | | | $4.03 | | | | $4.46 | | | | $4.80 | |
Market value, end of period | | | $3.73 | | | | $3.77 | | | | $3.69 | | | | $4.24 | | | | $4.45 | |
Total return at market value (%) | | | 8.24 | | | | 11.87 | | | | (4.56 | ) | | | 4.30 | | | | 6.93 | |
Total return at net asset value (%) (j)(r)(s)(x) | | | 6.96 | | | | 9.77 | | | | (0.90 | ) | | | 1.72 | (c) | | | 4.15 | |
| | | | |
Ratios (%) (to average net assets)
and Supplemental data: | | | | | | | | | | | | | | | | | |
Expenses (f) | | | 0.64 | | | | 0.65 | | | | 0.64 | | | | 0.61 | (c) | | | 0.64 | |
Net investment income (loss) | | | 2.33 | | | | 2.58 | | | | 2.33 | | | | 2.07 | (c) | | | 2.16 | |
Portfolio turnover | | | 43 | | | | 18 | | | | 50 | | | | 65 | | | | 19 | |
Net assets at end of period (000 omitted) | | | $457,844 | | | | $472,422 | | | | $473,577 | | | | $524,864 | | | | $565,316 | |
| (c) | Amount reflects a one-time reimbursement of expenses by the custodian (or former custodian) without which net investment income and performance would be lower and expenses would be higher. |
| (d) | Per share data is based on average shares outstanding. |
| (f) | Ratios do not reflect reductions from fees paid indirectly, if applicable. |
| (j) | Total return at net asset value is calculated using the net asset value of the fund, not the publicly traded price and therefore may be different than the total return at market value. |
| (r) | Certain expenses have been reduced without which performance would have been lower. |
| (s) | From time to time the fund may receive proceeds from litigation settlements, without which performance would be lower. |
| (w) | Per share amount was less than $0.01. |
| (x) | The net asset values and total returns at net asset value have been calculated on net assets which include adjustments made in accordance with U.S. generally accepted accounting principles required at period end for financial reporting purposes. |
See Notes to Financial Statements
31
NOTES TO FINANCIAL STATEMENTS
(1) Business and Organization
MFS Intermediate Income Trust (the fund) is organized as a Massachusetts business trust and is registered under the Investment Company Act of 1940, as amended, as a diversified closed-end management investment company.
The fund is an investment company and accordingly follows the investment company accounting and reporting guidance of the Financial Accounting Standards Board (FASB) Accounting Standards Codification Topic 946 Financial Services – Investment Companies.
(2) Significant Accounting Policies
General – The preparation of financial statements in conformity with U.S. generally accepted accounting principles requires management to make estimates and assumptions that affect the reported amounts of assets and liabilities, and disclosure of contingent assets and liabilities at the date of the financial statements and the reported amounts of increases and decreases in net assets from operations during the reporting period. Actual results could differ from those estimates. In the preparation of these financial statements, management has evaluated subsequent events occurring after the date of the fund’s Statement of Assets and Liabilities through the date that the financial statements were issued. The fund invests in foreign securities. Investments in foreign securities are vulnerable to the effects of changes in the relative values of the local currency and the U.S. dollar and to the effects of changes in each country’s market, economic, industrial, political, regulatory, geopolitical, environmental, public health, and other conditions.
In March 2020, the FASB issued Accounting Standards Update 2020-04, Reference Rate Reform (Topic 848) – Facilitation of the Effects of Reference Rate Reform on Financial Reporting (“ASU 2020-04”), which provides optional, temporary relief with respect to the financial reporting of contracts subject to certain types of modifications due to the planned discontinuation of the London Interbank Offered Rate (LIBOR) and other IBOR-based reference rates as of the end of 2021. The temporary relief provided by ASU 2020-04 is effective for certain reference rate-related contract modifications that occur during the period from March 12, 2020 through December 31, 2022. Management is evaluating the impact of ASU 2020-04 on the fund’s investments, derivatives, debt and other contracts that will undergo reference rate-related modifications as a result of the reference rate reform.
In March 2017, the FASB issued Accounting Standards Update 2017-08, Receivables – Nonrefundable Fees and Other Costs (Subtopic 310-20) – Premium Amortization on Purchased Callable Debt Securities (“ASU 2017-08”). For callable debt securities purchased at a premium that have explicit, non-contingent call features and that are callable at fixed prices on preset dates, ASU 2017-08 requires the premium to be amortized to the earliest call date. The fund adopted ASU 2017-08 as of the beginning of the reporting period on a modified retrospective basis. The adoption resulted in a change in accounting principle, since the fund had historically amortized such premiums to maturity for U.S. GAAP. As a result of the adoption, the fund recognized a cumulative effect adjustment that decreased the beginning of period cost of
32
Notes to Financial Statements – continued
investments and increased the unrealized appreciation on investments by offsetting amounts. Adoption had no impact on the fund’s net assets or any prior period information presented in the financial statements. With respect to the fund’s results of operations, amortization of premium to first call date under ASU 2017-08 accelerates amortization with the intent of more closely aligning the recognition of income on such bonds with the economics of the instrument.
Balance Sheet Offsetting – The fund’s accounting policy with respect to balance sheet offsetting is that, absent an event of default by the counterparty or a termination of the agreement, the International Swaps and Derivatives Association (ISDA) Master Agreement, or similar agreement, does not result in an offset of reported amounts of financial assets and financial liabilities in the Statement of Assets and Liabilities across transactions between the fund and the applicable counterparty. The fund’s right to setoff may be restricted or prohibited by the bankruptcy or insolvency laws of the particular jurisdiction to which a specific master netting agreement counterparty is subject. Balance sheet offsetting disclosures, to the extent applicable to the fund, have been included in the fund’s Significant Accounting Policies note under the captions for each of the fund’s in-scope financial instruments and transactions.
Investment Valuations – Debt instruments and floating rate loans, including restricted debt instruments, are generally valued at an evaluated or composite bid as provided by a third-party pricing service. Short-term instruments with a maturity at issuance of 60 days or less may be valued at amortized cost, which approximates market value. Open-end investment companies are generally valued at net asset value per share. Securities and other assets generally valued on the basis of information from a third-party pricing service may also be valued at a broker/dealer bid quotation. In determining values, third-party pricing services can utilize both transaction data and market information such as yield, quality, coupon rate, maturity, type of issue, trading characteristics, and other market data. The values of foreign securities and other assets and liabilities expressed in foreign currencies are converted to U.S. dollars using the mean of bid and asked prices for rates provided by a third-party pricing service.
The Board of Trustees has delegated primary responsibility for determining or causing to be determined the value of the fund’s investments (including any fair valuation) to the adviser pursuant to valuation policies and procedures approved by the Board. If the adviser determines that reliable market quotations are not readily available, investments are valued at fair value as determined in good faith by the adviser in accordance with such procedures under the oversight of the Board of Trustees. Under the fund’s valuation policies and procedures, market quotations are not considered to be readily available for most types of debt instruments and floating rate loans and many types of derivatives. These investments are generally valued at fair value based on information from third-party pricing services. In addition, investments may be valued at fair value if the adviser determines that an investment’s value has been materially affected by events occurring after the close of the exchange or market on which the investment is principally traded (such as foreign exchange or market) and prior to the determination of the fund’s net asset value, or after the halt of trading of a specific security where trading does not resume prior to the close of the exchange or market on which the security is principally traded. The adviser generally relies on third-party pricing services or other information (such as the correlation with price movements of similar securities
33
Notes to Financial Statements – continued
in the same or other markets; the type, cost and investment characteristics of the security; the business and financial condition of the issuer; and trading and other market data) to assist in determining whether to fair value and at what value to fair value an investment. The value of an investment for purposes of calculating the fund’s net asset value can differ depending on the source and method used to determine value. When fair valuation is used, the value of an investment used to determine the fund’s net asset value may differ from quoted or published prices for the same investment. There can be no assurance that the fund could obtain the fair value assigned to an investment if it were to sell the investment at the same time at which the fund determines its net asset value per share.
Various inputs are used in determining the value of the fund’s assets or liabilities. These inputs are categorized into three broad levels. In certain cases, the inputs used to measure fair value may fall into different levels of the fair value hierarchy. In such cases, an investment’s level within the fair value hierarchy is based on the lowest level of input that is significant to the fair value measurement. The fund’s assessment of the significance of a particular input to the fair value measurement in its entirety requires judgment, and considers factors specific to the investment. Level 1 includes unadjusted quoted prices in active markets for identical assets or liabilities. Level 2 includes other significant observable market-based inputs (including quoted prices for similar securities, interest rates, prepayment speed, and credit risk). Level 3 includes unobservable inputs, which may include the adviser’s own assumptions in determining the fair value of investments. The following is a summary of the levels used as of October 31, 2020 in valuing the fund’s assets or liabilities:
| | | | | | | | | | | | | | | | |
| | | | |
| Financial Instruments | | Level 1 | | | Level 2 | | | Level 3 | | | Total | |
| U.S. Treasury Bonds & U.S. Government Agencies & Equivalents | | | $— | | | | $143,325,295 | | | | $— | | | | $143,325,295 | |
| Non-U.S. Sovereign Debt | | | — | | | | 7,250,027 | | | | — | | | | 7,250,027 | |
| Municipal Bonds | | | — | | | | 22,218,215 | | | | — | | | | 22,218,215 | |
| U.S. Corporate Bonds | | | — | | | | 179,450,677 | | | | — | | | | 179,450,677 | |
| Residential Mortgage-Backed Securities | | | — | | | | 5,377,243 | | | | — | | | | 5,377,243 | |
| Commercial Mortgage-Backed Securities | | | — | | | | 4,492,610 | | | | — | | | | 4,492,610 | |
| Asset-Backed Securities (including CDOs) | | | — | | | | 3,334,890 | | | | — | | | | 3,334,890 | |
| Foreign Bonds | | | — | | | | 82,590,078 | | | | — | | | | 82,590,078 | |
| Mutual Funds | | | 6,790,424 | | | | — | | | | — | | | | 6,790,424 | |
| Total | | | $6,790,424 | | | | $448,039,035 | | | | $— | | | | $454,829,459 | |
For further information regarding security characteristics, see the Portfolio of Investments.
Indemnifications – Under the fund’s organizational documents, its officers and Trustees may be indemnified against certain liabilities and expenses arising out of the performance of their duties to the fund. Additionally, in the normal course of business, the fund enters into agreements with service providers that may contain indemnification clauses. The fund’s maximum exposure under these agreements is unknown as this would involve future claims that may be made against the fund that have not yet occurred.
34
Notes to Financial Statements – continued
Investment Transactions and Income – Investment transactions are recorded on the trade date. Interest income is recorded on the accrual basis. All premium and discount is amortized or accreted for financial statement purposes in accordance with U.S. generally accepted accounting principles. Interest payments received in additional securities are recorded on the ex-interest date in an amount equal to the value of the security on such date.
The fund may receive proceeds from litigation settlements. Any proceeds received from litigation involving portfolio holdings are reflected in the Statement of Operations in realized gain/loss if the security has been disposed of by the fund or in unrealized gain/loss if the security is still held by the fund. Any other proceeds from litigation not related to portfolio holdings are reflected as other income in the Statement of Operations.
Tax Matters and Distributions – The fund intends to qualify as a regulated investment company, as defined under Subchapter M of the Internal Revenue Code, and to distribute all of its taxable income, including realized capital gains. As a result, no provision for federal income tax is required. The fund’s federal tax returns, when filed, will remain subject to examination by the Internal Revenue Service for a three year period. Management has analyzed the fund’s tax positions taken on federal and state tax returns for all open tax years and does not believe that there are any uncertain tax positions that require recognition of a tax liability. Foreign taxes, if any, have been accrued by the fund in the accompanying financial statements in accordance with the applicable foreign tax law. Foreign income taxes may be withheld by certain countries in which the fund invests. Additionally, capital gains realized by the fund on securities issued in or by certain foreign countries may be subject to capital gains tax imposed by those countries.
Distributions to shareholders are recorded on the ex-dividend date. The fund seeks to pay monthly distributions based on an annual rate of 8.50% of the fund’s average monthly net asset value. As a result, distributions may exceed actual earnings which may result in a tax return of capital. Income and capital gain distributions are determined in accordance with income tax regulations, which may differ from U.S. generally accepted accounting principles. Certain capital accounts in the financial statements are periodically adjusted for permanent differences in order to reflect their tax character. These adjustments have no impact on net assets or net asset value per share. Temporary differences which arise from recognizing certain items of income, expense, gain or loss in different periods for financial statement and tax purposes will reverse at some time in the future.
Book/tax differences primarily relate to amortization and accretion of debt securities.
35
Notes to Financial Statements – continued
The tax character of distributions declared to shareholders for the last two fiscal years is as follows:
| | | | | | | | |
| | |
| | | Year ended
10/31/20 | | | Year ended
10/31/19 | |
| Ordinary income (including any short-term capital gains) | | | $12,852,951 | | | | $12,403,691 | |
| Long-term capital gains | | | 4,640,923 | | | | — | |
| Tax return of capital (b) | | | 22,080,450 | | | | 27,810,480 | |
| | |
| Total distributions | | | $39,574,324 | | | | $40,214,171 | |
| (b) | Distributions in excess of tax basis earnings and profits are reported in the financial statements as a tax return of capital. |
The federal tax cost and the tax basis components of distributable earnings were as follows:
| | | | |
| |
| As of 10/31/20 | | | |
| |
| Cost of investments | | | $431,060,402 | |
| Gross appreciation | | | 25,078,562 | |
| |
| Gross depreciation | | | (1,309,505 | ) |
| Net unrealized appreciation (depreciation) | | | $23,769,057 | |
| |
| Other temporary differences | | | (122,722 | ) |
(3) Transactions with Affiliates
Investment Adviser – The fund has an investment advisory agreement with MFS to provide overall investment management and related administrative services and facilities to the fund. The management fee is computed daily and paid monthly at an annual rate of 0.32% of the fund’s average daily net assets and 5.65% of gross income. Gross income is calculated based on tax elections that generally include the accretion of discount and exclude the amortization of premium, which may differ from investment income reported in the Statement of Operations. MFS has agreed to reduce its management fee to the lesser of the contractual management fee as set forth above or 0.85% of the fund’s average daily net assets. This written agreement will continue until modified by the fund’s Board of Trustees, but such agreement will continue at least until October 31, 2021. For the year ended October 31, 2020, the fund’s average daily net assets and gross income fees did not meet the thresholds required to waive the management fee under this agreement. The management fee, from net assets and gross income, incurred for the year ended October 31, 2020 was equivalent to an annual effective rate of 0.49% of the fund’s average daily net assets.
Transfer Agent – The fund engages Computershare Trust Company, N.A. (“Computershare”) as the sole transfer agent for the fund. MFS Service Center, Inc. (MFSC) monitors and supervises the activities of Computershare for an agreed upon fee approved by the Board of Trustees. For the year ended October 31, 2020, these fees paid to MFSC amounted to $29,665.
Administrator – MFS provides certain financial, legal, shareholder communications, compliance, and other administrative services to the fund. Under an administrative services agreement, the fund reimburses MFS the costs incurred to provide these
36
Notes to Financial Statements – continued
services. The fund is charged an annual fixed amount of $17,500 plus a fee based on average daily net assets. The administrative services fee incurred for the year ended October 31, 2020 was equivalent to an annual effective rate of 0.0156% of the fund’s average daily net assets.
Trustees’ and Officers’ Compensation – The fund pays compensation to independent Trustees in the form of a retainer, attendance fees, and additional compensation to Board and Committee chairpersons. The fund does not pay compensation directly to Trustees or officers of the fund who are also officers of the investment adviser, all of whom receive remuneration from MFS for their services to the fund. Certain officers and Trustees of the fund are officers or directors of MFS and MFSC.
Other – The fund invests in the MFS Institutional Money Market Portfolio which is managed by MFS and seeks current income consistent with preservation of capital and liquidity. This money market fund does not pay a management fee to MFS but does incur investment and operating costs.
(4) Portfolio Securities
For the year ended October 31, 2020, purchases and sales of investments, other than short-term obligations, were as follows:
| | | | | | | | |
| | |
| | | Purchases | | | Sales | |
| U.S. Government securities | | | $53,672,412 | | | | $94,554,644 | |
| Non-U.S. Government securities | | | 141,733,150 | | | | 133,970,503 | |
(5) Shares of Beneficial Interest
The fund’s Declaration of Trust permits the Trustees to issue an unlimited number of full and fractional shares of beneficial interest. The Trustees have authorized the repurchase by the fund of up to 10% annually of its own shares of beneficial interest. The fund repurchased 973,652 shares of beneficial interest during the year ended October 31, 2020 at an average price per share of $3.50 and a weighted average discount of 8.62% per share. The fund repurchased 482,936 shares of beneficial interest during the year ended October 31, 2019 at an average price per share of $3.68 and a weighted average discount of 8.44% per share. Transactions in fund shares were as follows:
| | | | | | | | | | | | | | | | |
| | | Year ended
10/31/20 | | | Year ended
10/31/19 | |
| | | | |
| | | Shares | | | Amount | | | Shares | | | Amount | |
| Capital shares repurchased | | | (973,652 | ) | | | $(3,410,552 | ) | | | (482,936 | ) | | | $(1,777,421 | ) |
(6) Line of Credit
The fund and certain other funds managed by MFS participate in a $1.25 billion unsecured committed line of credit, subject to a $1 billion sublimit, provided by a syndicate of banks under a credit agreement. Borrowings may be made for temporary financing needs. Interest is charged to each fund, based on its borrowings, generally at a rate equal to the highest of one month LIBOR, the Federal Funds Effective Rate and the Overnight Bank Funding Rate, plus an agreed upon spread. A commitment fee, based on the average daily, unused portion of the committed line of credit, is allocated among the participating funds. In addition, the fund and other funds managed by MFS
37
Notes to Financial Statements – continued
have established unsecured uncommitted borrowing arrangements with certain banks for temporary financing needs. Interest is charged to each fund, based on its borrowings, at rates equal to customary reference rates plus an agreed upon spread. For the year ended October 31, 2020, the fund’s commitment fee and interest expense were $2,159 and $0, respectively, and are included in “Miscellaneous” expense in the Statement of Operations.
(7) Investments in Affiliated Issuers
An affiliated issuer may be considered one in which the fund owns 5% or more of the outstanding voting securities, or a company which is under common control. For the purposes of this report, the following were affiliated issuers:
| | | | | | | | | | | | | | | | | | | | | | | | |
| | | | | | |
| Affiliated Issuers | | Beginning
Value | | | Purchases | | | Sales
Proceeds | | | Realized
Gain
(Loss) | | | Change in
Unrealized
Appreciation or
Depreciation | | | Ending
Value | |
| MFS Institutional Money Market Portfolio | | | $3,881,383 | | | | $126,045,648 | | | | $123,137,857 | | | | $1,586 | | | | $(336 | ) | | | $6,790,424 | |
| | | | | | |
| Affiliated Issuers | | | | | | | | | | | | | | Dividend
Income | | | Capital Gain
Distributions | |
| MFS Institutional Money Market Portfolio | | | | | | | | | | | | | | | | $30,017 | | | | $— | |
(8) Impacts of COVID-19
The pandemic related to the global spread of novel coronavirus disease (COVID-19), which was first detected in December 2019, has resulted in significant disruptions to global business activity and the global economy, as well as the economies of individual countries, the financial performance of individual companies and sectors, and the securities and commodities markets in general. This pandemic, the full effects of which are still unknown, has resulted in substantial market volatility and may have adversely impacted the prices and liquidity of the fund’s investments and the fund’s performance.
38
REPORT OF INDEPENDENT REGISTERED PUBLIC ACCOUNTING FIRM
To the Board of Trustees and the Shareholders of MFS Intermediate Income Trust:
Opinion on the Financial Statements and Financial Highlights
We have audited the accompanying statement of assets and liabilities of MFS Intermediate Income Trust (the “Fund”), including the portfolio of investments, as of October 31, 2020, the related statement of operations for the year then ended, the statements of changes in net assets for each of the two years in the period then ended, the financial highlights for each of the five years in the period then ended, and the related notes. In our opinion, the financial statements and financial highlights present fairly, in all material respects, the financial position of the Fund as of October 31, 2020, and the results of its operations for the year then ended, the changes in its net assets for each of the two years in the period then ended, and the financial highlights for each of the five years in the period then ended, in conformity with accounting principles generally accepted in the United States of America.
Basis for Opinion
These financial statements and financial highlights are the responsibility of the Fund’s management. Our responsibility is to express an opinion on the Fund’s financial statements and financial highlights based on our audits. We are a public accounting firm registered with the Public Company Accounting Oversight Board (United States) (PCAOB) and are required to be independent with respect to the Fund in accordance with the U.S. federal securities laws and the applicable rules and regulations of the Securities and Exchange Commission and the PCAOB.
We conducted our audits in accordance with the standards of the PCAOB. Those standards require that we plan and perform the audit to obtain reasonable assurance about whether the financial statements and financial highlights are free of material misstatement, whether due to error or fraud. The Fund is not required to have, nor were we engaged to perform, an audit of its internal control over financial reporting. As part of our audits, we are required to obtain an understanding of internal control over financial reporting but not for the purpose of expressing an opinion on the effectiveness of the Fund’s internal control over financial reporting. Accordingly, we express no such opinion.
Our audits included performing procedures to assess the risks of material misstatement of the financial statements and financial highlights, whether due to error or fraud, and performing procedures that respond to those risks. Such procedures included examining, on a test basis, evidence regarding the amounts and disclosures in the financial statements and financial highlights. Our audits also included evaluating the accounting principles used and significant estimates made by management, as well as evaluating the overall presentation of the financial statements and financial highlights.
39
Report of Independent Registered Public Accounting Firm – continued
Our procedures included confirmation of securities owned as of October 31, 2020, by correspondence with the custodian and brokers. We believe that our audits provide a reasonable basis for our opinion.
DELOITTE & TOUCHE LLP
Boston, Massachusetts
December 16, 2020
We have served as the auditor of one or more of the MFS’s investment companies since 1924.
40
RESULTS OF SHAREHOLDER MEETING
(unaudited)
At the annual meeting of shareholders of MFS Intermediate Income Trust, which was held on October 1, 2020, the following action was taken:
Item 1: To elect the following individuals as Trustees:
| | | | | | | | |
| | | Number of Shares | |
Nominee | | For | | | Withheld Authority | |
| Steven E. Buller | | | 99,399,401.100 | | | | 2,922,650.570 | |
| Peter D. Jones | | | 101,371,684.687 | | | | 950,366.983 | |
| John P. Kavanaugh | | | 101,028,170.254 | | | | 1,293,881.416 | |
41
TRUSTEES AND OFFICERS — IDENTIFICATION AND BACKGROUND
The Trustees and Officers of the Trust, as of December 1, 2020, are listed below, together with their principal occupations during the past five years. (Their titles may have varied during that period.) The address of each Trustee and Officer is 111 Huntington Avenue, Boston, Massachusetts 02199-7618.
| | | | | | | | | | | | |
Name, Age | | Position(s)
Held with Fund | | Trustee/
Officer Since (h) | | Term Expiring | | Number
of MFS
Funds
overseen
by the
Trustee | | Principal
Occupations
During the Past
Five Years | | Other Directorships
During
the Past
Five Years (j) |
| INTERESTED TRUSTEES |
Robert J. Manning (k)
(age 57) | | Trustee | | February 2004 | | 2022 | | 133 | | Massachusetts Financial Services Company, Executive Chairman (since January 2017); Director; Chairman of the Board; Chief Executive Officer (until 2015); Co-Chief Executive Officer (2015-2016) | | N/A |
| | | | | | |
Robin A. Stelmach (k)* (age 59) | | Trustee | | January 2014 | | 2021 | | 133 | | Massachusetts Financial Services Company, Vice Chair (since January 2017); Chief Operating Officer and Executive Vice President (until January 2017) | | N/A |
| INDEPENDENT TRUSTEES |
John P. Kavanaugh (age 66) | | Trustee and Chair of Trustees | | January 2009 | | 2023 | | 133 | | Private investor | | N/A |
| | | | | | |
Steven E. Buller (age 69) | | Trustee | | February 2014 | | 2023 | | 133 | | Private investor; Financial Accounting Standards Advisory Council, Chairman (2014-2015) | | N/A |
| | | | | | |
John A. Caroselli (age 66) | | Trustee | | March 2017 | | 2021 | | 133 | | Private investor; JC Global Advisors, LLC (management consulting), President (since 2015); First Capital Corporation (commercial finance), Executive Vice President (until 2015) | | N/A |
42
Trustees and Officers – continued
| | | | | | | | | | | | |
Name, Age | | Position(s)
Held with Fund | | Trustee/
Officer Since (h) | | Term Expiring | | Number
of MFS
Funds
overseen
by the
Trustee | | Principal
Occupations
During the Past
Five Years | | Other Directorships
During
the Past
Five Years (j) |
Maureen R. Goldfarb (age 65) | | Trustee | | January 2009 | | 2022 | | 133 | | Private investor | | N/A |
| | | | | | |
Peter D. Jones
(age 65) | | Trustee | | January 2019 | | 2023 | | 133 | | Private investor; Franklin Templeton Institutional, LLC (investment management), Chairman (until 2015); Franklin Templeton Distributors, Inc. (investment management), President (until 2015) | | N/A |
| | | | | | |
| James W. Kilman, Jr. (age 59) | | Trustee | | January 2019 | | 2021 | | 133 | | Burford Capital Limited (finance and investment management), Chief Financial Officer (since 2019); KielStrand Capital LLC (family office), Chief Executive Officer (since 2016); Morgan Stanley & Co. (financial services), Vice Chairman of Investment Banking, Co-Head of Diversified Financials Coverage – Financial Institutions Investment Banking Group (until 2016) | | Alpha-En Corporation, Director (2016-2019) |
| | | | | | |
Clarence Otis, Jr. (age 64) | | Trustee | | March 2017 | | 2021 | | 133 | | Private investor | | VF Corporation, Director; Verizon Communications, Inc., Director; The Travelers Companies, Director; Federal Reserve Bank of Atlanta, Director (until 2015) |
| | | | | | |
Maryanne L. Roepke (age 64) | | Trustee | | May 2014 | | 2022 | | 133 | | Private investor | | N/A |
43
Trustees and Officers – continued
| | | | | | | | | | | | |
Name, Age | | Position(s)
Held with Fund | | Trustee/
Officer Since (h) | | Term Expiring | | Number
of MFS
Funds
overseen
by the
Trustee | | Principal
Occupations
During the Past
Five Years | | Other Directorships
During
the Past
Five Years (j) |
Laurie J. Thomsen
(age 63) | | Trustee | | March 2005 | | 2022 | | 133 | | Private investor | | The Travelers Companies, Director; Dycom Industries, Inc., Director (since 2015) |
| | | | | | | | | | |
Name, Age | | Position(s)
Held with Fund | | Trustee/Officer Since (h) | | Term Expiring | | Number of MFS Funds for which the Person is an Officer | | Principal
Occupations During the Past Five Years |
| OFFICERS | | | | | | | | | | |
Christopher R. Bohane (k)
(age 46) | | Assistant Secretary and Assistant Clerk | | July 2005 | | N/A | | 133 | | Massachusetts Financial Services Company, Senior Vice President and Associate General Counsel |
| | | | | |
Kino Clark (k) (age 52) | | Assistant Treasurer | | January 2012 | | N/A | | 133 | | Massachusetts Financial Services Company, Vice President |
| | | | | |
John W. Clark, Jr. (k) (age 53) | | Assistant Treasurer | | April 2017 | | N/A | | 133 | | Massachusetts Financial Services Company, Vice President (since March 2017); Deutsche Bank (financial services), Department Head – Treasurer’s Office (until February 2017) |
| | | | | |
Thomas H. Connors (k) (age 61) | | Assistant Secretary and Assistant Clerk | | September 2012 | | N/A | | 133 | | Massachusetts Financial Services Company, Vice President and Senior Counsel |
| | | | | |
David L. DiLorenzo (k)
(age 52) | | President | | July 2005 | | N/A | | 133 | | Massachusetts Financial Services Company, Senior Vice President |
44
Trustees and Officers – continued
| | | | | | | | | | |
Name, Age | | Position(s)
Held with Fund | | Trustee/Officer Since (h) | | Term Expiring | | Number of MFS Funds for which the Person is an Officer | | Principal
Occupations During the Past Five Years |
Heidi W. Hardin (k) (age 53) | | Secretary and Clerk | | April 2017 | | N/A | | 133 | | Massachusetts Financial Services Company, Executive Vice President and General Counsel (since March 2017); Harris Associates (investment management), General Counsel (from September 2015 to January 2017); Janus Capital Management LLC (investment management), Senior Vice President and General Counsel (until September 2015) |
| | | | | |
Brian E. Langenfeld (k) (age 47) | | Assistant
Secretary and Assistant Clerk | | June 2006 | | N/A | | 133 | | Massachusetts Financial Services Company, Vice President and Senior Counsel |
| | | | | |
Amanda S. Mooradian (k)
(age 41) | | Assistant
Secretary and Assistant Clerk | | September 2018 | | N/A | | 133 | | Massachusetts Financial Services Company, Assistant Vice President and Senior Counsel |
| | | | | |
Susan A. Pereira (k)
(age 50) | | Assistant
Secretary and Assistant Clerk | | July 2005 | | N/A | | 133 | | Massachusetts Financial Services Company, Assistant Vice President and Senior Counsel |
| | | | | |
Kasey L. Phillips (k) (age 49) | | Assistant Treasurer | | September 2012 | | N/A | | 133 | | Massachusetts Financial Services Company, Vice President |
| | | | | |
Matthew A. Stowe (k) (age 46) | | Assistant Secretary and Assistant Clerk | | October 2014 | | N/A | | 133 | | Massachusetts Financial Services Company, Vice President and Assistant General Counsel |
| | | | | |
Martin J. Wolin (k) (age 53) | | Chief Compliance Officer | | July 2015 | | N/A | | 133 | | Massachusetts Financial Services Company, Senior Vice President and Chief Compliance Officer (since July 2015) |
| | | | | |
James O. Yost (k)
(age 60) | | Treasurer | | September 1990 | | N/A | | 133 | | Massachusetts Financial Services Company, Senior Vice President |
45
Trustees and Officers – continued
| (h) | Date first appointed to serve as Trustee/officer of an MFS Fund. Each Trustee has served continuously since appointment unless indicated otherwise. For the period from December 15, 2004 until February 22, 2005, Mr. Manning served as Advisory Trustee. From January 2012 through December 2016, Messrs. DiLorenzo and Yost served as Treasurer and Deputy Treasurer of the Funds, respectively. |
| (j) | Directorships or trusteeships of companies required to report to the Securities and Exchange Commission (i.e., “public companies”). |
| (k) | “Interested person” of the Trust within the meaning of the Investment Company Act of 1940 (referred to as the 1940 Act), which is the principal federal law governing investment companies like the fund, as a result of a position with MFS. The address of MFS is 111 Huntington Avenue, Boston, Massachusetts 02199-7618. |
| * | As of December 31, 2020, Mrs. Stelmach will retire as Trustee. |
The Trust holds annual shareholder meetings for the purpose of electing Trustees, and Trustees are elected for fixed terms. The Board of Trustees is currently divided into three classes, each having a term of three years which term expires on the date of the third annual meeting following the election to office of the Trustee’s class. Each year the term of one class expires. Each Trustee and officer will serve until next elected or his or her earlier death, resignation, retirement or removal. Under the terms of the Board’s retirement policy, an Independent Trustee shall retire at the end of the calendar year in which he or she reaches the earlier of 75 years of age or 15 years of service on the Board (or, in the case of any Independent Trustee who joined the Board prior to 2015, 20 years of service on the Board).
Messrs. Buller, Kilman and Otis and Ms. Roepke are members of the Trust’s Audit Committee.
Each of the Interested Trustees and certain Officers hold comparable officer positions with certain affiliates of MFS.
| | |
| Investment Adviser | | Custodian |
Massachusetts Financial Services Company 111 Huntington Avenue Boston, MA 02199-7618 | | State Street Bank and Trust Company 1 Lincoln Street Boston, MA 02111-2900 |
| Portfolio Manager(s) | | Independent Registered Public Accounting Firm |
| Geoffrey Schechter | | Deloitte & Touche LLP |
| Alexander Mackey | | 200 Berkeley Street Boston, MA 02116 |
|
46
BOARD REVIEW OF INVESTMENT ADVISORY AGREEMENT
MFS Intermediate Income Trust
The Investment Company Act of 1940 requires that both the full Board of Trustees and a majority of the non-interested (“independent”) Trustees, voting separately, annually approve the continuation of the Fund’s investment advisory agreement with MFS. The Trustees consider matters bearing on the Fund and its advisory arrangements at their meetings throughout the year, including a review of performance data at each regular meeting. In addition, the independent Trustees met several times by videoconference (in accordance with Securities and Exchange Commission relief) over the course of three months beginning in May and ending in July, 2020 (“contract review meetings”) for the specific purpose of considering whether to approve the continuation of the investment advisory agreement for the Fund and the other investment companies that the Board oversees (the “MFS Funds”). The independent Trustees were assisted in their evaluation of the Fund’s investment advisory agreement by independent legal counsel, from whom they received separate legal advice and with whom they met separately from MFS during various contract review meetings. The independent Trustees were also assisted in this process by an independent consultant who was retained by and reported to the independent Trustees.
In connection with their deliberations regarding the continuation of the investment advisory agreement, the Trustees, including the independent Trustees, considered such information and factors as they believed, in light of the legal advice furnished to them and their own business judgment, to be relevant. The investment advisory agreement for the Fund was considered separately, although the Trustees also took into account the common interests of all MFS Funds in their review. As described below, the Trustees considered the nature, quality, and extent of the various investment advisory, administrative, and shareholder services performed by MFS under the existing investment advisory agreement and other arrangements with the Fund.
In connection with their contract review meetings, the Trustees received and relied upon materials that included, among other items: (i) information provided by Broadridge Financial Solutions, Inc. (“Broadridge”), an independent third party, on the investment performance (based on net asset value) of the Fund for various time periods ended December 31, 2019 and the investment performance (based on net asset value) of a group of funds with substantially similar investment classifications/objectives (the “Broadridge performance universe”), (ii) information provided by Broadridge on the Fund’s advisory fees and other expenses and the advisory fees and other expenses of comparable funds identified by Broadridge as well as all other funds in the same investment classification/category (the “Broadridge expense group and universe”), (iii) information provided by MFS on the advisory fees of portfolios of other clients of MFS, including institutional separate accounts and other clients, (iv) information as to whether and to what extent applicable expense waivers, reimbursements or fee “breakpoints” are observed for the Fund, (v) information regarding MFS’ financial results and financial condition, including MFS’ and certain of its affiliates’ estimated profitability from services performed for the Fund and the MFS Funds as a whole, and compared to MFS’ institutional business, (vi) MFS’ views regarding the outlook for the mutual fund industry and the strategic business plans of MFS, (vii) descriptions of
47
Board Review of Investment Advisory Agreement – continued
various functions performed by MFS for the Funds, such as compliance monitoring and portfolio trading practices, and (viii) information regarding the overall organization of MFS, including information about MFS’ senior management and other personnel providing investment advisory, administrative and other services to the Fund and the other MFS Funds. The comparative performance, fee and expense information prepared and provided by Broadridge was not independently verified and the independent Trustees did not independently verify any information provided to them by MFS.
The Trustees’ conclusion as to the continuation of the investment advisory agreement was based on a comprehensive consideration of all information provided to the Trustees and not the result of any single factor. Some of the factors that figured particularly in the Trustees’ deliberations are described below, although individual Trustees may have evaluated the information presented differently from one another, giving different weights to various factors. It is also important to recognize that the fee arrangements for the Fund and other MFS Funds are the result of years of review and discussion between the independent Trustees and MFS, that certain aspects of such arrangements may receive greater scrutiny in some years than in others, and that the Trustees’ conclusions may be based, in part, on their consideration of these same arrangements during the course of the year and in prior years.
Based on information provided by Broadridge and MFS, the Trustees reviewed the Fund’s total return investment performance as well as the Broadridge performance universe over various time periods. The Trustees placed particular emphasis on the total return performance of the Fund’s common shares in comparison to the performance of funds in its Broadridge performance universe over the five-year period ended December 31, 2019, which the Trustees believed was a long enough period to reflect differing market conditions. The total return performance of the Fund’s common shares ranked 5th out of a total of 6 funds in the Broadridge performance universe for this five-year period (a ranking of first place out of the total number of funds in the performance universe indicating the best performer and a ranking of last place out of the total number of funds in the performance universe indicating the worst performer). The total return performance of the Fund’s common shares ranked 5th out of a total of 6 funds for each of the one- and three-year periods ended December 31, 2019. Given the size of the Broadridge performance universe and information previously provided by MFS regarding differences between the Fund and other funds in its Broadridge performance universe, the Trustees also reviewed the Fund’s performance in comparison to the Bloomberg Barclays U.S. Intermediate Government/Credit Bond Index. The Fund outperformed the Bloomberg Barclays U.S. Intermediate Government/Credit Bond Index for each of the one-, three-, and five-year periods ended December 31, 2019 (one-year: 8.1% total return for the Fund versus 6.8% total return for the benchmark; three-year: 3.8% total return for the Fund versus 3.2% total return for the benchmark; five-year: 3.2% total return for the Fund versus 2.6% total return for the benchmark). Because of the passage of time, these performance results may differ from the performance results for more recent periods, including those shown elsewhere in this report.
In the course of their deliberations, the Trustees took into account information provided by MFS in connection with the contract review meetings, as well as during
48
Board Review of Investment Advisory Agreement – continued
investment review meetings conducted with portfolio management personnel during the course of the year regarding the Fund’s performance. The Trustees observed that there were significant limitations to the usefulness of the comparative data provided by Broadridge, noting that the applicable Broadridge performance universe for the Fund included funds that pursue substantially different investment programs as compared to that pursued by the Fund. After reviewing these and related factors, the Trustees concluded, within the context of their overall conclusions regarding the investment advisory agreement, that they were satisfied with MFS’ responses and efforts relating to investment performance.
In assessing the reasonableness of the Fund’s advisory fee, the Trustees considered, among other information, the Fund’s advisory fee and the total expense ratio of the Fund’s common shares as a percentage of average daily net assets and the advisory fee and total expense ratios of the Broadridge expense group based on information provided by Broadridge. The Trustees considered that MFS has agreed in writing to reduce its advisory fee, which may not be changed without the Trustees’ approval. The Trustees also considered that, according to the data provided by Broadridge (which takes into account any fee reductions or expense limitations that were in effect during the Fund’s last fiscal year), the Fund’s effective advisory fee rate was higher than the Broadridge expense group median and the Fund’s total expense ratio was lower than the Broadridge expense group median.
The Trustees also considered the advisory fees charged by MFS to any institutional separate accounts advised by MFS (“separate accounts”) and unaffiliated investment companies for which MFS serves as subadviser (“subadvised funds”) that have comparable investment strategies to the Fund, if any. In comparing these fees, the Trustees considered information provided by MFS as to the generally broader scope of services provided by MFS to the Fund, as well as the more extensive regulatory burdens imposed on MFS in managing the Fund, in comparison to separate accounts and subadvised funds.
The Trustees considered that, as a closed-end fund, the Fund is unlikely to experience meaningful asset growth. As a result, the Trustees did not view the potential for realization of economies of scale as the Fund’s assets grow to be a material factor in their deliberations. The Trustees noted that they would consider economies of scale in the future in the event the Fund experiences significant asset growth, such as through an offering of preferred shares (which is not currently contemplated) or a material increase in the market value of the Fund’s portfolio securities.
The Trustees also considered information prepared by MFS relating to MFS’ costs and profits with respect to the Fund, the MFS Funds considered as a group, and other investment companies and accounts advised by MFS, as well as MFS’ methodologies used to determine and allocate its costs to the MFS Funds, the Fund and other accounts and products for purposes of estimating profitability.
After reviewing these and other factors described herein, the Trustees concluded, within the context of their overall conclusions regarding the investment advisory agreement, that the advisory fees charged to the Fund represent reasonable compensation in light of the services being provided by MFS to the Fund.
49
Board Review of Investment Advisory Agreement – continued
In addition, the Trustees considered MFS’ resources and related efforts to continue to retain, attract and motivate capable personnel to serve the Fund. The Trustees also considered current and developing conditions in the financial services industry, including the presence of large and well-capitalized companies which are spending, and appear to be prepared to continue to spend, substantial sums to engage personnel and to provide services to competing investment companies. In this regard, the Trustees also considered the financial resources of MFS and its ultimate parent, Sun Life Financial Inc. The Trustees also considered the advantages and possible disadvantages to the Fund of having an adviser that also serves other investment companies as well as other accounts.
The Trustees also considered the nature, quality, cost, and extent of administrative services provided to the Fund by MFS under agreements other than the investment advisory agreement. The Trustees also considered the nature, extent and quality of certain other services MFS performs or arranges for on the Fund’s behalf, which may include securities lending programs, directed expense payment programs, class action recovery programs, and MFS’ interaction with third-party service providers, principally custodians and sub-custodians. The Trustees concluded that the various non-advisory services provided by MFS and its affiliates on behalf of the Fund were satisfactory.
The Trustees considered so-called “fall-out benefits” to MFS such as reputational value derived from serving as investment manager to the MFS Funds. The Trustees also considered that MFS discontinued its historic practice of obtaining investment research from portfolio brokerage commissions paid by certain MFS Funds effective January 2018, and pays or voluntarily reimburses a Fund, if applicable, for the costs of external research acquired through the use of the Fund’s portfolio brokerage commissions.
Based on their evaluation of factors that they deemed to be material, including those factors described above, the Board of Trustees, including the independent Trustees, concluded that the Fund’s investment advisory agreement with MFS should be continued for an additional one-year period, commencing August 1, 2020.
50
PROXY VOTING POLICIES AND INFORMATION
MFS votes proxies on behalf of the fund pursuant to proxy voting policies and procedures that are available without charge, upon request, by calling 1-800-225-2606, by visiting mfs.com/proxyvoting, or by visiting the SEC’s Web site at http://www.sec.gov.
Information regarding how the fund voted proxies relating to portfolio securities during the most recent twelve-month period ended June 30 is available by August 31 of each year without charge by visiting mfs.com/proxyvoting, or by visiting the SEC’s Web site at http://www.sec.gov.
QUARTERLY PORTFOLIO DISCLOSURE
The fund files a complete schedule of portfolio holdings with the SEC for the first and third quarters of each fiscal year as an exhibit to its reports on Form N-PORT. The fund’s Form N-PORT reports are available on the SEC’s Web site at http://www.sec.gov. A shareholder can obtain the portfolio holdings report for the first and third quarters of the fund’s fiscal year at mfs.com/closedendfunds by choosing the fund’s name and then scrolling to the “Resources” section and clicking on the “Prospectus and Reports” tab.
FURTHER INFORMATION
From time to time, MFS may post important information about the fund or the MFS funds on the MFS Web site (mfs.com). This information is available at https://www.mfs.com/announcements or at mfs.com/closedendfunds by choosing the fund’s name and then scrolling to the “Resources” section and clicking on the “Announcements” tab, if any.
Additional information about the fund (e.g., performance, dividends and the fund’s price history) is also available at mfs.com/closedendfunds by choosing the fund’s name, if any.
INFORMATION ABOUT FUND CONTRACTS AND LEGAL CLAIMS
The fund has entered into contractual arrangements with an investment adviser, administrator, transfer agent, and custodian who each provide services to the fund. Unless expressly stated otherwise, shareholders are not parties to, or intended beneficiaries of these contractual arrangements, and these contractual arrangements are not intended to create any shareholder right to enforce them against the service providers or to seek any remedy under them against the service providers, either directly or on behalf of the fund.
Under the Trust’s By-Laws and Declaration of Trust, any claims asserted against or on behalf of the MFS Funds, including claims against Trustees and Officers, must be brought in state and federal courts located within the Commonwealth of Massachusetts.
FEDERAL TAX INFORMATION (unaudited)
The fund will notify shareholders of amounts for use in preparing 2020 income tax forms in January 2021. The following information is provided pursuant to provisions of the Internal Revenue Code.
The fund designates $5,106,000 as capital gain dividends paid during the fiscal year.
The fund intends to pass through the maximum amount allowable as Section 163(j) Interest Dividends as defined in Proposed Treasury Regulation §1.163(j)-1(b).
51
rev. 3/16
| | | | |
| | | |
FACTS | | WHAT DOES MFS DO WITH YOUR PERSONAL INFORMATION? | |  |
| | |
| Why? | | Financial companies choose how they share your personal information. Federal law gives consumers the right to limit some but not all sharing. Federal law also requires us to tell you how we collect, share, and protect your personal information. Please read this notice carefully to understand what we do. |
| | |
| What? | | The types of personal information we collect and share depend on the product or service you have with us. This information can include: • Social Security number and account balances • Account transactions and transaction history • Checking account information and wire transfer instructions When you are no longer our customer, we continue to share your information as described in this notice. |
| | |
| How? | | All financial companies need to share customers’ personal information to run their everyday business. In the section below, we list the reasons financial companies can share their customers’ personal information; the reasons MFS chooses to share; and whether you can limit this sharing. |
| | | | |
Reasons we can share your
personal information | | Does MFS
share? | | Can you limit
this sharing? |
For our everyday business purposes – such as to process your transactions, maintain your account(s), respond to court orders and legal investigations, or report to credit bureaus | | Yes | | No |
For our marketing purposes – to offer our products and services to you | | No | | We don’t share |
For joint marketing with other financial companies | | No | | We don’t share |
For our affiliates’ everyday business purposes – information about your transactions and experiences | | No | | We don’t share |
For our affiliates’ everyday business purposes – information about your creditworthiness | | No | | We don’t share |
| For nonaffiliates to market to you | | No | | We don’t share |
| | |
| | |
| Questions? | | Call 800-225-2606 or go to mfs.com. |
52
| | |
| Who we are |
| Who is providing this notice? | | MFS Funds, MFS Investment Management, MFS Institutional Advisors, Inc., and MFS Heritage Trust Company. |
| | |
| What we do |
| How does MFS protect my personal information? | | To protect your personal information from unauthorized access and use, we use security measures that comply with federal law. These measures include procedural, electronic, and physical safeguards for the protection of the personal information we collect about you. |
| How does MFS collect my personal information? | | We collect your personal information, for example, when you • open an account or provide account information • direct us to buy securities or direct us to sell your securities • make a wire transfer We also collect your personal information from others, such as credit bureaus, affiliates, or other companies. |
| Why can’t I limit all sharing? | | Federal law gives you the right to limit only • sharing for affiliates’ everyday business purposes – information about your creditworthiness • affiliates from using your information to market to you • sharing for nonaffiliates to market to you State laws and individual companies may give you additional rights to limit sharing. |
| | |
| Definitions |
| Affiliates | | Companies related by common ownership or control. They can be financial and nonfinancial companies. • MFS does not share personal information with affiliates, except for everyday business purposes as described on page one of this notice. |
| Nonaffiliates | | Companies not related by common ownership or control. They can be financial and nonfinancial companies. • MFS does not share with nonaffiliates so they can market to you. |
| Joint marketing | | A formal agreement between nonaffiliated financial companies that together market financial products or services to you. • MFS doesn’t jointly market. |
| | |
| Other important information |
| If you own an MFS product or receive an MFS service in the name of a third party such as a bank or broker-dealer, their privacy policy may apply to you instead of ours. |
53
CONTACT US
TRANSFER AGENT, REGISTRAR, AND
DIVIDEND DISBURSING AGENT
CALL
1-800-637-2304
9 a.m. to 5 p.m. Eastern time
WRITE
Computershare Trust Company, N.A.
P.O. Box 505005
Louisville, KY 40233-5005
New York Stock Exchange Symbol: MIN
The Registrant has adopted a Code of Ethics (the “Code”) pursuant to Section 406 of the Sarbanes-Oxley Act and as defined in Form N-CSR that applies to the Registrant’s principal executive officer and principal financial and accounting officer. During the period covered by this report, the Registrant has not amended any provision in the Code that relates to an element of the Code’s definition enumerated in paragraph (b) of Item 2 of this Form N-CSR. During the period covered by this report, the Registrant did not grant a waiver, including an implicit waiver, from any provision of the Code.
A copy of the Code is filed as an exhibit to this Form N-CSR.
| ITEM 3. | AUDIT COMMITTEE FINANCIAL EXPERT. |
Messrs. Steven E. Buller, James Kilman, and Clarence Otis, Jr. and Ms. Maryanne L. Roepke, members of the Audit Committee, have been determined by the Board of Trustees in their reasonable business judgment to meet the definition of “audit committee financial expert” as such term is defined in Form N-CSR. In addition, Messrs. Buller, Kilman, and Otis and Ms. Roepke are “independent” members of the Audit Committee (as such term has been defined by the Securities and Exchange Commission in regulations implementing Section 407 of the Sarbanes-Oxley Act of 2002). The Securities and Exchange Commission has stated that the designation of a person as an audit committee financial expert pursuant to this Item 3 on the Form N-CSR does not impose on such a person any duties, obligations or liability that are greater than the duties, obligations or liability imposed on such person as a member of the Audit Committee and the Board of Trustees in the absence of such designation or identification.
| ITEM 4. | PRINCIPAL ACCOUNTANT FEES AND SERVICES. |
Items 4(a) through 4(d) and 4(g):
The Board of Trustees has appointed Deloitte & Touche LLP (“Deloitte”) to serve as independent accountants to the Registrant (hereinafter the “Registrant” or the “Fund”). The tables below set forth the audit fees billed to the Fund as well as fees for non-audit services provided to the Fund and/or to the Fund’s investment adviser, Massachusetts Financial Services Company (“MFS”) and to various entities either controlling, controlled by, or under common control with MFS that provide ongoing services to the Fund (“MFS Related Entities”).
For the fiscal years ended October 31, 2020 and 2019, audit fees billed to the Fund by Deloitte were as follows:
| | | | | | | | |
| | | Audit Fees | |
| | 2020 | | | 2019 | |
Fees billed by Deloitte: | | | | | | | | |
MFS Intermediate Income Trust | | | 66,375 | | | | 65,112 | |
For the fiscal years ended October 31, 2020 and 2019, fees billed by Deloitte for audit-related, tax and other services provided to the Fund and for audit-related, tax and other services provided to MFS and MFS Related Entities were as follows:
| | | | | | | | | | | | | | | | | | | | | | | | |
| | | Audit-Related Fees1 | | | Tax Fees2 | | | All Other Fees3 | |
| | | 2020 | | | 2019 | | | 2020 | | | 2019 | | | 2020 | | | 2019 | |
Fees billed by Deloitte: | | | | | | | | | | | | | | | | | | | | | | | | |
To MFS Intermediate Income Trust | | | 10,000 | | | | 10,000 | | | | 6,713 | | | | 6,601 | | | | 0 | | | | 0 | |
| | | | | | | | | | | | | | | | | | | | | | | | |
| | | Audit-Related Fees1 | | | Tax Fees2 | | | All Other Fees3 | |
| | | 2020 | | | 2019 | | | 2020 | | | 2019 | | | 2020 | | | 2019 | |
Fees billed by Deloitte: | | | | | | | | | | | | | | | | | | | | | | | | |
To MFS and MFS Related Entities of MFS Intermediate Income Trust* | | | 0 | | | | 0 | | | | 0 | | | | 0 | | | | 5,390 | | | | 3,790 | |
| | | | | | | | |
| | | Aggregate Fees for Non-audit
Services | |
| | 2020 | | | 2019 | |
Fees Billed by Deloitte: | | | | | | | | |
To MFS Intermediate Income Trust, MFS and MFS Related Entities# | | | 915,853 | | | | 20,391 | |
| * | This amount reflects the fees billed to MFS and MFS Related Entities for non-audit services relating directly to the operations and financial reporting of the Fund (portions of which services also related to the operations and financial reporting of other funds within the MFS Funds complex). |
| # | This amount reflects the aggregate fees billed by Deloitte for non-audit services rendered to the Fund and for non-audit services rendered to MFS and the MFS Related Entities. |
| 1 | The fees included under “Audit-Related Fees” are fees related to assurance and related services that are reasonably related to the performance of the audit or review of financial statements, but not reported under ‘‘Audit Fees,’’ including accounting consultations, agreed-upon procedure reports, attestation reports, comfort letters and internal control reviews. |
| 2 | The fees included under “Tax Fees” are fees associated with tax compliance, tax advice and tax planning, including services relating to the filing or amendment of federal, state or local income tax returns, regulated investment company qualification reviews and tax distribution and analysis. |
| 3 | The fees included under “All Other Fees” are fees for products and services provided by Deloitte other than those reported under “Audit Fees,” “Audit-Related Fees” and “Tax Fees,” including fees for services related to review of internal controls and review of Rule 38a-1 compliance program. |
Item 4(e)(1):
Set forth below are the policies and procedures established by the Audit Committee of the Board of Trustees relating to the pre-approval of audit and non-audit related services:
To the extent required by applicable law, pre-approval by the Audit Committee of the Board is needed for all audit and permissible non-audit services rendered to the Fund and all permissible non-audit services rendered to MFS or MFS Related Entities if the services relate directly to the operations and financial reporting of the Registrant. Pre-approval is currently on an engagement-by-engagement basis. In the event pre-approval of such services is necessary between regular meetings of the Audit Committee and it is not practical to wait to seek pre-approval at the next regular meeting of the Audit Committee, pre-approval of such services may be referred to the Chair of the Audit Committee for approval; provided that the Chair may not pre-approve any individual engagement for such services exceeding $50,000 or multiple engagements for such services in the aggregate exceeding $100,000 between such regular meetings of the Audit Committee. Any engagement pre-approved by the Chair between regular meetings of the Audit Committee shall be presented for ratification by the entire Audit Committee at its next regularly scheduled meeting.
Item 4(e)(2):
None, or 0%, of the services relating to the Audit-Related Fees, Tax Fees and All Other Fees paid by the Fund and MFS and MFS Related Entities relating directly to the operations and financial reporting of the Registrant disclosed above were approved by the audit committee pursuant to paragraphs (c)(7)(i)(C) of Rule 2-01 of Regulation S-X (which permits audit committee approval after the start of the engagement with respect to services other than audit, review or attest services, if certain conditions are satisfied).
Item 4(f):
Not applicable.
Item 4(h):
The Registrant’s Audit Committee has considered whether the provision by a Registrant’s independent registered public accounting firm of non-audit services to MFS and MFS Related Entities that were not pre-approved by the Committee (because such services were provided prior to the effectiveness of SEC rules requiring pre-approval or because such services did not relate directly to the operations and financial reporting of the Registrant) was compatible with maintaining the independence of the independent registered public accounting firm as the Registrant’s principal auditors.
| ITEM 5. | AUDIT COMMITTEE OF LISTED REGISTRANTS. |
The Registrant has an Audit Committee established in accordance with Section 3(a)(58)(A) of the Securities Exchange Act of 1934. The members of the Audit Committee are Messrs. Steven E. Buller, James Kilman, and Clarence Otis, Jr. and Ms. Maryanne L. Roepke.
| ITEM 6. | SCHEDULE OF INVESTMENTS |
A schedule of investments of the Registrant is included as part of the report to shareholders of the Registrant under Item 1 of this Form N-CSR.
| ITEM 7. | DISCLOSURE OF PROXY VOTING POLICIES AND PROCEDURES FOR CLOSED-END MANAGEMENT INVESTMENT COMPANIES. |
A copy of the proxy voting policies and procedures are attached hereto as EX-99.PROXYPOL.
| ITEM 8. | PORTFOLIO MANAGERS OF CLOSED-END MANAGEMENT INVESTMENT COMPANIES. |
Portfolio Manager(s)
Information regarding the portfolio manager(s) of the MFS Intermediate Income Trust (the “Fund”) is set forth below. Each portfolio manager is primarily responsible for the day-to-day management of the Fund.
| | | | | | |
Portfolio Manager | | Primary Role | | Since | | Title and Five Year History |
| Geoffrey Schechter | | Lead Portfolio Manager | | 2017 | | Investment Officer of MFS; employed in the investment area of MFS since 1993 |
| | | |
| Alexander Mackey | | Investment Grade Debt Instruments Portfolio Manager | | 2017 | | Investment Officer of MFS; employed in the investment area of MFS since 2001 |
Compensation
MFS’ philosophy is to align portfolio manager compensation with the goal to provide shareholders with long-term value through a collaborative investment process. Therefore, MFS uses long-term investment performance as well as contribution to the overall investment process and collaborative culture as key factors in determining portfolio manager compensation. In addition, MFS seeks to maintain total compensation programs that are competitive in the asset management industry in each geographic market where it has employees. MFS uses competitive compensation data to ensure that compensation practices are aligned with its goals of attracting, retaining, and motivating the highest-quality professionals.
MFS reviews portfolio manager compensation annually. In determining portfolio manager compensation, MFS uses quantitative means and qualitative means to help ensure a sustainable investment process. As of December 31, 2019, portfolio manager total cash compensation is a combination of base salary and performance bonus:
Base Salary – Base salary generally represents a smaller percentage of portfolio manager total cash compensation than performance bonus.
Performance Bonus – Generally, the performance bonus represents more than a majority of portfolio manager total cash compensation.
The performance bonus is based on a combination of quantitative and qualitative factors, generally with more weight given to the former and less weight given to the latter.
The quantitative portion is primarily based on the pre-tax performance of accounts managed by the portfolio manager over a range of fixed-length time periods, intended to provide the ability to assess performance over time periods consistent with a full market cycle and a strategy’s investment horizon. The fixed-length time periods include the portfolio manager’s full tenure on each fund and, when available, ten-, five-, and three-year periods. For portfolio managers who have served for less than three years, shorter-term periods, including the
one-year period, will also be considered, as will performance in previous roles, if any, held at the firm. Emphasis is generally placed on longer performance periods when multiple performance periods are available. Performance is evaluated across the full set of strategies and portfolios managed by a given portfolio manager, relative to appropriate peer group universes and/or representative indices (“benchmarks”). As of December 31, 2019, the following benchmarks were used to measure the following portfolio manager’s performance for the Fund:
| | | | |
Fund | | Portfolio Manager | | Benchmark(s) |
| MFS Intermediate Income Trust | | Geoffrey Schechter | | Bloomberg Barclays U.S. Intermediate Government/Credit Bond Index |
| | Alexander Mackey | | Bloomberg Barclays U.S. Intermediate Government/Credit Bond Index |
Benchmarks may include versions and components of indices, custom indices, and linked indices that combine performance of different indices for different portions of the time period, where appropriate.
The qualitative portion is based on the results of an annual internal peer review process (where portfolio managers are evaluated by other portfolio managers, analysts, and traders) and management’s assessment of overall portfolio manager contribution to the MFS investment process and the client experience (distinct from fund and other account performance).
The performance bonus is generally a combination of cash and a deferred cash award. A deferred cash award is issued for a cash value and becomes payable over a three-year vesting period if the portfolio manager remains in the continuous employ of MFS or its affiliates.
During the vesting period, the value of the unfunded deferred cash award will fluctuate as though the portfolio manager had invested the cash value of the award in an MFS Fund(s) selected by the portfolio manager.
MFS Equity Plan – Portfolio managers also typically benefit from the opportunity to participate in the MFS Equity Plan. Equity interests are awarded by management, on a discretionary basis, taking into account tenure at MFS, contribution to the investment process, and other factors.
Finally, portfolio managers also participate in benefit plans (including a defined contribution plan and health and other insurance plans) and programs available generally to other employees of MFS. The percentage such benefits represent of any portfolio manager’s compensation depends upon the length of the individual’s tenure at MFS and salary level, as well as other factors.
Ownership of Fund Shares
The following table shows the dollar range of equity securities of the Fund beneficially owned by the Fund’s portfolio manager(s) as of the Fund’s fiscal year ended October 31, 2020. The following dollar ranges apply:
N. None
A. $1 – $10,000
B. $10,001 – $50,000
C. $50,001 – $100,000
D. $100,001 – $500,000
E. $500,001 – $1,000,000
F. Over $1,000,000
| | |
Name of Portfolio Manager | | Dollar Range of Equity Securities in Fund |
Geoffrey Schechter | | N |
Alexander Mackey | | N |
Other Accounts
In addition to the Fund, each portfolio manager of the Fund is named as a portfolio manager of certain other accounts managed or sub-advised by MFS or an affiliate. The number and assets of these accounts were as follows as of the Fund’s fiscal year ended October 31, 2020:
| | | | | | | | | | | | | | | | | | | | | | | | |
| | | Registered Investment
Companies* | | | Other Pooled Investment
Vehicles | | | Other Accounts | |
Name | | Number of
Accounts | | | Total
Assets | | | Number of
Accounts | | | Total Assets | | | Number of
Accounts | | | Total Assets | |
Geoffrey Schechter | | | 14 | | | $ | 24.2 billion | | | | 4 | | | $ | 876.1 million | | | | 1 | | | $ | 256.8 million | |
Alexander Mackey | | | 16 | | | $ | 33.3 billion | | | | 4 | | | $ | 3.1 billion | | | | 5 | | | $ | 411.0 million | |
Advisory fees are not based upon performance of any of the accounts identified in the table above.
Potential Conflicts of Interest
MFS seeks to identify potential conflicts of interest resulting from a portfolio manager’s management of both the Fund and other accounts, and has adopted policies and procedures designed to address such potential conflicts.
The management of multiple funds and accounts (including proprietary accounts) gives rise to conflicts of interest if the funds and accounts have different objectives and strategies, benchmarks, time horizons and fees as a portfolio manager must allocate his or her time and investment ideas across multiple funds and accounts. In certain instances, there are securities which are suitable for the Fund’s portfolio as well as for accounts of MFS or its subsidiaries with similar investment objectives. MFS’ trade allocation policies may give rise to conflicts of interest if the Fund’s orders do not get fully executed or are delayed in getting executed due to being aggregated with those of other accounts of MFS or its subsidiaries. A portfolio manager may execute transactions for another fund or account that may adversely affect the value of the Fund’s investments. Investments selected for funds or accounts other than the Fund may outperform investments selected for the Fund.
When two or more clients are simultaneously engaged in the purchase or sale of the same security, the securities are allocated among clients in a manner believed by MFS to be fair and equitable to each. Allocations may be based on many factors and may not always be pro rata based on assets managed. The allocation methodology could have a detrimental effect on the price or volume of the security as far as the Fund is concerned.
MFS and/or a portfolio manager may have a financial incentive to allocate favorable or limited opportunity investments or structure the timing of investments to favor accounts other than the Fund, for instance, those that pay a higher advisory fee and/or have a performance adjustment and/or include an investment by the portfolio manager.
| ITEM 9. | PURCHASES OF EQUITY SECURITIES BY CLOSED-END MANAGEMENT INVESTMENT COMPANY AND AFFILIATED PURCHASERS. |
MFS Intermediate Income Trust
| | | | | | | | | | | | | | | | |
Period | | (a)
Total number
of Shares
Purchased | | | (b)
Average
Price
Paid per
Share | | | (c)
Total Number
of Shares
Purchased as
Part of Publicly
Announced
Plans or
Programs | | | (d) Maximum
Number (or
Approximate
Dollar Value) of
Shares that May
Yet Be Purchased
under the Plans
or Programs | |
11/01/19-11/30/19 | | | 0 | | | | N/A | | | | 0 | | | | 11,690,418 | |
12/01/19-12/31/19 | | | 0 | | | | N/A | | | | 0 | | | | 11,690,418 | |
1/01/20-1/31/20 | | | 0 | | | | N/A | | | | 0 | | | | 11,690,418 | |
2/01/20-2/28/20 | | | 0 | | | | N/A | | | | 0 | | | | 11,690,418 | |
3/01/20-3/31/20 | | | 821,294 | | | | 3.48 | | | | 821,294 | | | | 10,869,124 | |
4/01/20-4/30/20 | | | 152,358 | | | | 3.62 | | | | 152,358 | | | | 10,716,766 | |
5/01/20-5/31/20 | | | 0 | | | | N/A | | | | 0 | | | | 10,716,766 | |
6/01/20-6/30/20 | | | 0 | | | | N/A | | | | 0 | | | | 10,716,766 | |
7/01/20-7/31/20 | | | 0 | | | | N/A | | | | 0 | | | | 10,716,766 | |
8/01/20-8/31/20 | | | 0 | | | | N/A | | | | 0 | | | | 10,716,766 | |
9/01/20-9/30/20 | | | 0 | | | | N/A | | | | 0 | | | | 10,716,766 | |
10/1/20-10/31/20 | | | 0 | | | | N/A | | | | 0 | | | | 11,593,052 | |
| | | | | | | | | | | | | | | | |
Total | | | 973,652 | | | | 3.50 | | | | 973,652 | | | | | |
| | | | | | | | | | | | | | | | |
Note: The Board approved procedures to repurchase shares and reviews the results periodically. The notification to shareholders of the program is part of the semi-annual and annual reports sent to shareholders. These annual programs begin on October 1st of each year. The programs conform to the conditions of Rule 10b-18 of the Securities Exchange Act of 1934 and limit the aggregate number of shares that may be purchased in each annual period (October 1 through the following September 30) to 10% of the Registrant’s outstanding shares as of the first day of the plan year (October 1). The aggregate number of shares available for purchase for the October 1, 2020 plan year is 11,593,052.
| ITEM 10. | SUBMISSION OF MATTERS TO A VOTE OF SECURITY HOLDERS. |
There were no material changes to the procedures by which shareholders may send recommendations to the Board for nominees to the Registrant’s Board since the Registrant last provided disclosure as to such procedures in response to the requirements of Item 407 (c)(2)(iv) of Regulation S-K or this Item.
| ITEM 11. | CONTROLS AND PROCEDURES. |
| (a) | Based upon their evaluation of the registrant’s disclosure controls and procedures (as defined in Rule 30a-3(c) under the Investment Company Act of 1940 (the “Act”)) as conducted within 90 days of the filing date of this Form N-CSR, the registrant’s principal financial officer and principal executive officer have concluded that those disclosure controls and procedures provide reasonable assurance that the material information required to be disclosed by the registrant on this report is recorded, processed, summarized and reported within the time periods specified in the Securities and Exchange Commission’s rules and forms. |
| (b) | There were no changes in the registrant’s internal controls over financial reporting (as defined in Rule 30a-3(d) under the Act) that occurred during the period covered by the report that has materially affected, or is reasonably likely to materially affect, the registrant’s internal control over financial reporting. |
| ITEM 12. | DISCLOSURE OF SECURITIES LENDING ACTIVITIES FOR CLOSED-END MANAGEMENT INVESTMENT COMPANIES. |
During the fiscal year ended October 31, 2020, there were no fees or income related to securities lending activities of the Registrant.
| | |
| (a) | | (1) Any code of ethics, or amendment thereto, that is the subject of the disclosure required by Item 2, to the extent that the registrant intends to satisfy the Item 2 requirements through filing of an exhibit: Attached hereto as EX-99.COE. |
| |
| | (2) A separate certification for each principal executive officer and principal financial officer of the registrant as required by Rule 30a-2(a) under the Act (17 CFR 270.30a-2): Attached hereto as EX-99.302CERT. |
| |
| | (3) Any written solicitation to purchase securities under Rule 23c-1 under the Act (17 CFR 270.23c-1) sent or given during the period covered by the report by or on behalf of the registrant to 10 or more persons. Not applicable. |
| |
| | (4) Change in the registrant’s independent public accountant. Not applicable. |
| | |
(b) | | If the report is filed under Section 13(a) or 15(d) of the Exchange Act, provide the certifications required by Rule 30a-2(b) under the Act (17 CFR 270.30a-2(b)), Rule 13a-14(b) or Rule 15d-14(b) under the Exchange Act (17 CFR 240.13a-14(b) or 240.15d-14(b)) and Section 1350 of Chapter 63 of Title 18 of the United States Code (18 U.S.C. 1350) as an exhibit. A certification furnished pursuant to this paragraph will not be deemed “filed” for the purposes of Section 18 of the Exchange Act (15 U.S.C. 78r), or otherwise subject to the liability of that section. Such certification will not be deemed to be incorporated by reference into any filing under the Securities Act of 1933 or the Exchange Act, except to the extent that the registrant specifically incorporates it by reference. Attached hereto as EX-99.906CERT. |
| |
| (c) | | Proxy Voting Policies and Procedures pursuant to Item 7 of Form N-CSR. Attached hereto as EX-99.PROXYPOL. |
| |
| (d) | | Notices to Trust’s common shareholders in accordance with Investment Company Act Section 19(a) and Rule 19a-1. Attached hereto as EX-99.19a-1. |
Notice
A copy of the Amended and Restated Declaration of Trust of the Registrant is on file with the Secretary of State of the Commonwealth of Massachusetts and notice is hereby given that this instrument is executed on behalf of the Registrant by an officer of the Registrant as an officer and not individually and the obligations of or arising out of this instrument are not binding upon any of the Trustees or shareholders individually, but are binding only upon the assets and property of the respective constituent series of the Registrant.
SIGNATURES
Pursuant to the requirements of the Securities Exchange Act of 1934 and the Investment Company Act of 1940, the registrant has duly caused this report to be signed on its behalf by the undersigned, thereunto duly authorized.
| | |
| Registrant: | | MFS INTERMEDIATE INCOME TRUST |
| | |
| By (Signature and Title)* | | /S/ DAVID L. DILORENZO |
| | David L. DiLorenzo, President |
Date: December 16, 2020
Pursuant to the requirements of the Securities Exchange Act of 1934 and the Investment Company Act of 1940, this report has been signed below by the following persons on behalf of the registrant and in the capacities and on the dates indicated.
| | |
| By (Signature and Title)* | | /S/ DAVID L. DILORENZO |
| | David L. DiLorenzo, President |
| | (Principal Executive Officer) |
Date: December 16, 2020
| | |
| By (Signature and Title)* | | /S/ JAMES O. YOST |
| | James O. Yost, Treasurer |
| | (Principal Financial Officer |
| | and Accounting Officer) |
Date: December 16, 2020
| * | Print name and title of each signing officer under his or her signature. |