UNITED STATES
SECURITIES AND EXCHANGE COMMISSION
WASHINGTON, D.C. 20549
FORM 10-K
x | ANNUAL REPORT PURSUANT TO SECTION 13 OR 15(d) OF THE SECURITIES EXCHANGE ACT OF 1934 |
For the fiscal year ended December 31, 2012
o | TRANSITION REPORT PURSUANT TO SECTION 13 OR 15(d) OF THE SECURITIES EXCHANGE ACT OF 1934 |
For the transition period from to
Commission file number: 001-34867
UNITEK GLOBAL SERVICES, INC.
(Exact Name of Registrant as Specified in Its Charter)
Delaware |
| 75-2233445 |
(State or Other Jurisdiction of Incorporation or Organization) |
| (I.R.S. Employer Identification No.) |
1777 Sentry Parkway West
Gwynedd Hall, Suite 302
Blue Bell, Pennsylvania 19422
(Address of Principal Executive Offices)
(267) 464-1700
(Registrant’s Telephone Number, Including Area Code)
Securities Registered Pursuant to Section 12(b) of the Act: |
| Name of Each Exchange on Which Registered: |
Common Stock, par value $0.00002 per share |
| NASDAQ Stock Market |
(Title of Class) |
|
|
Securities Registered Pursuant to Section 12(g) of the Act: None
Indicate by check mark if the registrant is a well-known seasoned issuer, as defined in Rule 405 of the Securities Act. Yes o No x
Indicate by check mark if the registrant is not required to file reports pursuant to Section 13 or Section 15(d) of the Act. Yes o No x
Indicate by check mark whether the registrant: (1) has filed all reports required to be filed by Section 13 or 15(d) of the Securities Exchange Act of 1934 during the preceding 12 months (or for such shorter period that the registrant was required to file such reports) and (2) has been subject to such filing requirements for the past 90 days. Yes o No x
Indicate by check mark whether the registrant has submitted electronically and posted on its corporate Web site, if any, every Interactive Data File required to be submitted and posted pursuant to Rule 405 of Regulation S-T (§232.405 of this chapter) during the preceding 12 months (or for such shorter period that the registrant was required to submit and post such files).Yes o No x
Indicate by check mark if disclosure of delinquent filers pursuant to Item 405 of Regulation S-K (§229.405 of this chapter) is not contained herein, and will not be contained, to the best of the registrant’s knowledge, in definitive proxy or information statements incorporated by reference in Part III of this Form 10-K or any amendment to this Form 10-K. o
Indicate by check mark whether the registrant is a large accelerated filer, an accelerated filer, a non-accelerated filer, or a smaller reporting company. See the definitions of “large accelerated filer,” “accelerated filer” and “smaller reporting company” in Rule 12b-2 of the Exchange Act.
Large accelerated filer o |
| Accelerated filer o |
|
|
|
Non-accelerated filer o |
| Smaller reporting company x |
Indicate by check mark whether the registrant is a shell company (as defined in Rule 12b-2 of the Act). Yes o No x
The aggregate market value of the voting and non-voting common stock held by non-affiliates of the registrant based on the last reported sale price on June 29, 2012, was approximately $32,173,180.
As of August 7, 2013, 18,965,330 shares of the registrant’s Common Stock, par value $0.00002 per share, were outstanding.
DOCUMENTS INCORPORATED BY REFERENCE
None.
As used in this Annual Report on Form 10-K for the fiscal year ended December 31, 2012 (this “Form 10-K”), the terms “Company,” “our,” “us” or “we” refer to UniTek Global Services, Inc. and its subsidiaries.
On April 12, 2013, Unitek Global Services, Inc. (the “Company”) announced that it will restate financial results for the interim periods ended March 31, 2012, June 30, 2012 and September 29, 2012, the fiscal year ended December 31, 2011 and the interim period ended October 1, 2011.
In its announcement, the Company noted that, as a result of an internal investigation conducted by the Audit Committee of the Company’s Board of Directors with the assistance of outside independent counsel and a forensic accounting firm, it was determined that several employees of the Company’s Pinnacle Wireless division engaged in fraudulent activities that resulted in improper revenue recognition. As a result of the revenue recognition issues, the Audit Committee concluded, after consultation with Ernst & Young LLP (“Ernst & Young”), the Company’s independent registered public accounting firm, that the Company’s previously issued consolidated financial statements as of and for the interim periods ended March 31, 2012, June 30, 2012 and September 29, 2012, the fiscal year ended December 31, 2011 and the interim period ended October 1, 2011 should no longer be relied upon. Similarly, Ernst & Young’s previously issued reports on the consolidated financial statements for the fiscal year ended December 31, 2011, including the effectiveness of internal control over financial reporting as of December 31, 2011, should no longer be relied upon.
Subsequently, on June 11, 2013, the Audit Committee determined that, due to the revenue recognition issues, the Company’s previously issued consolidated financial statements as of and for the periods ended July 2, 2011 should no longer be relied upon. The Company filed a Current Report on Form 8-K on June 14, 2013 disclosing the Audit Committee’s determination, and also disclosing that the Company was in the process of reviewing the carrying value of the goodwill, identified intangible assets and contingent consideration recorded in its Engineering and Construction segment, which includes the business acquired in the Company’s 2011 acquisition of substantially all of the assets of Pinnacle Wireless, Inc. and Current Flow Technologies Corporation.
As a result of the foregoing, the Company has restated, and included in this report, financial information as of and for the interim periods ended July 2, 2011, October 1, 2011, March 31, 2012, June 30, 2012 and September 29, 2012, and as of and for the interim period and year ended December 31, 2011.
In addition, as a result of the above-described revenue recognition issues, the Company assessed the internal control deficiencies that compromised the Company’s ability to prevent or detect the revenue recognition issues. Specifically, as identified in “Part II, Item 9A,- Controls and Procedures” in this Form 10-K, the Company has identified deficiencies in the processes, procedures and controls related to (i) entity level monitoring controls over the Pinnacle Wireless division; (ii) internal audit monitoring controls for the investigation and reporting of significant matters to the Audit Committee and the Board of Directors; (iii) revenue and cost recognition under the percentage-of-completion method of accounting; and (iv) maintaining sufficient experienced accounting personnel. These deficiencies, which prevented the timely detection of misconduct by certain Pinnacle Wireless division employees, the correction of accounting misstatements and the reporting to our Chief Executive Officer and other members of the Board of Directors of the revenue recognition issues, constituted material weaknesses. In this regard, management evaluated the effectiveness of the Company’s internal control over financial reporting as of December 31, 2012 based on the framework in “Internal Control-Integrated Framework” issued by the Committee of Sponsoring Organizations of Treadway Commission (COSO). As a result of the material weaknesses referenced above, management concluded that the Company did not maintain effective internal control over financial reporting as of December 31, 2012. The Company has instituted and will continue to institute steps to remediate the material weaknesses.
For further information regarding the material weaknesses identified by management and management’s plan to remediate the material weaknesses, see “Part II, Item 9A, — Controls and Procedures” in this Form 10-K.
The Company is including in the restated financial statements, corrections of additional errors related to revenue recognition, as well as errors relating to certain other items. See Notes 2 and 21 to the consolidated financial statements included in this report for additional information.
The following table summarizes the financial statements and related financial information that is restated in this report, as well as the location of the financial statements and related information.
Type of Financial Information |
| Restated Periods |
| Location |
|
|
|
|
|
Selected financial data |
| As of and for the year ended December 31, 2011 |
| Part II, Item 6, Selected Financial Data |
Consolidated financial statements and notes thereto |
| As of and for the year ended December 31, 2011 |
| Part II, Item 8, Financial Statements and Supplementary Data |
Unaudited quarterly financial information |
| Quarterly and year-to-date periods ended and as of September 29, 2012, June 30, 2012, March 31, 2012, October 1, 2011 and July 2, 2011 and quarterly period ended December 31, 2011 |
| Part II, Item 8, Financial Statements and Supplementary Data |
Condensed consolidated financial statements and notes thereto |
| As of and for the interim periods ended July 2, 2011, October 1, 2011, March 31, 2012, June 30, 2012, and September 29, 2012 |
| Part II, Item 8, Financial Statements and Supplementary Data |
Management’s discussion and analysis of financial condition and results of operations |
| Covering all restated periods described above |
| Part II, Item 7, Management’s Discussion and Analysis of Financial Condition and Results of Operations |
The following table summarizes the impact of the aforementioned errors to the restated periods:
|
| Three Months Ended |
| ||||||||||||||||
(in thousands, except per share amounts) |
| September 29, |
| June 30, |
| March 31, |
| December 31, |
| October 1, |
| July 2, |
| ||||||
|
| (Unaudited) |
| (Unaudited) |
| (Unaudited) |
| (Unaudited) |
| (Unaudited) |
| (Unaudited) |
| ||||||
Favorable (unfavorable) impact to: |
|
|
|
|
|
|
|
|
|
|
|
|
| ||||||
Revenues |
| $ | (1,711 | ) | $ | (1,894 | ) | $ | (6,558 | ) | $ | (3,051 | ) | $ | (2,496 | ) | $ | (1,054 | ) |
Gross profit |
| (47 | ) | (2,366 | ) | (4,504 | ) | (3,070 | ) | (1,941 | ) | (914 | ) | ||||||
Income or expense related to contingent consideration |
| — |
| (2,067 | ) | (8,734 | ) | (989 | ) | 13,095 |
| — |
| ||||||
Income or loss from continuing operations |
| (554 | ) | (4,886 | ) | (13,192 | ) | (3,472 | ) | 11,250 |
| (1,346 | ) | ||||||
Net income or loss per share from continuing operations |
| (0.03 | ) | (0.26 | ) | (0.80 | ) | (0.21 | ) | 0.69 |
| (0.08 | ) | ||||||
(in thousands, except per share amounts) |
| Nine Months |
| Six Months |
| Three Months |
| Year Ended |
| Nine Months |
| Six Months |
| ||||||
|
| (Unaudited) |
| (Unaudited) |
| (Unaudited) |
|
|
| (Unaudited) |
| (Unaudited) |
| ||||||
Favorable (unfavorable) impact to: |
|
|
|
|
|
|
|
|
|
|
|
|
| ||||||
Revenues |
| $ | (10,163 | ) | $ | (8,452 | ) | $ | (6,558 | ) | $ | (6,601 | ) | $ | (3,550 | ) | $ | (1,054 | ) |
Gross profit |
| (6,917 | ) | (6,870 | ) | (4,504 | ) | (5,925 | ) | (2,855 | ) | (914 | ) | ||||||
Income or expense related to contingent consideration |
| (10,801 | ) | (10,801 | ) | (8,734 | ) | 12,106 |
| 13,095 |
| — |
| ||||||
Income or loss from continuing operations |
| (18,632 | ) | (18,078 | ) | (13,192 | ) | 6,432 |
| 9,904 |
| (1,346 | ) | ||||||
Net income or loss per share from continuing operations |
| (1.04 | ) | (1.03 | ) | (0.80 | ) | 0.41 |
| 0.63 |
| (0.09 | ) | ||||||
For further information, see Notes 2 and 21 to the consolidated financial statements included in this report.
The Company has not filed and does not intend to file amendments to its quarterly reports or annual report for the applicable periods covered by the restatements. Accordingly, you should rely only on the financial information and other disclosures regarding the periods subject to the restatements in this Form 10-K or in future SEC filings or Company press releases (as applicable), and not on any previously issued or filed reports, earnings releases or similar communications relating to these periods.
CAUTIONARY STATEMENT REGARDING FORWARD-LOOKING STATEMENTS
Statements contained in this Annual Report on Form 10-K (“Form 10-K”), including but not limited to those under the headings “Business,” “Risk Factors,” “Legal Proceedings” and “Management’s Discussion and Analysis of Financial Condition and Results of Operations,” contain forward-looking statements within the meaning of the Private Securities Litigation Reform Act of 1995, and are subject to the safe harbor created by that Act. Such forward-looking statements are based upon assumptions by management, as of the date of this Report, including assumptions about risks and uncertainties faced by the Company. These forward-looking statements can be identified by the use of such words as “anticipate,’’ “believe,’’ “could,’’ “estimate,’’ “expect,’’ “intend,’’ “may,’’ “plan,’’ “predict,’’ “project,’’ “should,’’ “would,’’ “is likely to,’’ or “is expected to’’ and other similar terms. They may include comments about liquidity, potential transactions, competition within the our industry, concentration of customers, loss of customers, long-term receivables, availability of capital, legal proceedings, fluctuation in interest rates, governmental regulations, and other statements contained herein that are not historical facts.
There are numerous risks and uncertainties that could cause actual results and the timing of events to differ materially from those anticipated by the forward-looking statements in this Form 10-K. Such risks and uncertainties may give rise to future claims and increase our exposure to contingent liabilities. These risks and uncertainties arise from (among other factors):
· difficulty that we may have in correcting our improper accounting practices identified by the internal investigation conducted by the Audit Committee (the “Audit Committee Investigation”) that necessitated our making restatement adjustments in our consolidated financial statements and have resulted in our inability to timely file required periodic reports with the Securities and Exchange Commission (“SEC”);
· the substantial accounting, legal and other expenses resulting from the Audit Committee Investigation and the restatement of our financial reports;
· the outcome of legal proceedings to which we are or may become a party, including a class action law suit described in the “Legal Proceeding” section, if not fully covered by insurance;
· the potential for additional litigation and governmental enforcement action resulting from the improper accounting practices;
· our disclosure controls and procedures, which were ineffective as of December 31, 2012, because of the material weaknesses in our internal control over financial reporting described in this Form 10-K;
· our use of the percentage-of-completion method to account for revenue is subject to assumptions and variations of actual results from our assumptions may reduce our profitability;
· our continued ability to service our corporate indebtedness;
· our ability to comply with the financial covenants under our debt agreements including maintaining certain ratios between earnings and debt;
· the uncertainty regarding the adequacy of capital resources, including liquidity, and potential limited access to additional financing;
· our success of converting unbilled receivables to invoices and collecting on such invoices;
· a potential increase in our insurance premiums or collateral requirements;
· general economic or business conditions nationally and in our primary markets;
· the consolidation of our vendors, customers and competition;
· approximately 75% of our revenue for 2012 was received from our three largest customers, including 43% from our largest single customer;
· our ability to maintain the listing of our Common Stock on a national securities exchange;
· our ability to generate future revenues and/or earnings and our ability to manage and control costs;
· the actions of competitors within our industry;
· our ability to meet changing technologies;
· the success of business strategies that we implement; and
· the retention of key employees including skilled technicians and financial staff.
If any of our assumptions prove incorrect or should unanticipated circumstances arise, our actual results could differ materially from those anticipated by such forward-looking statements. The differences could be caused by a number of factors or combination of factors, including, but not limited to, those factors described directly above and under Part I, Item 1A (Risk Factors). Readers are strongly encouraged to consider these factors when evaluating any such forward-looking statements. The Company undertakes no obligation to publicly revise or update such forward-looking statements, except as required by law.
Overview
UniTek Global Services, Inc. (“UniTek” and together with its subsidiaries, the “Company”) is a leading full-service provider of permanently outsourced infrastructure services, offering an end-to-end suite of technical services to customers in the satellite television, wireless telecommunications, public safety, and broadband cable industries in the United States and Canada. The Company’s customers, which are primarily satellite television, telecommunications, and broadband cable companies, municipalities and related agencies, utilize its services to build and maintain their infrastructure and networks and to provide residential and commercial fulfillment services. These services are critical to the Company’s customers’ ability to deliver voice, video and data services to their end users.
The Company’s common stock is currently quoted on the NASDAQ Stock Market under the symbol “UNTK.” The Company is a Delaware corporation with its principal executive offices at 1777 Sentry Parkway West, Gwynedd Hall, Suite 302, Blue Bell, Pennsylvania 19422 and its telephone number is 267-464-1700. The Company operates through its direct and indirect subsidiaries: DirectSat USA, LLC, headquartered in King of Prussia, Pa., which provides fulfillment installation services for DIRECTV, LLC. (“DIRECTV”), the country’s largest satellite television provider; FTS USA, LLC, with locations primarily throughout the South, which provides fulfillment services to the cable industry as well as construction services; Pinnacle Wireless USA, Inc. (“Pinnacle”), headquartered in Fair Lawn, NJ, which provides turnkey solutions for its customers’ entire wireless systems; and Wirecomm Systems, Inc., operating in Canada, which provides fulfillment services to the cable industry in Canada.
As noted above in the “Explanatory Note”, in the first quarter of 2013, the Audit Committee of the Company’s Board of Directors undertook an investigation into the Company’s accounting practices relating to its application of percentage-of-completion accounting (the “Audit Committee Investigation”) and on April 12, 2013 and June 13, 2013, announced that the Company’s previously issued consolidated financial statements as of and for the interim periods ended March 31, 2012, June 30, 2012, and September 29, 2012 (the “2012 Fiscal Quarters”), the interim periods ended July 2, 2011 and October 1, 2011 (the “2011 Fiscal Quarters”) and the fiscal quarter and year ended December 31, 2011 should no longer be relied upon. As further noted in the Explanatory Note, this Annual Report on Form 10-K (the “Form 10-K”) presents certain historical financial information on a restated basis based on the findings from the Audit Committee Investigation and the Company’s evaluation of its accounting for percentage-of-completion revenue among other matters under generally accepted accounting principles (“GAAP”).
At December 31, 2012, our liquidity consisted primarily of cash of $3.8 million and availability under our revolving credit facility of $12.9 million. The events of default under our debt agreements for periods in 2011 and 2012 resulted in significant changes to the terms of those agreements, resulting in higher financing costs in 2013 and beyond. Our revolving credit facility was refinanced in July 2013 at an interest rate that was higher than the prior agreement and required us to pay additional fees and costs. However, this facility also increased our availability for borrowings by $20 – $30 million during 2013. Our term loan was amended in July 2013, resulting in a waiver of prior defaults for periods in 2011 and 2012 and providing additional cushion for our financial covenants, which we believe will allow us to maintain compliance for the foreseeable future. However, the amendment also resulted in higher interest rates as well as additional fees (some of which are noncash) that will impact our future liquidity. Additionally, the following other trends are expected to impact our liquidity:
· The need to improve our management of working capital within our wireless construction business, which if not managed well could require us to borrow additional amounts, which could reduce our profitability, or cause us to become ineligible for new borrowings or default on our debt, or both;
· Our ability to remain listed on a public stock exchange, which can allow us to access equity and debt capital on more favorable terms than in private markets;
· Our ability to pay our vendors timely and retain key subcontractors for future work; and
· The timing of our payment of the final portion of an earn-out in connection with a previously completed acquisition, pursuant to the terms of the purchase agreement and an ancillary agreement.
Background
The Company strives to be a fully integrated partner that its customers rely on for the best solutions, service and value. To achieve this performance standard, the Company has developed a harmonized set of technology-enabled, real-time monitoring and reporting capabilities, which it refers to as its Premium Real-time Operating System, or PROS. The Company relies on PROS to provide detailed, real-time reports on various performance metrics. We believe this enables management to respond rapidly to optimize operational performance and achieve operational excellence.
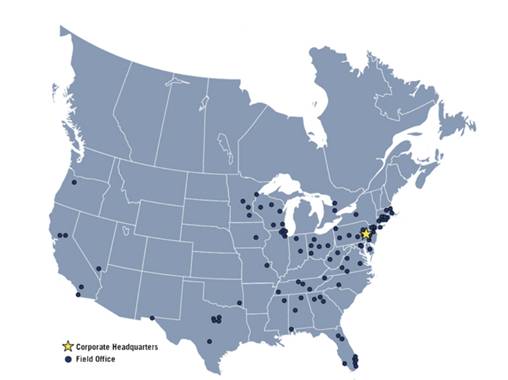
As of December 31, 2012, the Company’s operations included approximately 90 field offices as illustrated in the following map:
The Company reports its results in two segments based on the services that it provides and the industries that it serves. The Company’s Fulfillment segment provides comprehensive installation and fulfillment services to customers in the satellite television and broadband cable industries. Revenues in this segment are primarily recurring in nature and based on predetermined rates for each type of service performed. The Company’s Engineering and Construction segment provides infrastructure services, systems integration for public safety and land mobile radio applications, construction and project management services to customers in the wireless telecommunications and public safety industries. Revenues in this segment are primarily contract-based and are recognized primarily using the percentage-of-completion method using certain estimated costs incurred to-date or milestones achieved to measure progress towards completion.
For the fiscal years 2012, 2011 and 2010, the Company had revenues of $437.6 million, $351.5 million and $345.5 million, respectively, representing year over year growth of 24.5% and 1.7%, respectively.
Company History; General
In January 2010, the Company entered into a merger agreement with Berliner Communications, Inc. (“Berliner”) pursuant to which we became a wholly owned subsidiary of Berliner (the “Merger”). For accounting purposes, the Company was considered the accounting acquirer, but the Merger was structured so that Berliner was the surviving entity. The Company subsequently changed Berliner’s name to UniTek Global Services, Inc.
In November 2010, the Company completed an underwritten public offering of 9.5 million shares of common stock at a price of $9.50 per share, plus an additional 225,284 shares of common stock at $9.50 per share on December 6, 2010 in connection with the partial exercise of the underwriters’ over-allotment option. After deducting underwriting fees and offering costs, the Company generated net proceeds of approximately $84.4 million, which was used to repay indebtedness and support the growth of its business.
In April 2011, the Company completed the acquisition of substantially all of the assets of Pinnacle Wireless, Inc. Pinnacle specializes in large-scale communications projects for transportation, public safety, entertainment, hospitality and enterprise-grade commercial real estate, which expanded the Company’s presence in the two-way radio and wireless communications systems integration markets.
In September 2012, the Company entered into an asset purchase agreement to purchase substantially all of the assets of Skylink LTD (“Skylink”) relating to its business of conducting video, internet and multi-dwelling unit fulfillment and installation for satellite television companies in various markets in Indiana, Ohio and West Virginia.
In December 2012, the Company entered into an agreement to sell substantially all of the assets of its wireline telecommunications business unit to NX Utilities, LLC (“NX Utilities”). The closing occurred in two stages; the first stage occurred on December 28, 2012, and the second stage occurred on March 2, 2013. With this sale, the Company exited the wireline telecommunications construction market, enabling the Company to focus on its core wireless and fulfillment markets.
Industry
The Company operates in the permanently outsourced infrastructure services industry. The Company’s customers are leading media and telecommunication companies and large municipalities in the wireless telecommunications, public safety, satellite television and broadband cable industries in the United States and Canada. Customers in these industries have historically outsourced a significant portion of their fulfillment, engineering, construction and maintenance requirements in order to reduce their investment in capital equipment, to provide flexibility in workforce sizing and to focus on their core competencies, thereby creating a large market for permanently outsourced infrastructure service providers such as the Company. The Company believes the following trends will impact the industry:
Faster Technology Upgrade Cycles — The evolution of technology has become more rapid, creating demand for increasingly faster and more robust voice, video and data services. To support these next generation services, communication service providers have been investing a significant amount of capital to increase the capacity and performance of their data networks. In addition, technologies such as Long-Term Evolution (“LTE”), Distributed Antenna Systems (“DAS”) and Worldwide Interoperability for Microwave Access are being developed to support the proliferation of increasingly data-intensive mobile devices such as smart phones, laptops and tablets. Similarly, broadband cable and satellite television companies continue to develop differentiating technologies supporting services such as high-definition television, digital video recorders and video-on-demand, all of which require enhanced data transfer capabilities. Providers of these services have historically outsourced the design, construction and maintenance of their networks to third parties in order to minimize their fixed costs and number of employees. As these providers roll-out new technologies and capabilities, the Company believes the demand for permanently outsourced infrastructure services will increase. To achieve a high performance standard, the Company has developed a harmonized set of technology-enabled, real-time monitoring and reporting capabilities, which the Company refers to as its Premium Real-time Operating System, or PROS. The Company relies on PROS to provide detailed, real-time reports on various performance metrics. The Company believes this enables management to respond rapidly to optimize operational performance and achieve operational excellence.
Vendor Consolidation — Broadband cable service providers and other telecommunication companies are consolidating their vendor bases in order to benefit from the accountability, scale and higher performance standards that a smaller number of fully-integrated service partners can provide. The Company believes that this trend, although at differing stages among its customers, will provide the Company opportunities for substantive growth, even if the end user market for its customers’ services is or becomes saturated. The Company expects that its investments in technology and infrastructure and its ability to scale its operations will position it as a logical partner for its customers as this trend continues, as well as an attractive alternative for other telecommunication companies that are searching for better performing service partners.
Wireless Telecommunications Industry Trends — Use of wireless telecommunications has grown rapidly, driven by the dramatic increase in wireless telephone usage, along with strong demand for wireless Internet and other data services. In the United States, CTIA — The Wireless Association estimates that as of June 2012, there were 321.7 million U.S. mobile phone subscriber connections using 2.4 trillion annualized minutes. Over the past several years, there has been increased convergence of services driven by the proliferation of 3G networks and the roll-out of 4G LTE networks. The communications industry is facing rising demand for current and future services. Providers are reporting that data traffic, including Web access, video messaging and other services, has begun to outpace voice traffic. With the continued proliferation of smart phones, more subscribers are accessing the Internet via mobile devices. The study indicates that mobile data traffic is expected to increase 26 times from 2010-2015, which is indicative of smartphone and 4G LTE handset penetration. The Company believes that the opportunity for growth is significant, with the telecommunications industries constantly releasing upgrades and new products. These network upgrades require increased design, construction, maintenance and repair services, a substantial portion of which the Company expects will be provided by permanently outsourced infrastructure service providers.
Public Safety Industry Trends — The Company believes that growth in the deployment of networks and infrastructure for public safety and municipal wireless systems is being driven by, among other things, security and safety concerns arising from terrorism threats, natural disasters and other emergencies, and the critical interoperability needs of first responders and other responsible parties. The substantive growth in this market is being driven by both small municipal projects and large comprehensive projects. Small municipal projects can encompass any of a number of improvements in the areas of dispatch, radio or wireless infrastructure and can range between $1 million to $10 million. Large comprehensive projects can include projects such as the World Trade Center Transportation Hub Site project, which is intended to let police, fire and other emergency personnel talk to each other in the event of a major catastrophe, such as a terrorist attack or an earthquake.
Services
The Company is a leading full-service provider of permanently outsourced infrastructure services, offering an end-to-end suite of technical services to its customers in the wireless telecommunications, public safety, satellite television and broadband cable industries in the United States and Canada. Our services include:
Comprehensive Installation and Fulfillment — The Company is a full-service provider of residential and commercial installation services to the satellite television and broadband cable industries. The Company provides regional fulfillment services including inventory warehousing and logistics, customer service and call center management, fleet management and risk and safety compliance. The Company has developed innovative, leading-edge technologies and processes to manage its daily operations and improve upon existing work processes. In many of our markets, the Company is the exclusive provider of installation and fulfillment services to its customers.
Construction and Project Management — The Company is a full-service provider to the broadband cable and wireless telecommunication industries of project management and construction services, including systems engineering and project management. The Company offers 24-hours-a-day, 7-days-a-week and 365-days-a-year maintenance and upgrade support to its customers. The Company’s comprehensive service offerings include the regular maintenance of its customers’ distribution facilities and networks, as well as emergency services for accidents or storm damage. The Company’s upgrade work ranges from routine replacements and upgrades to major network overhauls. The Company’s scalable platform supports both large scale, as well as small project management services on a variety of advanced technology projects.
Wireless Telecommunications Infrastructure Services — The Company provides outsourced project management, construction and infrastructure services to wireless telecommunication companies nationwide. The Company’s core activities include communications infrastructure equipment construction and installation, radio frequency and network design and engineering, radio transmission base station installation and modification, and in-building network design, engineering and construction. Additionally, the Company provides site acquisition services where the Company acts as an intermediary between its customers and property owners and facilitates the wireless site preparation process from selection through construction. In order to build and expand networks, telecommunications companies require locations that have direct access to highways and roads to mount their antennae and equipment. The Company identifies appropriate properties, negotiates the transactions and handles the administrative details facilitating the eventual construction or augmentation of a wireless communication equipment site. The Company’s accumulated knowledge and relationships assist in the planning and installation of the telecommunication facilities while expediting the acquisition of necessary permits, entitlements and approvals that are required by various municipalities.
Wireless Systems Integration for Public Safety and Land Mobile Radio Applications — The Company specializes in systems integration services for large-scale communications projects for transportation, public safety, entertainment, hospitality and enterprise-grade commercial real estate projects. The Company operates as a turnkey solutions provider for wireless system upgrades by integrating the radio system design, the in-building antenna network, and the command and control systems that include all subsystems such as spectrum, fiber networks, voice logging and GPS. The Company is currently handling a number of smaller projects for police, fire and other emergency personnel that are critical to the public’s safety and is also handling the World Trade Center Transportation HUB Site project, which is intended to let police, fire and other emergency personnel talk to each other in the event of a major catastrophe, such as a terrorist attack or an earthquake.
Competitive Strengths
The Company’s competitive strength is based on its focus on operational excellence in the field, which is driven by its shared services platform, its commitment to technology and its outstanding people. The Company expects to continue to differentiate itself in its chosen markets by leveraging its technician management expertise enabled with the following:
Operational Excellence — The Company’s operating philosophy promotes a culture of visibility and accountability, using balanced scorecards to achieve operational efficiencies and surpassing each customer’s performance expectations. In an industry where substantial operational complexity exists, including thousands of daily service visits, millions of dollars of equipment procured and installed every month, and over 10,000 calls daily into call centers, the Company’s operational approach has allowed it to achieve what it believes is superior operating performance. Combined with the Company’s shared services platform, its Premium Real-time Operating System, or PROS, enhances its operational execution by creating real-time accountability through the rapid detection and correction of operational issues that could potentially impact performance, productivity and profitability. The Company’s solution provides management and field personnel instantaneous operating and financial reports focused on “event management” parameters and metrics that promulgate prompt, corrective actions. In comparison to industry standards, in which infrequent and minimally analyzed reviews and reports are common, the Company capitalizes on its shared services model and PROS technology to ensure frequent, regular and meticulously reviewed reports, which result in cost minimization, increased worker productivity and efficient business practices.
Fully Integrated Solutions Provider — As the communications market continues to evolve due to high bandwidth driven applications, the demands from consumers continually increase. As a result, these industry segments will need service providers that can bridge emerging technologies in the wireless telecommunications marketplace. The Company intends to leverage its wireless turn-key services to capitalize on its customers’ capital spending across a diverse footprint of technologies. The Company believes that its ability to leverage its expertise in many communications technologies provides it with a competitive advantage, as the Company’s customers have build-out plans that require this expertise as their services converge.
Large Market Footprint and Strong Customer Relationships — The Company has achieved significant scale and strong customer relationships in each of the industries in which it competes. As of December 31, 2012, the Company’s operations included approximately 90 field offices and approximately 3,600 full-time employees. The Company’s customers include leading media and telecommunication companies such as DIRECTV, AT&T, Clearwire Communications, Ericsson, Sprint, T-Mobile, Comcast, Charter Communications, Time Warner Cable and Rogers Communications. The Company believes its experience, technical expertise, geographic reach and size are important to its customers and allow it to effectively bid for large-scale contracts. This continues to be a key focus area as the Company expands its services offerings across all platforms geographically.
Technical Expertise and Quality Customer Service Supported by Technology Deployment— The Company believes that the strength of its customer relationships is a direct result of its leading customer service and technical expertise. The Company has deployed technology platforms that create real-time visibility and accountability, detect potential operational issues and allow multiple levels of employees to interact seamlessly. Additionally, this technology allows it to leverage centralized shared services for the efficient monitoring and management of operations. The Company believes its reputation for excellent quality, customer service and technical expertise gives it an advantage in competing for new contracts, as well as in maintaining and extending its current customer relationships.
Strong Management Team — The Company’s management team, which includes its executive officers and divisional leaders, plays a significant role in establishing and maintaining relationships with its customers, supporting the growth of its business and managing the financial aspects of its operations. Although there has been turnover among certain executive staff, the Company’s management team includes key employees with significant industry experience and a deep understanding of its customers and their performance requirements.
Strategy
The key elements of the Company’s business strategy are:
Execute on Existing Orders — We continue to work closely with our customers to ensure that we execute on our contracts at a performance level that exceeds their requirements. In addition, we intend to improve our shared services platform to ensure that we execute our existing orders in a highly profitable, efficient manner.
Expand and Diversify — The Company is focused on growing and diversifying its order base by increasing its relationships with existing customers and by building relationships with new customers. The Company offers its customers a full range of outsourced infrastructure services, including wireless telecommunications infrastructure services, wireless system integration for public safety and land mobile radio applications, construction and project management, and comprehensive installation and fulfillment. In many cases, its customers only utilize a portion of the potential services that we can provide. We plan to continue to leverage our reputation for quality and service together with our differentiated technological capabilities to win new contracts from our existing and new customers.
Increase Efficiency through Continued Deployment of Technology — We continually deploy technology solutions in order to more effectively and profitably manage our operations and to offer our customers customized solutions for their project needs. PROS is a highly customized, web-based, real-time communications tool that provides rapid insight into our business and customized solutions to our customers’ information needs from project documentation to real-time status updates. In addition, we capture data generated in the field by our technicians and analyze trends in performance, safety, training and service delivery to maximize our operational efficiency across our product and service offerings. Productivity projects and a continuous improvement methodology in operations are designed to reinforce this improvement year-over-year.
Differentiate Through a Skilled, Cross-Trained, In-House Workforce — Through the recruiting and development of a skilled workforce, we expect to continue to provide our customers with strong service levels, speed to market and overall flexibility in geographic expansion. The ability to cross-train and leverage our workforce infrastructure creates a platform of sustainable advantages that empowers us to rapidly expand our services within our current customer base. We plan to enhance our workforce through continued investment in training, technology platforms and career development to become an employer of choice in all industries we serve.
Customers
Our customers utilize our services to build and maintain their infrastructure and networks and to provide residential and commercial fulfillment services. These services are critical to our customers’ ability to deliver voice, video and data services to their end users. Our customers include leading media and telecommunication companies such as DIRECTV, AT&T, Comcast, Clearwire Communications, Ericsson, Sprint, T-Mobile, Charter Communications, Time Warner Cable and Rogers Communications.
We have longstanding relationships with many customers, and a large portion of our revenue is derived from work performed under master service agreements or other such service agreements. Work performed under master service or other service agreements is typically generated by work orders, each of which is performed for a fixed fee under unit-based pricing. The majority of these services are for installation, upgrade and service work performed within our Fulfillment segment, as well as maintenance agreements within the Engineering and Construction segment. As described below, the term of such master service agreements or other such service agreements varies as does the right of the customer to either terminate the contract, with or without cause, or not issue future work orders.
The remainder of our work is generated pursuant to contracts for specific projects that may require construction, engineering or management services for a variety of broadband cable and wireless telecommunications projects. Customers are billed with varying frequency: weekly, monthly or upon attaining specific milestones.
The following table presents customer concentration information as a percentage of revenues:
|
| Year Ended December 31, |
|
|
| ||||
|
| 2012 |
| 2011 |
| 2010 |
| Primary Segment |
|
Revenues from top 10 customers |
| >90 | % | >90 | % | >90 | % |
|
|
Revenues from significant customers: |
|
|
|
|
|
|
|
|
|
DIRECTV |
| 43 | % | 56 | % | 55 | % | Fulfillment |
|
AT&T |
| 17 | % | 1 | % | — |
| Engineering & Construction |
|
Comcast |
| 15 | % | 17 | % | 17 | % | Fulfillment |
|
DIRECTV - DIRECTV is the largest provider of satellite television services in the United States. Our relationship with DIRECTV is based upon a Home Service Provider (“HSP”) Agreement to provide installation and service of DIRECTV video programming for DIRECTV subscribers. These video subscribers are owned and billed by DIRECTV, and we function as a fulfillment arm for DIRECTV in the specific markets specified in the HSP Agreement. The current HSP Agreement was signed in October 2012 and has a four-year term. The contract provides that DIRECTV may terminate its contract upon 180 days’ notice to the Company with or without cause.
On May 16, 2013 the Company announced that its subsidiary, DirectSat USA, LLC, had received a letter from DIRECTV providing the requisite 180-day notice of the termination of its master services agreement with DirectSat, effective November 8, 2013. Shortly following receipt of the notice, DirectSat entered into an agreement with DIRECTV providing that the 180-day notice of termination would be automatically withdrawn upon the Company’s refinancing, by July 31, 2013, of its debt on terms that satisfy certain requirements including $10 million of liquidity, the continued work on completion of its consolidated financial statements and the satisfaction of other conditions. As a result of the Revolving Loan refinancing and Term Loan Amendment the Company consummated in July 2013, these conditions had been satisfied. On July 25, 2013, DIRECTV formally withdrew its notice of termination after the Company notified it that the Company had satisfied all conditions requested.
AT&T - Our relationship with AT&T is based upon construction and installation contracts under a master service agreement covering specified geographic regions (the “Turf Agreement”). Under the Turf Agreement, we provide project management services to evaluate sites, construct towers, install equipment and perform quality control services for AT&T’s wireless infrastructure. The Turf Agreement has a three-year term and was awarded in the fourth quarter of 2011. Although the contract provides that notice must be given before cancellation in the event of a breach of contract, the contract does not mandate any level of work orders and the Company was recently advised that AT&T had significantly lowered the estimated amount of services relating to tower modification that it would be requesting from the Company. It is expected that the impact of the AT&T reduction will be approximately $21 million in revenue.
Comcast - Comcast is the largest provider of video programming, broadband Internet, telephone and home security systems in the United States. Our relationship with Comcast is based upon historical multiple regional contracts to provide fulfillment services, primarily to residents of single family homes. These video subscribers are customers of and billed by Comcast, and we function as a fulfillment arm for Comcast in the specific markets specified in the agreements. In these markets, Comcast also utilizes other contractors and their own technicians to provide these services. Our agreements range in duration from one to two years and typically are renewed each year with Comcast having the right to terminate the contracts, for cause, with 30 days’ notice.
Backlog
Our backlog was approximately $154 million as of December 31, 2012 and $125 million as of December 31, 2011. We expect to realize over 80% of the existing backlog in fiscal 2013. The backlog at December 31, 2012 was composed of services to be performed under existing master service agreements and long-term contracts for the Engineering and Construction segment. We have not included estimated work orders related to our Fulfillment segment.
Sales and Marketing
Our work is awarded to us directly or we are provided with opportunities to bid on new projects based upon our competencies and performance. We market our services through our individual business units’ names and service marks. We do this in order to maximize the branding and name recognition of each business in their respective industries.
We employ a sales and marketing team who respond to new opportunities as they are identified. We internally process customer requests for proposals as procured by our sales and marketing team. Through our proprietary systems, we track opportunities and respond based upon our resources, financial criteria and overall strategic objectives of the Company.
Safety and Risk Management
The safety of our workforce is a core value and remains a top priority above all. Our culture requires safe work habits from all employees and has developed processes, scorecards and training to continuously heighten awareness. We require our employees to participate in internal training and service programs relevant to their employment and to complete any training programs required by law to perform their jobs. We evaluate employees in part based upon their safety records and the safety records of the employees they supervise. We have established a Company-wide safety program to share best practices and to monitor and improve compliance with safety procedures and regulations. The risk management group reviews accidents and claims for our operations, examines trends and implements changes in procedures as well as adopts proven best practices to address safety issues and improve overall performance.
Major Suppliers and Vendors
Under many of our contracts, our customers supply the necessary equipment for installation. We provide necessary ancillary materials. Under certain contracts, we acquire materials from third parties and have generally not experienced any significant difficulty in obtaining an adequate supply. We are not reliant on any individual vendor to supply a significant portion of our equipment or materials.
We utilize independent subcontractors to supplement our in-house workforce and manage seasonal workflow. Our independent subcontractors are typically small business entities that provide their own personnel, vehicles, tools and insurance coverage. We believe that our relationships with independent subcontractors provide us the ability to scale our operations in response to new projects or seasonal changes in workflow. We are not reliant on any individual source for a significant portion of our outsourced labor.
Seasonality
Our revenues and results of operations can be subject to seasonal and other variations. These variations are influenced by weather, customer spending patterns, bidding seasons, project schedules and timing and holidays. Typically, our revenues are highest during the third quarter due to television viewing habits and favorable weather patterns. While inclement weather can negatively impact our results, it also represents an opportunity to perform emergency restoration services.
Competition
Our industry is competitive and highly fragmented. We often compete with a number of companies in markets where we operate, ranging from small local independent companies to large national firms. We may also face competition from the in-house service organizations of our existing and prospective customers, which perform some of the same types of services that we provide.
In the Fulfillment segment, we compete with Dycom Industries, Inc., MasTec, Inc., Multiband Corporation and other providers of permanently outsourced infrastructure services. In the Engineering and Construction segment, we compete with large scale providers such as Dycom Industries, Inc., MasTec, Inc., Quanta Services, Inc., Goodman Networks, Bechtel Corporation, General Dynamics Corporation and Black and Veatch Corporation in addition to smaller local and regional providers. We compete based upon our industry experience, technical expertise, financial and operational resources, nationwide presence, industry reputation and customer service. While we believe our customers consider a number of factors when selecting a service provider, most of their work is awarded through a bid process.
2013 Outlook
We believe that our 2013 operating results will be impacted by the Company’s incurring substantial expenses relating to its Audit Committee Investigation, restatement of historical financial reports, remediation of material weaknesses, increased financing costs of our newly refinanced debt and the reduction of future work by a major customer. See Part II, Item 7, Management’s Discussion and Analysis of Financial Condition and Results of Operations. In addition, we believe our 2013 operating results will be impacted by the following industry and market trends:
Satellite Fulfillment — We believe the continued addition of DIRECTV subscribers, expansion of high definition video programming and continually improving in-home technology solutions will provide us with the continuing opportunity to provide installation, upgrade and maintenance services for new and existing customers. Our performance on key customer metrics continues to exceed our peer levels and positions us well to potentially increase market share. Additionally, our focus on the end-user service experience will support DIRECTV’s efforts on customer retention. Our contract for fulfillment services with ViaSat for satellite Internet access diversifies our customer base in the satellite installation market. We currently provide close to half of all the installation, upgrade and repair services for this customer nationwide.
Broadband Cable Industry Vendor Consolidation — We believe that the broadband cable industry will continue to progress on vendor consolidation and investment programs to compete with satellite and fiber optic alternatives. Key broadband cable providers are consolidating vendors and this initiative has historically provided us with market growth opportunities with our existing footprint, technology investments and quality programs. These vendors have also trended toward focusing efforts on content management and have correspondingly grown their demand for outsourced services. We continue to pursue differentiation from our competition through exceptional customer service levels and a superior end-user customer experience. We are focused on developing our installation base in urban areas where greater efficiencies through customer density can be developed. In addition, we believe that downstream demand from other communications providers, such as Internet service providers and telecommunications resellers, which utilize backhaul infrastructure to provide their services, will continue to increase. As demand for these services increases, communication service providers will need to invest capital to improve their networks to accommodate the demand for increased capacity and increased service offerings, which we expect should in turn increase the demand for our fulfillment and maintenance services.
Wireless Industry Expansion, Consumer Market — We continue to pursue large scale, predictable infrastructure spending by the large telecommunication service providers necessary to meet the continued growing demand for their data services through deployment of 4G LTE network upgrades. We believe the opportunity for growth within our wireless business continues to be significant as the telecommunications industry continues to augment network capacity for continued data demand growth related to the proliferation of mobile devices and the increased product and services offerings for these devices. The increase in data usage will also drive small cell and DAS deployment across dense user areas, additionally increasing demand for our design and engineering expertise. As the wireless carriers invest additional capital to upgrade or enhance their existing networks, we expect additional opportunities to provide site acquisition, engineering and construction services. Furthermore, as we continue to grow and expand our presence in the wireless business, we believe that we will have new opportunities to provide ongoing maintenance services, as well as optimization services to further improve network quality and increase spectrum efficiency for the wireless carriers.
Wireless Industry Expansion, Public Safety and Private Wireless — We believe our public safety and private wireless platform is differentiated in the industry by providing technology agnostic solutions through a wide variety of service offerings throughout the value chain including highly sophisticated systems integration projects. Our ability to execute on large, sophisticated technology rollouts has been demonstrated through various successful projects, including our current work on what is estimated to be the world’s largest public safety DAS system for the World Trade Center Transportation Hub in New York City. We expect our historical success in large projects will help enable significant growth in our wireless segment as it relates to public safety, private wireless and municipal cellular network spends. Our ability to grow this service offering across our nationwide geographic presence will leverage the strong competencies we have developed from engineering solutions through deployment of land mobile radio systems and complex integrated technology solutions in the wireless market. Additionally, as with the large wireless carriers, our expertise in network engineering and system integration will support the development of optimization services to improve network quality and spectrum efficiency for these private, public safety networks.
Regulation
Our operations are subject to various federal, state, local and international laws and regulations including:
· licensing, permitting and inspection requirements applicable to electricians and engineers;
· building codes;
· permitting and inspection requirements applicable to construction projects; and
· regulations relating to worker safety and environmental protection.
We believe that we have all the licenses required to conduct our operations and that we are in compliance with applicable regulatory requirements. Our failure to comply with applicable regulations could result in substantial fines or revocation of our operating licenses.
Financial Information about Geographic Areas
We operate primarily in the United States; however, we derived $15.4 million, $15.0 million and $16.6 million of our revenues from continuing operations in Canada during the years ended December 31, 2012, 2011 and 2010, respectively. In addition, we held assets relating to our Canadian operations of $5.3 million, $5.8 million and $4.4 million as of December 31, 2012, 2011 and 2010, respectively.
Employees
As of December 31, 2012, we had approximately 3,600 full-time employees. We maintain a nucleus of technical and managerial personnel to supervise all projects and add employees and subcontractors as needed to complete specific projects.
An important aspect of our business is the attraction and retention of quality employees, particularly for key positions that are in high demand or require specialized skills. In response to this, we continually evaluate our recruitment methods and the competitiveness of our wages and benefits packages, and we offer a pay-for-performance model to many of our employees. Further we are offering industry leading training programs, the best equipment for our employees, high safety standards and tremendous opportunities to grow within and across the business for our staff and management. We believe that these programs will continue to improve retention in each of our key positions.
WHERE YOU CAN FIND MORE INFORMATION
The Company’s Internet address is www.unitekglobalservices.com. The information contained on the Company’s website is not included as a part of, or incorporated by reference into, this Annual Report on Form 10-K. Copies of this Annual Report on Form 10-K, as well as our Quarterly Reports on Form 10-Q, Current Reports on Form 8-K and any amendments to those reports filed or furnished pursuant to Section 13 or 15(d) of the Exchange Act, are available free of charge on the Internet at our website as soon as reasonably practicable after we electronically file these reports with, or furnish these reports to, the Securities and Exchange Commission, which we refer to as the SEC. You may also inspect reports and other information concerning us at the offices of the NASDAQ Stock Market at 1735 K Street, N.W., Washington, D.C. 20006. We intend to furnish our stockholders with annual reports containing audited financial statements and such other periodic reports as we may determine to be appropriate or as may be required by law. Our reports filed with the SEC may be read or copied at the SEC’s Public Reference Room at 100 F Street, NE, Washington, D.C. 20549. Information on the operation of the SEC’s Public Reference Room may be obtained by calling the SEC at 1-800-SEC-0330. Alternatively, you may access these reports at the SEC’s website at www.sec.gov.
The risks described below, together with all of the other information included in this Annual Report on Form 10-K, should be carefully considered in evaluating our business and prospects. The risks and uncertainties described below could adversely affect our results of operations or financial condition and cause our actual results to differ materially from those expressed in forward-looking statements made by us. Although we believe that we have identified and discussed below the key risk factors affecting our business, there may be additional risks and uncertainties that are not presently known or that we do not currently believe to be significant that may adversely affect our future performance or financial condition. In addition, more detailed information regarding various risks and uncertainties facing us are included under Items 1 and 7 of this Annual Report on Form 10-K. Solely for purposes of the risk factors in this Item 1A, the terms “Company,” “we,” “our,” and “us” refer to UniTek Global Services, Inc. and its subsidiaries
Risks Related to Investing in our Common Stock and to our Business
Our substantial indebtedness could adversely affect our financial health.
As of December 31, 2012, our total indebtedness, including capital lease obligations, was approximately $170 million. This amount has increased to approximately $210 million as of August 9, 2013, including amounts borrowed to cash collateralize letters of credit. Our current debt also bears interest at rates significantly higher than historical periods. See Part II, Item 7, Management’s Discussion and Analysis of Financial Condition and Results of Operations. Our substantial indebtedness could have important consequences to our stockholders. It will require us to dedicate a substantial portion of our cash flow from operations to payments on our indebtedness, thereby reducing the availability of our cash flow to fund acquisitions, working capital, capital expenditures and other general corporate purposes. In addition, it could:
· increase our vulnerability to and limit our flexibility in planning for, or reacting to, changes in our business and the industry in which we operate;
· place us at a competitive disadvantage compared to our competitors that have less debt;
· prevent us to engage in acquisitions, internal expansion efforts or other strategic and business development initiatives;
· limit our ability to borrow additional funds; and
· make us more vulnerable to a general economic downturn than a company that is less leveraged.
An event of default under either of our credit facilities could result in, among other things, the acceleration and demand for payment of all the principal and interest due and the foreclosure on the collateral. As a result of such a default or action against collateral, we could be forced to enter into bankruptcy proceedings, which may result in a partial or complete loss of your investment.
Our debt agreements contain financial covenants that may be difficult to satisfy.
We have entered into new debt agreements that contain financial covenants requiring us to satisfy certain levels of earnings, ratios concerning earnings compared to total debt and limitations on total allowable debt. Satisfying such covenants may be difficult if our operations do not generate sufficient cash and earnings. If we do not satisfy the covenants, it would result in an event of default and we may not be able to cure the default, which could have substantial adverse impacts on us, including without limitation the acceleration by our lenders of their indebtedness.
We have had a history of losses.
We experienced net losses of $77.7 million, $9.1 million and $30.6 million in 2012, 2011 and 2010, respectively. We cannot predict if we will ever achieve profitability, and if we do, be able to sustain such profitability. Further, we may incur significant losses in the future for a number of reasons, including due to the other risks described in this Form 10-K, and we may encounter unforeseen expenses, difficulties, complications and delays and other unknown events. Accordingly, we may not ever be able to achieve profitability.
Our past failure to file reports on Form 10-K and Form 10-Q in a timely manner will result in our ineligibility to register securities on Form S-3.
As a result of our failure to timely file our Annual Report on Form 10-K for the fiscal year ended December 31, 2012 and our Quarterly Reports on Form 10-Q for the quarterly periods ended March 31, 2013 and June 29, 2013, we will be ineligible to register our securities on Form S-3 for sale by us or resale by others until we have timely filed all periodic reports under the Exchange Act, as amended, for a period of twelve months and any portion of a month from the due date of the last untimely report. The need to use other forms, such as Form S-1, to register our securities could increase transaction costs and adversely affect our ability to raise capital, and could render our use of our securities to complete acquisitions less attractive to potential sellers. Accordingly, our ability to raise additional capital and to grow through acquisitions may be limited.
We will have incurred and will continue to incur substantial expenses relating to the Audit Committee Investigation for lawyers, investigators and interim financial staff and may continue to have increased exposure to contingent liabilities because of historical improper accounting practices identified by our Audit Committee Investigation.
As described in the Explanatory Note immediately preceding Part I, Item 1, and in Note 2 to the consolidated financial statements in Item 8 of this Form 10-K, our Audit Committee conducted an investigation into the improper recognition of revenue using percentage of completion accounting with the assistance of independent legal counsel and other independent professional staff. Certain senior executives were terminated and we have had to rely on consultants to supplement our financial staff. To date, we have incurred over $6.0 million on such expenses including incremental audit fees.
In addition, our expenses for legal counsel are expected to increase due to recent litigation relating to disclosure made by us regarding our improper accounting practices on April 12, 2013. We also reported to the SEC the results of the Audit Committee Investigation. We may be subject to enforcement actions as a result of such events, which may impact us adversely.
We may also be the subject of other regulatory or enforcement actions. No assurance can be given regarding the outcomes from any litigation, regulatory proceedings or government enforcement actions. The conduct of the investigation has been, and the resolution of any such matters may be time consuming, expensive, and may distract management from the conduct of our business. Furthermore, if we are subject to adverse findings in litigation, regulatory proceedings or government enforcement actions, we could be required to pay damages or penalties or have other remedies imposed, which could have a material adverse effect on our business, financial condition, results of operations or cash flows in an individual quarter or annual period.
Our stock may no longer trade on the NASDAQ Stock Market which may limit the liquidity of our common stock.
On April 16, 2013, we received a letter from the NASDAQ Stock Market stating that we were not in compliance with the continued listing requirements of NASDAQ Listing Rules because we did not timely file our Annual Report on Form 10-K for the year ended December 31, 2012. NASDAQ subsequently granted the Company an October 14, 2013 deadline for the filing of the Form 10-K and other reports. We have received similar notices with respect to our failure to file our Quarterly Reports on form 10-Q for the fiscal quarters ended March 30, 2013 and June 29, 2013. We cannot guarantee that we will become compliant before the deadline. If we are delisted from the NASDAQ Stock Market, investors may experience a reduced ability to sell shares of our common stock that they hold or purchase shares.
We generate a substantial portion of our revenue from a limited number of customers and, if our relationships with such customers were harmed, it is unlikely that we could continue in business.
During the year ended December 31, 2012, our three largest customers as a percentage of revenues were DIRECTV (43%), AT&T (17%) and Comcast (15%). Our contracts with our major customers give our customers the right to either terminate their contract, or reduce the amount of work that we will perform under their contract, on relatively short notice, with or without cause. During fiscal 2013, we received a letter from DIRECTV providing 180-day notice of the termination of its master services agreement with us. DIRECTV agreed to withdraw the notice of termination upon our satisfaction of certain conditions and, following satisfaction of these conditions in July 2013, DIRECTV withdrew its notice of termination. AT&T has reduced the amount of work that we will be performing; the impact of which is expected to be approximately $21 million in revenue. If these or other customers terminate their contracts with us or reduce the amount of work that we will perform under the contract, it could materially reduce our operating results. We believe that we will continue to be at risk because a limited number of customers will continue to be the source of a substantial portion of our revenue for the foreseeable future. A key factor in maintaining relationships with such customers is performance on individual contracts and the strength of our professional reputation. To the extent that our performance does not meet customer expectations, or our reputation or relationships with one or more key customers are impaired due to another reason, we may lose future business with such customers, and as a result, our ability to generate income would be adversely impacted.
Our construction and construction-related contracts, and the accounting for those contracts, depend upon significant judgments and estimates that may differ from actual results in future periods.
The pricing of our construction and construction-related contracts is established, in part, based on cost and scheduling estimates. Such estimates, in turn, are based on a number of other assumptions, including future economic conditions, prices and availability of labor, prices of equipment and materials and other variables. These assumptions can be difficult to ascertain because of the wide fluctuation in prices for equipment, fuel and other costs associated with our services. If pricing or cost estimates prove to be incorrect, we may incur cost overruns and incur losses on contracts which would reduce our profitability.
Our accounting for those contracts relies heavily upon those same estimates and judgments, as well other judgments and estimates, including estimates of progress toward completion, judgments about whether we can recover costs related to change orders from our customers, and estimates of the fair value of non-construction related products or services that may be bundled into a construction contract. If our accounting estimates ultimately prove to be incorrect, our profitability could be more volatile during the contract period or be reduced, or both.
We base our estimates on historical experience and on various other assumptions that we believe to be reasonable under the circumstances. However, because management estimates, by their nature, involve judgment regarding future uncertainties, actual results may differ from those estimates if conditions change or if the assumptions used in making these estimates ultimately prove to be incorrect. As described in the Explanatory Note appearing at the beginning of this Form 10-K, certain of our estimates related to revenue recognition were identified as containing errors as part of our restatement and materially reduced our results of operations. Our results of operations could be materially reduced again if future changes in our estimates and judgments are required.
Our disclosure controls and procedures were determined to be deficient as of December 31, 2012, due to material weaknesses in our internal control over financial reporting and our inability to timely file periodic reports with the SEC. These material weaknesses result in more than a remote likelihood that a material misstatement of our annual or interim consolidated financial statements would not be prevented or detected.
The Sarbanes-Oxley Act of 2002 and SEC rules require that management report annually on the effectiveness of our internal control over financial reporting and our disclosure controls and procedures. Among other things, management must conduct an assessment of our internal control over financial reporting to allow management to report on, and our independent registered public accounting firm to audit, the effectiveness of our internal control over financial reporting, as required by Section 404 of the Sarbanes-Oxley Act. Based on our management’s assessment, we believe that, as of December 31, 2012, our internal controls over financial reporting were not effective. The specific material weaknesses are described in Item 9A of this Form 10-K “Management’s Report On Internal Control Over Financial Reporting.” These material weaknesses in our internal control over financial reporting result in more than a remote likelihood that a material misstatement of our annual or interim consolidated financial statements would not be prevented or detected.
We cannot assure you that our efforts to remediate these material weaknesses will be successful or that additional material weaknesses in our internal control over financial report will not be identified in the future. Any failure to maintain or implement required new or improved controls, or any difficulties we encounter in their implementation, could result in additional material weaknesses, or could result in material misstatements in our financial statements. These misstatements could result in a restatement of our financial statements, cause us to fail to meet our reporting obligations or cause investors to lose confidence in our reported financial information, leading to a decline in our stock price.
For more information relating to our internal control over financial reporting and disclosure controls and procedures, and remediation efforts undertaken by us, see Part III, Item 9A of this Form 10-K.
We may incur goodwill and other intangible impairment charges which could reduce our profitability.
The profitability of individual reporting units or other assets may suffer periodically from downturns in customer demand and other factors resulting from the cyclical nature of our business, the high level of competition existing within our industry, the concentration of our revenues within a limited number of customers, and the level of overall economic activity. During times of economic slowdown, our customers may reduce their capital expenditures and defer or cancel pending projects. Individual reporting units may be relatively more impacted by these factors than our company as a whole. As a result, demand for the services of one or more of our reporting units could decline resulting in an impairment of goodwill or intangible assets.
We review our goodwill and indefinite-lived intangible assets for impairment at least annually or more often if an event occurs or circumstances change which indicates that their carrying amount may not exceed their fair value. We review other long-lived assets, consisting primarily of property and equipment and intangible assets with finite lives, for recoverability whenever events or changes in circumstances indicate that the carrying value of the assets may not be recoverable. Should any of these tests result in an impairment, we could recognize a charge that would materially reduce our results of operations.
During the third quarter of 2012, we committed to a plan to sell the net assets of our wireline telecommunications business unit (the “Wireline Group”) which resulted in the performance of interim tests of impairment. As a result of those tests, we impaired property and equipment by $2.2 million and goodwill by $33.0 million.
We performed our most recent annual goodwill impairment test as of September 30, 2012, the first day of our fourth fiscal quarter. When we performed our annual goodwill impairment test, we determined that the fair value of the wireless reporting unit exceeded the carrying value. Accordingly, we performed the second step in the analysis and determined that the carrying amount of our goodwill exceeded its implied fair value, and we recognized an impairment loss in an amount equal to that excess. In the fourth quarter of 2012, the carrying value of goodwill for the wireless reporting unit exceeded its implied fair value and we recorded a non-cash, pre-tax impairment charge of $14.9 million.
If we are unable to “close-out” our projects, we are unable to bill our customers.
Our business requires us to expend substantial amounts of money on a project prior to being paid by our customers. In order to receive payment, we are required to comply with a “close-out” process which can be time-consuming and complex. If we are unable to timely “close-out” our projects, we are unable to bill our customers for costs that have already been expended, which negatively impacts our liquidity situation.
If we are unable to recruit and retain key managers and employees, our business may be adversely affected.
As a result of the Audit Committee Investigation, a number of senior executives were terminated. In addition, certain corporate staff members have left our company because of the uncertainty caused by the Audit Committee Investigation. As a result, we have had to rely on a number of consultants for corporate positions. We depend on the senior management of our subsidiaries; the loss of any of them could negatively affect our ability to execute our business strategy. Although we have entered into employment agreements with certain of our executive officers, we cannot guarantee that any key management personnel will remain employed by us.
In addition, the services we deliver to our customers could be delayed or interrupted if we are unable to attract, train and retain highly skilled employees or subcontractors, particularly fulfillment installation and wireless technicians. Competition for these technicians is intense. Because of the complex and technical nature of some of our services, any failure to attract and retain a sufficient number of qualified employees could materially harm our business.
We maintain a workforce based upon current and anticipated workloads. If we do not receive future contract awards or if these awards are delayed, we may incur significant costs in adjusting our workforce demands.
Our estimates of future performance depend on, among other matters, whether and when we will receive certain new contract awards. While our estimates are based upon good faith judgment, they can be unreliable and may frequently change based on newly available information. In the case of larger projects, where timing is often uncertain, it is particularly difficult to project whether and when we will receive a contract award. The uncertainty of contract award timing can present difficulties in matching workforce size with contractual needs. If an expected contract award is delayed or not received, we could incur significant costs resulting from retaining more staff than is necessary or redundancy of facilities. Similarly, if we underestimate the workforce necessary for a contract, we may not perform at the level expected by the customer and harm our reputation. Each of these may negatively impact our operating performance and financial results.
If we are unable to meet our customer’s billing requirements, or if our customers delay or default on their payments to us, we may be unable to cover our expenditures related to those projects.
Because of the nature of some of our contracts, we commit resources to projects prior to receiving payments from our customers in amounts sufficient to cover expenditures as they are incurred. Delays in customer payments may require us to make a working capital investment or obtain advances from our line of credit. If a customer defaults in making its payments on a project or projects to which we have devoted significant resources, it could have a material negative effect on our results of operations and negatively impact the financial covenants with our lenders.
Our estimated future revenue is subject to reduction and potential cancellation.
Our estimated future revenue consists of uncompleted portions of services to be performed under job-specific contracts and the estimated value of future services that we expect to provide under master service agreements and other contracts., which in most cases can be terminated or cancelled on short notice, with or without cause. We include in our estimate of future revenue the amount of services projected to be performed based on our historical experience with customers and our experience in procurements of this type. In many instances, our customers are not contractually committed to procure specific volumes of services under a contract. Our estimates of future revenue and a customer’s requirements during a particular future period may not prove to be accurate. If our estimated future revenue is significantly inaccurate, this could adversely affect our financial results and the price of our common stock.
Provisions of our Amended and Restated Certificate of Incorporation and Amended and Restated Bylaws and Delaware law might discourage, delay or prevent a change of control of our company or changes in our management and, as a result, depress the trading price of our common stock.
Our Amended and Restated Certificate of Incorporation, or Charter, and our Amended and Restated Bylaws, or Bylaws, contain provisions that could discourage, delay or prevent a change in control of our company or changes in our management that the stockholders of our company may deem advantageous. These provisions:
· establish a classified Board of Directors so that not all members of our Board are elected at one time;
· authorize the issuance of “blank check” preferred stock that our Board of Directors could issue to increase the number of outstanding shares and to discourage a takeover attempt;
· establish advance notice requirements for nominations for election to our Board of Directors or for proposing matters that can be acted upon by stockholders at stockholder meetings: and.
· provide that the Board of Directors is expressly authorized to adopt, or to alter or repeal our Bylaws.
In addition, we are subject to Section 203 of the Delaware General Corporation Law, or DGCL, which, subject to some exceptions, prohibits “business combinations” between a Delaware corporation and an “interested stockholder,” which is generally defined as a stockholder who becomes a beneficial owner of 15% or more of a Delaware corporation’s voting stock, for a three-year period following the date that the stockholder became an interested stockholder. Section 203 could have the effect of delaying, deferring or preventing a change in control that our stockholders might consider to be in their best interests.
These anti-takeover defenses could discourage, delay or prevent a transaction involving a change in control of our company. These provisions could also discourage proxy contests and make it more difficult for you and other shareholders to elect directors of your choosing and cause us to take corporate actions other than those you desire.
If our customers perform more tasks themselves, our business will suffer.
Our success also depends upon the continued trend by our customers to outsource their network design, deployment, project management and fulfillment service needs. If this trend does not continue or is reversed and telecommunication service providers and network equipment vendors elect to perform more of these tasks themselves or provide kits for their customers to self-install, our operating results may be adversely affected due to the decline in the demand for our services.
The nature of our construction businesses exposes us to potential liability claims and contract disputes that may negatively affect our results of operations.
We engage in construction activities, including engineering and oversight of engineering firms. Design, construction or systems failures can result in substantial injury or damage to third parties. Any liability in excess of insurance limits at locations constructed by us could result in significant liability claims against us, which claims may negatively affect our results of operations. In addition, if there is a customer dispute regarding performance of project services, the customer may decide to delay or withhold payment to us. If we are ultimately unable to collect on these payments, our results of operations would be negatively impacted.
We may experience significant fluctuations in our quarterly results relating to our ability to generate additional revenue and manage expenditures and other factors, some of which are outside of our control, which could cause rapid declines in our stock price.
Our quarterly operating results have varied considerably in the past, and may continue to do so, due to a number of factors. Many of these factors are outside of our control and include, without limitation, the following:
· our ability to attract new customers, retain existing customers and increase sales to such customers;
· the commencement, progress, completion or termination of contracts during any particular quarter;
· the cyclical nature of the telecommunications industry;
· the cost of raw materials we require for our projects; and
· satellite television, broadband cable and wireless telecommunications market conditions and economic conditions generally.
Due to these factors and others, our results for a particular quarter, and therefore, our combined results for the affected year, may not meet the expectations of investors, which could cause the price of our common stock to decline significantly.
Legal proceedings and other claims could reduce our profitability, cash flows and liquidity.
There has been a consolidated class action law suit filed in the United States District Court for the Eastern District of Pennsylvania against us and certain of our current and former officers entitled In Re Unitek Global Services, Inc. Securities Litigation, Civil Action NO. 13-2119. The case alleges that we made misstatements and omissions regarding our business, our financial condition and our internal controls and systems in violation of the Sections 10(b) and 20(a) of the Securities Exchange Act of 1934 and Rule 10b-5 thereunder. We also reported to the SEC the results of the Audit Committee Investigation. We may be subject to enforcement actions as a result of such events, which may impact us adversely.
In addition, we are subject to various claims, lawsuits and proceedings that arise in the ordinary course of business. These actions may seek, among other things, compensation for alleged personal injury, workers’ compensation, employment discrimination, wage and hour disputes, breach of contract, property damage, consequential and punitive damages, civil penalties, or injunctive or declaratory relief. In addition, we generally indemnify our customers for claims related to the services we provide. Claimants may seek large damage awards.
If not covered by insurance, defending claims against us can involve significant legal costs. When appropriate, we establish reserves for litigation and claims that we believe to be adequate in light of current information, legal advice and professional indemnity insurance coverage, and we adjust such reserves from time to time according to developments. If reserves are inadequate, insurance coverage proves to be inadequate or unavailable, or there is an increase in liabilities for which we self-insure, we could experience a reduction in our profitability and liquidity. An adverse determination on any such claim or lawsuit could have a material effect on our business, financial condition and results of operations. Separately, claims and lawsuits alleging wrongdoing or negligence by us may harm our reputation or divert management resources away from operating our business.
We maintain high-deductible liability insurance policies, which exposes us to a substantial portion of the costs of claims and lawsuits.
We maintain high-deductible insurance policies for workers’ compensation, general liability, automobile, medical and dental claims. Because most claims against us do not exceed our deductibles, we are effectively self-insured for substantially all claims. We establish insurance reserves for estimates of the loss that we will ultimately incur on reported claims and claims that have been incurred but not yet reported. Our insurance reserves incorporate historical loss experience and judgments about the present and expected levels of cost per claim. Trends in actual experience are a significant factor in the determination of such reserves. We update our estimates and the appropriateness of our reserves quarterly based upon known facts, historical trends and our judgments regarding future claims.
Insurance claims may take several years to completely settle. Consequently, actuarial estimates are required to project the ultimate cost that will be incurred to fully resolve the claims. A number of factors can affect the actual cost of a claim, including the length of time the claim remains open, trends in health care costs and the results of related litigation. Furthermore, claims may emerge in future years for events that occurred in a prior year at a rate that differs from previous actuarial projections. We believe that our estimated reserves for such claims are adequate, but actual experience in claim frequency and / or severity could materially differ from our estimates and affect our results of operations and liquidity.
We may not be allowed to renew our casualty insurance coverage after September 30, 2013 on satisfactory terms.
Our casualty insurance coverage expires on September 30, 2013. If our financial position worsens, we may not be able to obtain a policy that will provide coverage after October 1, 2013 on substantially similar terms as the current policy. If we need to access the secondary market for such insurance, it may result in a significant increase in premiums or usage of liquidity.
Government regulations may adversely affect our business.
Our customers are subject to various regulations of the FCC and other international regulations. These regulations require that networks meet certain radio frequency emission standards and not cause interference to other services, and in some cases accept interference from other services. FCC regulations could cause our customers to slow down or delay development and deployment plans for network build outs, which could impact our financial results.
Significant shortages in fuel supply or increases in fuel prices will increase our operating expenses and therefore adversely affect our results of operations.
The price and supply of fuel are unpredictable, and can fluctuate significantly based on international, political and economic circumstances, as well as other factors outside our control, such as actions by OPEC and other oil and gas producers, regional production patterns, weather conditions and environmental concerns. Recently, the costs of gasoline, diesel fuel and other petroleum based fuel products have been volatile. We purchase fuel to run our fleet of trucks and equipment used in our operations, and as fuel prices increase, our operating expenses increase. We may implement a fuel surcharge program or receive additional fuel charge concessions from our customers designed to offset increased fuel expenses; however, these are not guaranteed and may not fully offset the increased costs associated with rising fuel prices. We do not currently engage in fuel hedging transactions or purchase gasoline or fuel future contracts in an effort to mitigate the risk of future fuel price increases. While we may in the future initiate such programs, there can be no assurances that we will be able to do so or that any such programs will be successful.
Increases in our insurance premiums or collateral requirements, such as construction bonds or letters of credit, could significantly reduce our profitability, liquidity and availability under our credit facilities.
Because of factors such as increases in claims, projected significant increases in medical costs and wages, lost compensation and reductions in coverage, insurance carriers may be unwilling to continue to provide us with our current levels of coverage without a significant increase in insurance premiums or collateral requirements to cover our deductible obligations. An increase in premiums or collateral requirements could significantly reduce our profitability and liquidity as well as reduce availability under our credit facilities.
Our operating results can be negatively affected by weather conditions.
We perform most of our services outdoors. Adverse weather conditions may affect productivity in performing services or may temporarily prevent us from performing services for our customers. The effect of weather delays on projects that are under fixed-price arrangements may be greater if we are unable to adjust the project schedule for such delays. A reduction in productivity in any given period or our inability to meet guaranteed schedules may adversely affect the profitability of our projects.
Risks Related to Our Industry
Changes in technology or consumer preferences and demand could weraken our competitiveness in the marketplace
We are dependent upon meeting the demands of our customers and the public. New technologies are rapidly being developed to enhance the public’s entertainment experience. There can be no assurance that our major customers’ products will continue to be popular or if our major customers adopt new technologies, that we will will have the skill set to be able to deploy such technologies..
Competition in the industries we serve could reduce our market share and impact operating results.
We serve markets that are competitive and highly fragmented and in which a large number of multinational companies compete for large, national projects, and an even greater number of small, local businesses compete for smaller, one-time projects. Many of our competitors are well-established and have larger and better developed networks and systems, longer-standing relationships with customers and suppliers, greater name recognition and greater financial, technical and marketing resources than we have. These competitors can often subsidize competing services with revenues from other sources and may be able to offer their services at lower prices. These or other competitors may also reduce the prices of their services significantly or may offer backhaul connectivity with other services, which could make their services more attractive to customers. Competition may place downward pressure on contract prices and profit margins. Intense competition is expected to continue in these markets and, if we are unable to meet these competitive challenges, we could lose market share to our competitors and experience an overall reduction in our operating performance and financial results.
We are vulnerable to the cyclical nature of the telecommunications industry and, specifically, the capital expenditures of the major telecommunications providers.
The demand for our outsourced infrastructure services is dependent upon the existence of projects with engineering, procurement, construction and management needs. The wireless telecommunications market, which is one of the industries in which we compete, is particularly cyclical in nature and vulnerable to downturns in the telecommunications industry. During times of economic slowdown, some of our customers reduce their capital expenditures. Further, customers, primarily in our wireless communications subsidiaries, sometimes defer or cancel pending projects. As a result, demand for our services may decline during periods of economic downturns and could adversely affect our operations and financial performance.
ITEM 1B. UNRESOLVED STAFF COMMENTS
Not applicable.
As of December 31, 2012, the Company’s headquarters are located in Blue Bell, Pennsylvania where it leases approximately 21,233, square feet of office space. The Company’s Pinnacle subsidiary is located in Fair Lawn, New Jersey where it leases 76,790 square feet of office and warehouse space. In addition, we own 0.9 acres of property, including office and warehouse space, in Arlington, Texas. We lease other smaller locations throughout the United States and Canada.
We believe that our properties are adequate to meet our current needs and that additional facilities, if needed, are available to meet our expansion needs in existing and projected markets.
There has been a consolidated class action law suit filed in the United States District Court for the Eastern District of Pennsylvania against us and certain of our current and former officers entitled In Re UniTek Global Services, Inc. Securities Litigation, Civil Action NO. 13-2119. The case alleges that we made misstatements and omissions regarding our business, our financial condition and our internal controls and systems in violation of the Sections 10(b) and 20(a) of the Securities Exchange Act of 1934 and Rule 10b-5 thereunder. Subject to certain limitations, the Company is obligated to indemnify its current and former officers in connection with any regulatory or litigation matter. This obligation arises under the terms of the Company’s Amended and Restated Articles of Incorporation, the Company’s Amended and Restated Bylaws and Delaware law. An obligation to indemnify generally means that the Company is required to pay or reimburse the individual’s reasonable legal expenses and possibly damages and other liabilities that may be incurred.
The Company also is involved in certain other legal and regulatory actions from time to time which arise in the ordinary course of the Company’s business. The Company is unable to predict the outcome of these matters, but does not believe that the ultimate resolution of such matters will have a material adverse effect on the consolidated financial position, results of operations or cash flows of the Company. However, if certain of such matters were determined adversely to the Company, although the ultimate liability arising therefrom would not be material to the financial position of the Company, it could be material to its results of operations in an individual quarter or annual period.
ITEM 4. MINE SAFETY DISCLOSURES
Not applicable.
ITEM 5. MARKET FOR REGISTRANT’S COMMON EQUITY, RELATED STOCKHOLDER MATTERS AND ISSUER PURCHASES OF EQUITY SECURITIES
Beginning on November 11, 2010, as part of the closing of the Equity Offering, UniTek common stock commenced quotation on the NASDAQ Stock Market under the symbol “UNTK.” The following table presents the high and low selling prices per share of our common stock as reported by the NASDAQ Stock Market for the quarterly periods indicated:
|
| Low |
| High |
| ||
|
|
|
|
|
| ||
December 31, 2012 |
| $ | 3.18 |
| $ | 4.30 |
|
September 29, 2012 |
| 2.43 |
| 4.33 |
| ||
June 30, 2012 |
| 2.43 |
| 3.69 |
| ||
March 31, 2012 |
| 3.05 |
| 4.90 |
| ||
|
|
|
|
|
| ||
December 31, 2011 |
| $ | 3.84 |
| $ | 5.49 |
|
October 1, 2011 |
| 4.03 |
| 8.95 |
| ||
July 2, 2011 |
| 7.25 |
| 10.52 |
| ||
April 2, 2011 |
| 8.02 |
| 10.65 |
| ||
Since December 31, 2012, the range of selling prices of our common stock has changed significantly as a result of the events described in the Explanatory Note appearing at the beginning of this Form 10-K. The low and high selling prices of our common stock from January 1, 2013 to August 7, 2013 were $0.95 and $3.95, respectively.
Our stock has experienced periods of limited or sporadic quotations.
Holders
As of August 7, 2013, there were 301 holders of record of our common stock.
Dividends
We have never paid any cash dividends and do not anticipate paying cash dividends in the foreseeable future. We intend to retain any future earnings for reinvestment. Our Board of Directors will make any future determination as to the payment of dividends at its discretion, and this determination will depend upon our financial condition, results of operations, capital requirements, general business conditions and such other factors that the Board of Directors considers relevant. In addition, our credit agreements restrict our ability to pay cash dividends or make other distributions on our common stock without the prior consent of the lenders.
Securities Authorized for Issuance under Equity Compensation Plans
As of December 31, 2012, the Company sponsored three stock option plans, the 1999 Securities Plan (the “1999 Plan”), the 2007 Equity Incentive Plan (the “2007 Plan”) and the 2009 Omnibus Securities Plan (the “2009 Plan”) (collectively, the “Plans”). The Plans provide for the grant of RSUs, stock options and certain other stock-based instruments, the terms of which are set by our board of directors (the “Board”). Options granted under the Plans expire no later than ten years after the date the stock option is granted. As of December 31, 2012, a total of 1.8 million shares of the Company’s common stock had been authorized for issuance under the 2009 Plan, of which 0.6 million shares remain eligible for the grant of awards. There were no remaining shares authorized or eligible for grant under the 1999 Plan or the 2007 Plan.
The following table provides information, as of December 31, 2012, with respect to all compensation plans and individual compensation arrangements under which equity securities are authorized for issuance to employees or non-employees:
Equity Compensation Plan Information
Plan Category |
| Number of securities |
| Weighted average |
| Number of securities |
| |
|
| (a) |
| (b) |
| (c) |
| |
Equity compensation on plans approved by security holders: |
|
|
|
|
|
|
| |
1999 Plan |
| — |
| $ | — |
| — |
|
2007 Plan |
| — |
| — |
| — |
| |
2009 Plan: |
|
|
|
|
|
|
| |
RSUs |
| 231,572 |
| 6.12 |
|
|
| |
Options |
| 32,977 |
| 10.42 |
|
|
| |
Total |
| 264,549 |
|
|
| 556,440 |
| |
Recent Sales Of Unregistered Securities
The Company did not issue any unregistered securities in fiscal years 2011. During fiscal year 2012 the Company granted unregistered securities to Mr. Romanella, its Chief Executive Officer, that vest in 2013 and 2014 as more fully described in Part III of this Annual Report on Form 10-K under the heading “Employment Agreements.”
Such unregistered securities were granted pursuant to an exemption from registration afforded by Section 4(2) of the Securities Act of 1933, as amended. Mr. Romanella was deemed an “Accredited Investor,” and the grant was approved by the Compensation Committee of the Board of Directors of the Company solely for compensation purposes and the Company did not receive any cash consideration for such securities. Each certificate issued, or to be issued, for such unregistered securities contain a legend stating that such securities have not been registered under the Securities Act of 1933, as amended, and setting forth the restrictions on the transferability and sale of such securities.
The following unregistered securities were granted to Mr. Romanella during fiscal year 2012:
Name |
| Grant Date |
| Number of |
|
|
|
|
|
|
|
Rocco Romanella, Chief Executive Officer |
| July 16, 2012 |
| 192,307 | (1) |
(1) Mr. Romanella was granted 192,307 shares of restricted stock on July 16, 2012 that vest 25% on January 16, 2013, July 16, 2013, January 16, 2014 and July 16, 2014.
Issuer Purchases of Equity Securities
During the fiscal years 2011 and 2012, the Company has not repurchased any of its equity securities.
ITEM 6. SELECTED FINANCIAL DATA
The following table presents consolidated selected financial data. The results of operations and balance sheet data as of and for the years ended December 31, 2012, 2011 and 2010 have been derived from our consolidated financial statements. The results of operations and balance sheet data as of and for the years ended December 31, 2009 and 2008 have been derived from the financial statements of our predecessor company, UniTek Holdings, Inc. (“Holdings”), and adjusted for the impact of discontinued operations.
The selected financial data included herein may not be indicative of our future financial condition or results of operations as a result of recent trends and uncertainties that have arisen subsequent to December 31, 2012. These matters are described more fully within Item 7, “Management’s Discussion and Analysis of Results of Operations and Financial Condition” in the overview sub-sections of our financial condition and results of operations section and our liquidity and capital resources section. Additionally, please refer to the Explanatory Note appearing at the beginning of this Annual Report on Form 10-K and the events that occurred subsequent to December 31, 2012 included at Note 22 of Item 8, “Financial Statements and Supplementary Data.” We strongly encourage investors to consider such information, in addition to information found elsewhere in this report, to assist them in drawing conclusions about our future financial condition and results of operations.
|
| Year Ended December 31, |
| |||||||||||||
(in thousands, except per share data) |
| 2012 |
| 2011 |
| 2010 |
| 2009 |
| 2008 |
| |||||
|
|
|
| (Restated) |
|
|
| (Unaudited) |
| (Unaudited) |
| |||||
Results of Operations Data:(1)(2)(3)(4) |
|
|
|
|
|
|
|
|
|
|
| |||||
Revenue |
| $ | 437,596 |
| $ | 351,456 |
| $ | 345,522 |
| $ | 237,174 |
| $ | 149,926 |
|
Gross profit |
| 80,802 |
| 71,478 |
| 61,278 |
| 38,714 |
| 24,634 |
| |||||
Operating income (loss) |
| (25,033 | ) | 10,464 |
| (1,756 | ) | (1,908 | ) | (4,949 | ) | |||||
Loss from continuing operations |
| (39,471 | ) | (7,309 | ) | (27,928 | ) | (18,426 | ) | (23,974 | ) | |||||
(Loss) income from discontinued operations |
| (38,259 | ) | (1,826 | ) | (2,653 | ) | (47,180 | ) | 783 |
| |||||
Net loss |
| (77,730 | ) | (9,135 | ) | (30,581 | ) | (65,606 | ) | (23,191 | ) | |||||
|
|
|
|
|
|
|
|
|
|
|
| |||||
Net (loss) income attributable to common stockholders per share —basic and diluted: |
|
|
|
|
|
|
|
|
|
|
| |||||
Continuing operations |
| $ | (2.18 | ) | $ | (0.46 | ) | $ | (10.77 | ) | $ | (9.46 | ) | $ | (12.33 | ) |
Discontinued operations |
| (2.10 | ) | (0.11 | ) | (0.66 | ) | (24.22 | ) | 0.40 |
| |||||
Total |
| $ | (4.28 | ) | $ | (0.57 | ) | $ | (11.43 | ) | $ | (33.68 | ) | $ | (11.93 | ) |
|
| December 31, |
| |||||||||||||
(in thousands) |
| 2012 |
| 2011 |
| 2010 |
| 2009 |
| 2008 |
| |||||
|
|
|
| (Restated) |
|
|
| (Unaudited) |
| (Unaudited) |
| |||||
Balance Sheet Data: (1)(3)(4) |
|
|
|
|
|
|
|
|
|
|
| |||||
Current assets |
| $ | 129,152 |
| $ | 101,088 |
| $ | 98,435 |
| $ | 39,206 |
| $ | 46,024 |
|
Total assets |
| 326,403 |
| 343,342 |
| 296,054 |
| 231,841 |
| 282,015 |
| |||||
Current liabilities |
| 113,358 |
| 93,065 |
| 71,482 |
| 80,921 |
| 191,201 |
| |||||
Long-term debt and capital lease obligations, net of current portion |
| 161,054 |
| 111,837 |
| 107,295 |
| 131,407 |
| 1,314 |
| |||||
Total stockholders’ equity |
| 48,303 |
| 115,662 |
| 112,207 |
| 19,513 |
| 82,999 |
| |||||
(1) Results of operations and balance sheet data has been restated as of and for the year ended December 31, 2011. Refer to the Explanatory Note appearing at the beginning of this Annual Report on Form 10-K and Note 2 of Item 8, “Financial Statements and Supplementary Data,” for additional information.
(2) We have never paid any cash dividends, and we do not anticipate paying cash dividends in the foreseeable future.
(3) Our results of operations and balance sheet data reflect the following material trends that investors should consider when evaluating our historical performance:
(i) Business acquisitions have contributed to the growth in our results of operations and balance sheet data and have expanded our customer service capabilities. Refer to Note 5 of Item 8, “Financial Statements and Supplementary Data,” for additional information.
(ii) We have discontinued certain businesses to align our operations with our customers’ most significant areas of growth. The results of operations of our wireline telecommunications business unit (“Wireline Group”) and certain other businesses have been reclassified to discontinued operations for all periods presented. The assets and liabilities of the Wireline Group were reflected in our historical balance sheet data until their sale on December 28, 2012. Refer to Note 18 of Item 8, “Financial Statements and Supplementary Data,” for additional information.
(iii) On January 27, 2010, we entered into a reverse merger agreement with Berliner Communications, Inc. (“Berliner”) pursuant to which we became a wholly owned subsidiary of Berliner. Beginning on that date, the fair value of the assets acquired and liabilities assumed from Berliner have been incorporated into our consolidated balance sheets, and our results of operations reflect the operating results of the combined entity. Refer to Note 5 of Item 8, “Financial Statements and Supplementary Data,” for additional information.
(4) Our results of operations and balance sheet data were materially affected by following other items during the periods indicated:
(i) Our results of operations for the years ended December 31, 2012 and 2011 included expense of $10.1 million and income of $8.5 million, respectively, related to contingent consideration, which also had the effect of increasing and reducing our current liabilities, respectively. Refer to Note 11 of Item 8, “Financial Statements and Supplementary Data,” for additional information.
(ii) Our loss from continuing operations for the year ended December 31, 2012 included pre-tax goodwill impairment charges of $14.9 million related to our wireless reporting unit, which also had the effect of reducing our total assets. Our loss from discontinued operations for the years ended December 31, 2012 and 2009 included pre-tax impairment charges of $35.2 million and $38.4 million, respectively, related to our wireline reporting unit, which also had the effect of reducing our total assets.
(iii) Our loss from continuing operations for the years ended December, 31, 2012 and 2010 include restructuring charges of $8.0 million and $1.0 million, respectively, related to changes in our management structure in order to reposition executive resources from non-core activities to support the continued growth in wireless and fulfillment services. Refer to Note 19 of Item 8, “Financial Statements and Supplementary Data,” for additional information.
(iv) Our loss from continuing operations for the years ended December 31, 2011 and 2010 included pre-tax losses on extinguishment of debt of $3.5 million and $1.7 million, respectively.
ITEM 7. MANAGEMENT’S DISCUSSION AND ANALYSIS OF FINANCIAL CONDITION AND RESULTS OF OPERATIONS
This discussion should be read together with our consolidated financial statements and their notes included elsewhere in this Form 10-K. Unless the context otherwise requires, references to “we,” “us,” “our” and the “Company” refer to UniTek Global Services, Inc. and its subsidiaries.
Restatement of Previously Issued Financial Statements
This Form 10-K includes the restatement of certain of the Company’s previously issued consolidated financial statements and data. It also amends previously filed management’s discussion and analysis of financial condition and results of operations and other disclosures for the periods presented in this Form 10-K. Refer to the Explanatory Note appearing at the beginning of this Annual Report on Form 10-K and the overview sub-section of the financial condition and results of operations section of this discussion and analysis for further information.
Business Overview
We are a leading full-service provider of permanently outsourced infrastructure services, offering an end-to-end suite of technical services to customers in the wireless telecommunications, public safety, satellite television and broadband cable industries in the United States and Canada. Our services include:
· Comprehensive installation and fulfillment;
· Construction and project management;
· Wireless telecommunication infrastructure services; and
· Wireless system integration for public safety and land mobile radio applications.
Our customers utilize our services to build and maintain their infrastructure and networks and to provide residential and commercial fulfillment services. These services are critical to our customers’ ability to deliver voice, video and data services to their end users. Our customers include leading media and telecommunication companies such as DIRECTV, AT&T, Clearwire Communications, Ericsson, Sprint, T-Mobile, Comcast, Charter Communications, Time Warner Cable and Rogers Communications.
The following table presents customer concentration information as a percentage of revenues:
|
| Year Ended December 31, |
|
|
| ||||
|
| 2012 |
| 2011 |
| 2010 |
| Primary Segment |
|
Revenues from top 10 customers |
| >90 | % | >90 | % | >90 | % |
|
|
Revenues from significant customers: |
|
|
|
|
|
|
|
|
|
DIRECTV |
| 43 | % | 56 | % | 55 | % | Fulfillment |
|
AT&T |
| 17 | % | 1 | % | — |
| Engineering & Construction |
|
Comcast |
| 15 | % | 17 | % | 17 | % | Fulfillment |
|
We have longstanding relationships with many of our customers and often provide services under multi-year master service agreements and other service agreements. Because our business is concentrated among relatively few major customers, our business could be negatively impacted if the amount of business we obtain from these customers is reduced, or if we complete the required work on projects and cannot replace them with similar projects.
We have actively pursued a diversification and expansion strategy in our operations in the markets we serve. Our strategy has enabled us to grow and scale our business units across a diversified set of customers, geographies and end markets by executing to the highest performance standards. We intend to leverage our outstanding performance, commitment to technology and shared services platform to continue to grow our revenues and profitability.
Critical Accounting Policies and Estimates
This discussion and analysis of our financial condition and results of operations is based upon our consolidated financial statements prepared in conformity with U.S. generally accepted accounting principles (“GAAP”), which require us to make various estimates and assumptions. We base our estimates on historical experience and on various other assumptions that we believe to be reasonable under the circumstances. As management estimates, by their nature, involve judgment regarding future uncertainties, actual results may differ from these estimates if conditions change or if the assumptions used in making these estimates ultimately prove to be incorrect. Such changes in estimates are reflected in our results of operations in the period in which the changes are made, and if material, their effects are disclosed.
We believe that the following accounting policies are the most critical to the preparation of our consolidated financial statements. This is because the nature of these policies requires us to make significant or complex judgments and estimates and because the impact of these policies was material to either our financial condition or our results of operations, or both. Refer to Note 4 of Item 8, “Financial Statements and Supplementary Data,” for further information about our significant accounting policies.
Revenue Recognition
We recognize revenues when persuasive evidence of an arrangement exists, delivery has occurred or services have been rendered, the price is fixed or determinable and collectability is reasonably assured. Revenues are recognized net of any estimated allowances.
Fulfillment
We recognize revenues from installation and fulfillment services as the services are rendered. Fulfillment services are performed pursuant to work orders under master service or similar types of service agreements that specify units of service to be performed for a contractually stated fixed price per unit. Revenues from fulfillment services are reported net of equipment costs payable to our customers because we act as an agent with respect to the equipment. Generally, the recognition of revenues in our Fulfillment segment does not require us to make significant estimates or assumptions.
Revenues from this segment were $305.3 million, $286.7 million and $270.0 million for the years ended December 31, 2012, 2011 and 2010, respectively.
Engineering and Construction
We recognize revenues from infrastructure construction, equipment installation and project management contracts under the percentage-of-completion method based on the percentage of costs incurred to-date compared to estimated total costs at completion. Engineering and construction services are performed pursuant to work orders under agreements or master agreements that specify units of service to be performed for a contractually stated price per unit that we are entitled to receive upon satisfactory completion of each unit. Contracts generally become billable upon satisfaction of contractually-specified performance milestones per individual contract terms or, in most cases, for work completed to-date in the event of project termination. We combine contracts when they are, in effect, parts of a single project with an overall profit margin. We review and revise our determination of total contract revenues and our estimates of total cost quarterly as work progresses. Any adjustments to earnings arising from such revisions are made cumulatively through the date of revision and included in results of operations in the period of revision. Costs used to determine percentage-of-completion include direct costs such as materials, labor and subcontractor costs and indirect costs specifically allocable or identifiable to each contract, such as indirect labor, supplies, tools and repairs. Contract losses are recognized currently if it becomes known that a contract will be performed at an overall loss. We recognize revenues from standalone site acquisition and zoning service contracts based upon output measures using contract milestones as the basis.
Unbilled contract revenues represent revenues recognized on infrastructure construction and equipment installation contracts that are not yet billed or billable pursuant to contract terms. Billings in excess of costs and estimated earnings principally represent the value of services to customers that have been billed as of the balance sheet date but for which the requisite services have not yet been rendered.
Certain contracts include multiple deliverables, typically involving the design, construction and implementation of public safety radio networks with a separate maintenance component for a specific period of time following implementation. The maintenance component of these contracts is typically for a period of one to ten years. We account for the maintenance component of these contracts as a separate unit of accounting with the revenue being recognized on a pro-rata basis over the term of the maintenance period. The revenue for the remaining portion of the contract is recognized on the percentage-of-completion method. The value assigned to each unit of accounting is determined primarily based upon its separate selling price. The liability associated with these maintenance contracts is reflected within other current liabilities and other liabilities.
Costs relating to customer claims and change orders are expensed in the period incurred unless approved by the customer or persuasive evidence exists that the costs will be recovered, in which case they are included in our estimates of total contract revenues and costs. We determine the likelihood that costs relating to claims and change orders will be recovered based upon past practices or specific discussions, correspondence or negotiation with the customer.
At any time we have numerous contracts in progress which can be at various stages of completion. Accounting for revenues and profits on long-term projects requires estimates of progress towards completion to determine the extent of profit recognition. These estimates may be revised as additional information becomes available. We review all our significant contracts on a quarterly basis and revise our estimates as appropriate. The most significant estimates we must make in order to recognize revenues are determining (i) the total estimated cost of each project at completion, including whether and when any contracts will be performed at an overall loss, and therefore recognizing that loss immediately; (ii) the relative values of each unit of accounting under multiple-element arrangements; (iii) the likelihood that costs related to claims and change orders will be recoverable; and (iv) for certain contracts, the estimation of total contract revenue. Such estimates, by their nature, involve judgment regarding future uncertainties and could result in significant changes in estimate in the future. Further, as discussed in the Explanatory Note appearing at the beginning of this Annual Report on Form 10-K and elsewhere in this discussion and analysis, certain of our estimates related to revenue recognition were corrected as part of our restatement.
Revenues from this segment were $132.3 million, $64.7 million and $75.5 million for the years ended December 31, 2012, 2011 and 2010, respectively.
Impairment Testing of Goodwill and Other Long-Lived Assets
We review our goodwill and indefinite-lived intangible assets for impairment at least annually or more often if an event occurs or circumstances change which indicates that their carrying amount may not exceed their fair value. We perform our annual impairment review as of the first day of the fourth quarter of each fiscal year based upon information and estimates available at that time. To perform our impairment testing, we first assess qualitative factors to determine whether it is more likely than not that the fair values of its reporting units are less than their carrying values as a basis for determining whether or not to perform the quantitative two-step goodwill impairment test. We then estimate the fair value of each reporting unit not meeting the qualitative criteria and compare its fair value to its carrying value. If the carrying value of a reporting unit exceeds its fair value, we determine the implied fair value of goodwill assigned to that reporting unit by deducting the estimated the fair value of its net assets, other than goodwill, from its overall fair value. If the fair value of goodwill is less than its carrying value, we recognize an impairment loss for the difference.
Goodwill and any additions to goodwill related to acquired businesses are assigned to individual reporting units. We have currently established our reporting units at the operating segment level.
We review other long-lived assets, consisting primarily of property and equipment and intangible assets with finite lives, for recoverability whenever events or changes in circumstances indicate that the carrying value of the assets may not be recoverable. In analyzing recoverability, we use projections of future undiscounted cash flows from the assets. These projections are based on our view of growth rates for the related business, anticipated future economic conditions and estimates of residual values. If the future undiscounted cash flows of such assets are less than their carrying value, we recognize an impairment loss for the amount by which their carrying value exceeds their fair value.
The profitability of individual reporting units or other assets may suffer periodically from downturns in customer demand and other factors resulting from the cyclical nature of our business, the high level of competition existing within our industry, the concentration of our revenues within a limited number of customers, and the level of overall economic activity. During times of economic slowdown, our customers may reduce their capital expenditures and defer or cancel pending projects. Individual reporting units may be relatively more impacted by these factors than our company as a whole. As a result, demand for the services of one or more of our reporting units could decline resulting in an impairment of goodwill or intangible assets.
The carrying value of our goodwill was $121.9 million and $163.8 million at December 31, 2012 and 2011, respectively. The carrying value of our other long-lived assets was $75.3 million and $78.5 million at December 31, 2012 and 2011, respectively.
Interim Tests of Impairment
During the third quarter of 2012, we committed to a plan to sell the net assets of our wireline telecommunications business unit (the “Wireline Group”). As a result of committing to this plan, we performed interim tests of impairment of the property and equipment and the goodwill of the Wireline Group.
We estimated the future cash flows of the property and equipment of the Wireline Group and determined that their carrying value exceeded both the sum of their undiscounted cash flows and their fair value, resulting in an impairment charge of $2.2 million. The estimated future cash flows used in the undiscounted cash flow test and the fair value measurement were based on anticipated growth rates for the Wireline Group, future economic conditions and residual values (Level 3 measurements).
We estimated the fair value of the Wireline Group, which also represents a reporting unit under GAAP, and determined that the implied fair value of the goodwill was zero, resulting in an impairment charge of $33.0 million. The fair value of the goodwill was implied by calculating the fair value of the reporting unit and subtracting from that the fair values of the assets attributable to the reporting unit other than goodwill. The fair value of the reporting unit was determined by considering both a market approach, including private bid information obtained by us (Level 2 measurements) and the future discounted cash flows attributable to the reporting unit, which was determined using our internal operating forecasts, weighted-average cost of capital, and certain other assumptions (Level 3 measurements). The fair values of the other assets and liabilities attributable to the reporting unit, other than property and equipment, were calculated using historical cost, which was materially representative of their fair values due to the relatively short-term nature of the assets and liabilities (Level 2 measurements) and was used only for purposes of calculating the implied fair value of goodwill.
As a result of the restatement of the results of operations of Pinnacle, during the first quarter of 2012, we performed an interim impairment test of goodwill of the wireless reporting unit. We determined the fair value of the wireless reporting unit using a combination of the market-based approach and income approach relying on a discounted cash flow analysis. Determining fair value requires the exercise of significant judgment, including judgment about appropriate discount rates, perpetual growth rates, the amount and timing of expected future cash flows, as well as relevant comparable company earnings multiples for the market-based approach. The discounted cash flow methodology based on known or knowable information at the time of interim testing, includes seven-year projections of revenues, operating costs and cash flows considering historical and anticipated future results, general market conditions, and the impact of planned business and operational strategies. The terminal value has been estimated through the use of the Gordon Growth Model. This model estimates a terminal value through the capitalization of a stabilized amount that is assumed to grow annually at a constant growth rate (4%). These projections were based on our internal business model for 2012, and for the subsequent years beyond 2012, the growth rates we used are an estimate of the future growth in the industry in which we participate. The discount rates used in the discounted cash flow was estimated to be 18.1% per annum, and are intended to reflect the risks inherent in the future cash flows of the reporting unit and are based on an estimated cost of capital, which we determined based on our estimated cost of capital relative to our capital structure. A 100 basis point change in the discount rate would have had a material impact on the results of the impairment analysis. As a result of our interim testing, no impairment of goodwill was indicated.
Annual Tests of Impairment
We performed our most recent annual goodwill impairment test as of September 30, 2012, the first day of our fourth fiscal quarter. When we performed our annual goodwill impairment test, we determined that the carrying value of the wireless reporting unit exceeded the fair value. We determined fair value using a combination of the market-based approach and the income approach relying on a discounted cash flow analysis. Determining fair value requires the exercise of significant judgment, including judgment about appropriate discount rates, perpetual growth rates, the amount and timing of expected future cash flows, as well as relevant comparable company earnings multiples for the market-based approach. The discounted cash flow methodology includes five-year projections of revenues, operating costs and cash flows considering historical and anticipated future results, general market conditions, and the impact of planned business and operational strategies. The terminal value has been estimated through the use of the Gordon Growth Model. This model estimates a terminal value through the capitalization of a stabilized amount that is assumed to grow annually at a constant growth rate (3%). These projections are based on our internal business model for 2013, and for the four subsequent years beyond 2013, the growth rates we used are an estimate of the future growth in the industry in which we participate, considering our liquidity position and the refinancing of our debt which occurred in July 2013 (see Note 22 of Item 8, “Financial Statements and Supplementary Data”). The discount rates used in the discounted cash flow was estimated to be 18.6% per annum, and are intended to reflect the risks inherent in the future cash flows of the reporting unit and are based on an estimated cost of capital, which we determined based on our estimated cost of capital relative to our capital structure. A 100 basis point change in the discount rate would not have had a material impact on the results of the impairment analysis.
Our analysis indicated that the reporting unit fair value was below its carrying value as of September 30, 2012, and accordingly, we performed the second step in the analysis. The second step required that we allocate the fair value of our reporting unit to all assets and liabilities as if the reporting unit had been acquired in a business combination at the date of the impairment test. We then compared the implied fair value of the wireless reporting unit’s goodwill to its carrying amount ($25.5 million). Since the carrying amount of our goodwill exceeded its implied fair value, we recognized an impairment loss in an amount equal to that excess. In the fourth quarter of 2012, the carrying value of goodwill for the wireless reporting unit exceeded its implied fair value and we recorded a noncash, pre-tax impairment charge of $14.9 million.
Allowance for Doubtful Accounts
We maintain an allowance for doubtful accounts for estimated losses resulting from the inability of our customers to make required payments. We record a specific reserve for known or suspected doubtful accounts receivable. For all other accounts, we record a general reserve based on the length of time receivables are past due and historical write-off experience. We evaluate the adequacy of the reserve using several factors including length of time a receivable is past due, historical experience with the customer, changes in the customer’s credit worthiness, the customer’s payment history, the length of the customer’s relationship with us, the customer’s financial condition, availability of mechanics’ and other liens, existence of payment bonds and other sources of payment, current industry trends and current economic trends. Account balances are charged off against the allowance when they are deemed uncollectible. The provision for doubtful accounts is recorded as a reduction to revenues or in selling, general and administrative expenses depending upon whether the related revenues have been billed to the customer.
If our estimates of the collectability of accounts receivable change, we may be required to adjust the allowance for doubtful accounts, which could increase or decrease our profitability.
Accounts receivable, net, was $102.5 million and $84.6 million at December 31, 2012 and 2011, respectively, and our allowance for doubtful accounts was $6.3 million and $3.6 million at December 31, 2012 and 2011, respectively.
Accrued Insurance
We maintain high-deductible insurance policies for workers’ compensation, general liability, automobile, medical and dental claims. Because most claims against us do not exceed our deductibles, we are effectively self-insured for substantially all claims. We establish insurance reserves for estimates of the loss that we will ultimately incur on reported claims and claims that have been incurred but not yet reported. Our insurance reserves incorporate historical loss experience and judgments about the present and expected levels of cost per claim. Trends in actual experience are a significant factor in the determination of such reserves. We update our estimates and the appropriateness of our reserves quarterly based upon known facts, historical trends and our judgments regarding future claims.
Insurance claims may take several years to completely settle. Consequently, actuarial estimates are required to project the ultimate cost that will be incurred to fully resolve the claims. A number of factors can affect the actual cost of a claim, including the length of time the claim remains open, trends in health care costs and the results of related litigation. Furthermore, claims may emerge in future years for events that occurred in a prior year at a rate that differs from previous actuarial projections. We believe that the amounts we have accrued for such claims are adequate, but actual experience in claim frequency or severity, or both, could materially differ from our estimates and impact our results of operations.
Accrued insurance was $16.2 million and $13.7 million at December 31, 2012 and 2011, respectively.
Income Taxes
The provision or benefit for income taxes consists of taxes currently due plus deferred taxes related primarily to differences between the basis of assets and liabilities for financial and income tax reporting. Deferred tax assets and liabilities represent the future tax return consequences of those differences, which will either be deductible or taxable when the assets and liabilities are recovered or settled. Deferred tax assets are also recognized for operating losses that are available to offset future taxable income. Deferred tax assets and liabilities are reflected at income tax rates applicable to the period in which the deferred tax assets and liabilities are expected to be realized or settled. As changes in tax laws or rates are enacted, deferred tax assets and liabilities are adjusted through the provision or benefit for income taxes.
We establish tax valuation allowances to reduce deferred tax assets, such as tax loss carryforwards, to net realizable value. We consider future pretax income and ongoing prudent and feasible tax planning strategies in assessing the net realizable value of deferred tax assets and the need for such a valuation allowance. In the event that we determine that we may not be able to realize all or part of the net deferred tax asset in the future, a valuation allowance for the deferred tax asset is charged against the provision or benefit for income taxes in the period such determination is made. The establishment of the valuation allowance does not preclude us from utilizing its deferred tax assets in the future; however, we have experienced an ownership change as defined under Section 382 of the Internal Revenue Code, and therefore the use of the net operating loss carry forwards is subject to limitation.
We provide an intra-period tax allocation of the provision or benefit for income taxes to continuing operations and discontinued operations.
As of December 31, 2012, we have net operating loss carryforwards of approximately $86.6 million for federal income tax purposes, prior to consideration of valuation allowances, which begin to expire in 2014. Based on our history of operating losses and our forecasts for future periods, we have determined that it is more likely than not that the federal and state net operating loss carryforwards and other temporary differences will not be realized. Accordingly, we established valuation allowances against the related deferred tax assets of $79.7 million as of December 31, 2012. If we ultimately are able to utilize these deferred tax assets to offset taxable income in future periods, we could recognize a significant income tax benefit that could improve our results of operations by a material amount.
Business Combinations
We account for business combinations by estimating the fair value of consideration paid for acquired businesses, including contingent consideration, and allocating that amount to the fair values of assets acquired and liabilities assumed, with the remainder assigned to goodwill. Our determinations of fair values are based on estimates and assumptions utilizing customary valuation procedures and techniques, which require us, among other things, to estimate future cash flows and discount rates. The accounting for business combinations is preliminary and subject to potential adjustment until finalized, no later than one year from the date of acquisition.
If actual results differ significantly from our estimates, these differences could affect our balance sheets and results of operations in future periods. For example, if actual cash flows differ significantly from our original estimate, or if we change our estimate of cash flows by a significant amount, this may result in an impairment of intangible assets, goodwill or other assets. We may also be required to retrospectively adjust depreciation and amortization or other balances if our preliminary acquisition accounting changes significantly in a subsequent period.
Contingent Consideration
We recognize the acquisition date fair value of contingent consideration as part of the consideration transferred in a business combination. Contingent consideration is classified as either a liability or equity in accordance with GAAP. If classified as a liability, the liability is remeasured to fair value at each subsequent reporting date until the contingency is resolved, with changes in fair value recorded on the statement of comprehensive income or loss. If classified as equity, contingent consideration is not remeasured and subsequent settlement is accounted for within equity.
The subsequent remeasurement of contingent consideration requires us to make significant estimates and judgments of, among other things, the future results against which contingent consideration is based. The sections that follow describe the judgments and estimates made in connection with the remeasurement of contingent consideration for our business acquisitions.
Expense related to contingent consideration was $10.1 million for the year ended December 31, 2012, and income related to contingent consideration was $8.5 million for the year ended December 31, 2011. Contingent consideration was $1.9 million and $14.9 million at December 31, 2012 and 2011, respectively, and was related to the acquisitions of Skylink LTD and Pinnacle Wireless, Inc., respectively.
Pinnacle Wireless, Inc.
Our agreement to purchase Pinnacle Wireless, Inc. (“Pinnacle”) provided for the payment of contingent consideration in the form of earn-out payments, not to exceed $30.0 million, based on the achievement of contractual EBITDA performance targets for the six months ended September 30, 2011, the twelve months ended March 31, 2012 and / or the twelve months ended March 31, 2013. The Asset Purchase Agreement provided that if the September 30, 2011 or March 31, 2012 performance targets were not met, the entire earn-out, or some portion thereof, still could be earned based on Pinnacle’s actual EBITDA attained for the twelve months ending March 31, 2013. We used a Monte Carlo simulation model applied to our estimate of Pinnacle’s expected EBITDA performance at each of the measurement dates to estimate the fair value of the potential earn-out. The significant assumptions used in this valuation methodology depended upon considerable judgment, including forecasted EBITDA, an estimate of the volatility of Pinnacle’s earnings based upon a selected peer group and an interest rate tied to our credit risk profile with terms approximating the earn-out periods. Utilizing the estimated peer group volatility and a range of projected EBITDA outcomes between 80% and 120% of the estimated EBITDA, the estimated range of outcomes on an undiscounted basis was expected to be between $17.4 million and $30.0 million as of the purchase date on April 3, 2011.
At the date of the Pinnacle acquisition, the fair value of the contingent consideration was estimated to be $25.8 million, which we were required to remeasure in subsequent periods until the liability was settled. At October 1, 2011, the estimated fair value of the earn-out declined by $13.1 million to $12.7 million due to reduced profitability forecasts. At December 31, 2011, the estimated fair value of the earn-out increased to $17.3 million based on (i) Pinnacle’s actual 2011 EBITDA and (ii) Pinnacle’s revised EBITDA forecasts for the twelve month periods ending March 31, 2012 and 2013, and the carrying value was reduced by a $2.4 million pre-payment of the liability. The net adjustment for 2011 of $8.5 million was included as income related to contingent consideration in our consolidated statement of comprehensive income or loss for the year ended December 31, 2011. At March 31, 2012, using information then available, the estimated fair value of the earn-out increased to $25.8 million based on (i) Pinnacle’s revised EBITDA forecast for the twelve months ending March 31, 2013 and (ii) the provisions of the agreement to purchase Pinnacle regarding the calculation of the earn-out for that period.
Based on Pinnacle’s pre-restatement EBITDA data, in December 2011 and June 2012, we transferred an aggregate of $27.8 million in cash and shares of common stock. These payments exceeded the fair value of the liability at March 31, 2012, resulting in additional expense of $1.9 million that was included in the consolidated statement of comprehensive income or loss for the three months ended June 30, 2012. Based on currently available information, it has been determined that no earn-out was payable under the agreement to purchase Pinnacle.
Skylink LTD
The fair value of contingent consideration related to the acquisition of Skylink LTD (“Skylink”) was calculated using the average of probability-weighted contingent consideration payments resulting from expected revenues at each of the measurement dates. The significant assumptions used in these calculations included forecasted revenues and the estimated likelihood for each performance scenario. The fair value of the Skylink contingent consideration of $5.3 million, of which the initial earn-out payment of $3.5 million was paid in December 2012, reflects our belief that the revenue target is highly likely to be fully met; however, should actual results differ from our expectations, each $1.0 million shortfall of actual revenue compared to the target would decrease the fair value of the Skylink contingent consideration by approximately $0.2 million. As of December 31, 2012, we have not yet paid the $4.0 million minimum payment for the second earn-out or the remaining portion of contingent consideration of up to $2.0 million (which has an estimated fair value of $1.9 million at December 31, 2012), both of which were payable on May 31, 2013. However, our obligation to make these payments required certain conditions to be met, including minimum levels of our liquidity after giving effect to such payments, which had not yet occurred after December 31, 2012. Additionally, as of May 31, 2013 this obligation accrues interest at an amount equal to 10% per annum and contains an optional equity conversion right.
Legal and Regulatory Contingencies
From time to time, we are party to various lawsuits, claims, or other legal proceedings and are subject, due to the nature of our business, to governmental agency oversight, audits, investigations and review. Legal and regulatory contingencies are reflected in our consolidated financial statements based on our assessment of the expected outcome or resolution of the contingencies. We accrue for a contingency when it is probable a liability has been incurred and the amount of loss can be reasonably estimated.
We and certain of our former and current officers are defendants in a class action shareholder lawsuit arising from the matters described in the Explanatory Note appearing at the beginning of this Annual Report on Form 10-K and elsewhere in this discussion and analysis. Subject to certain limitations, we are obligated to indemnify our current and former officers in connection with any regulatory or litigation matter. This obligation arises under the terms of our Amended and Restated Articles of Incorporation, our Amended and Restated Bylaws and Delaware law. An obligation to indemnify generally means that we are required to pay or reimburse the individual’s reasonable legal expenses and possibly damages and other liabilities that may be incurred. No costs related to these indemnifications were recorded in 2012, 2011 or 2010.
We are unable to predict the outcome of legal and regulatory matters. Our accounting and disclosures of these matters are based on our best judgments as to the probability of adverse ruling and our estimates of the resulting damages to us. Even if we believe that the ultimate resolution of such matters will not have a material adverse effect on our financial position or results of operations, if actual future legal judgments or amounts differ from our estimates, our results or operations or financial condition could be significantly harmed.
Recently Issued Accounting Pronouncements
There were no recently issued accounting pronouncements that significantly affected our financial condition or results of operations or any yet-to-be-adopted accounting standards that, when adopted, are expected to materially affect our financial condition or results of operations.
Summary of Financial Condition and Results of Operations
Overview
The following sections present our discussion and analysis of our financial condition and results of operations for the years ended December 31, 2012, 2011 and 2010 and for the quarterly and year-to-date periods ended September 29, 2012 compared to October 1, 2011, June 30, 2012 compared to July 2, 2011 and March 31, 2012 compared to April 2, 2011. We have derived this data from our consolidated financial statements and other financial information included elsewhere in this report.
We report our results in two segments based on the services that we provide and the industries that we serve:
· Our Fulfillment segment provides comprehensive installation and fulfillment services to customers in the satellite television and broadband cable industries. Revenues in this segment are primarily recurring in nature and based on predetermined rates for each type of service performed. Our two most significant customers for this segment in 2012 were DIRECTV and Comcast.
· Our Engineering and Construction segment provides infrastructure services, systems integration for public safety and land mobile radio applications, construction and project management services to customers in the wireless telecommunications and public safety industries. Revenues in this segment are primarily contract-based ranging in duration to as much as three years and are recognized primarily using the percentage-of-completion method using estimated costs incurred to-date or milestones achieved to measure progress towards completion. Our two most significant projects for this segment in 2012 were awarded by AT&T, where we construct and upgrade wireless towers in a significant region of the northeastern United States, and by Five Star Electric and Eaton Electric, where we work with various contractors to design and construct an integrated public safety communications system at the World Trade Center.
Historical Results
This discussion and analysis addresses a number of themes and other significant matters that are important to understanding our historical financial condition and results of operations for the periods discussed herein. We believe that the most important of those themes include the diversification and expansion of our business and the actions we have taken to align our operations with our customers’ most significant areas of growth.
We have experienced organic growth during the past three years by winning significant new projects from our wireless customers and capturing additional market share from our broadband cable fulfillment competitors. Our historical results also reflect a series of business acquisitions that contributed to our growth and expanded our customer service capabilities as of their respective dates of acquisition:
· On September 14, 2012, we acquired Skylink LTD (“Skylink”), a provider of satellite fulfillment services in Indiana, Ohio and West Virginia, for a purchase price of $23.4 million, including contingent consideration in the form of estimated earn-out payments. The results of Skylink are included in our Fulfillment segment.
· On April 3, 2011, we acquired Pinnacle Wireless, Inc. (“Pinnacle”), a company specializing in wireless system integration for public safety and land mobile radio applications, for a purchase price of $47.0 million, of which a portion was contingent consideration that was not earned, but was paid, and for which we are actively pursuing repayment. The results of Pinnacle are included in our Engineering and Construction segment.
· On January 27, 2010, we merged with Berliner Communications, Inc., which expanded our presence in the wireless telecommunications market for site acquisition and construction of wireless cell towers and related services. The results of Berliner Communications, Inc. have been reported as part of our Engineering and Construction segment.
· During the last three years, we acquired a number of small broadband cable fulfillment businesses (the “Cable Acquisitions”) to expand our broadband cable installation and fulfillment presence in certain geographies across the United States and to enhance our customer diversification. The results of the Cable Acquisitions are included in our Fulfillment segment.
Our results of operations also reflect actions we have taken to align our operations with what we perceive as our customers’ most significant areas of growth. These include growing consumer demand for wireless bandwidth and technological improvements, the continuing need for best-in-class fulfillment services by our satellite television customers, and vendor consolidation by broadband cable service providers which has created opportunities for us to capture additional market share in certain geographies. In order to concentrate our presence in these areas of growth, we sold our wireline telecommunications business unit (the “Wireline Group”) during the fourth quarter of 2012, and we have closed certain broadband cable fulfillment and wireless service locations that reside outside of the geographic regions where we expect the greatest amount of growth.
We have actively pursued a diversification and expansion strategy in our operations in the markets we serve. Our strategy has enabled us to grow and scale our business units across a diversified set of customers, geographies and end markets by executing to the highest performance standards.
Trends and Uncertainties
The discussion and analysis of our historical results included herein may not be indicative of our future financial condition or results of operations as a result of recent trends and uncertainties that have arisen subsequent to December 31, 2012. We believe that these trends and uncertainties could materially impact our results of operations and financial condition in future periods, and include:
· Limitations on our ability to bid on new engineering and construction projects as a result of our restatement and the delayed issuance of our 2012 financial statements, which may have harmed the growth of our wireless business;
· The need to improve our management of working capital within our wireless construction business, which if not managed well could require us to borrow additional amounts, which would reduce our profitability, or cause us to become ineligible for new borrowings or default on our debt, or both;
· Potential harm to our relationships with our customers, some of which have reduced or have indicated they may reduce the amount of business they plan to do with us in the future, or to our reputation in the industry, which could harm our ability to attract new customers, as a result of the outcomes of our Audit Committee Investigation;
· Potential harm to our relationships with our vendors, resulting from our inability to pay them timely for portions of 2012 and 2013 and from the outcomes of the Audit Committee Investigation, which could affect our ability to maintain the insurance, bonding and other requirements of our customers contracts and thereby cause us to lose business;
· Significant professional costs that we incurred during 2013 to complete the Audit Committee Investigation and the restatement of our financial statements, which will reduce our profitability for 2013;
· Significant changes to the costs of our debt financing, which now include higher rates of interest and other fees compared to our previous debt that will reduce our profitability in 2013 and beyond; and
· New class action lawsuits that have been filed against us during 2013, the outcomes of which are currently uncertain.
Notwithstanding the aforementioned trends, we intend to leverage our outstanding past performance, commitment to technology and shared services platform to continue to grow our revenues and profitability in 2013 and beyond.
Restatement of Previously Issued Financial Statements
This discussion and analysis includes financial information that has been restated as a result of the improper accounting practices identified by the Audit Committee Investigation. The investigation determined that several employees of the Company’s Pinnacle Wireless division engaged in fraudulent activities that resulted in improper revenue recognition. As a result, the Company has restated, and included in this report, financial information as of and for the interim periods ended July 2, 2011, October 1, 2011, December 31, 2011, March 31, 2012, June 30, 2012 and September 29, 2012, and as of and for the year ended December 31, 2011.
The following table summarizes the impact of the aforementioned errors to the restated periods:
|
| Three Months Ended |
| ||||||||||||||||
(in thousands, except per share amounts) |
| September 29, |
| June 30, |
| March 31, |
| December 31, |
| October 1, |
| July 2, |
| ||||||
|
| (Unaudited) |
| (Unaudited) |
| (Unaudited) |
| (Unaudited) |
| (Unaudited) |
| (Unaudited) |
| ||||||
Favorable (unfavorable) impact to: |
|
|
|
|
|
|
|
|
|
|
|
|
| ||||||
Revenues |
| $ | (1,711 | ) | $ | (1,894 | ) | $ | (6,558 | ) | $ | (3,051 | ) | $ | (2,496 | ) | $ | (1,054 | ) |
Gross profit |
| (47 | ) | (2,366 | ) | (4,504 | ) | (3,070 | ) | (1,941 | ) | (914 | ) | ||||||
Income or expense related to contingent consideration |
| — |
| (2,067 | ) | (8,734 | ) | (989 | ) | 13,095 |
| — |
| ||||||
Income or loss from continuing operations |
| (554 | ) | (4,886 | ) | (13,192 | ) | (3,472 | ) | 11,250 |
| (1,346 | ) | ||||||
Net income or loss per share from continuing operations |
| (0.03 | ) | (0.26 | ) | (0.80 | ) | (0.21 | ) | 0.69 |
| (0.08 | ) | ||||||
(in thousands, except per share amounts) |
| Nine Months |
| Six Months |
| Three Months |
| Year Ended |
| Nine Months |
| Six Months |
| ||||||
|
| (Unaudited) |
| (Unaudited) |
| (Unaudited) |
|
|
| (Unaudited) |
| (Unaudited) |
| ||||||
Favorable (unfavorable) impact to: |
|
|
|
|
|
|
|
|
|
|
|
|
| ||||||
Revenues |
| $ | (10,163 | ) | $ | (8,452 | ) | $ | (6,558 | ) | $ | (6,601 | ) | $ | (3,550 | ) | $ | (1,054 | ) |
Gross profit |
| (6,917 | ) | (6,870 | ) | (4,504 | ) | (5,925 | ) | (2,855 | ) | (914 | ) | ||||||
Income or expense related to contingent consideration |
| (10,801 | ) | (10,801 | ) | (8,734 | ) | 12,106 |
| 13,095 |
| — |
| ||||||
Income or loss from continuing operations |
| (18,632 | ) | (18,078 | ) | (13,192 | ) | 6,432 |
| 9,904 |
| (1,346 | ) | ||||||
Net income or loss per share from continuing operations |
| (1.04 | ) | (1.03 | ) | (0.80 | ) | 0.41 |
| 0.63 |
| (0.09 | ) | ||||||
Refer to the Explanatory Note appearing at the beginning of this Annual Report on Form 10-K for additional information about the events surrounding the restatement and Notes 2 and 21 to the consolidated financial statements included in this report for additional information about the impact of the restatement.
Non-GAAP Financial Measurements
As appropriate, we supplement our results of operations determined in accordance with GAAP with certain non-GAAP financial measurements that we believe are useful to investors in assessing our performance. The non-GAAP financial measurements referenced in this discussion and analysis are (1) adjusted earnings before interest, taxes, depreciation and amortization (“Adjusted EBITDA”) and (2) net income or loss after certain non-cash adjustments. These measurements should not be considered in isolation or as a substitute for reported net income or loss and net income or loss per share but rather as an additional way of viewing aspects of our operations that, when viewed with our GAAP results and the provided reconciliations to the corresponding GAAP financial measures, provide a more complete understanding of our business. We strongly encourage investors and shareholders to review our financial statements and publicly filed reports in their entirety and not rely on any single financial measure.
Adjusted EBITDA
Adjusted EBITDA is a key indicator used by our management to evaluate operating performance of our continuing operations and to make decisions regarding compensation and other operational matters. While this Adjusted EBITDA is not intended to replace any presentation included in our consolidated financial statements under generally accepted accounting principles, or GAAP, and should not be considered an alternative to operating performance, we believe this measure is useful to investors in assessing our performance with other companies in our industry. This calculation may differ in method of calculation from similarly titled measures used by other companies or from required calculations pursuant to our loan agreements. We compensate for these limitations by relying primarily on our GAAP results and using Adjusted EBITDA only as supplemental information. Adjusted EBITDA is our EBITDA adjusted for discontinued operations, transaction costs, certain restructuring and other unusual or non-recurring costs and other non-cash charges.
Net Income or Loss after Certain Non-Cash Adjustments
Net income or loss after certain non-cash adjustments is a key indicator used by our management to evaluate operating performance of our continuing operations. While net income or loss after certain non-cash adjustments is not intended to replace any presentation included in our consolidated financial statements under generally accepted accounting principles, or GAAP, and should not be considered an alternative to operating performance, we believe this measure is useful to investors in assessing our performance in comparison with other companies in our industry. Specifically, (i) infrequent or unusual non-cash items may arise such as impairment charges and losses on disposal of assets, (ii) stock-based compensation expense may vary due to factors influencing the estimated fair value of performance-based rewards, estimated forfeiture rates and amounts granted, (iii) non-cash interest expense varies depending on the timing of amendments to our debt and changes to our debt structure and (iv) amortization of intangible assets is impacted by the Company’s acquisition strategy and timing of acquisitions.
Results of Operations — Comparison of Years Ended December 31, 2012 and December 31, 2011
The following table summarizes our results of operations:
|
| Year Ended December 31, |
| ||||
(in thousands) |
| 2012 |
| 2011 |
| ||
|
|
|
| (Restated) |
| ||
|
|
|
|
|
| ||
Revenues |
| $ | 437,596 |
| $ | 351,456 |
|
Cost of revenues |
| 356,794 |
| 279,978 |
| ||
Gross profit |
| 80,802 |
| 71,478 |
| ||
Selling, general and administrative expenses |
| 46,357 |
| 45,229 |
| ||
Expense (income) related to contingent consideration |
| 10,096 |
| (8,506 | ) | ||
Restructuring charges |
| 8,013 |
| — |
| ||
Impairment charges |
| 14,900 |
| — |
| ||
Depreciation and amortization |
| 26,469 |
| 24,291 |
| ||
Operating (loss) income |
| (25,033 | ) | 10,464 |
| ||
Interest expense |
| 15,329 |
| 13,863 |
| ||
Loss on extinguishment of debt |
| — |
| 3,466 |
| ||
Other income, net |
| (1,244 | ) | (608 | ) | ||
Loss from continuing operations before income taxes |
| (39,118 | ) | (6,257 | ) | ||
Income tax expense |
| 353 |
| 1,052 |
| ||
Loss from continuing operations |
| (39,471 | ) | (7,309 | ) | ||
Loss from discontinued operations |
| (38,259 | ) | (1,826 | ) | ||
Net loss |
| $ | (77,730 | ) | $ | (9,135 | ) |
|
|
|
|
|
| ||
Adjusted EBITDA |
| $ | 39,641 |
| $ | 32,343 |
|
Revenues
The following table presents revenue information by segment:
|
| Year Ended December 31, |
|
|
|
|
| |||||||||
|
| 2012 |
| 2011 (Restated) |
|
|
|
|
| |||||||
(Amounts in thousands) |
| Amount |
| % of |
| Amount |
| % of |
| Increase (Decrease) |
| |||||
Fulfillment |
| $ | 305,307 |
| 69.8 | % | $ | 286,734 |
| 81.6 | % | $ | 18,573 |
| 6.5 | % |
Engineering and Construction |
| 132,289 |
| 30.2 | % | 64,722 |
| 18.4 | % | 67,567 |
| 104.4 | % | |||
Total |
| $ | 437,596 |
| 100.0 | % | $ | 351,456 |
| 100.0 | % | $ | 86,140 |
| 24.5 | % |
Revenues increased $86.1 million, or 24.5%, to $437.6 million from $351.5 million for the years ended December 31, 2012 and 2011, respectively. For the Fulfillment segment, revenues increased $18.6 million, or 6.5%, to $305.3 million from $286.7 million for the years ended December 31, 2012 and 2011, respectively. This increase in revenues was attributable to (i) growth from our broadband cable customers ($19.3 million) from new markets awarded by our cable customers and the impact of the Cable Acquisitions; (ii) growth from a new customer relationship with a satellite Internet service provider ($6.0 million); and (iii) the acquisition of Skylink ($8.5 million); partially offset by (iv) lower volumes in our other satellite installation markets due to mild winter weather in the first quarter of 2012, resulting in lower volume of service calls, and the impact of DIRECTV’s strong 2011 performance.
For the Engineering and Construction segment, revenues increased $67.6 million, or 104.4%, to $132.3 million from $64.7 million for the years ended December 31, 2012 and 2011, respectively. The increase in revenues in our Engineering and Construction segment was attributable to (i) new projects to construct and upgrade wireless towers for AT&T in a significant region of the northeastern United States ($67.4 million) and (ii) the full year impact in 2012 of the Pinnacle acquisition ($6.4 million), partially offset by (iii) completion of wireless construction projects during 2011 and 2012.
Gross Profit
The following table presents gross profit information by segment:
|
| Year Ended December 31, |
|
|
|
|
| |||||||||
|
| 2012 |
| 2011 (Restated) |
|
|
|
|
| |||||||
(Amounts in thousands) |
| Amount |
| % of |
| Amount |
| % of |
| Increase (Decrease) |
| |||||
Fulfillment |
| $ | 61,804 |
| 20.2 | % | $ | 66,985 |
| 23.4 | % | $ | (5,181 | ) | (7.7 | )% |
Engineering and Construction |
| 18,998 |
| 14.4 | % | 4,493 |
| 6.9 | % | 14,505 |
| 322.8 | % | |||
Total |
| $ | 80,802 |
| 18.5 | % | $ | 71,478 |
| 20.3 | % | $ | 9,324 |
| 13.0 | % |
Gross profit increased $9.3 million, or 13.0%, to $80.8 million from $71.5 million for the years ended December 31, 2012 and 2011, respectively.
Gross profit as a percentage of revenues was approximately 18.5% for the year ended December 31, 2012, compared to 20.3% for the year ended December 31, 2011.
For the Fulfillment segment, gross margin decreased to 20.2% for the year ended December 31, 2012, compared to 23.4% for the year ended December 31, 2011. This decrease is primarily related to (i) higher mix of revenues from customers with lower margins or in markets with lower population density, and (ii) the mix impact among our broadband cable customers from lower construction volume in 2012, which carries a higher margin compared to standard broadband cable installation services.
For the Engineering and Construction segment, gross margin increased to 14.4% for the year ended December 31, 2012, compared to 6.9% for the year ended December 31, 2011. This improvement in gross margin was primarily the result of revenue growth from a significant customer (AT&T) that carries a higher margin compared to our base wireless business.
Selling, General and Administrative Expenses
Selling, general and administrative expenses increased $1.1 million, or 2.5%, to $46.4 million from $45.2 million for the years ended December 31, 2012 and 2011, respectively. The increase was driven primarily by the $1.2 million full year impact of the Pinnacle acquisition completed in 2011.
The primary components of selling, general and administrative expenses are salaries and related benefits, including non-cash stock-based compensation of $4.9 million and $5.1 million in 2012 and 2011, respectively, professional and legal costs, and facility costs.
Income or Expense related to Contingent Consideration
Expense related to contingent consideration was $10.1 million for the year ended December 31, 2012, and income related to contingent consideration was $8.5 million for the year ended December 31, 2011. The income and expense was related to the remeasurement of contingent consideration to fair value during the respective periods, the majority of which was related to the acquisition of Pinnacle, but also includes expense related to Skylink and the Cable Acquisitions.
During the second half of 2011, the estimated fair value of the Pinnacle earn-out declined based on (i) actual 2011 EBITDA and (ii) revised EBITDA forecasts for the twelve month periods ending March 31, 2012 and 2013, resulting in the recognition of income. During the first half of 2012, using information then available, the estimated fair value of Pinnacle earn-out increased based on (i) the revised EBITDA forecast for the twelve months ending March 31, 2013 and (ii) the provisions of the Asset Purchase Agreement regarding the calculation of the earn-out for that period, resulting in the recognition of expense.
Restructuring Charges
Restructuring charges were $8.0 million for the year ended December 31, 2012. During 2012, we made changes to our management structure in order to reposition executive resources from non-core activities to support the continued growth in wireless and fulfillment services. Restructuring charges resulted from the separation of our former Chief Executive Officer and Chief Information Officer and the elimination of certain management positions including the Executive Chairman and the Chief Administrative Officer. The majority of costs associated with those activities were incurred during the year ended December 31, 2012, with minimal additional costs expected in future periods, although future payments of approximately $2.8 million are expected to occur primarily in 2013. We recognized no restructuring charges during the year ended December 31, 2011.
Impairment Charges
During the fourth quarter of 2012, we recognized a noncash, pre-tax impairment loss of $14.9 million related to the goodwill of the wireless reporting unit. We recognized no asset impairments during the year ended December 31, 2011.
Depreciation and Amortization
Depreciation and amortization increased $2.2 million, or 9.0%, to $26.5 million from $24.3 million for the years ended December 31, 2012 and 2011, respectively. The increase in depreciation and amortization was caused by increased depreciation of $2.5 million and decreased amortization of $0.3 million. The increase in depreciation was primarily attributable to the addition of vehicles in the fourth quarter of 2011 in our Fulfillment segment from the addition of certain new cable businesses. Our intangible asset base increased in 2012 as a result of new acquisitions, resulting in an increase in amortization expense of $1.0 million, which was more than offset in 2012 by the full amortization of intangibles from prior acquisitions.
Interest Expense
Interest expense increased $1.5 million, or 10.6%, to $15.3 million from $13.9 million for the years ended December 31, 2012 and 2011, respectively. Interest expense increased due to the incremental draws on our Term Loan in May and September 2012 and additional borrowings under our Revolving Loan. We used the proceeds from these borrowings to fund business acquisitions and additional working capital resulting from growth from new wireless customers in our Engineering and Construction segment.
Loss on Extinguishment of Debt
During the year ended December 31, 2011, we incurred a $3.5 million loss on the extinguishment of debt in conjunction with the refinancing of our debt on April 15, 2011, the substantial majority of which related to the write-off of unamortized deferred financing fees. No such losses were incurred during the year ended December 31, 2012.
Income Tax Expense or Benefit
Income tax expense was $0.4 million for the year ended December 31, 2012, which consisted primarily of a current tax expense related to our Canadian operations. Income tax expense was $1.1 million for the year ended December 31, 2011, which consisted primarily of a current tax expense of $1.0 million related to our Canadian operations and state income taxes.
Our effective tax rate differs from the Federal statutory tax rate of 35% primarily because we have not yet achieved profitable operations outside of Canada. As a result, our non-Canadian deferred tax assets do not satisfy the criteria for realizability, and we have established a full valuation allowance for such assets. In addition, we are required to pay incomes taxes in certain states and localities in which we do business.
Income or Loss from Discontinued Operations
Loss from discontinued operations increased $36.4 million to $38.3 million from $1.8 million for the years ended December 31, 2012 and 2011, respectively. Discontinued operations for the year ended December 31, 2012 include pre-tax impairment charges of $35.2 million related to the impairments of property and equipment and goodwill in our wireline reporting unit.
Adjusted EBITDA and Net Income or Loss after Certain Non-cash Adjustments
The following table presents the reconciliation of net income or loss to net income or loss after certain non-cash adjustments and Adjusted EBITDA:
|
| Year Ended December 31, |
| ||||
(in thousands) |
| 2012 |
| 2011 |
| ||
|
|
|
| (Restated) |
| ||
|
|
|
|
|
| ||
Net loss |
| $ | (77,730 | ) | $ | (9,135 | ) |
Impairment charges |
| 50,080 |
| — |
| ||
Stock-based compensation |
| 4,905 |
| 5,107 |
| ||
Loss on extinguishment of debt |
| — |
| 3,466 |
| ||
Non-cash interest expense |
| 2,180 |
| 1,945 |
| ||
Amortization |
| 10,588 |
| 10,936 |
| ||
Net (loss) income after certain non-cash adjustments |
| $ | (9,977 | ) | $ | 12,319 |
|
|
|
|
|
|
| ||
Discontinued operations, excluding impairment charges |
| 3,079 |
| 1,826 |
| ||
Income tax expense |
| 353 |
| 1,052 |
| ||
Restructuring charges |
| 8,013 |
| — |
| ||
Expense (income) related to contingent consideration |
| 10,096 |
| (8,506 | ) | ||
Cash interest expense |
| 13,149 |
| 11,918 |
| ||
Other income, net |
| (1,244 | ) | (608 | ) | ||
Depreciation |
| 15,881 |
| 13,355 |
| ||
Transaction costs |
| 291 |
| 987 |
| ||
Adjusted EBITDA |
| $ | 39,641 |
| $ | 32,343 |
|
Adjusted EBITDA increased $7.3 million, or 22.6%, to $39.6 million from $32.3 million for the year ended December 31, 2012. The increase was the result of an increase of $9.3 million in gross profit, partially offset by an increase of $2.0 million in selling, general and administrative expenses excluding stock-based compensation expense and transaction costs.
Results of Operations — Comparison of Years Ended December 31, 2011 and December 31, 2010
The following table summarizes our results of operations.
|
| Year Ended December 31, |
| ||||
(in thousands) |
| 2011 |
| 2010 |
| ||
|
| (Restated) |
|
|
| ||
|
|
|
|
|
| ||
Revenues |
| $ | 351,456 |
| $ | 345,522 |
|
Cost of revenues |
| 279,978 |
| 284,244 |
| ||
Gross profit |
| 71,478 |
| 61,278 |
| ||
Selling, general and administrative expenses |
| 45,229 |
| 36,850 |
| ||
Income related to contingent consideration |
| (8,506 | ) | — |
| ||
Restructuring charges |
| — |
| 991 |
| ||
Depreciation and amortization |
| 24,291 |
| 25,193 |
| ||
Operating income (loss) |
| 10,464 |
| (1,756 | ) | ||
Interest expense |
| 13,863 |
| 23,967 |
| ||
Loss on extinguishment of debt |
| 3,466 |
| 1,677 |
| ||
Other income, net |
| (608 | ) | — |
| ||
Loss from continuing operations before income taxes |
| (6,257 | ) | (27,400 | ) | ||
Income tax expense |
| 1,052 |
| 528 |
| ||
Loss from continuing operations |
| (7,309 | ) | (27,928 | ) | ||
Loss from discontinued operations |
| (1,826 | ) | (2,653 | ) | ||
Net loss |
| $ | (9,135 | ) | $ | (30,581 | ) |
|
|
|
|
|
| ||
Adjusted EBITDA |
| $ | 32,343 |
| $ | 28,332 |
|
Revenues
The following table presents revenue information by segment:
|
| Year Ended December 31, |
|
|
|
|
| |||||||||
|
| 2011 (Restated) |
| 2010 |
|
|
|
|
| |||||||
(Amounts in thousands) |
| Amount |
| % of |
| Amount |
| % of |
| Increase (Decrease) |
| |||||
Fulfillment |
| $ | 286,734 |
| 81.6 | % | $ | 270,009 |
| 78.1 | % | $ | 16,725 |
| 6.2 | % |
Engineering and Construction |
| 64,722 |
| 18.4 | % | 75,513 |
| 21.9 | % | (10,791 | ) | (14.3 | )% | |||
Total |
| $ | 351,456 |
| 100.0 | % | $ | 345,522 |
| 100.0 | % | $ | 5,934 |
| 1.7 | % |
Revenues increased $5.9 million, or 1.7%, to $351.5 million from $345.5 million for the years ended December 31, 2011 and 2010, respectively. For the Fulfillment segment, revenues increased $16.7 million, or 6.2%, to $286.7 million from $270.0 million for the years ended December 31, 2011 and 2010, respectively. This increase in revenues was attributable to (i) growth from our broadband cable customers ($8.5 million), which was primarily attributable to new markets awarded by our U.S. cable customers and the impact of the Cable Acquisitions, partially offset by lower volume from our Canadian customers; and (ii) volume growth from our largest satellite customer DIRECTV ($8.2 million) due to its strong 2011 performance.
For the Engineering and Construction segment, revenues decreased by $10.8 million, or 14.3%, to $64.7 million from $75.5 million for the years ended December 31, 2011 and 2010, respectively. The Pinnacle acquisition contributed $21.4 million for the year ended December 31, 2011. This increase in revenue was more than offset by $32.2 million of lower revenues in our legacy wireless business, which had an extensive geographic footprint that we restructured in order to exit less profitable geographic markets.
Gross Profit
The following table presents gross profit information by segment:
|
| Year Ended December 31, |
|
|
|
|
| |||||||||
|
| 2011 (Restated) |
| 2010 |
|
|
|
|
| |||||||
(Amounts in thousands) |
| Amount |
| % of |
| Amount |
| % of |
| Increase (Decrease) |
| |||||
Fulfillment |
| $ | 66,985 |
| 23.4 | % | $ | 52,070 |
| 19.3 | % | $ | 14,915 |
| 28.6 | % |
Engineering and Construction |
| 4,493 |
| 6.9 | % | 9,208 |
| 12.2 | % | (4,715 | ) | (51.2 | )% | |||
Total |
| $ | 71,478 |
| 20.3 | % | $ | 61,278 |
| 17.7 | % | $ | 10,200 |
| 16.6 | % |
Gross profit increased $10.2 million, or 16.6%, to $71.5 million from $61.3 million for the years ended December 31, 2011 and 2010, respectively.
Gross profit as a percentage of revenues was 20.3% for the year ended December 31, 2011, compared to 17.7% for the year ended December 31, 2010.
For the Fulfillment segment, gross profit increased to 23.4% for the year ended December 31, 2011, compared to 19.3% for the year ended December 31, 2010. This increase is primarily related to the operational improvements in various fulfillment markets and profitability improvements from the use of technology in the field, dispatch cost reduction programs and other cost savings initiatives.
For the Engineering and Construction segment, gross profit decreased to 6.9% for the year ended December 31, 2011, compared to 12.2% for the year ended December 31, 2010. The change was primarily the result of lower margins in our legacy wireless business, which was incurring costs to support a national geographic presence while projects were winding down in certain markets, causing them to lose profitability. We restructured the legacy wireless business in order to exit less profitable geographic markets. These changes were partially offset by improvement in mix of work from the Pinnacle acquisition, which was completed in April 2011 and had an accretive effect on gross margin.
Selling, General and Administrative Expenses
Selling, general and administrative expenses increased $8.4 million, or 22.7%, to $45.2 million from $36.8 million for the years ended December 31, 2011 and 2010, respectively. Our stock compensation expense for the year ended December 31, 2011 increased by approximately $3.1 million as compared to the prior year due primarily to the RSUs granted on January 10, 2011 as a result of our tender offer to exchange certain eligible options to purchase shares of common stock. See Note 16 of “Item 8. Financial Statements and Supplementary Data” for additional details. During the year ended December 31, 2011, the Pinnacle acquisition added $2.4 million to selling, general and administrative expenses. Additionally, we incurred increased personnel costs and audit, legal and professional fees as well as other related costs associated with our infrastructure growth. These increases were partially offset by lower transaction costs for business acquisitions for the year ended December 31, 2011 of approximately $0.9 million.
Income or Expense related to Contingent Consideration
Income related to contingent consideration was $8.5 million for the year ended December 31, 2011 with no such change in fair value for the year ended December 31, 2010. The income was related to the remeasurements of contingent consideration to fair value during 2011, the majority of which was related to the acquisition of Pinnacle. During the second half of 2011, the estimated fair value of the Pinnacle earn-out declined based on (i) actual 2011 EBITDA and (ii) revised EBITDA forecasts for the twelve month periods ending March 31, 2012 and 2013, resulting in the recognition of income.
Restructuring Charges
Restructuring charges were $1.0 million for the year ended December 31, 2010. The restructuring charges for 2010 were related to our restructuring of the Berliner wireless business acquired in 2010 and related termination and severance costs of management, and all amounts have been paid. We recognized no restructuring charges during the year ended December 31, 2011.
Depreciation and Amortization
Depreciation and amortization decreased $0.9 million, or 3.6%, to $24.3 million from $25.2 million for the years ended December 31, 2011 and 2010, respectively. The decrease was caused by increased depreciation of $3.2 million and decreased amortization of $4.1 million. Approximately $0.6 million of the increase in depreciation is attributable to the Pinnacle acquisition in April 2011, with the remaining increase due to the addition of capital expenditure spending, as well as conversion of a portion of our vehicle fleet from operating leases to capital leases in 2010.
Amortization of intangible assets acquired was impacted by the Pinnacle acquisition in April 2011, which resulted in $3.0 million of additional amortization expense for the year ended December 31, 2011. This increase was more than offset by a portion of our customer related intangible assets arising from satellite and broadband cable acquisitions completed in prior years reaching the end of their estimated useful lives.
Interest Expense
Interest expense decreased $10.1 million, or 42.2%, to $13.9 million from $24.0 million for the years ended December 31, 2011 and 2010, respectively. The decrease was attributable to a $7.7 million decrease resulting from lower interest rates as a result of our new loan agreements in April 2011 and the repayment of the previous long-term debt, lower deferred financing fee amortization of $2.2 million and lower interest relating to letters of credit of $0.2 million.
Loss on Extinguishment of Debt
During the year ended December 31, 2011, we incurred a $3.5 million loss on the extinguishment of debt in conjunction with the refinancing of our debt on April 15, 2011. This includes the write-off of unamortized deferred financing fees of $3.6 million, offset by a $0.1 million gain from the settlement of the deferred fee payable. During the year ended December 31, 2010, we incurred a $1.7 million write-off of deferred financing fees related to the repayment of debt resulting from the issuance of 9.7 million shares of common stock in an underwritten public offering in 2010 resulting in net proceeds of $84.4 million.
Income Tax Expense or Benefit
Income tax expense was $1.1 million for the year ended December 31, 2011 compared to $0.5 million for the year ended December 31, 2010. Our effective tax rate differs from the Federal statutory tax rate of 35% primarily because of higher state income taxes in 2011 as well as Canadian taxes and the impact of our valuation allowance. Our non-Canadian deferred tax assets do not satisfy the criteria for realizability, and we have established a full valuation allowance for such assets. In addition, the valuation of our stock-based compensation differs for book and tax purposes, and we are required to pay incomes taxes in certain states and localities in which we do business.
Income or Loss from Discontinued Operations
Loss from discontinued operations decreased $0.8 million to $1.8 million from $2.7 million for the years ended December 31, 2011 and 2010, respectively. The loss from discontinued operations is the result of the sale of the Wireline Group and the closure of certain wireless and cable installation locations. The improvement in the loss related primarily to the Wireline Group, which had more construction revenues and better profitability in 2011 compared to 2010.
Adjusted EBITDA and Net Income or Loss after Certain Non-cash Adjustments
The following table presents the reconciliation of net income or loss to net income or loss after certain non-cash adjustments and Adjusted EBITDA:
|
| Year Ended December 31, |
| ||||
(in thousands) |
| 2011 |
| 2010 |
| ||
|
| (Restated) |
|
|
| ||
|
|
|
|
|
| ||
Net loss |
| $ | (9,135 | ) | $ | (30,581 | ) |
Stock based compensation |
| 5,107 |
| 2,025 |
| ||
Loss on extinguishment of debt |
| 3,466 |
| 1,677 |
| ||
Non-cash interest expense |
| 1,945 |
| 9,749 |
| ||
Non-cash amortization |
| 10,936 |
| 15,044 |
| ||
Net income (loss) after certain non-cash adjustments |
| $ | 12,319 |
| $ | (2,086 | ) |
|
|
|
|
|
| ||
Discontinued operations |
| 1,826 |
| 2,653 |
| ||
Income tax expense |
| 1,052 |
| 528 |
| ||
Restructuring charges |
| — |
| 991 |
| ||
Income related to contingent consideration |
| (8,506 | ) | — |
| ||
Cash interest expense |
| 11,918 |
| 14,218 |
| ||
Other income, net |
| (608 | ) | — |
| ||
Depreciation |
| 13,355 |
| 10,149 |
| ||
Transaction costs |
| 987 |
| 1,879 |
| ||
Adjusted EBITDA |
| $ | 32,343 |
| $ | 28,332 |
|
Adjusted EBITDA increased $4.0 million, or 14.2%, to $32.3 million from $28.3 for the years ended December 31, 2011 and December 31, 2010, respectively. The increase was the result of an increase of $10.2 million in gross profit, partially offset by an increase of $6.2 million in selling, general and administrative expenses excluding stock-based compensation expense and transaction costs.
Results of Operations — Comparison of Three and Nine Months Ended September 29, 2012 and October 1, 2011
The following table summarizes our results of operations.
|
| Three Months Ended |
| Nine Months Ended |
| ||||||||
(in thousands) |
| September 29, |
| October 1, |
| September 29, |
| October 1, |
| ||||
|
| (Restated) |
| (Restated) |
| (Restated) |
| (Restated) |
| ||||
|
|
|
|
|
|
|
|
|
| ||||
Revenues |
| $ | 130,482 |
| $ | 99,359 |
| $ | 316,667 |
| $ | 258,494 |
|
Cost of revenues |
| 102,824 |
| 78,076 |
| 257,657 |
| 205,599 |
| ||||
Gross profit |
| 27,658 |
| 21,283 |
| 59,010 |
| 52,895 |
| ||||
Selling, general and administrative expenses |
| 11,099 |
| 11,239 |
| 33,490 |
| 33,793 |
| ||||
(Income) expense related to contingent consideration |
| — |
| (13,095 | ) | 10,077 |
| (13,095 | ) | ||||
Restructuring charges |
| 1,594 |
| — |
| 6,400 |
| — |
| ||||
Depreciation and amortization |
| 6,701 |
| 5,624 |
| 19,790 |
| 18,114 |
| ||||
Operating income (loss) |
| 8,264 |
| 17,515 |
| (10,747 | ) | 14,083 |
| ||||
Interest expense |
| 3,883 |
| 3,313 |
| 10,496 |
| 11,258 |
| ||||
Loss on extinguishment of debt |
| — |
| — |
| — |
| 3,466 |
| ||||
Other income, net |
| (76 | ) | (52 | ) | (1,146 | ) | (160 | ) | ||||
Income (loss) from continuing operations before income taxes |
| 4,457 |
| 14,254 |
| (20,097 | ) | (481 | ) | ||||
Income tax expense |
| 293 |
| 354 |
| 315 |
| 153 |
| ||||
Income (loss) from continuing operations |
| 4,164 |
| 13,900 |
| (20,412 | ) | (634 | ) | ||||
Loss from discontinued operations |
| (30,773 | ) | (228 | ) | (34,672 | ) | (1,279 | ) | ||||
Net (loss) income |
| $ | (26,609 | ) | $ | 13,672 |
| $ | (55,084 | ) | $ | (1,913 | ) |
|
|
|
|
|
|
|
|
|
| ||||
Adjusted EBITDA |
| $ | 17,683 |
| $ | 10,985 |
| $ | 29,771 |
| $ | 24,047 |
|
Revenues
Revenues increased $31.1 million, or 31.3%, to $130.5 million from $99.4 million for the three months ended September 29, 2012 and October 1, 2011, respectively. For the Fulfillment segment, revenues increased $2.8 million, or 3.4%, to $84.6 million from $81.8 million for the three months ended September 29, 2012 and October 1, 2011, respectively. The increase in revenues was primarily attributable to (i) growth from our broadband cable customers ($6.5 million) from new markets awarded to us and the impact of the Cable Acquisitions, as well as modest growth in satellite internet installations and the acquisition of Skylink, partially offset by (ii) lower volumes in our legacy satellite installation markets ($3.7 million). For the Engineering and Construction segment, revenues increased $28.3 million, or 161.3%, to $45.9 million from $17.5 million for the three months ended September 29, 2012 and October 1, 2011, respectively. The increase in revenue was primarily the result of a significant wireless project for AT&T in the northeastern region of the United States.
Revenues increased $58.2 million, or 22.5%, to $316.7 million from $258.5 million for the nine months ended September 29, 2012 and October 1, 2011, respectively. For the Fulfillment segment, revenues increased $10.6 million, or 4.9%, to $224.6 million from $214.0 million for the nine months ended September 29, 2012 and October 1, 2011, respectively. The increase in revenues was primarily attributable to growth in our cable operations and satellite internet installations ($17.7 million), partially offset by lower volumes in our legacy satellite installation markets ($7.1 million). For the Engineering and Construction segment, revenues increased $47.6 million, or 107.1%, to $92.1 million from $44.5 million for the nine months ended September 29, 2012 and October 1, 2011, respectively. The increase in revenue was primarily attributable to revenue growth from the AT&T wireless project in the northeastern region of the United States ($42.2 million) and the impact of new public safety network construction projects ($13.1 million), partially offset by completed wireless projects ($8.0 million).
Gross Profit
Gross profit increased $6.4 million, or 30.0%, to $27.7 million from $21.3 million for the three months ended September 29, 2012 and October 1, 2011, respectively. Gross profit as a percentage of revenues was 21.2% for the three months ended September 29, 2012, compared to 21.4% for the three months ended October 1, 2011. For the Fulfillment segment, gross margin decreased to 22.7% for the three months ended September 29, 2012, compared to 25.0% for the three months ended October 1, 2011. This decrease is primarily related to (i) higher mix of revenues from customers with lower margins or in markets with lower population density, and (ii) the mix impact among our broadband cable customers from lower construction volume in 2012, which carries a higher margin compared to standard broadband cable installation services. For the Engineering and Construction segment, gross margin increased to 18.4% for the three months ended September 29, 2012, compared to 4.6% for the three months ended October 1, 2011. The increase in gross margin was attributable to revenue growth from a particular customer (AT&T) that carried a higher margin compared to our base wireless business.
Gross profit increased $6.1 million, or 11.6%, to $59.0 million from $52.9 million for the nine months ended September 29, 2012 and October 1, 2011, respectively. Gross profit as a percentage of revenues was 18.6% for the nine months ended September 29, 2012, compared to 20.5% for the nine months ended October 1, 2011. For the Fulfillment segment, gross margin decreased to 20.6% for the nine months ended September 29, 2012, compared to 23.1% for the nine months October 1, 2011. This decrease is primarily related to (i) higher mix of revenues from customers with lower margins or in markets with lower population density, and (ii) the mix impact from our broadband cable customers from lower construction volume in 2012, which carries a higher margin compared to standard broadband cable installation services. For the Engineering and Construction segment, gross margin increased to 13.8% for the nine months ended September 29, 2012, compared to 7.9% for the nine months ended October 1, 2011. The increase in gross margin was attributable to revenue growth from a particular customer (AT&T) that carried a higher margin compared to our base wireless business.
Selling, General and Administrative Expenses
Selling, general and administrative expenses decreased $0.1 million, or 1.2%, to $11.1 million from $11.2 million for the three months ended September 29, 2012 and October 1, 2011, respectively. The primary drivers of the decrease were salary and personnel costs, as well as lower legal and professional costs.
Selling, general and administrative expenses decreased $0.3 million, or 0.9%, to $33.5 million from $33.8 million for the nine months ended September 29, 2012 and October 1, 2011, respectively. Salary and personnel costs decreased approximately $1.0 million driven by lower corporate personnel cost, including the vacancy of our Chief Executive Officer position which was filled in July 2012. Stock-based compensation expense decreased $0.3 million due to the impact of the tender offer in January 2011, partially offset by the accelerated vesting of RSUs in 2012.
Income or Expense related to Contingent Consideration
Expense related to contingent consideration was $10.1 million for the nine months ended September 29, 2012, and income related to contingent consideration was $13.1 million for the three and nine months ended October 1, 2011. The income and expense was related to the remeasurement of contingent consideration to fair value during the respective periods, the majority of which was related to the acquisition of Pinnacle, but also includes expense related to the Cable Acquisitions.
During the second half of 2011, the estimated fair value of the Pinnacle earn-out declined based on (i) actual 2011 EBITDA and (ii) revised EBITDA forecasts for the twelve month periods ending March 31, 2012 and 2013, resulting in the recognition of income. During the first half of 2012, using information then available, the estimated fair value of Pinnacle earn-out increased based on (i) the revised EBITDA forecast for the twelve months ending March 31, 2013 and (ii) the provisions of the Asset Purchase Agreement regarding the calculation of the earn-out for that period, resulting in the recognition of expense.
We recognized no income or expense related to contingent consideration during the three months ended September 29, 2012.
Restructuring Charges
Restructuring charges were $1.6 million and $6.4 million for the three and nine months ended September 29, 2012, respectively, and were related to the change in our management structure. The charges for the three months ended September 29, 2012 were related to the separation of our Chief Administrative Officer and retention of senior management during the search for our new Chief Executive Officer. The charges for the nine months ended September 29, 2012 additionally included the separation of our former Chief Executive Officer and the elimination of certain management positions including the Executive Chairman. We recognized no restructuring charges during the three and nine months ended October 1, 2011.
Depreciation and Amortization
Depreciation and amortization increased $1.1 million, or 19.2%, to $6.7 million from $5.6 million for the three months ended September 29, 2012 and October 1, 2011, respectively. The increase in depreciation and amortization was caused by increased depreciation of $0.7 million and increased amortization of $0.4 million. The increase in depreciation was primarily due to the addition of vehicles in the fourth quarter of 2011 related to growth in our cable business. The increase in amortization was due to an increase in our intangible asset base in 2012 as a result of new acquisitions.
Depreciation and amortization increased $1.7 million, or 9.3%, to $19.8 million from $18.1 million for the nine months ended September 29, 2012 and October 1, 2011, respectively. The increase in depreciation and amortization was caused by increased depreciation of $2.2 million and decreased amortization of $0.5 million. The increase in depreciation was primarily due to the addition of vehicles in the fourth quarter of 2011 related to growth in our cable business. The decrease in amortization was primarily due to a portion of our customer relationship assets reaching the end of their amortizable lives during 2011, partially offset by an increase in our intangible asset base in 2012 as a result of new acquisitions.
Interest Expense
Interest expense increased $0.6 million, or 17.2%, to $3.9 million from $3.3 million for the three months ended September 29, 2012 and October 1, 2011, respectively. The increase was caused by higher principal balances from the incremental draws on our Term Loan in May and September 2012 and additional borrowings on our Revolving Loan to support higher working capital needs from revenue growth.
Interest expense decreased $0.8 million, or 6.8%, to $10.5 million from $11.3 million for the nine months ended September 29, 2012 and October 1, 2011, respectively. The decrease was caused by a lower overall effective interest rate due to the debt refinancing on April 15, 2011.
Loss on Extinguishment of Debt
During the nine months ended October 1, 2011, we incurred a $3.5 million loss on the extinguishment of debt in conjunction with the refinancing of our debt on April 15, 2011, the substantial majority of which related to the write-off of unamortized deferred financing fees. No such losses were incurred during the three and nine months ended September 29, 2012 or during the three months ended October 1, 2011.
Income Tax Expense or Benefit
Income tax expense was $0.3 million for the three months ended September 29, 2012, compared to $0.4 million for the three months ended October 1, 2011. Income tax expense was $0.3 million for the nine months ended September 29, 2012, compared to $0.2 million for the nine months ended October 1, 2011.
Our effective tax rate differs from the Federal statutory tax rate of 35% primarily because we have not yet achieved profitable operations outside of Canada. As a result, our non-Canadian deferred tax assets do not satisfy the criteria for realizability, and we have established a full valuation allowance for such assets. In addition, the valuation of our stock-based compensation differs for book and tax purposes, and we are required to pay incomes taxes in certain states and localities in which we do business.
Income or Loss from Discontinued Operations
Loss from discontinued operations increased $30.6 million to $30.8 million from $0.2 million for the three months ended Septemebr 29, 2012 and October 1, 2011, respectively. Loss from discontinued operations increased $33.4 million to $34.7 million from $1.3 million for the nine months ended September 29, 2012 and October 1, 2011, respectively. Discontinued operations for the three and nine months ended September 29, 2012 include pre-tax impairment charges of $35.2 million related to the impairments of property and equipment and goodwill in the wireline reporting unit. This was partially offset by an income tax benefit of $7.1 million and $5.5 million for the three and nine months ended September 29, 2012, respectively, representing the difference between the Company’s total income tax expense originally computed and the amount attributable to continuing operations, and also reflects changes in deferred tax assets and liabilities that were triggered by the impairment charges.
Adjusted EBITDA and Net Income or Loss after Certain Non-cash Adjustments
The following table presents the reconciliation of net income or loss to net income or loss after certain non-cash adjustments and Adjusted EBITDA:
|
| Three Months Ended |
| Nine Months Ended |
| ||||||||
(in thousands) |
| September 29, |
| October 1, |
| September 29, |
| October 1, |
| ||||
|
| (Restated) |
| (Restated) |
| (Restated) |
| (Restated) |
| ||||
|
|
|
|
|
|
|
|
|
| ||||
Net (loss) income |
| $ | (26,609 | ) | $ | 13,672 |
| $ | (55,084 | ) | $ | (1,913 | ) |
Impairment charges |
| 35,180 |
| — |
| 35,180 |
| — |
| ||||
Stock-based compensation |
| 1,003 |
| 788 |
| 4,050 |
| 4,376 |
| ||||
Loss on extinguishment of debt |
| — |
| — |
| — |
| 3,466 |
| ||||
Non-cash interest expense |
| 473 |
| 454 |
| 1,148 |
| 1,699 |
| ||||
Amortization |
| 2,704 |
| 2,362 |
| 7,820 |
| 8,384 |
| ||||
Net income (loss) after certain non-cash adjustments |
| $ | 12,751 |
| $ | 17,276 |
| $ | (6,886 | ) | $ | 16,012 |
|
|
|
|
|
|
|
|
|
|
| ||||
Discontinued operations, excluding impairment charges |
| (4,407 | ) | 228 |
| (508 | ) | 1,279 |
| ||||
Income tax expense |
| 293 |
| 354 |
| 315 |
| 153 |
| ||||
Restructuring charges |
| 1,594 |
| — |
| 6,400 |
| — |
| ||||
(Income) expense related to contingent consideration |
| — |
| (13,095 | ) | 10,077 |
| (13,095 | ) | ||||
Cash interest expense |
| 3,410 |
| 2,859 |
| 9,348 |
| 9,559 |
| ||||
Other income, net |
| (76 | ) | (52 | ) | (1,146 | ) | (160 | ) | ||||
Depreciation |
| 3,997 |
| 3,262 |
| 11,970 |
| 9,730 |
| ||||
Transaction costs |
| 121 |
| 153 |
| 201 |
| 569 |
| ||||
Adjusted EBITDA |
| $ | 17,683 |
| $ | 10,985 |
| $ | 29,771 |
| $ | 24,047 |
|
Adjusted EBITDA increased $6.7 million, or 61.0%, to $17.7 million from $11.0 million for the three months ended September 29, 2012 and October 1, 2011, respectively. Adjusted EBITDA increased $5.7 million, or 23.8%, to $29.8 million from $24.0 million for the nine months ended September 29, 2012 and October 1, 2011, respectively. These increases were primarily the result of higher gross profit of $6.4 million and $6.1 million for the three and nine months ended September 29, 2012, respectively.
Results of Operations — Comparison of Three and Six Months Ended June 30, 2012 and July 2, 2011
The following table summarizes our results of operations.
|
| Three Months Ended |
| Six Months Ended |
| ||||||||
(in thousands) |
| June 30, 2012 |
| July 2, 2011 |
| June 30, 2012 |
| July 2, 2011 |
| ||||
|
| (Restated) |
| (Restated) |
| (Restated) |
| (Restated) |
| ||||
|
|
|
|
|
|
|
|
|
| ||||
Revenues |
| $ | 100,046 |
| $ | 83,554 |
| $ | 186,185 |
| $ | 159,135 |
|
Cost of revenues |
| 81,417 |
| 65,026 |
| 154,833 |
| 127,523 |
| ||||
Gross profit |
| 18,629 |
| 18,528 |
| 31,352 |
| 31,612 |
| ||||
Selling, general and administrative expenses |
| 10,085 |
| 12,555 |
| 22,391 |
| 22,554 |
| ||||
Expense related to contingent consideration |
| 1,667 |
| — |
| 10,077 |
| — |
| ||||
Restructuring charges |
| 797 |
| — |
| 4,806 |
| — |
| ||||
Depreciation and amortization |
| 6,697 |
| 6,609 |
| 13,089 |
| 12,490 |
| ||||
Operating loss |
| (617 | ) | (636 | ) | (19,011 | ) | (3,432 | ) | ||||
Interest expense |
| 3,613 |
| 3,478 |
| 6,613 |
| 7,945 |
| ||||
Loss on extinguishment of debt |
| — |
| 3,466 |
| — |
| 3,466 |
| ||||
Other income, net |
| (836 | ) | (114 | ) | (1,070 | ) | (108 | ) | ||||
Loss from continuing operations before income taxes |
| (3,394 | ) | (7,466 | ) | (24,554 | ) | (14,735 | ) | ||||
Income tax expense (benefit) |
| 90 |
| 9 |
| 22 |
| (201 | ) | ||||
Loss from continuing operations |
| (3,484 | ) | (7,475 | ) | (24,576 | ) | (14,534 | ) | ||||
Loss from discontinued operations |
| (1,970 | ) | (235 | ) | (3,899 | ) | (1,051 | ) | ||||
Net loss |
| $ | (5,454 | ) | $ | (7,710 | ) | $ | (28,475 | ) | $ | (15,585 | ) |
|
|
|
|
|
|
|
|
|
| ||||
Adjusted EBITDA |
| $ | 9,539 |
| $ | 7,466 |
| $ | 12,088 |
| $ | 13,062 |
|
Revenues
Revenues increased $16.5 million, or 19.7%, to $100.0 million from $83.6 million for the three months ended June 30, 2012 and July 2, 2011, respectively. For the Fulfillment segment, revenues increased $2.5 million, or 3.6%, to $71.1 million from $68.6 million for the three months ended June 30, 2012 and July 2, 2011, respectively. The increase in revenues was primarily attributable to growth in our cable business from market share gains and the acquisitions completed earlier in 2012 ($4.8 million), partially offset by lower volumes in satellite installation ($2.3 million). For the Engineering and Construction segment, revenues increased $14.0 million, or 93.8%, to $28.9 million from $14.9 million for the three months ended June 30, 2012 and July 2, 2011, respectively. The increase in revenues was primarily attributable to the AT&T wireless project ($8.5 million) as well as growth in other wireless projects ($5.5 million).
Revenues increased $27.1 million, or 17.0%, to $186.2 million from $159.1 million for the six months ended June 30, 2012 and July 2, 2011, respectively. For the Fulfillment segment, revenues increased $7.8 million, or 5.9%, to $140.0 million from $132.2 million for the six months ended June 30, 2012 and July 2, 2011, respectively. The increase in revenues was primarily attributable to growth in our cable business from market share gains and the acquisitions completed earlier in 2012 ($11.4 million) offset by lower volumes in satellite installations ($3.6 million). For the Engineering and Construction segment, revenues increased $19.3 million, or 71.7%, to $46.2 million from $26.9 million for the six months ended June 30, 2012 and July 2, 2011, respectively. The increase in revenues was primarily attributable to the AT&T wireless project ($11.8 million) and growth in other wireless projects ($7.4 million).
Gross Profit
Gross profit increased $0.1 million, or 0.5%, to $18.6 million from $18.5 million for the three months ended June 30, 2012 and July 2, 2011, respectively. Gross profit as a percentage of revenues was 18.6% for the three months ended June 30, 2012, compared to 22.2% for the three months ended July 2, 2011. For the Fulfillment segment, gross margin decreased to 20.3% for the three months ended June 30, 2012, compared to 23.6% for the three months ended July 2, 2011. This decrease is primarily related to (i) higher mix of revenues from customers with lower margins or in markets with lower population density, and (ii) the mix impact among our broadband cable customers from lower construction volume in 2012, which carries a higher margin compared to standard broadband cable installation services. For the Engineering and Construction segment, gross margin decreased to 14.5% for the three months ended June 30, 2012, compared to 15.5% for the three months ended July 2, 2011. The slight decrease in gross margin was attributable to higher cost estimates associated with a large contract.
Gross profit decreased $0.3 million, or 0.8%, to $31.4 million from $31.6 million for the six months ended June 30, 2012 and July 2, 2011, respectively. Gross profit as a percentage of revenues was 16.8% for the six months ended June 30, 2012, compared to 19.9% for the six months ended July 2, 2011. For the Fulfillment segment, gross margin decreased to 19.3% for the six months ended June 30, 2012, compared to 21.9% for the six months July 2, 2011. The decrease in gross margin was attributable to higher mix of revenues from customers with lower margins or in markets with lower population density. For the Engineering and Construction segment, gross margin decreased to 9.3% for the six months ended June 30, 2012, compared to 10.0% for the six months ended July 2, 2011. The slight decrease in gross margin was attributable to higher cost estimates associated with a large contract.
Selling, General and Administrative Expenses
Selling, general and administrative expenses decreased $2.5 million, or 19.7%, to $10.1 million from $12.6 million for the three months ended June 30, 2012 and July 2, 2011, respectively. The primary drivers of the decrease were lower salary and personnel costs of $1.7 million, including the vacancy of our Chief Executive Officer position which was filled in July 2012.
Selling, general and administrative expenses decreased $0.2 million, or 0.7%, to $22.4 million from $22.6 million for the six months ended June 30, 2012 and July 2, 2011, respectively. Excluding the $1.2 million impact of the Pinnacle acquisition, selling, general and administrative expenses decreased by $1.4 million. Salary and personnel costs decreased $1.1 million driven by lower corporate personnel cost, including the vacancy of our Chief Executive Officer position which was filled in July 2012. Stock-based compensation expense decreased $0.5 million due to the impact of the tender offer in January 2011, partially offset by the accelerated vesting of RSUs in 2012.
Income or Expense related to Contingent Consideration
Expense related to contingent consideration was $1.7 million and $10.1 million for the three and six months ended June 30, 2012, respectively. The expense was related to the remeasurement of contingent consideration to fair value at each period end, the majority of which was related to the acquisition of Pinnacle.
During the first half of 2012, using information then available, the estimated fair value of Pinnacle earn-out increased based on (i) the revised EBITDA forecast for the twelve months ending March 31, 2013 and (ii) the provisions of the Asset Purchase Agreement regarding the calculation of the earn-out for that period, resulting in the recognition of expense.
We recognized no income or expense related to contingent consideration during the three and six months ended July 2, 2011.
Restructuring Charges
Restructuring charges were $0.8 million and $4.8 million for the three and six months ended June 30, 2012, respectively, and were related to the change in our management structure. The charges for the three months ended June 30, 2012 were related to the elimination of certain management positions and the retention of senior management during the search for our new Chief Executive Officer. The charges for the six months ended June 30, 2012 additionally included the separation of our former Chief Executive Officer and the elimination of certain management positions including the Executive Chairman. We recognized no restructuring charges during the three and six months ended July 2, 2011.
Depreciation and Amortization
Depreciation and amortization increased $0.1 million, or 1.3%, to $6.7 million from $6.6 million for the three months ended June 30, 2012 and July 2, 2011, respectively. The increase in depreciation and amortization was caused by increased depreciation of $0.7 million and decreased amortization of $0.6 million. The increase in depreciation was primarily due to the addition of vehicles in the fourth quarter of 2011 related to growth in our cable business. The decrease in amortization was primarily due to a portion of our customer relationship assets reaching the end of their amortizable lives during 2011.
Depreciation and amortization increased $0.6 million, or 4.8%, to $13.1 million from $12.5 million for the six months ended June 30, 2012 and July 2, 2011, respectively. The increase in depreciation and amortization was caused by increased depreciation of $1.5 million and decreased amortization of $0.9 million. The increase in depreciation was primarily due to the addition of vehicles in the fourth quarter of 2011 related to growth in our cable business. The decrease in amortization was primarily due to a portion of our customer relationship assets reaching the end of their amortizable lives during 2011, partially offset by an increase in our intangible asset base in 2012 as a result of new acquisitions.
Interest Expense
Interest expense increased $0.1 million, or 3.9%, to $3.6 million from $3.5 million for the three months ended June 30, 2012 and July 2, 2011, respectively. The increase was caused by higher principal balances from the incremental draws on our Term Loan in May 2012 and additional borrowings on our Revolving Loan to support higher working capital needs from revenue growth, partially offset by favorable variable interest rates on our debt.
Interest expense decreased $1.3 million, or 16.8%, to $6.6 million from $7.9 million for the six months ended June 30, 2012 and July 2, 2011, respectively. The decrease was caused by a lower overall effective interest rate due to the debt refinancing on April 15, 2011.
Loss on Extinguishment of Debt
During the three and six months ended July 2, 2011, we incurred a $3.5 million loss on the extinguishment of debt in conjunction with the refinancing of our debt on April 15, 2011, the substantial majority of which related to the write-off of unamortized deferred financing fees. No such losses were incurred during the three and six months ended Jun 30, 2012.
Income Tax Expense or Benefit
Income tax expense was $0.1 million for the three months ended June 30, 2012, compared to $0.0 million for the three months ended July 2, 2011. Income tax expense was $0.0 million for the six months ended June 30, 2012, compared to $0.2 million for the six months ended July 2, 2011.
Our effective tax rate differs from the Federal statutory tax rate of 35% primarily because we have not yet achieved profitable operations outside of Canada. As a result, our non-Canadian deferred tax assets do not satisfy the criteria for realizability, and we have established a full valuation allowance for such assets. In addition, the valuation of our stock-based compensation differs for book and tax purposes, and we are required to pay incomes taxes in certain states and localities in which we do business.
Income or Loss from Discontinued Operations
Loss from discontinued operations increased $1.7 million to $2.0 million from $0.2 million for the three months ended June 30, 2012 and July 2, 2011, respectively. Loss from discontinued operations increased $2.8 million to $3.9 million from $1.1 million for the six months ended June 30, 2012 and July 2, 2011, respectively. The decrease in volume and related revenues as compared to the prior year was related to a large customer project completed in 2011, and was the primary driver of the higher loss in 2012.
Adjusted EBITDA and Net Income or Loss after Certain Non-cash Adjustments
The following table presents the reconciliation of net income or loss to net income or loss after certain non-cash adjustments and Adjusted EBITDA:
|
| Three Months Ended |
| Six Months Ended |
| ||||||||
(in thousands) |
| June 30, 2012 |
| July 2, 2011 |
| June 30, 2012 |
| July 2, 2011 |
| ||||
|
| (Restated) |
| (Restated) |
| (Restated) |
| (Restated) |
| ||||
|
|
|
|
|
|
|
|
|
| ||||
Net loss |
| $ | (5,454 | ) | $ | (7,710 | ) | $ | (28,475 | ) | $ | (15,585 | ) |
Stock-based compensation |
| 982 |
| 1,078 |
| 3,047 |
| 3,588 |
| ||||
Loss on extinguishment of debt |
| — |
| 3,466 |
| — |
| 3,466 |
| ||||
Non-cash interest expense |
| 349 |
| 252 |
| 675 |
| 1,245 |
| ||||
Amortization |
| 2,607 |
| 3,268 |
| 5,116 |
| 6,022 |
| ||||
Net (loss) income after certain non-cash adjustments |
| $ | (1,516 | ) | $ | 354 |
| $ | (19,637 | ) | $ | (1,264 | ) |
|
|
|
|
|
|
|
|
|
| ||||
Discontinued operations |
| 1,970 |
| 235 |
| 3,899 |
| 1,051 |
| ||||
Income tax expense (benefit) |
| 90 |
| 9 |
| 22 |
| (201 | ) | ||||
Restructuring charges |
| 797 |
| — |
| 4,806 |
| — |
| ||||
Expense related to contingent consideration |
| 1,667 |
| — |
| 10,077 |
| — |
| ||||
Cash interest expense |
| 3,264 |
| 3,226 |
| 5,938 |
| 6,700 |
| ||||
Other income, net |
| (836 | ) | (114 | ) | (1,070 | ) | (108 | ) | ||||
Depreciation |
| 4,090 |
| 3,341 |
| 7,973 |
| 6,468 |
| ||||
Transaction costs |
| 13 |
| 415 |
| 80 |
| 416 |
| ||||
Adjusted EBITDA |
| $ | 9,539 |
| $ | 7,466 |
| $ | 12,088 |
| $ | 13,062 |
|
Adjusted EBITDA increased $2.1 million, or 27.8%, to $9.5 million from $7.5 million for the three months ended June 30, 2012 and July 2, 2011, respectively. The increase was primarily the result of a decrease of $2.0 million in selling, general and administrative expenses excluding the effect of stock-based compensation and transaction costs.
Adjusted EBITDA decreased $1.0 million, or 7.5%, to $12.1 million from $13.1 million for the six months ended June 30, 2012 and July 2, 2011, respectively. The decrease was the result of an increase of $0.7 million in selling, general and administrative expenses, excluding the effect of stock-based compensation and transaction costs and a decrease of $0.3 million in gross profit.
Results of Operations — Comparison of Three Months Ended March 31, 2012 and April 2, 2011
The following table summarizes our results of operations.
|
| Three Months Ended |
| ||||
(in thousands) |
| March 31, |
| April 2, |
| ||
|
| (Restated) |
|
|
| ||
|
|
|
|
|
| ||
Revenues |
| $ | 86,139 |
| $ | 75,581 |
|
Cost of revenues |
| 73,416 |
| 62,497 |
| ||
Gross profit |
| 12,723 |
| 13,084 |
| ||
Selling, general and administrative expenses |
| 12,306 |
| 9,999 |
| ||
Change in fair value of contingent consideration |
| 8,410 |
| — |
| ||
Restructuring charges |
| 4,009 |
| — |
| ||
Depreciation and amortization |
| 6,392 |
| 5,881 |
| ||
Operating loss |
| (18,394 | ) | (2,796 | ) | ||
Interest expense |
| 3,000 |
| 4,467 |
| ||
Other (income) expense, net |
| (234 | ) | 6 |
| ||
Loss from continuing operations before income taxes |
| (21,160 | ) | (7,269 | ) | ||
Income tax benefit |
| (68 | ) | (210 | ) | ||
Loss from continuing operations |
| (21,092 | ) | (7,059 | ) | ||
Loss from discontinued operations |
| (1,929 | ) | (816 | ) | ||
Net loss |
| $ | (23,021 | ) | (7,875 | ) | |
|
|
|
|
|
| ||
Adjusted EBITDA |
| $ | 2,549 |
| $ | 5,596 |
|
Revenues
Revenues increased $10.6 million, or 14.0%, to $86.1 million from $75.6 million for the three months ended March 31, 2012 and April 2, 2011, respectively. For the Fulfillment segment, revenues increased $5.3 million, or 8.3%, to $68.9 million from $63.6 million for the three months ended March 31, 2012 and April 2, 2011, respectively. The increase in revenues was primarily attributable to the Cable Acquisitions as well as market share growth; partially offset by decreases due to the mild weather resulting in fewer service calls. For the Engineering and Construction segment, revenues increased $5.3 million, or 44.1%, to $17.3 million from $12.0 million for the three months ended March 31, 2012 and April 2, 2011, respectively. The Pinnacle acquisition contributed approximately $6.4 million in the quarter ended March 31, 2012 slightly offset by lower revenue in the legacy wireless group as new projects ramped up.
Gross Profit
Gross profit decreased $0.4 million, or 2.8%, to $12.7 million from $13.1 million for the three months ended March 31, 2012 and April 2, 2011, respectively. Gross profit as a percentage of revenues was 14.8% for the three months ended March 31, 2012, compared to 17.3% for the three months ended April 2, 2011. For the Fulfillment segment, gross margin decreased to 18.3% for the three months ended March 31, 2012, compared to 20.0% for the three months ended April 2, 2011. This decrease is primarily related (i) higher mix of revenues from customers with lower margins or in markets with lower population density, and (ii) the mix impact among our broadband cable customers from lower construction volume in 2012, which carries a higher margin compared to standard broadband cable installation services. For the Engineering and Construction segment, gross margin decreased to 0.6% for the three months ended March 31, 2012, compared to 3.2% for the three months ended April 2, 2011. The decrease is primarily the result of new project ramp-up costs within the legacy wireless group.
Selling, General and Administrative Expenses
Selling, general and administrative expenses increased $2.3 million, or 23.1%, to $12.3 million from $10.0 million for the three months ended March 31, 2012 and April 2, 2011, respectively. During the three months ended March 31, 2012, the Pinnacle acquisition (completed April 3, 2011) added $1.2 million to selling, general and administrative expenses. In addition, we incurred an additional $0.7 million in salary and personnel costs. These increases were offset by a decrease in stock-based compensation for the three months ended March 31, 2012 of approximately $0.4 million as compared to the prior year first quarter. Our stock compensation expense for the three months ended March 31, 2012 included an additional $1.4 million related to the accelerated vesting of RSUs and stock options held by our former Chief Executive Officer and former Executive Chairman of the Board in accordance with the terms of their employment agreements.
Income or Expense related to Contingent Consideration
Expense related to contingent consideration was $8.4 million for the three months ended March 31, 2012. The expense was related to the remeasurement of contingent consideration to fair value at each period end, which was related to the acquisition of Pinnacle.
During 2012, using information then available, the estimated fair value of Pinnacle earn-out increased based on (i) the revised EBITDA forecast for the twelve months ending March 31, 2013 and (ii) the provisions of the Asset Purchase Agreement regarding the calculation of the earn-out for that period, resulting in the recognition of expense.
We recognized no income or expense related to contingent consideration during the three months ended April 2, 2011.
Restructuring Charges
Restructuring charges were $4.0 million for the three months ended March 31, 2012, and were related to the change in our management structure. The charges for the three months ended March 31, 2012 were related to the separation of our former Chief Executive Officer and the elimination of certain management positions including the Executive Chairman. We recognized no restructuring charges during the three months ended April 2, 2011.
Depreciation and Amortization
Depreciation and amortization increased $0.5 million, or 8.7%, to $6.4 million from $5.9 million for the three months ended March 31, 2012 and April 2, 2011, respectively. The increase in depreciation and amortization was caused by increased depreciation of $0.8 million and decreased amortization of $0.2 million. The increase in depreciation was primarily due to the addition of vehicles in the fourth quarter of 2011 related to growth in our cable business. The decrease in amortization was primarily due to a portion of our customer relationship assets reaching the end of their amortizable lives during 2011, partially offset by an increase in our intangible asset base in 2012 as a result of new acquisitions.
Interest Expense
Interest expense decreased $1.5 million, or 32.8%, to $3.0 million from $4.5 million for the three months ended March 31, 2012 and April 2, 2011, respectively. The decrease was caused by a lower overall effective interest rate due to the debt refinancing on April 15, 2011.
Income Tax Expense or Benefit
Income tax benefit was $0.1 million for the three months ended March 31, 2012, compared to an income tax benefit was $0.2 million for the three months ended April 2, 2011.
Our effective tax rate differs from the Federal statutory tax rate of 35% primarily because we have not yet achieved profitable operations outside of Canada. As a result, our non-Canadian deferred tax assets do not satisfy the criteria for realizability, and we have established a full valuation allowance for such assets. In addition, the valuation of our stock-based compensation differs for book and tax purposes, and we are required to pay incomes taxes in certain states and localities in which we do business.
Income or Loss from Discontinued Operations
Loss from discontinued operations increased $1.1 million to $1.9 million from $0.8 million for the three months ended March 31, 2012 and April 2, 2011, respectively. The decrease in volume and related revenues as compared to the prior year was related to a large customer project completed in 2011, and was the primary driver of the higher loss in 2012.
Adjusted EBITDA and Net Income or Loss after Certain Non-cash Adjustments
The following table presents the reconciliation of net income or loss to net income or loss after certain non-cash adjustments and Adjusted EBITDA:
|
| Three Months Ended |
| ||||
(in thousands) |
| March 31, |
| April 2, |
| ||
|
| (Restated) |
|
|
| ||
|
|
|
|
|
| ||
Net loss |
| $ | (23,021 | ) | $ | (7,875 | ) |
Stock-based compensation |
| 2,065 |
| 2,510 |
| ||
Non-cash interest expense |
| 326 |
| 993 |
| ||
Amortization |
| 2,509 |
| 2,754 |
| ||
Net loss after certain non-cash adjustments |
| $ | (18,121 | ) | $ | (1,618 | ) |
|
|
|
|
|
| ||
Discontinued operations |
| 1,929 |
| 816 |
| ||
Income tax benefit |
| (68 | ) | (210 | ) | ||
Restructuring charges |
| 4,009 |
| — |
| ||
Expense related to contingent consideration |
| 8,410 |
| — |
| ||
Cash interest expense |
| 2,674 |
| 3,474 |
| ||
Other (income) expense, net |
| (234 | ) | 6 |
| ||
Depreciation |
| 3,883 |
| 3,127 |
| ||
Transaction costs |
| 67 |
| 1 |
| ||
Adjusted EBITDA |
| $ | 2,549 |
| $ | 5,596 |
|
Adjusted EBITDA decreased $3.0 million, or 54.4%, to $2.5 million from $5.6 million for the three months ended March 31, 2012 and April 2, 2011, respectively. The decrease was primarily the result of a $2.7 million increase in selling, general and administrative expenses, excluding the effect of stock-based compensation and transaction costs.
Liquidity and Capital Resources
Overview
At December 31, 2012, our liquidity consisted primarily of cash of $3.8 million and availability under our revolving credit facility of $12.9 million.
Our availability under our revolving credit facility was based on a borrowing base of $63.6 million of eligible receivables (as defined in our credit agreements), less outstanding letters of credit issued to third parties of $23.9 million and borrowings of $26.9 million. Additional availability of up to $11.4 million above the December 31, 2012 amount was possible in the future if we were able to increase our borrowing base, which could be achieved by generating additional unbilled revenues or reducing our cycle times to bill and collect receivables, or a combination of both. In addition, prior to the events of default further described below, our long-term debt instruments included accordion features that provided for an additional $40.0 million of borrowings ($25.0 million from our revolving credit facility and $15.0 million from our term loan), subject to the approval of our lenders. Ordinarily, we do not hold significant amounts of cash or cash equivalents because our daily net cash flows are applied directly to the outstanding balance of our revolving credit facility.
Our primary sources of cash are from our operations and from borrowings under loan arrangements. Our primary uses of cash are for (i) contractual obligations to service our debt, make required payments under our vehicle fleet, facility and other leases, and other contractual obligations including required earn-out payments for completed acquisitions; and (ii) other needs for cash that are necessary to run our business, such as investing in working capital to support our business requirements, providing collateral for our insurance policies in the form of letters of credit, and funding capital expenditures. Historically, we have also used cash to acquire businesses.
During the year ended December 31, 2012, the most significant factors impacting our liquidity were as follows:
· Our greatest sources of cash were from our results of operations and borrowings under our debt facilities. Adjusted EBITDA for the year ended December 31, 2012 was $39.6 million, the majority of which contributed to our operating cash flows. We also exercised $35.0 million of the $50.0 million accordion feature under our term loan during the year ended December 31, 2012, and we increased the amount outstanding under our revolving credit facility by $11.2 million. In addition, we received cash of $5.4 million for the sale of our Wireline business in 2012.
· Our greatest uses of cash were to increase working capital and to fund business acquisitions. We increased our working capital levels to support our growth in the wireless construction services business, which we expect to require additional liquidity in 2013. As a result, our working capital increased by $6.9 million during 2012. We also funded the acquisition of Skylink, the Cable Acquisitions and the cash portion of an earn-out payment for the acquisition of Pinnacle. Cash paid for acquisition of businesses and contingent consideration was $39.9 million during 2012.
Trends and Uncertainties
The discussion and analysis of our liquidity and capital resources may not be indicative of future trends as a result of recent trends and uncertainties that have arisen subsequent to December 31, 2012. We believe that these matters could materially impact our liquidity and capital resources in future periods and include:
· The events of default under our debt agreements for periods in 2011 and 2012, which resulted in significant changes to the terms of those agreements in 2013 and will result in a higher financing costs in 2013 and beyond:
· Our revolving credit facility was refinanced in July 2013 at an interest rate that was higher than the prior agreement and required us to pay additional fees and costs. However, this facility also increased our available borrowings by $20 – $30 million during 2013; and
· Our term loan was amended in July 2013, resulting in a waiver of prior defaults for periods in 2011 and 2012 and provided additional cushion for our financial covenants, which we believe will allow us to maintain compliance for the foreseeable future. However, the amendment also resulted in higher interest rates as well as additional fees (some of which are noncash) that will impact our future liquidity.
· The need to improve our management of working capital within our wireless construction business, which if not managed well could require us to borrow additional amounts, which would reduce our profitability, or cause us to become ineligible for new borrowings or default on our debt, or both.
· Our ability to remain listed on a public stock exchange, which allows us to access equity and debt capital on more favorable terms than in private markets.
· Our ability to pay our vendors timely and retain key subcontractors for future work.
· The timing of our payment of the final portion of an earn-out pursuant to the terms of the purchase agreement.
Uses of Cash
Our uses of cash include both contractual obligations and non-contractual needs for cash.
We are required to enter into certain contractual commitments to support our future business operations. These include interest and principal payments on our long-term debt obligations, non-cancelable capital and operating lease arrangements related primarily to our vehicle fleet and facilities, and contingent consideration for completed business acquisitions. The following table presents our contractual obligations and payments due by period as of December 31, 2012:
|
| Payments due by period |
| |||||||||||||
(in thousands) |
| Total |
| Less Than |
| 1-3 |
| 3-5 |
| More Than |
| |||||
|
|
|
|
|
|
|
|
|
|
|
| |||||
Long-term debt obligations:(1) |
|
|
|
|
|
|
|
|
|
|
| |||||
Interest payments |
| $ | 69,118 |
| $ | 13,726 |
| $ | 27,453 |
| $ | 24,448 |
| $ | 3,491 |
|
Principal payments |
| 159,865 |
| 3,450 |
| 2,700 |
| 27,492 |
| 126,223 |
| |||||
Capital lease obligations |
| 16,043 |
| 7,843 |
| 7,636 |
| 564 |
| — |
| |||||
Operating lease obligations |
| 27,744 |
| 9,809 |
| 14,769 |
| 3,166 |
| — |
| |||||
Other contractual obligations: |
|
|
|
|
|
|
|
|
|
|
| |||||
Skylink earn-out |
| 5,935 |
| 5,935 |
| — |
| — |
| — |
| |||||
Total contractual obligations |
| $ | 278,705 |
| $ | 40,763 |
| $ | 52,558 |
| $ | 55,670 |
| $ | 129,714 |
|
(1) Assumes the amortization of our term loan according to principal, interest rate and other terms of the agreement as of December 31, 2012. The calculation assumes that the balance of $26.9 million at December 31, 2012 under our revolving loan is outstanding for all future periods until it is due in 2016, and that there are no changes to the variable rate of interest in future periods.
In addition to our contractual obligations, there are a number of other needs for cash that are necessary to run our business:
· Working capital — We collect cash from our customers and pay cash to employees, subcontractors and vendors over periods that can vary widely among each other, between segments of our business and among different customers within each business segment. Therefore, it is possible that we may not receive payment from customers for work performed prior to paying our employees, subcontractors or vendors, which results in a usage of cash for working capital;
· Insurance policies — The Company maintains high-deductible insurance policies for workers’ compensation, general liability, automobile, medical and dental claims. Because most claims against the Company do not exceed its deductibles, the Company is effectively self-insured for substantially all claims;
· Capital expenditures — Most of our capital expenditures are discretionary and for the purpose of performing our work more efficiently. We also have a base level of maintenance capital expenditures related primarily to safety and protection equipment in both of our business segments.
Long-term Debt Obligations
Historical Debt Obligations
At December 31, 2012, our long-term debt consisted of (i) a Credit Agreement (the “Term Loan Agreement”) by and among us and the several banks and other financial institutions or entities that are parties to the Term Loan Agreement; and (ii) a Revolving Credit and Security Agreement (the “Revolving Loan Agreement”) by and among us and PNC Bank, National Association.
The Term Loan Agreement required quarterly repayments of the Term Loan totaling 1.00% per annum of the Term Loan amount until maturity of the debt in 2018. The Term Loan had interest at one, two, three or six month LIBOR (with a floor of 1.50%) plus a margin of 7.50%. The interest rate on the Term Loan was 9.00% at December 31, 2012. The original amount of the Term Loan and subsequent incremental draws were issued at discounts ranging from three to four percent, which were being charged to interest expense through maturity of the Term Loan.
The Revolving Loan Agreement consisted of a $75.0 million revolving credit facility (“Revolving Loan”) with up to $35.0 million available for issuance of letters of credit. The Revolving Loan was to mature in 2016. The available amount under the Revolving Loan Agreement, which was $12.9 million at December 31, 2012, was determined by the amount and the characteristics of our receivables. We could draw on the Revolving Loan and repay amounts borrowed in unlimited repetition up to the available amount so long as no event of default had occurred and was continuing. The interest rate on the Revolving Loan could be a combination of LIBOR (with no floor) and / or a base rate plus a margin of between 2.25% and 2.75%. The interest rate on the Revolving Loan was 3.37% at December 31, 2012. The Revolving Loan also required payment of a commitment fee of 0.375% based on the unused balance of the facility.
2013 Refinancing and Amendments
Our Revolving Loan Agreement was refinanced in July 2013, at an interest rate of LIBOR plus Applicable Margin (as defined in the agreement), along with additional fees that would result in cash paid for interest and recurring financing fees that would result in an additional $3-$4 million of cash payments per year using the assumptions above as well as an assumed issued letter of credit balance of $24.0 million. However, this facility also increased the overall availability as compared to the prior agreement by $20 – $30 million during 2013. We intend to evaluate alternatives for this Revolving Loan Agreement to reduce the interest rates in future years.
Interest is calculated on the revolving loan based upon the amounts outstanding at LIBOR (with a 1.0% floor) plus an applicable margin that varies depending upon our fixed charge coverage ratio. The applicable margin is also applied to all amounts under issued but undrawn letters of credit, which totaled approximately $23.9 million at December 31, 2012. There is an unused commitment fee, calculated daily, that is applied to the total $75 million commitment less amounts drawn and letters of credit issued under both the revolving loan agreement outstanding as of December 31, 2012 (0.38% per year) as well as the agreement entered into in July 2013 (2.0% per year).
Our term loan agreement was amended in July 2013 that resulted in a waiver of defaults related to prior periods including 2011 and 2012, provided additional cushion for our financial covenants which we believe will allow us to maintain compliance with the financial covenants for the foreseeable future, but resulted in higher cash interest rates as well as additional fees (some of which are noncash) which will impact our future liquidity. The additional cash interest in the next year resulting from these changes is an estimated impact of approximately $3 million.
Capital and Operating Lease Obligations
We rent office space, equipment, trucks and other assets under non-cancelable capital and operating leases, certain of which contain purchase option terms. The total amount of capital lease obligations as of December 31, 2012 and 2011 was $15.7 million and $25.9 million, respectively. Operating lease payments are expensed as incurred. Leases meeting certain criteria are capitalized, with the related asset being recorded in property and equipment and an offsetting amount recorded as a liability. As of December 31, 2012 and 2011 the total cost of assets under capital leases was approximately $33.2 million and $38.8 million, respectively, and the related accumulated depreciation was approximately $18.1 million and $13.7 million, respectively. Operating lease expense was approximately $10.7 million, $6.3 million and $8.5 million for the years ended December 31, 2012, 2011, and 2010, respectively, and is included as a component of cost of revenues or selling, general and administrative expenses depending on the nature of the lease. The increase in 2012 included a full year of lease expense for Pinnacle, as well as the acquisition of Skylink in the third quarter of 2012 and a reduction in new capital lease obligations.
Other Contractual Obligations
We have an obligation to pay contingent consideration related to our acquisition of Skylink in September 2012. The amount of this obligation can vary but has a floor of $4.0 million and is estimated in total (including the floor) at $5.9 million as of December 31, 2012. We are obligated to pay the amount above the floor, subject to certain performance criteria after the date of acquisition. However, our obligation to make this payment requires certain conditions to be met, including conditions related to minimum levels of our liquidity after giving effect to such payments.
Working Capital
Working capital has a significant impact on our liquidity and capital resources because changes in working capital impacts our operating cash flows, and our working capital balance affects the amount available to us under our revolving credit facility. We typically need to invest in additional working capital when we experience growth in our business, particularly in our Engineering and Construction segment, because of the longer collection cycles for accounts receivable and the need to purchase material inventories to support construction projects. We also may need to invest in working capital in response to the needs of our customers whose liquidity may fluctuate based on funding sources, macroeconomic and other factors. Our working capital needs are also subject to seasonal increases from approximately April to November caused by the impact of favorable weather in our Engineering and Construction segment and seasonal customer demand within our Fulfillment segment.
Our billing terms generally range from 21 to 60 days, although collection cycles in our Engineering and Construction segment are lengthened by an additional period of time after work commenced before we are able to bill the customer. In addition, we also maintain inventory to meet the material requirements of certain of our contracts, primarily within the Fulfillment segment. Our vendors typically offer us terms ranging from 30 to 60 days, while our agreements with subcontractors are generally 14 to 21 days, with some terms as long as 35 to 45 days.
We believe the new revolving credit agreement we entered into in July 2013 provides us with sufficient liquidity to manage ordinary variations in working capital, as it provides us with an additional amount we can borrow above the previous revolving loan agreement, of $30 million through October 31, 2013, $25 million through November 30, 2013, and $20 million thereafter, up to a maximum of $75 million including letters of credit.
Insurance Policies
We maintain high-deductible insurance policies for workers’ compensation, general liability, automobile, medical and dental claims. These programs require us to establish letters of credit for the benefit of our high-deductible carriers. Because most claims against us do not exceed our deductibles, we are effectively self-insured for substantially all claims but still are required to issue letters of credit for the benefit of our insurers for claims or potential claims in excess of those deductibles, which are $175 thousand per claim for health insurance, and ranges from $250 thousand to $500 thousand depending on the coverage for remaining insurance. Our loan availability under our credit agreements is reduced by the amount of the letters of credit. We establish insurance reserves for estimates of the loss that we will ultimately incur on reported claims and claims that have been incurred but not yet reported. Our insurance reserves incorporate historical loss experience and judgments about the present and expected levels of cost per claim. Trends in actual experience are a significant factor in the determination of such reserves. We update our estimates and the appropriateness of our reserves quarterly based upon known facts, historical trends and our judgments regarding future claims.
Insurance claims may take several years to completely settle. Consequently, actuarial estimates are required to project the ultimate cost that will be incurred to fully resolve the claims. A number of factors can affect the actual cost of a claim, including the length of time the claim remains open, trends in health care costs and the results of related litigation. Furthermore, claims may emerge in future years for events that occurred in a prior year at a rate that differs from previous actuarial projections. We believe that our estimated reserves for such claims are adequate, but actual experience in claim frequency or severity, or both, could materially differ from our estimates and affect our results of operations and liquidity. As of December 31, 2012 and 2011, our accrued insurance was $16.2 million and $13.7 million, respectively.
Capital Expenditures
The company has discretionary capital expenditures related to vehicles, test equipment, electronic devices, tools, software systems and other items related to performing work more efficiently. We also have a base level of maintenance capital expenditures related primarily to safety and protection equipment in both of our business segments.
Sources of Cash
Our primary sources of cash are from our operations and from borrowings under long-term debt.
Operations
Adjusted EBITDA is our gross profit, less selling, general and administrative expenses, and excludes stock-based compensation and transaction costs. We use Adjusted EBITDA as an approximation of the impact that our business operations have on cash flows prior to the impact of working capital changes. Adjusted EBITDA was $39.6 million, $32.3 million and $28.3 million for the years ended December 31, 2012, 2011 and 2010, respectively.
Additional information about our Adjusted EBITDA and changes thereto can be found in the discussion and analysis of our results of operations.
Borrowings Under Long-Term Debt
Historical Debt Obligations
The following table presents our historical components of long-term debt:
|
| December 31, |
| ||||
|
| 2012 |
| 2011 |
| ||
|
|
|
| (Restated) |
| ||
|
|
|
|
|
| ||
Term Loan, net of debt discounts of $3,401 and $2,696, respectively |
| $ | 129,572 |
| $ | 96,554 |
|
Revolving Loan |
| 26,892 |
| 15,663 |
| ||
Long-term debt |
| 156,464 |
| 112,217 |
| ||
Current portion of long-term debt |
| 3,450 |
| 16,663 |
| ||
Long-term debt, net of current portion |
| $ | 153,014 |
| $ | 95,554 |
|
The Term Loan Agreement consisted of a $135.0 million term loan (the “Term Loan”), and the Revolving Loan Agreement consisted of a $75.0 million revolving credit facility (“Revolving Loan”) with up to $35.0 million available for issuance of letters of credit. The available amount under the Revolving Loan Agreement, which was $12.9 million at December 31, 2012, was determined by the amount and the characteristics of our receivables. We were able to draw on the Revolving Loan and repay amounts borrowed in unlimited repetition up to the available amount so long as no event of default had occurred and was continuing. As of December 31, 2012, we had $23.9 million in letters of credit outstanding.
The following table presents the availability under our revolving credit facility and the overall trends in our liquidity at the end of each quarter in 2012 and 2011 during which the revolving credit facility was outstanding:
(in thousands) |
| Current |
| |
|
|
|
| |
July 2, 2011 |
| $ | 12,853 |
|
October 1, 2011 |
| 13,440 |
| |
December 31, 2011 |
| 19,095 |
| |
March 31, 2012 |
| 2,988 |
| |
June 30, 2012 |
| 5,008 |
| |
September 29, 2012 |
| 8,064 |
| |
December 31, 2012 |
| 12,865 |
| |
Subject to certain terms and conditions, the Term Loan Agreement and the Revolving Loan Agreement included accordion features that provided for additional availability under the Term Loan and the Revolving Loan. During the year ended December 31, 2012, we exercised our right to increase our borrowings under the Term Loan by a total of $35.0 million, bringing the Term Loan to the principal amount of $135.0 million at December 31,2012, prior to scheduled amortization payments. At December 31, 2012, $15.0 million and $25.0 million were available under the accordion features of the Term Loan Agreement and the Revolving Loan Agreement.
Covenants and Defaults
The Term Loan Agreement and the Revolving Loan Agreement contained customary representations and warranties as well as provisions for repayment, guarantees, other security and customary events of default. The Term Loan Agreement and the Revolving Loan Agreement also provided the lenders security interests in our collateral. The Revolving Loan Agreement had a first lien security interest in our accounts receivable and inventory, and the Term Loan Agreement had a second lien interest in the accounts receivable and inventory and a first lien interest in all of our other assets.
The Term Loan Agreement and the Revolving Loan Agreement required us to be in compliance with specified financial covenants, as defined in each agreement, including (i) a Consolidated Leverage Ratio; and (ii) a Fixed Charge Coverage Ratio of not less than 1.2 to 1.0 for every fiscal quarter ended after the end of fiscal year 2011; and (iii) certain other covenants related to the operation of UniTek’s business in the ordinary course. The Consolidated Leverage Ratio was to decline over time from 4.75:1.00 as of the second quarter of 2011 to 3.00:1.00 as of the first quarter of 2016.
In the event of noncompliance with these financial covenants and other defined events of default, the lenders were entitled to certain remedies, including acceleration of the repayment of amounts outstanding on the Term Loan and the Revolving Loan. As discussed in Notes 2 and 21 of “Item 8. Financial Statements and Supplementary Data,” the Company restated its 2011 consolidated financial statements as well as interim condensed consolidated financial statements for certain quarters of 2011 and 2012. The result of those restatements, as well as the delay in filing our 2012 and first quarter 2013 financial statements on a timely basis with the SEC, and certain misrepresentations by former members of management, created events of default and covenant compliance violations under the Term Loan Agreement and the Revolving Loan Agreement. The Term Loan and Revolving Loan lenders signed a Standstill and Forbearance agreement on June 14, 2013, that extended the standstill periods contained in the original April 30, 2013 Forbearance Agreements, which provide that the lenders would not exercise their rights in response to the Company’s failure to comply. These Forbearance Agreements provided, among other things, that the Company’s indebtedness would become due and payable on or around June 30, 2013 unless the Company received a commitment for refinancing. The Forbearance Agreements also required the Company to retain a financial advisor to assist the Company in completing a restructuring of its debt.
2013 Refinancing and Amendments
On July 10, 2013, the Company and Apollo Investment Corporation (“Apollo”) entered into and closed on a Revolving Credit and Security Agreement which provide a $75 million asset-based revolving credit facility (“ABL Facility”). The funds available under the ABL Facility were used to replace UniTek’s previous revolving credit facility dated April 15, 2011. Additionally, the ABL Facility increases the Company’s borrowing availability as compared to its previous revolving credit facility by $30 million through October 31, 2013, $25 million from November 1, 2013 through November 30, 2013 and $20 million thereafter, up to a maximum of $75 million. The Company paid commitment fees and work fees to Apollo of $3.3 million as well as legal and other financial advisory fees of approximately $1.2 million in connection with this transaction. Interest on the Apollo ABL facility is based on a similar structure as the prior Revolving Loan Agreement, except for:
· The Applicable Margin applied to loans is higher (from 2.25% – 2.75% up to a range of 8.25% – 9.25%, depending upon whether the loan was an alternate base rate or LIBOR loan)
· The unused commitment fee is higher (2.0% as compared to 0.375%)
On July 18, 2013, the Company and the existing Term Loan lenders entered into a Second Amendment and Limited Waiver to Credit Agreement (“Amended Term Loan”). Under the provisions of this amendment, the following changes were made, which will allow the Company to continue to operate for the foreseeable future as long as it meets its obligations under the Apollo ABL Facility and this agreement:
· The interest rate paid in cash was increased by 200 basis points (for Eurodollar, or LIBOR rate loans) as compared to the interest rate prior to the Amended Term Loan.
· An additional payment in kind (“PIK”) interest rate of 400 basis points was added, which increases the amount of the loan balance but is not paid in cash until the full principal on the loan is repaid.
· 3.8 million warrants to purchase our common stock at an exercise price of $0.01 per share and registration rights were issued to the Amended Term Loan lenders.
· All defaults under the Standstill Agreement and subsequent forbearance agreements were waived with respect to quarters restated in 2011 and 2012, as well as for delays in the delivery of audited financial statements and violations of the Leverage Ratio and Fixed Charge Coverage ratios for periods up to and including the quarter ended June 30, 2013.
· Further restrictions on capital expenditures and capital lease obligations were put in place, which limits capital expenditures to $7 million in 2013 and $8 million (plus any unused limit from the prior year) in 2014 and beyond. Aggregate indebtedness outstanding on capital lease obligations was also limited to $15 million as compared to the prior limit.
· Modified Leverage Ratios and Fixed Charge Coverage ratios effective with the quarter and twelve month period ended September 30, 2013, which were substantially higher (for the Leverage Ratio) than the prior financial covenants.
Discussion and Analysis of Historical Cash Flows — Comparison of Periods Ended in 2012 and 2011
The following table summarizes our historical sources and uses of cash:
(in thousands) |
| Year Ended |
| Nine Months |
| Six Months |
| Three Months |
| ||||
|
|
|
| (Restated) |
| (Restated) |
| (Restated) |
| ||||
Cash provided by (used in): |
|
|
|
|
|
|
|
|
| ||||
Operating activities |
| $ | 8,950 |
| $ | (4,843 | ) | $ | (2,683 | ) | $ | (8,597 | ) |
Investing activities |
| (14,932 | ) | (19,180 | ) | (4,163 | ) | (2,359 | ) | ||||
Financing activities |
| 9,254 |
| 24,234 |
| 6,454 |
| 15,039 |
| ||||
(in thousands) |
| Year Ended |
| Nine Months |
| Six Months |
| Three Months |
| ||||
|
| (Restated) |
| (Restated) |
| (Restated) |
|
|
| ||||
Cash provided by (used in): |
|
|
|
|
|
|
|
|
| ||||
Operating activities |
| $ | 9,099 |
| $ | 1,327 |
| $ | 3,166 |
| $ | (2,701 | ) |
Investing activities |
| (17,838 | ) | (16,460 | ) | (15,012 | ) | (1,247 | ) | ||||
Financing activities |
| (8,329 | ) | (1,332 | ) | 1,483 |
| (1,909 | ) | ||||
Cash Flows from Operating Activities
Cash flows from operating activities decreased by $0.1 million for the year ended December 31, 2012, and by $6.2 million, $5.8 million and $5.9 million for the nine, six and three months ended September 29, 2012, June 30, 2012 and March 31, 2012, respectively, each compared to the corresponding periods in 2011. The changes in operating cash flows were driven by working capital trends, restructuring activities, contingent consideration payments and changes in net cash flows with customers, vendors and employees as represented by Adjusted EBITDA.
Working capital trends were fairly consistent during the first half of 2012 compared to 2011, with changes of less than $1.0 million in the 2012 periods compared to the 2011 periods, but for the nine months ended September 29, 2012, we had used $3.4 million more cash compared to corresponding period of 2011. These greater cash outflows were driven by growth in our wireless business in the third quarter of 2012, which required us to make significant investments in working capital due to the longer collection cycles associated with this business, as well as a seasonal increase related to our fulfillment business for its busiest portion of the year. These were partially offset by the monetization of working capital related to our wireline business, which experienced slowdowns in 2012 as significant projects were completed and receivables and payables were settled. The working capital trend reversed for the full year ended December 31, 2012, during which time working capital outflows decreased by $4.9 million. This was caused by the reversal of the seasonal increases noted previously and the additional monetization of working capital related to our wireline business through its sale on December 28, 2012.
Cash paid for restructuring was $5.5 million for the year ended December 31, 2012 and $3.3 million, $2.5 million and $1.6 million for nine, six and three months ended September 29, 2012, June 30, 2012 and March 31, 2012, respectively. As noted previously in our discussion and analysis of our results of operations, we made changes to our management structure in order to reposition executive resources from non-core activities to support the continued growth in wireless and fulfillment services. We paid no cash for restructuring during the year ended December 31, 2011.
The portion of cash paid for contingent consideration that relates to changes in fair value is classified as an operating activity under GAAP. Such payments were $1.6 million for the year ended December 31, 2012 and for the nine and six months ended September 29, 2012 and June 30, 2012, respectively, and were related to our acquisition of Pinnacle.
The remaining variances in cash flows from operating activities were caused by increases in Adjusted EBITDA from our continuing operations, which were partially or more than offset by decreases in Adjusted EBITDA from our discontinued operations. The net effect of these changes was a cash outflows of $0.6 million for the year ended December 31, 2012 and cash inflows (outflows) of $0.2 million, $(3.3) million and $(3.6) million for nine, six and three months ended September 29, 2012, June 30, 2012 and March 31, 2012, respectively. These trends are discussed further in our discussion and analysis of our results of operations.
Cash Flows from Investing Activities
Cash flows from investing activities increased by $2.9 million for the year ended December 31, 2012, and by $10.8 million for the six months ended June 30, 2012, compared to the corresponding periods of 2011. Cash flows from investing activities decreased by $2.7 million and $1.1 million for the nine and three months ended September 29, 2012 and March 31, 2012, compared to the corresponding periods of 2011. These increases and decreases were primarily driven by changes in cash paid to acquire businesses in the second quarter of 2011 and the third quarter of 2012, with the remainder primarily attributable to changes in capital expenditures, which may vary from period to period depending on the timing of equipment purchases and software improvements.
Cash Flows from Financing Activities
Cash flows from financing activities increased by $17.6 million for the year ended December 31, 2012, and by $25.6 million, $5.0 million and $16.9 million for the nine, six and three months ended September 29, 2012, June 30, 2012 and March 31, 2012, respectively, compared to the corresponding periods of 2011. These increases was driven by the origination of our long-term debt facility in the second quarter of 2011, and subsequent borrowings in each subsequent quarter. These cash inflows were partially offset by cash payments of $21.5 million for contingent consideration, which mainly occurred during the second quarter of 2012, caused by the timing of earn-out payments for the Pinnacle acquisition.
Discussion and Analysis of Historical Cash Flows — Comparison of Years Ended December 31, 2011 and 2010
The following table summarizes our historical sources and uses of cash:
|
| Year Ended December 31, |
| ||||
(in thousands) |
| 2011 |
| 2010 |
| ||
|
| (Restated) |
|
|
| ||
Cash provided by (used in): |
|
|
|
|
| ||
Operating activities: |
| $ | 9,099 |
| $ | (2,980 | ) |
Investing activities |
| (17,838 | ) | (3,136 | ) | ||
Financing activities |
| (8,329 | ) | 21,513 |
| ||
Cash Flows from Operating Activities
Cash flows used in operating activities increased by $12.0 million from 2010 to 2011. The increase was primarily driven by higher Adjusted EBITDA of $4.0 million from continuing operations and $3.0 million from discontinued operations, a decrease in cash paid for interest of $4.7 million and a decrease of cash paid for restructuring activities of $1.0 million. The increase in Adjusted EBITDA was driven primarily by the acquisition of Pinnacle, growth in our fulfillment business and operational improvements. The decrease in cash paid for interest was primarily the result of the refinancing of our debt in April 2011. There was no cash paid for restructuring activities in 2011.
Cash Flows from Investing Activities
Cash flows used in investing activities increased by $14.7 million from 2010 to 2011 as a result of the Pinnacle acquisition in April 2011 and, to a lesser extent, the Cable Acquisitions.
Cash Flows from Financing Activities
Cash flows from financing activities decreased by $29.8 million from 2010 to 2011. The majority of the decrease was caused by financing activities from 2010 that did not repeat in 2011. During 2010, we received net proceeds of $86.4 million from our equity offering and $12.5 million from issuance of preferred stock, which we used to make net repayments of debt of $67.4 million with remaining net proceeds of $31.5 million.
Expected Uses of Liquidity in 2013
Throughout 2013, we plan to continue making investments in our business to support our continued growth through additional working capital and capital expenditures.
In 2013, the Company intends to focus on maintaining profitability in its Fulfillment segment and completing projects and improving profit in Engineering and Construction. With regards to its Fulfillment segment, the Company believes it can also improve profitability by increasing marketing and customer penetration of previously built markets, acquiring new markets and exiting unprofitable markets. In addition, the Company believes it can further improve the efficiency of the operations through fuel savings initiatives, productivity improvements and improved utilization rates. In the Engineering and Construction segment, the Company believes it can improve operating results by (i) a concentrated focus on the selling process resulting in increased bid activity, which should result in increased revenues; (ii) timely operational execution on large contracts to continue billing and collecting payment for agreed milestones; and (iii) managing and shortening the cycle time for the tower upgrades for higher capacity wireless phone infrastructure to improve our working capital position.
The Company, as of December 31, 2012, needs to continue to improve its working capital ratio over the next few quarters to adequately manage the size of its expanded operations. Management believes that through a combination of leveraging and refinancing assets, its cash on hand, greater expense control, and positive operating income, it can meet its anticipated liquidity and capital resource requirements for the next twelve months.
Off-Balance Sheet Arrangements
We provide letters of credit to secure our obligations primarily related to our insurance arrangements. Total letters of credit issued as of December 31, 2012 was $23.9 million which reduced our availability under our Revolving Loan in an amount equal to the value of the letters of credit. We expect that the total letters of credit issued and outstanding may continue to increase, depending upon our loss and claim history under our existing high-deductible insurance plans.
In the ordinary course of business, the Company is required by certain customers and state license agencies to provide performance, payment and permit bonds for some of the Company’s contractual commitments related to projects in process. These bonds provide a guarantee to the customer that the Company will perform under the terms of a contract and that the Company will pay subcontractors and other vendors. As of December 31, 2012 and 2011, the Company had $69.0 million and $58.9 million in bonds outstanding, respectively, which are unrelated to our availability under our Revolving Loan.
Effect of Inflation
We do not believe that our businesses are impacted by inflation to a significantly different extent than the general economy. However, there can be no assurance that inflation will not have a material effect on our operations in the future.
ITEM 7A. QUANTITATIVE AND QUALITATIVE DISCLOSURES ABOUT MARKET RISK
Not applicable.
ITEM 8. FINANCIAL STATEMENTS AND SUPPLEMENTARY DATA
Our financial statements required pursuant to this Item are presented beginning on page F-1 of this Form 10-K.
ITEM 9. CHANGES IN AND DISAGREEMENTS WITH ACCOUNTANTS ON ACCOUNTING AND FINANCIAL DISCLOSURE
None
ITEM 9A. CONTROLS AND PROCEDURES
This Item 9A includes information concerning the controls and control evaluations referred to in the certifications of our Chief Executive Officer and Chief Financial Officer required by Rule 13a-14 of the Exchange Act included in this Report as Exhibits 31.1 and 31.2.
Evaluation of Disclosure Controls and Procedures
Our management, with the participation of our Chief Executive Officer and new Chief Financial Officer, has evaluated the effectiveness of our disclosure controls and procedures as defined in Rule 13a-15(e) and 15(d)-15(e) of the Securities Exchange Act of 1934, as amended (the “Exchange Act”), as of the end of the period covered by this report. The purpose of this evaluation is to provide reasonable assurance that the information required to be disclosed by us in reports filed under the Exchange Act, is recorded, processed, summarized and reported within the time periods specified in the Securities and Exchange Commission’s rules and forms, and that information required to be disclosed by us in the reports we file or submit under the Exchange Act, is accumulated and communicated to our management, including our Principal Executive and Financial Officers, or persons performing similar functions, as appropriate to allow timely decisions regarding required disclosure.
As described below, management has identified material weaknesses in our internal control over financial reporting, which is an integral component of our disclosure controls and procedures. As a result of those material weaknesses, we concluded that our disclosure controls and procedures were not effective as of December 31, 2012. Notwithstanding the existence of the material weaknesses described below, each of our Chief Executive Officer and Chief Financial Officer has concluded that the consolidated financial statements in this report fairly present, in all material respects, our financial position, results of operations and cash flows as of the dates and for the periods presented, in conformity with accounting principles generally accepted in the United States of America (“GAAP”).
Management’s Annual Report on Internal Control over Financial Reporting
Our management is responsible for establishing and maintaining adequate internal control over financial reporting as defined in Exchange Act Rule 13a-15(f). Our system of internal control over financial reporting is designed to provide reasonable assurance to our management and Board of Directors regarding the preparation and fair presentation of published financial statements and the reliability of financial reporting and the preparation of financial statements for external purposes in accordance with GAAP. Internal control over financial reporting includes those policies and procedures that (1) pertain to the maintenance of records that, in reasonable detail, accurately and fairly reflect the transactions and dispositions of the assets of the company; (2) provide reasonable assurance that transactions are recorded as necessary to permit preparation of financial statements in accordance with generally accepted accounting principles, and that receipts and expenditures of the company are being made only in accordance with authorizations of management and directors of the company; and (3) provide reasonable assurance regarding prevention or timely detection of unauthorized acquisition, use, or disposition of the company’s assets that could have a material effect on the financial statements.
Because of its inherent limitations, internal control over financial reporting may not prevent or detect misstatements. Also, projections of any evaluation of effectiveness to future periods are subject to the risk that controls may become inadequate because of changes in conditions, or that the degree of compliance with the policies or procedures may deteriorate. Therefore, even those systems determined to be effective can provide only reasonable assurance with respect to financial statement preparation and presentation.
Our management assessed the effectiveness of our internal control over financial reporting as of December 31, 2012. In making this assessment, management used the criteria set forth by the Committee of Sponsoring Organizations of the Treadway Commission in Internal Control — Integrated Framework (the “COSO criteria”). The COSO criteria highlights that the control environment sets the tone of the organization, influences the control consciousness of its people, and is the foundation for all other components of internal control over financial reporting.
A material weakness is a deficiency, or combination of deficiencies, in internal control over financial reporting such that there is a reasonable possibility that a material misstatement of the Company’s annual or interim financial statements will not be prevented or detected on a timely basis. In connection with management’s assessment of our internal control over financial reporting described above, management has identified the following deficiencies that constituted material weaknesses:
· We did not maintain adequate entity level monitoring controls to prevent, or detect and correct, errors in recording financial results within the Pinnacle Wireless division. Operating unit management was allowed the authority to determine accounting policies and to make accounting decisions without adequate corporate oversight.
· We did not design or maintain effective procedures for handling complaints and concerns about questionable accounting matters, nor did we maintain adequate internal audit monitoring controls for the complete and timely investigation and reporting of significant matters to the Audit Committee and the Board of Directors.
· We did not design, maintain or monitor effective controls and procedures over the accurate recording, presentation and disclosure of revenue and related costs that are accounted for under the percentage-of-completion method of accounting within the Engineering and Construction segment. Specifically, we did not design, maintain or monitor effective controls and procedures primarily related to the appropriate segmentation or combination, and maintenance, of individual contracts; the estimation of total contract revenue, including the impact of claims and change orders; the determination of the appropriate timing of recognition of contract costs; and the appropriate revision of estimates of total costs to complete contracts.
· We did not maintain a sufficient complement of personnel with an appropriate level of accounting knowledge, experience, and training in the application of GAAP to challenge our application of GAAP commensurate with the nature and complexity of the Company’s transactions to prevent or detect and correct material misstatements in a timely manner.
The material weaknesses described above have resulted in material misstatements in our previously issued consolidated financial statements as of and for the year ended December 31, 2011, and our previously issued unaudited condensed consolidated financial statements as of and for the interim periods ended July 2, 2011, October 1, 2011, March 31, 2012, June 30, 2012, and September 29, 2012, all of which have been restated. As a result of these material weaknesses, management has concluded that we did not maintain effective internal control over financial reporting as of December 31, 2012.
Management’s Plan for Remediation
Management is committed to the implementation of a plan to address the material weaknesses and to ensure each area affected by a material control weakness is adequately remediated. These remediation efforts, summarized below, portions of which are either implemented or in process, are intended to both address the identified material weaknesses and to enhance our overall financial control environment:
· Management will implement an enhanced review process at the corporate level wherein systematic review of the status of in-process contracts and evaluation of the assumptions, estimates and other information used to recognize revenues to-date will take place. In December 2012, we completed the implementation of our Oracle ERP system at the Pinnacle Wireless division, which we view as an integral part of the design and implementation of new transaction-level controls responsive to certain issues noted above. Further, we will perform an evaluation of our relevant accounting policies and processes to ensure that they are documented and standardized across the Company, circulated to the appropriate constituencies and reviewed and updated on a periodic basis.
· The Internal Audit function’s direct reporting responsibility to the Audit Committee and the Board of Directors has been emphasized and is now monitored by the General Counsel/Chief Compliance Officer. Further, the Company is considering the addition of additional Internal Audit professionals qualified and experienced in adherence to Internal Audit standards of practice.
· The process and related internal controls for revenue recognition accounting within the Engineering and Construction segment will be improved to ensure effective management review of contract terms, timely and accurate preparation of initial and updated detailed cost estimates, effective communication with accounting personnel, and effective management review and approval of the revenue recognition assumptions, calculations and conclusions.
· In addition to our new Chief Financial Officer and Vice President and Corporate Controller, the Company is actively recruiting fully qualified, appropriately credentialed candidates to take certain finance, accounting, and internal audit positions in both the corporate office and in the Engineering and Construction segment. These candidates will possess an appropriate level of accounting knowledge, experience, and training in the application of GAAP, including the application of the percentage-of-completion method of accounting, and will have the appropriate reporting responsibilities to corporate management.
When fully implemented and operational, management believes the measures described above will remediate the control deficiencies identified and strengthen internal control over financial reporting. The Company is committed to continuing to improve its internal control processes and will continue to diligently and vigorously review its financial reporting controls and procedures. As we continue to evaluate and work to improve our internal control over financial reporting, our management may determine to take additional measures to address control deficiencies or determine to modify, or in appropriate circumstances not to complete, certain of the remediation measures described above.
Changes in Internal Control over Financial Reporting
Other than as described above, there were no changes in our internal control over financial reporting identified in connection with the evaluation required by paragraph (d) of Exchange Act Rules 13a-15 or 15d-15 that occurred during the period ended December 31, 2012 that have materially affected, or are reasonably likely to materially affect, our internal control over financial reporting.
None.
ITEM 10. DIRECTORS, EXECUTIVE OFFICERS AND CORPORATE GOVERNANCE.
Information about the Board of Directors
The Company’s Board of Directors is presently composed of eight members. The Company’s Charter and the Amended and Restated Bylaws of the Company (the “Bylaws”) provide for three classes of directors with staggered terms of three years each. The terms of each class end at successive annual meetings so that the stockholders elect one class of directors at each annual meeting of stockholders. The current members of the Board of Directors and their terms are set forth below, together with certain biographical information.
Directors — Class I (Term expires at Annual Meeting in 2015)
Mark S. Dailey (age 55) — Mr. Dailey has served as a director of the Company since February 2006. Mr. Dailey is currently the Chief Executive Officer of Interim Management International, a consulting company that provides management services to privately-held companies. Mr. Dailey held senior executive management positions including Executive Vice President, Sales and Marketing of Intralinks, Inc., a venture-funded secure document distribution company; Chief Operating Officer of LexiQuest, Inc., a technology-based company exploiting linguistics and natural language processing in developing software tools to manage, access and retrieve large Intranet document collections; and Chief Operating Officer of Medcast Networks, a venture capital-backed start-up delivering comprehensive medical information to physicians. From 1986 to 1999, Mr. Dailey held various senior level positions with Bloomberg Financial Markets, a global leader in the delivery of international real-time financial information. Prior to joining Bloomberg, Mr. Dailey worked for several investment banking firms. Mr. Dailey served as a member of the Board of Directors of STMP, Inc. until April 2013. The Board concluded that Mr. Dailey should serve on the Board due to his significant corporate management experience in the technology industry.
Daniel Hopkin (age 35) — Mr. Hopkin has served as a director of the Company since September 2011. Mr. Hopkin was previously a member of the Company’s Board from January 2010 through December 9, 2010. Mr. Hopkins has been with Kainos Capital Partners, a private equity firm, since January 2013 where he serves as a Principal. Prior to joining Kainos Capital, Mr. Hopkin served as an associate with HM Capital Partners from 2004 to 2006, a Vice President from 2007 to 2010 and a Principal from 2010 to 2012. He focuses primarily on the media and food sectors. Prior to joining HM Capital Partners, Mr. Hopkin worked in the Investment Banking Division of Morgan Stanley. The Board determined that Mr. Hopkin is qualified to serve on the Board due to his investment experience.
Dean MacDonald (age 54) — Mr. Macdonald has served as a director of the Company since January 2010. Mr. MacDonald currently serves on the Board and as the President and Chief Executive Officer of Tuckamore Management Capital Inc., a publically-traded Toronto-based private equity fund. Mr. MacDonald has a long and successful career as an operating executive and entrepreneur. His operating experience includes serving as the Chief Operating Officer of Rogers Cable and as the Chief Executive Officer of Persona Communications, a TSX-listed cable and internet services company. Mr. MacDonald worked with a syndicate of investment partners to turn around Persona’s operations and subsequently sold the business at a significant premium to its purchase price in 2007. Mr. MacDonald has also served as chairman of the Newfoundland and Labrador Energy Corporation, which manages the province’s oil and gas assets. In 2007, Mr. MacDonald was selected as CEO of the Year by Birch Hill Capital Partners. The Board determined that Mr. MacDonald should serve on the Board based on his management and investment experience in a number of industries, including advertising, marketing and telecommunications.
Michael F. O’Donnell (age 66) — Mr. O’Donnell has served as a director of the Company since December 2010 and has been Chairman of the Board since January 2012. Mr. O’Donnell is a financial executive with over 40 years of experience in the audit and consulting industries. He has dealt extensively with multinational corporate boards and senior management teams on key strategic issues, external auditors and consultants. Most recently, Mr. O’Donnell served as a Founding Managing Director of Protiviti, Inc., a global business consulting and internal audit firm specializing in risk, advisory and transaction services. Previously, Mr. O’Donnell spent 33 years at Arthur Andersen LLP, occupying numerous senior level positions in risk consulting, audit services and the energy industry program. The Board concluded that Mr. O’Donnell should serve on the Board due to his extensive financial, audit, and consulting experience, as well as his knowledge in working with public company boards of directors, audit committees and other sub-committees.
Directors — Class II (Term expires with Annual Meeting in 2013)
Robert W. Sperry (age 58) — Mr. Sperry has served as a director of the Company since April 2012. Mr. Sperry has been with Kainos Capital Partners, a private equity firm, since January 2013. At Kainos Capital Partners, Mr. Sperry serves as a Partner with primary responsibility for operating oversight and deal sourcing of consumer product investments. Mr. Sperry has also been a Partner with Brynwood Partners, a private equity firm, since 2004. Prior to joining Kainos Capital Partners, Mr. Sperry was a Partner at HM Capital Partners from 2011 to 2012 and was previously an operating partner at HM Capital Partners when he served as Chief Operating Officer of Metropoulos & Co. Prior to this, Mr. Sperry spent 17 years with Nestle in a wide range of general management roles. Mr. Sperry is a director of Advanced H2O, a producer of private label bottled water and water-based beverages, and Milk Specialties Global, a manufacturer of whey and specialty dairy protein ingredients serving the sport nutrition, food manufacturing and animal nutrition end markets. The Board determined that Mr. Sperry should serve on the Board based on his management and investment experience in a number of industries.
Robert S. Stott (age 66) — Mr. Stott has served as director of the Company since December 2010. Mr. Stott is an experienced telecommunications industry executive. In 2007, he retired as President of the Northeast Region of Verizon Wireless after serving at Verizon and its legacy companies for over 40 years. Mr. Stott began his career as an equipment installer with the New England Telephone Company and held a number of senior-level positions with NYNEX Mobile through that company’s merger with Bell Atlantic in 1995. Following the merger, Mr. Stott was appointed the President of Bell Atlantic Mobile’s Philadelphia Tri-State region, where he remained until assuming the role in New England in 1998. The Board concluded that Mr. Stott should serve on the Board due to his broad experience in the telecommunications industry in various corporate leadership and executive roles.
Directors — Class III (Term expires at Annual Meeting in 2014)
Michael Montelongo (age 57) — Mr. Montelongo has served as a director of the Company since December 2010. Mr. Montelongo currently serves as Senior Vice President, Public Policy and Corporate Affairs for Sodexo, Inc., a $9 billion quality of life services enterprise. Previously, Mr. Montelongo served both as that company’s Senior Vice President and Chief Administrative Officer and Senior Vice President of Strategic Marketing. In 2001, Mr. Montelongo was appointed by former President George W. Bush and confirmed by the U.S. Senate as Assistant Secretary of the Air Force. He is a member of the Council on Foreign Relations and serves on the Board of Trustees for Aerospace Corporation and on the National Aeronautics and Space Administration Advisory Council. He was formerly a member of the board of directors of Denny’s Corporation. The Board concluded that Mr. Montelongo should serve on the Board due to his strategy and finance fluency and diverse background in both industry and public sector administration and leadership positions.
Rocco Romanella (age 56) — Mr. Romanella has served as a director of the Company since March 2013. Mr. Romanella is the Chief Executive Officer of the Company, a role he assumed in July 2012. Mr. Romanella brings 36 years of management, operations and engineering experience to the Company from his career at United Parcel Service (“UPS”), where he most recently held the position of President of Retail and Residential Operations and was responsible for the global strategy of all U.S. and international retail channels. Under his direction, UPS successfully launched one of the largest re-branding initiatives in franchising history, revolutionizing the $9 billion retail shipping and business services market. Previously, Mr. Romanella served in positions of increasing responsibility at UPS, starting as a delivery driver and eventually holding a number of senior management positions. He is also a winner of the UPS Chairman’s Award for Excellence. The Board concluded that Mr. Romanella should serve on the Board due to his extensive leadership experience including his accomplishments during his transition as Chief Executive Officer of the Company.
Information about the Current Executive Officers (Not Also A Director)
James Brennan (age 66) — Mr. Brennan is the Vice President, Controller, a position he has held since July 2013. Prior to joining the Company, Mr. Brennan was a consultant for the Company since April 2013. From March 2006 to December 2011, Mr. Brennan was at MedQuist Inc. as the Vice President, Controller, Treasurer, and Principal Accounting Officer.
Andrew Herning (age 42) — Mr. Herning is the Chief Financial Officer, a position he has held since June 2013. Prior to joining the Company, Mr. Herning was employed by AS America, Inc. (American Standard Brands) as Interim Chief Financial Officer during 2012; Vice President of Finance — Fixtures from 2009 to 2011; Senior Director of Finance — Chinaware from 2007 to 2009; and Global Controller of the Bath & Kitchen division of American Standard Companies from 2004 to 2007. Prior to joining American Standard Companies, Mr. Herning was a Senior Manager with KPMG LLP and Arthur Andersen LLP.
Donald W. Gately (age 57) — Mr. Gately is the Chief Operating Officer, a position he has held since December 2012. From March 2010 to November 2010, Mr. Gately was Vice President for Residential and Retail Channel for The UPS Stores, Inc. From January 2006 to February 2010, Mr. Gately was Vice President of UPS’s Central Florida District.
Stanley G. Jones (age 59) — Mr. Jones is Senior Vice President of Sales and Marketing, a position he has held since November 2012. Prior to joining the Company, Mr. Jones was employed by Target Corporation from September 2010 to August 2012 as Executive Team Leader of logistics. From August 2004 to November 2009, Mr. Jones was employed by FedEx Corporation as a delivery/pick-up driver.
Glorminda McAllister (age 42) — Ms. McAllister is the Chief Information Officer, a position she has held since March 2013. Prior to joining the Company, Ms. McAllister was employed by The UPS Store, Inc. from October 2001 to February 2013 where she was the Vice President of Technology from December 2009 to February 2013 and the Technology Staff Manager from January 2005 to December 2009.
Kathleen McCarthy (age 56) — Ms. McCarthy is the Vice President, General Counsel and Corporate Secretary, a position she has held since April 2013. Prior to joining the Company, Ms. McCarthy was the General Counsel, Corporate Secretary at Ulticom, Inc., a provider of network signaling solutions for use in the communications industry, from 2007 to 2011.
R. Christopher Perkins (age 50) — Mr. Perkins is the President of FTS USA subsidiary, a role he assumed in July 2006.
Shannon D. Schell (age 45) — Mr. Schell is the Senior Vice President of Engineering, a position he has held since November 2012. Prior to joining the Company, Mr. Schell was the Chief Operating Officer for SWI Group, a world leader in the watch industry, from February 2011 to May 2012. From June 2010 to September 2010, Mr. Schell was the Vice President of Logistics for TUI Lifestyle, a high-end furniture and design company. From September 1989 to April 2010 he was employed by UPS, with his last position as Director of Engineering — Florida.
Carole Dalton Slover, (age 46) — Ms. Slover is the Senior Vice President of Human Resources, a position she has held since July 2012. From June 2005 to February 2012, Ms. Slover was employed by Yell Adworks as Vice President of Human Resources.
Daniel Yannantuono (age 40) — Mr. Yannantuono is the President of our DirectSat USA subsidiary, a role he assumed in January 2007. Mr. Yannantuono was the Co-Manager of the Interim Office of the CEO from January to July 2012.
Corporate Governance
Code of Business Conduct and Ethics
Each of the Company’s directors, officers and employees, including its Chief Executive Officer and its senior financial and accounting executives, are required to comply with its Code of Business Conduct and Ethics (the “Code”) The Code sets forth policies covering a broad range of subjects and requires strict adherence to laws and regulations applicable to the Company’s business. The Code is available on the Company’s website at www.unitekglobalservices.com under the “Investor Relations, Corporate Governance” headings. A copy of the Company’s Code may also be obtained, without charge, by any person upon written request directed to the Corporate Secretary of the Company at 1777 Sentry Parkway West, Gwynedd Hall, Suite 302, Blue Bell, Pennsylvania 19422. The Company will post to its website any amendments to the Ethics Code, or waiver from its provisions for principal executive officers or directors, under the “Investor Relations, Corporate Governance” headings.
Committees of the Board of Directors
The Board has three standing committees. Each committee operates pursuant to a charter approved by the Board of Directors, copies of which are available on the Company’s website at www.unitekglobalservices.com under the “Investor Relations, Corporate Governance” headings or upon written request to the Corporate Secretary of the Company at 1777 Sentry Parkway West, Gwynedd Hall, Suite 302, Blue Bell, Pennsylvania 19422.
Audit Committee
Members: Mr. Montelongo (Chair); Mr. Dailey; and Mr. Hopkin
The Audit Committee is a separately-designated standing audit committee established in accordance with Section 3(a)(58)(A) under the Securities Act of 1934, as amended (“Exchange Act”). The Board of Directors has determined that each member of the Audit Committee is “independent” and financially literate as required by the applicable NASDAQ Listing Standards. In addition, the Board of Directors has determined that Mr. Montelongo is the “audit committee financial expert” within the meaning stipulated by the rules of the SEC.
The Audit Committee’s responsibilities are discussed in the charter, which include, among other duties, the responsibility to:
· oversee the integrity of the financial statements and monitor the performance of the internal audit function;
· provide an avenue of open communications among the independent registered public accounting firm, Company management and the Board of Directors;
· appoint, compensate, retain and monitor the independence and performance of the independent registered public accounting firm;
· review and discuss with the independent registered public accounting firm and financial management the scope of the audit;
· hold meetings periodically with the independent registered public accounting firm, the internal audit function and management to review and consider the adequacy and effectiveness of financial reporting, internal controls and risk assessment;
· review consolidated financial statements and disclosures and critical accounting policies and practices;
· review and advise the Board of Directors on potential conflicts of interest regarding the Company and its officers and directors; and
· oversee compliance with legal and regulatory requirements and the Company’s Code of Business Conduct and Ethics.
Nominating and Corporate Governance Committee
Members: Mr. O’Donnell (Chair) and Mr. Dailey
Each member of the Nominating and Corporate Governance Committee is “independent” as affirmatively determined by the Board of Directors pursuant to the applicable NASDAQ Listing Standards. The Nominating and Corporate Governance Committee’s responsibilities are discussed in detail in the charter, which include, among other duties, the responsibility to:
· identify individuals qualified to serve as members of the Board consistent with criteria approved by the Board and recommend to the Board the director nominees for election (or re-election, in the case of current Board members) to the Board and its committees;
· develop and periodically review the Company’s Corporate Governance Guidelines and recommend any changes thereto to the Board for approval;
· oversee an annual evaluation of the Board, it members and all committees of the Board; and
· oversee the establishment of the Board’s policies and procedures for stockholder communications with the Board.
Compensation Committee
Members: Mr. Stott (Chair); Mr. MacDonald and Mr. Sperry
The Compensation Committee is composed entirely of “outside directors” within the meaning of the regulations of Section 162(m) of the Internal Revenue Code of 1986, as amended, “non-employee directors” under SEC Rule 16b-3 and “independent” directors as affirmatively determined by the Board of Directors pursuant to the applicable NASDAQ Listing Standards.
The Compensation Committee’s responsibilities, discussed in detail in the charter, include, among other duties, the responsibility to:
· establish and periodically review the Company’s compensation philosophy and adequacy of compensation plans and programs for executive officers and other Company employees;
· establish compensation arrangements and incentive goals for executive officers;
· review and recommend to the Board the base salary, incentive compensation and any other compensation for the Company’s Chief Executive Officer (“CEO”) and, if relevant, the Executive Chairman of the Board;
· establish corporate goals and objectives relevant to compensation of the CEO and evaluate the CEO’s performance in light of these goals and objectives;
· evaluate and recommend to the Board the appropriate level of compensation for non-employee directors; and
· monitor the Company’s cash bonus and equity-based compensation plans and health and welfare plans and discharge the duties imposed on the Compensation Committee by the terms of those plans.
Compensation decisions for the Chief Executive Officer and all other executive officers are reviewed and approved by the Compensation Committee. Compensation recommendations for the CEO and Executive chairman are subject to ratification by the Board of Directors. The Compensation Committee relies upon the Company’s executive officers and compensation consultants in order to assist the Compensation Committee in performing its duties.
The Compensation Committee has authority under its charter to retain, approve fees for and terminate consulting firms, independent counsel or other advisors. In this regard, during 2012 the Compensation Committee engaged Mercer, a global leader in human resources consulting, to assist it in making compensation decisions.
With regard to director compensation, the Compensation Committee is responsible for reviewing and recommending to the Board compensation, equity-based plans and benefits programs for the non-employee directors. During 2012, the Compensation Committee retained Mercer to review the Company’s director compensation and to provide the Compensation Committee with information regarding director compensation at comparable companies in order to identify market practices.
With regard to the compensation of executive officers other than the Chief Executive Officer, the Compensation Committee will review and consider the recommendation of the Company’s Chief Executive Officer as to the form and amount of compensation. The Chief Executive Officer generally obtains the assistance of the Company’s management and any compensation consultant in formulating these recommendations.
The agenda for meetings of the Compensation Committee is determined by its Chair with the assistance of the Company’s management. The Chair will generally coordinate with management and/or outside counsel or any compensation consultants prior to meetings to obtain their assistance as described above, including the preparation and distribution of materials for review by the members of the Compensation Committee. At meetings of the Compensation Committee, the Compensation Committee usually conducts a portion of the meetings in executive session. The Compensation Committee’s Chair reports the Compensation Committee’s recommendations on executive compensation to the Board.
Section 16(a) Beneficial Ownership Reporting Compliance
Pursuant to Section 16(a) of the Exchange Act, the Company’s directors, executive officers and persons beneficially owning more than 10% of the Common Stock are required to file with the SEC reports of their initial ownership and changes in ownership of Common Stock. Based solely on our review of the copies of such reports received by us, or written representations received from reporting persons, during the year ended December 31, 2012, all persons who, at any time during the fiscal year, was a director, officer, or beneficial owner of more than 10% of the Common Stock complied with all Section 16(a) filing requirements, except that (i) Messrs. Peter Giacalone, C. Scott Hisey, Daniel Hopkin, Dean MacDonald, Michael Montelongo, Michael O’Donnell, Richard Siber and Robert Stott each filed late Form 4s on January 24, 2012; (ii) Messrs. Brodsky and Mark Dailey each filed late Form 4s on January 25, 2012; (iii) Mr. Kevin McClelland filed a late Form 3 on May 16, 2012; (iv) Ms. Elizabeth Downey and Messrs. Kyle Hall, Michael Hayford, Ronald Lejman, Scott Lochhead, Kevin McClelland, R. Christopher Perkins, Norman Snell and Daniel Yannantuono each filed late Form 4s on June 11, 2012; (v) Mr. Michael Hayford filed a late Form 4 on June 12, 2012; (vi) Ms. Elizabeth Downey and Messrs. Kyle Hall, Ronald Lejman, Scott Lochhead, Kevin McClelland, R. Christopher Perkins, Norman Snell and Daniel Yannantuono each filed late Form 4s on August 14, 2012; (vii) Messrs. Stanley Jones and Norman Schell each filed late Form 3s on November 13, 2012; (viii) Mr. C. Scott Hisey filed a late Form 4 on December 4, 2012; and (ix) Mr. Dean MacDonald filed a late Form 4 on December 14, 2012.
ITEM 11. EXECUTIVE COMPENSATION.
Director Compensation
The Company’s director compensation policy for non-employee directors is set forth below:
· $2,500 for each Board meeting attended in person;
· $1,500 for each Board meeting attended by telephone;
· $1,000 for each Audit Committee meeting attended;
· $500 for each Compensation Committee and Nominating and Corporate Governance meeting attended;
· an annual cash retainer fee of $50,000 and the additional annual retainer fees as set forth below;
· $60,000 of equivalent value Restricted Stock Units (“RSUs”) as described in the narrative below;
· $7,500 for the Chair of the Audit Committee; and
· $5,000 for the Chair of the Compensation Committee and the Chair of the Nominating and Corporate Governance Committee.
The Company’s director compensation policy for Non-Executive Chair of the Board is set forth below:
· meeting fees as set forth above;
· an annual cash retainer fee of $100,000; and
· $120,000 of equivalent value RSUs as described in the narrative below.
Director Compensation Table
The following table shows the compensation paid to or earned by each non-employee director for the year ended December 31, 2012:
Name |
| Fees Earned |
| Stock Awards |
| All Other |
| Total |
| ||||
Michael F. O’Donnell(2) |
| $ | 354,500 |
| $ | 160,000 |
| $ | — |
| $ | 514,500 |
|
Mark S. Dailey |
| 86,000 |
| 60,000 |
| — |
| 146,000 |
| ||||
C. Scott Hisey(3) |
|
|
|
|
|
|
|
|
| ||||
Daniel Hopkin |
| 92,500 |
| 60,000 |
| — |
| 152,500 |
| ||||
Dean MacDonald |
| 79,000 |
| 60,000 |
| — |
| 139,000 |
| ||||
Michael Montelongo |
| 95,023 |
| 60,000 |
| — |
| 155,023 |
| ||||
Robert W. Sperry(4) |
| 39,000 |
| 60,000 |
| — |
| 99,000 |
| ||||
Robert F. Stott |
| 83,000 |
| 60,000 |
| — |
| 143,000 |
| ||||
Peter Brodsky(5) |
| 29,500 |
| 60,000 |
| — |
| 89,500 |
| ||||
Richard Siber(6) |
| 52,000 |
| 60,000 |
| 41,500 |
| 153,500 |
| ||||
(1) The amounts in this column represent the aggregate grant date fair value of the RSUs calculated in accordance with Financial Accounting Standards Board (“FASB”) Accounting Standards Codification (“ASC”) Topic 718 regarding share-based payments.
(2) For his service as Chairman of the Board during 2012, in addition to fees for certain committee meetings attended, Mr. O’Donnell received a cash payment of $250,000; $100,000 in the form of RSUs that vested on December 31, 2012; $50,000 in cash paid upon the hiring of the Company’s Chief Executive Officer and $50,000 in cash on December 31, 2012.
(3) Mr. Hisey served as a director during the time he also served as the Chief Executive Officer of the Company from December 1, 2010 to January 10, 2012. Subsequent to January 10, 2012, Mr. Hisey continued to serve as a director until November 30, 2012. Mr. Hisey’s compensation as a non-employee director is listed in the Summary Compensation Table below.
(4) Mr. Sperry was appointed as director effective April 3, 2012.
(5) Mr. Brodsky resigned from the Board effective March 29, 2012.
(6) Mr. Siber resigned from the Board effective May 22, 2012. In connection with his resignation, the Board approved continuing to compensate Mr. Siber for 2012 as if he was a Board member in full attendance at all meetings through the end of 2012. The compensation received by Mr. Siber pursuant to that arrangement is reflected under “All Other Compensation.”
As stated above, each non-employee director is granted $60,000 of equivalent value RSUs under the Company’s 2009 Omnibus Equity and Incentive Compensation Plan and the non-executive chair is granted $120,000 of equivalent value RSUs. The RSUs are valued on the date of the grant. In April 2012, the Board determined that all of the RSUs previously granted in 2011 vested immediately and that the RSUs granted in 2012 would vest in 9 equal installments on the last day of each calendar month in 2012 beginning in April 2012 and ending in December 2012. RSU’s granted in 2013 and future years vest quarterly in equal installments and shares of Common Stock are issued within 30 days after the last vesting date during such calendar year.
In February 2012, the Compensation Committee recommended and the Board approved compensation for a CEO Search Committee. The approved compensation consisted of a $5,000 stipend for each member (with the exception of the Board Chair) for a 3-month period of work. If the CEO Search Committee was still meeting regularly, the Compensation Committee would review the need for additional compensation. In June 2012, in light of the extensive time and effort undertaken by the CEO Search Committee, the Compensation Committee recommended, and the Board approved, an increase in the stipend to $10,000 (except for the Board Chair). The Compensation Committee recommended, and the Board approved, additional compensation for the Non-Executive Chair as follows: (i) $50,000 payable upon the hiring of a permanent CEO of the Company and (ii) an additional $50,000 on December 31, 2012 provided the Non-Executive Chair has updated the other members of the Board at least every other week regarding the operations of the Company.
As described more fully in the Executive Compensation section, the Company also allows directors to participate in a deferred compensation program.
Compensation of Executive Officers
The following table presents the compensation paid to or earned by the Company’s (i) persons who served as the Company’s President and Chief Executive Officers (Messrs. Romanella, Hisey, Lejman and Yannantuono); (ii) its next two highest compensated executive officers (Messrs. Hall and McClelland); and (iii) the next two officers who would have been the next two highest compensated officers referenced in clause (ii) if they had remained with the Company as of the end of the fiscal year (Ms. Downey and Mr. Snell) (collectively, the “named executive officers”) for the years ended December 31, 2012 and 2011:
Name and Principal Position |
| Year |
| Salary |
| Bonus |
| Stock |
| Non-Equity |
| All Other |
| Total |
| ||||||
|
|
|
|
|
|
|
|
|
|
|
|
|
|
|
| ||||||
Rocco Romanella, Chief Executive Officer(2) |
| 2012 |
| $ | 181,539 |
| $ | 100,000 |
| $ | 499,998 |
| $ | 400,000 |
| $ | 8,743 |
| $ | 1,190,280 |
|
| 2011 |
| — |
| — |
| — |
| — |
| — |
| — |
| |||||||
|
|
|
|
|
|
|
|
|
|
|
|
|
|
|
| ||||||
Ronald J. Lejman, Former Chief Financial Officer(3) |
| 2012 |
| 360,500 |
| 350,000 |
| 144,204 |
| 125,000 |
| 55,318 |
| 1,035,022 |
| ||||||
| 2011 |
| 370,192 |
| 381,592 |
| 588,750 |
| — |
| 40,999 |
| 1,381,533 |
| |||||||
|
|
|
|
|
|
|
|
|
|
|
|
|
|
|
| ||||||
Daniel Yannantuono, President of DirectSat USA(4) |
| 2012 |
| 360,500 |
| 350,000 |
| 144,204 |
| 300,000 |
| 36,355 |
| 1,191,059 |
| ||||||
| 2011 |
| 370,192 |
| 285,000 |
| 841,074 |
| — |
| 40,672 |
| 1,536,938 |
| |||||||
|
|
|
|
|
|
|
|
|
|
|
|
|
|
|
| ||||||
C. Scott Hisey, Former Chief Executive Officer(5) |
| 2012 |
| 39,063 |
| 31,293 |
| 60,000 |
| — |
| 1,036,421 |
| 1,166,777 |
| ||||||
| 2011 |
| 475,961 |
| 594,092 |
| 1,682,148 |
| — |
| 39,916 |
| 2,792,117 |
| |||||||
|
|
|
|
|
|
|
|
|
|
|
|
|
|
|
| ||||||
Kevin McClelland, Former Chief Accounting Officer and Corporate Controller (6) |
| 2012 |
| 301,058 |
| 100,000 |
| 38,002 |
| 100,000 |
| 21,755 |
| 560,815 |
| ||||||
| 2011 |
| 275,000 |
| 226,023 |
| 134,574 |
| — |
| 16,685 |
| 652,282 |
| |||||||
|
|
|
|
|
|
|
|
|
|
|
|
|
|
| |||||||
|
|
|
|
|
|
|
|
|
|
|
|
|
|
|
| ||||||
Kyle M. Hall, Former General Counsel and Secretary(7) |
| 2012 |
| 283,250 |
| — |
| 56,640 |
| 100,000 |
| 32,310 |
| 472,200 |
| ||||||
| 2011 |
| 290,865 |
| 226,273 |
| 84,111 |
| — |
| 26,680 |
| 627,929 |
| |||||||
|
|
|
|
|
|
|
|
|
|
|
|
|
|
|
| ||||||
Elizabeth Downey, Former Chief Administrative Officer(8) |
| 2012 |
| 214,392 |
| 300,000 |
| 129,453 |
| 137,158 |
| 89,144 |
| 870,147 |
| ||||||
| 2011 |
| 317,308 |
| 190,000 |
| 504,648 |
| — |
| 34,788 |
| 1,046,744 |
| |||||||
|
|
|
|
|
|
|
|
|
|
|
|
|
|
|
| ||||||
Norman Snell, Former Chief Information Officer(9) |
| 2012 |
| 293,532 |
| 100,000 |
| 83,944 |
| 200,000 |
| 10,353 |
| 687,829 |
| ||||||
| 2011 |
| 290,865 |
| 190,000 |
| 235,500 |
| — |
| 29,680 |
| 746,045 |
| |||||||
(1) | Includes awards that contain performance-based vesting conditions. The amounts above represent the aggregate grant date fair value of the restricted stock calculated in accordance with Financial Accounting Standards Board (“FASB”) Accounting Standards Codification (“ASC”) Topic 718 regarding share-based payments. Assumptions used in the calculation of this amount are included in Note 16 (under the heading “Stock-based Compensation”) to the Company’s audited consolidated financial statements included in this Form 10-K. The value of these awards at the grant date, assuming that the highest level of performance conditions were achieved is as follows: Mr. Lejman - $15,363; Mr. Yannantuano - $15,363; Mr. McClelland - $4,048; Mr. Hall - $6,034; Ms. Downey - $8,779; and Mr. Snell - $6,036. In July 2013, Mr. Romanella received a grant of 192,307 restricted shares that are subject to service-based vesting in four equal installments on the dates that are 6, 12, 18 and 24 months following the grant date. |
(2) | Mr. Romanella’s other compensation for 2012 includes an automobile allowance and company-provided fuel totaling $6,601 and preferential health and welfare benefits of $2,142. Mr. Romanella joined the Company on July 16, 2012. |
(3) | Mr. Lejman’s other compensation for 2012 and 2011 includes the use of a company-owned vehicle and related fuel and maintenance costs totaling $22,307 and $17,553, respectively, matching contributions under the Company’s deferred compensation plan of $28,339 and $18,774, respectively, and preferential health and welfare benefits of $4,672 for each year. Mr. Lejman was terminated on April 12, 2013. |
(4) | Mr. Yannantuono’s other compensation for 2012 and 2011 includes the use of a company-owned vehicle and related fuel and maintenance costs totaling $20,880 and $25,298, respectively, matching contributions under the Company’s deferred compensation plan of $10,803 and $10,702, respectively, and preferential health and welfare benefits of $4,672 for each year. |
(5) | Mr. Hisey’s other compensation for 2012 includes severance payments of $923,850 and compensation for his service on the Company’s Board of Directors which included $67,500 of fees earned or paid in cash and share awards valued at $60,000, partially offset by the forfeiture of matching contributions under the Company’s deferred compensation plan of $14,929. Mr. Hisey’s other compensation for 2011 includes the use of Company-owned vehicle and related fuel and maintenance costs totaling $21,484, matching contributions under the Company’s deferred compensation plan of $13,760 and preferential health and welfare benefits of $4,672. Mr. Hisey resigned as Chief Executive Officer on January 10, 2012 but remained a director until November 30, 2012 when he resigned from the Board. |
(6) | Mr. McClelland’s other compensation for 2012 and 2011 includes matching contributions under the Company’s deferred compensation plan of $17,083 and $12,013, respectively and preferential health and welfare benefits of $4,672 for each year. Mr. McClelland was terminated on April 12, 2013. |
(7) | Mr. Hall’s other compensation for 2012 and 2011 includes $13,800 and $9,200, respectively, representing the value of company-provided housing, the use of Company-owned vehicle and related fuel and maintenance costs totaling $5,348 and $4,400, respectively, matching contributions under the Company’s deferred compensation plan of $8,490 and $8,408, respectively, and preferential health and welfare benefits of $4,672 for each year. Mr. Hall resigned effective March 1, 2013. |
(8) | Ms. Downey’s other compensation for 2012 includes an automobile allowance and company-provided fuel totaling of $13,410, severance payments of $83,192 and preferential health and welfare benefits of $3,699, partially offset by the forfeiture of matching contributions under the Company’s deferred compensation plan of $11,157. Ms. Downey’s other compensation for 2011 includes an automobile allowance of $20,354, matching contributions under the Company’s deferred compensation plan of $9,762 and preferential health and welfare benefits of $4,672. Ms. Downey resigned effective September 7, 2012 |
(9) | Mr. Snell’s other compensation for 2012 and 2011 includes $13,800 and $9,200, respectively, representing the value of company-provided housing, the use of Company-owned vehicle and related fuel and maintenance costs totaling $4,558 and $4,400, respectively, and preferential health and welfare benefits of $4,477 and $4,672, respectively. With respect to the Company’s deferred compensation plan, Mr. Snell’s 2012 compensation was partially offset by the forfeiture of matching contributions of $12,482, and Mr. Snell’s 2011 compensation includes matching contributions of $11,408. Mr. Snell resigned effective November 14, 2012. |
Senior Executive Compensation Plan
On April 3, 2012, the Board of Directors, upon the recommendation of the Compensation Committee of the Board approved the Senior Executive Compensation Plan (“Plan”), pursuant to which members of Company senior management (including the Company’s Named Executive Officers) will be compensated for their service in 2012 and, unless the Plan is revised, in future years. The Plan will be administered by the Compensation Committee, which may delegate responsibilities to Company officers as it deems appropriate.
The objectives of the Plan are to (i) align the compensation of executive management to key financial drivers; (ii) provide variable pay opportunities and targeted total cash compensation that is competitive within the Company’s labor markets; (iii) increase the competitiveness of executive pay without increasing fixed costs, making bonus payments contingent upon organizational and individual success; and (iv) create internal consistency and standard guidelines among the executive peer group. In achieving these objectives, the Plan is intended to enhance stockholder value by promoting a connection between the performance of the Company and the compensation of executive personnel of the Company. Payments pursuant to the Plan are intended to qualify as “performance-based compensation” within the meaning of Section 162(m) of the Internal Revenue Code.
Participants in the Plan will receive incentive compensation opportunities (both short term and long term) based on either or both of Company and individual performance. Company performance shall be determined based on the Company’s ability to meet or exceed annual “Corporate Goals” as approved by the Board, while individual performance shall be determined based on the Participant’s ability to meet or exceed annual “Individual Goals” approved by the Committee.
There are three compensation components under the Plan:
Base Compensation — Of the eight named executive officers listed in the Summary Compensation Table, only two of the named executive officers (Messrs. Romanella and Yannantuono) are currently employed at the Company. Both Messrs. Romanella and Yannantuono have employment agreements with the Company and their base salary is set by their respective employment agreements. With respect to other senior executives, in January 2012, the Compensation Committee recommended and the Board approved a 3% increase in base salaries. In December 2012, it was determined that base salaries would not increase for 2013.
Short Term Incentive (STI) — Pursuant to the STI, annual target amounts payable are to be set in advance, as a percentage of the Participant’s base salary, based on the achievement of either or both of Company Goals and Individual Goals. At the time the actual amount payable is determined, each participant may elect to receive payment either in 100% cash or in the form of 50% cash and 50% service-based restricted stock, which shall vest in equal annual installments on the first three anniversaries of the date of election. In the event the Participant chooses the second option, he or she will receive shares of restricted stock, in lieu of the cash amount foregone, at a slight discount to the market price of the Company’s common stock on the date of election.
In December 2012, the Compensation Committee recommended, and the Board approved, the payment of the 2012 bonuses in two portions, in accordance with past company policy; 50% in December 2012 with the remainder in the first quarter of 2013 following finalization of the financial statements for 2012. The authorized payouts were related to the officers’ achievements and ranged from 70% to 100% of target. The target was based on EBITDA of $50 million, adjusted for unusual events. Except for Mr. Romanella who agreed to defer 100% of his bonus until finalization of the financial statements, one-half of the bonuses were paid in December 2012; the remaining one-half were to be paid upon finalization of the financial statements for 2012. On the basis of the Compensation Committee’s recommendation, in December 2012, the Board determined that beginning in 2013, future bonuses for each year would all be payable in the first quarter of the following year following finalization of the financial statements for the year for which the bonus is being paid.
Long Term Incentive (LTI) — Under the LTI, each Participant shall receive an annual target grant of RSUs, valued as a percentage of the Participant’s base salary, that consist 50% of time-vested RSUs that vest in equal annual installments on the first four anniversaries of the date of grant, and 50% of performance-vested RSUs that vest at the end of a three-year period following the date of grant, based upon the achievement of annual performance conditions established by the Committee in advance of each year during the grant period. The number of performance-vested RSUs ultimately earned will vary based on achievement with respect to the established performance targets, as measured at the end of the three-year period. In this regard, if achievement of the target goal is at less than 90%, no performance-based RSUs will be earned. If achievement is between 90% and 100% of target, then the number of RSUs earned will be prorated from 50% (at 90% achievement) to 100% (at 100% achievement) of the initial grant. If achievement is over 100% of target, then the number of RSUs earned will be increased commensurate with the percentage of achievement over target, with a maximum award of 150% of the initial grant.
In 2012, the Compensation Committee recommended and the Board approved a performance target tied to the annual EBITDA amount referenced in the Company’s budget approved by the Board with achievement of such targets to be measured on an annual basis within the three-year period of each grant. For 2012, the performance target was an EBITDA amount of $50 million. The Board retained discretion to exclude from the determination of the achievement of EBITDA the impact of unanticipated events not reflected in the approved budget. In December 2012, the Compensation Committee recommended and the board approved, time-based and performance-based RSU grants on January 2, 2013 to the executive officers ranging in target value from $50,000 to $400,000 (CEO). 50% of the award consists of time-based RSUs that vest 25% on each of the first, second, third and fourth anniversaries of the grant date. The remaining 50% are performance-based shares that, as described above, are based on an annual performance target tied to the achievement of the EBITDA amount referenced in the approved budget.
Retirement and Other Benefits
The Company’s 401(k) Plan is offered as a means to save for the future while deferring current tax liability. Our executives may participate in the plan but, in general, their contributions are limited under current rules affecting highly compensated employees. The basics of the plan are (i) employee can contribute up to 90% of his/her annual salary or the specific maximum which is determined annually by the IRS, (ii) eligible Employees over the age of 50 who meet certain IRS requirements may also contribute an additional amount to the plan as a “catch-up” contribution, (iii) enrollment in the plan is accepted quarterly, (iv) the plan currently has an employer match and (v) the plan is subject to change at any time at the sole discretion of the Company. The plan did not have an employer match during 2012.
The Company also allows certain executives and directors to participate in a deferred compensation program. The Deferred Compensation program was approved for participation in January 2011. The object of the program was to create a long-term, pre-tax incentive program to augment the 401(k) plan, but have a company contribution and vesting period to retain key executives. General plan terms are as follows (i) 3% maximum company match on 6% executive pre-tax contributions, (ii) Board of Directors discretionary match of an additional 10% of base salary maximum, (iii) employee discretionary contributions pre-tax up to 80% of base salary and 100% bonus compensation, (iv) distribution schedule to be defined each year subject to vesting restrictions and (v) three year vesting for Company contributions of each plan year. In connection with the Deferred Compensation program, in January 2011, the Company entered into a Rabbi Trust Agreement for the benefit of the participants for certain events.
Other 2012 Compensation
In early 2012, the Company entered into retention agreements with Messrs. Lejman, Yannantuono, McClelland, Perkins and Snell and Ms. Downey pursuant to which they were entitled to receive cash payments of $350,000, $350,000, $100,000, $100,000, $100,000 and $300,000, respectively, payable upon the earlier of (a) January 11, 2013 and (b) the date that was sixty (60) days after the date on which a permanent Chief Executive Officer was hired by the Company. The recipients received these payments in October 2012, except for Ms. Downey who received the payment in September 2012.
Outstanding Equity Awards at Fiscal Year-End
The following table presents information about outstanding equity awards held by each of the named executive officers as of December 31, 2012:
|
| Option Awards |
| Stock Awards |
| ||||||||||||||||
|
| Number of Securities |
| Option |
| Option |
| Number of |
| Market |
| Equity |
| Equity |
| ||||||
Name |
| Exercisable |
| Unexercisable |
| Price(1) |
| Date(1) |
| Vested(2) |
| Vested |
| Vested(3) |
| Vested |
| ||||
|
|
|
|
|
|
|
|
|
|
|
|
|
|
|
|
|
| ||||
Rocco Romanella |
| — |
| — |
| $ | — |
| — |
| 192,307 |
| $ | 696,151 |
| $ | — |
| $ | — |
|
Ronald J. Lejman |
| 4,286 |
| — |
| 9.42 |
| 10/1/08 |
| 55,725 |
| 201,725 |
| 15,362 |
| 55,610 |
| ||||
Daniel Yannantuono |
| 726 |
| — |
| 140.00 |
| 9/26/17 |
| 66,439 |
| 240,509 |
| 15,362 |
| 55,610 |
| ||||
|
| 5,239 |
| — |
| 9.42 |
| 9/27/17 |
| — |
| — |
| — |
| — |
| ||||
|
| 1,165 |
| — |
| 9.42 |
| 6/1/18 |
| — |
| — |
| — |
| — |
| ||||
|
| 108 |
| — |
| 9.42 |
| 11/15/19 |
| — |
| — |
| — |
| — |
| ||||
C. Scott Hisey |
| 3,907 |
| — |
| 140.00 |
| 9/26/17 |
| — |
| — |
| — |
| — |
| ||||
Kevin McClelland |
| 322 |
| — |
| 9.42 |
| 1/1/19 |
| 13,811 |
| 49,996 |
| 4,048 |
| 14,654 |
| ||||
|
| 215 |
| — |
| 9.42 |
| 11/15/19 |
| — |
| — |
| — |
| — |
| ||||
Kyle M. Hall |
| — |
| — |
| — |
| — |
| 15,640 |
| 56,617 |
| 6,034 |
| 21,843 |
| ||||
Elizabeth Downey |
| 90 |
| — |
| 140.00 |
| 9/26/17 |
| — |
| — |
| — |
| — |
| ||||
Norman Snell |
| 5,239 |
| — |
| 9.42 |
| 1/13/13 |
| — |
| — |
| — |
| — |
| ||||
|
| 363 |
| — |
| 140.00 |
| 9/26/17 |
| — |
| — |
| — |
| — |
| ||||
(1) Includes warrants at an exercise price of $140.00 per share and options at an exercise price of $9.42 per share.
(2) Consists of the following time-vested shares of units of stock that have not vested:
Name |
| RSUs |
| RSUs |
| Restricted |
| Total |
|
|
|
|
|
|
|
|
|
|
|
Rocco Romanella |
| — |
| — |
| 192,307 |
| 192,307 |
|
Ronald J. Lejman |
| 25,000 |
| 30,725 |
| — |
| 55,725 |
|
Daniel Yannantuono |
| 35,714 |
| 30,725 |
| — |
| 66,439 |
|
Kevin McClelland |
| 5,714 |
| 8,097 |
| — |
| 13,811 |
|
Kyle M. Hall |
| 3,572 |
| 12,068 |
| — |
| 15,640 |
|
The outstanding RSUs that were granted on January 10, 2011 will vest 50% each on July 1, 2013 and July 1, 2014. The outstanding RSUs that were granted on April 3, 2012 will vest 25% on April 3, 2013 and each of the three anniversaries following April 3, 2013. The outstanding restricted shares that were granted on July 16, 2012 will vest 25% each on January 16, 2013, July 16, 2013, January 16, 2014 and July 16, 2014.
(3) Consists of performance-vested RSUs granted on April 3, 2012 that become vested at the end of a three-year performance period following the date of grant, based upon the achievement of performance targets as more fully described in the “Senior Executive Compensation- Long Term Incentive” section above. The value of these RSUs is shown assuming threshold achievement of performance targets.
Employment Agreements
Rocco Romanella
On July 16, 2012, Mr. Romanella entered into an agreement to become the Chief Executive Officer of the Company (the “Agreement”). The term of the Agreement is one year with an automatic renewal on a year-to-year basis unless one party gives the other party written notice of intent not to renew the Agreement at least sixty days before the expiration of the then term.
Under the Agreement, Mr. Romanella receives an annual base salary of $400,000, which was prorated for the remainder of 2012. He is eligible to receive annual incentive compensation of up to one times his base salary, provided that for 2012, he is eligible to receive a target bonus of two times the pro-rated portion of his base salary payable for service in 2012, to be earned based on the achievement of certain financial and operational targets as determined by the Board of Directors of the Company and its Compensation Committee. Any such Bonus earned shall be paid by the Company to Mr. Romanella in accordance with the terms of the applicable incentive bonus program. Beginning in 2013, Mr. Romanella was eligible to participate in long-term cash and equity incentive programs established by the Company for its senior level executives generally, at levels determined by the Board, with target long-term incentive compensation equal to one times his base salary. Mr. Romanella also received a one-time signing bonus of $100,000, a relocation allowance of up to $25,000 and an automobile allowance equal to $1,000 per month.
In addition, Mr. Romanella was granted 192,307 restricted shares of the common stock of the Company, which are subject to service-based vesting in four equal annual installments on the dates that are 6, 12, 18 and 24 months following the grant date, subject to automatic acceleration upon the occurrence of a Change of Control as defined in the Company’s 2009 Omnibus Equity and Incentive Compensation Plan.
In the event Mr. Romanella is terminated without Cause (as defined in the Agreement) or terminates his employment for Good Reason (as defined in the Agreement), Mr. Romanella shall be entitled to a severance amount equal to one times his Base Salary (at the rate then in effect) plus one times his Bonus for the calendar year prior to the calendar year in which his termination occurs.
R. Christopher Perkins
On September 27, 2007, R. Christopher Perkins entered into an Employment Agreement with the Company (the “Perkins Agreement”). The Perkins Agreement provides that Mr. Perkins shall receive an initial base salary of $150,000 and an incentive target of $50,000 per calendar year conditioned upon the achievement of annual operational and financial milestones. The Perkins Agreement may be terminated at any time; however if (i) Mr. Perkins is terminated without Cause (as defined in the Perkins Agreement) or Mr. Perkins terminates his employment for Good Reason (as defined in the Perkins Agreement), Mr. Perkins shall be entitled to a severance amount equal to one times his Base Salary (at the rate then in effect) plus a bonus consistent with such operational and financial milestones are being achieved at the time of termination.
Daniel Yannantuono
On December 1, 2010, Mr. Yannantuono entered into an Amended and Restated Employment Agreement with the Company (the “Yannantuono Agreement”). The Yannantuono Agreement provides that Mr. Yannantuono shall receive an initial base salary of $350,000 and an incentive target bonus of $350,000 per calendar year of which (A) 50% shall be conditioned upon the achievement of annual budget that is (i) developed by the Company and Mr. Yannantuono and (ii) approved by the Board or an appropriate committee thereof and (B) 50% based on discretion of the Board or such committee thereof. The term of the Yannantuono Agreement is for 3 years with an automatic renewal on a year-to-year basis. If (i) Mr. Yannantuono is terminated without Cause (as defined in the Yannantuono Agreement); Mr. Yannantuono terminates his employment for Good Reason (as defined in the Yannantuono Agreement); or (iii) the Yannantuono Agreement is not renewed by the Company, Mr. Yannantuono shall be entitled to a severance amount equal to one times his Base Salary (at the rate then in effect) plus a bonus consistent with such operational and financial milestones are being achieved at the time of termination. In addition, any outstanding equity awards will vest.
ITEM 12. SECURITY OWNERSHIP OF CERTAIN BENEFICIAL OWNERS AND MANAGEMENT AND RELATED STOCKHOLDER MATTERS
The following table sets forth certain information regarding beneficial ownership of the Company’s common stock as of July 30, 2013, unless otherwise noted, by (i) each person who is known to the Company to beneficially own more than five percent of the Company’s common stock, (ii) each of the Company’s current directors, (iii) each of the named executive officers in the Summary Compensation Table, and (iv) the named executive officers, current executive officers and directors as a group.
Name and Address of |
| Amount and Nature of |
| Percent of |
|
|
|
|
|
|
|
UniTek Interposed LP c/o HMK GP LP 200 Crescent Court, Suite 1600 Dallas, Texas 75201 |
| 4,686,196 | (4) | 24.71 | % |
John Randall Waterford 140 Broadway, 46th Floor New York, NY 10005 |
| 1,155,860 | (5) | 6.09 | % |
Eubel Brady & Suttman Asset Management, Inc. 7777 Washington Village Dr. Suite 210 Dayton, Ohio 45459 |
| 982,707 | (6) | 5.18 | % |
Michael F. O’Donnell, Director and Chairman of the Board |
| 70,971 | (7) | * |
|
Mark S. Dailey, Director |
| 31,420 | (8) | * |
|
Daniel Hopkin, Director |
| 26,491 | (9) | * |
|
Dean MacDonald, Director |
| 88,926 | (10) | * |
|
Michael Montelongo, Director |
| 27,237 | (11) | * |
|
Robert W. Sperry, Director |
| 4,704,830 | (12) | 24.81 | % |
Robert F. Stott, Director |
| 24,059 | (13) | * |
|
Rocco Romanella, Chief Executive Officer and Director |
| 96,154 |
| * |
|
Ronald J. Lejman, Former Chief Financial Officer |
| 61,161 | (14) | * |
|
Daniel Yannantuono, President of DirectSat USA |
| 69,979 | (15) | * |
|
C. Scott Hisey, Former Chief Executive Officer and Former Director |
| 170,471 | (16) | * |
|
Kevin McClelland, Former Chief Accounting Officer and Corporate Controller |
| 8,333 | (17) | * |
|
Kyle M. Hall, Former General Counsel and Secretary |
| 38,917 |
| * |
|
Elizabeth Downey, Former Chief Administrative Officer |
| 65,623 | (18) | * |
|
Norman Snell, Former Chief Information Officer |
| 363 | (19) | * |
|
All directors and executive officers as a group (24 persons) |
| 5,524,824 | (20) | 29.1 | % |
* Represents less than one percent of class
(1) Unless otherwise indicated, the address for each beneficial owner is c/o Unitek Global Services, Inc., 1777 Sentry Parkway West, Gwynedd Hall, Suite 302, Blue Bell, Pennsylvania 19422.
(2) Does not include shares beneficially owned by person who are former directors of the Company as no former director owns more than five percent of the Company’s common stock.
(3) Based on information furnished to the Company by the respective shareholders, or contained in filings made with the Securities and Exchange Commission (“SEC”). For purposes of this table, if a person has or shares voting or investment power with respect to any shares of common stock, they are considered beneficially owned by that person under rules of the SEC. Except as otherwise indicated, the persons named in the table have sole voting and investment power with respect to all shares that they beneficially own, subject to community property laws where applicable. The table also includes shares of common stock that are the subject of warrants and stock options granted to certain officers and directors of the Company to the extent presently exercisable or exercisable within sixty days of July 30, 2013. The shares underlying the warrants and stock options are deemed outstanding for the purposes of computing the beneficial ownership of each named executive officer and director individually and all directors and executive officers as a group. The table does not include unvested or vested awards of restricted stock units (“RSUs”) for which shares will not be issued within sixty days of July 30, 2013, since holders of unvested and vested RSUs do not have any voting rights or investment power until shares are issued. The amounts and percentages are based on 18,965,330 shares of common stock issued and outstanding as of July 30, 2013.
(4) This information is based on information contained in Schedule 13D/A filed with the Securities and Exchange Commission on March 4, 2013 by Unitek Interposed LP; HMK GP LP; HMK GP LLC; Sector Performance Fund, LP; HM Unitek Coinvest LP; SPF SBS LP; Sector Performance GP, LP; and Sector Performance LLC. UniTek Interposed LP (“Interposed”) is the direct holder of 4,686,196 shares of Common Stock. HMK LP is the sole general partner and a limited partner of Interposed, and HMK LLC is the sole general partner of HMK LP. As a result of these relationships, HMK LP or HMK LLC may be deemed to be indirect beneficial owners of 4,686,196 shares of Common Stock held by Interposed. Andrew S. Rosen, Robert W. Sperry (a director), Sarah A. Bradley and John Muse are members of a four-person investment committee at HMK LLC that exercises, on behalf of HMK LLC, voting and dispositive powers over the securities held by UniTek Interposed. No single member of the investment committee has dispositive and/or voting power over the shares held by UniTek Interposed. As a result of the foregoing, each of Messrs. Rosen, Sperry and Muse and Ms. Bradley may be deemed to beneficially own all or a portion of the shares of Common Stock beneficially owned by UniTek Interposed described above. Each of Messrs. Rosen, Sperry and Muse and Ms. Bradley disclaims the existence of a group and disclaims beneficial ownership of shares of Common Stock not owned of record by him or her, except to the extent of any pecuniary interest therein.
(5) This information is based on information contained in Schedule 13G filed with the SEC on June 27, 2013 by John Randall Waterford. Mr. Waterford is a registered investment adviser.
(6) This information is based on information contained in Schedule 13G/A filed with the SEC on February 14, 2013 by Eubel Brady & Suttman Asset Management, Inc. (“EBS”); Ronald L. Eubel, Mark E. Brady, Robert J. Suttman II, William E. Hazel Kenneth E. Leist, Paul D. Crichton, Scott E/ Lundy, and Aaron Hillman (the “Eubel Reporting Persons”). The Eubel Reporting Persons are registered investment advisers. The Eubel Reporting Persons may, as a result of their ownership in and positions with EBS and other affiliated entities, be deemed to be indirect beneficial owners of 981,627 shares of Common Stock held by EBS and that affiliated entity. Kenneth E. Leist, Paul D. Crichton, Scott E. Lundy or Aaron Hillman may, as a result of their ownership in and positions with EBS, be deemed to be indirect beneficial owners of 939,658 shares of Common Stock. Mr. Eubel is the beneficial owner of an additional 1,080 shares of Common Stock. Mr. Suttman II is the beneficial owner of an additional 92 shares of Common Stock.
(7) Does not include 15,504 vested RSUs for Mr. O’Donnell. RSUs issued to directors in connection with their service on the Board vest quarterly but shares of Common Stock are not issued until within 30 days of December 31, 2013.
(8) Includes 893 vested options to purchase shares of Common Stock. Does not include 7,752 vested RSUs for Mr. Dailey. RSUs issued to directors in connection with their service on the Board vest quarterly but shares of Common Stock are not issued until within 30 days of December 31, 2013.
(9) Does not include 7,752 vested RSUs for Mr. Hopkin. RSUs issued to directors in connection with their service on the Board vest quarterly but shares of Common Stock are not issued until within 30 days of December 31, 2013.
(10) Includes 536 vested options to purchases shares of Common Stock. Does not include 7,752 vested RSUs for Mr. MacDonald. RSUs issued to directors in connection with their service on the Board vest quarterly but shares of Common Stock are not issued until within 30 days of December 31, 2013. Mr. MacDonald is the indirect beneficial owner of 45,000 aggregate shares of Common Stock held by Paddle Resources LP, of which Mr. MacDonald is a general partner.
(11) Does not include 7,752 vested RSUs for Mr. Montelongo. RSUs issued to directors in connection with their service on the Board vest quarterly but shares of Common Stock are not issued until within 30 days of December 31, 2013.
(12) Does not include 7,752 vested RSUs for Mr. Sperry. RSUs issued to directors in connection with their service on the Board vest quarterly but shares of Common Stock are not issued until within 30 days of December 31, 2013. See Footnote (4) above regarding beneficial ownership of shares of Common Stock held by Unitek Interposed LP.
(13) Does not include 7,752 vested RSUs for Mr. Stott. RSUs issued to directors in connection with their service on the Board vest quarterly but shares of Common Stock are not issued until within 30 days of December 31, 2013.
(14) Mr. Lejman was terminated on April 12, 2013.
(15) Includes 6,512 vested options and 726 vested warrants to purchase shares of Common Stock for Mr. Yannantuono.
(16) Includes 3,907 vested warrants to purchase shares of Common Stock for Mr. Hisey. Mr. Hisey resigned effective November 30, 2012.
(17) Mr. McClelland was terminated April 12, 2013.
(18) Includes 90 vested warrants to purchases shares of Common Stock for Ms. Downey. Ms. Downey resigned effective September 7, 2012.
(19) Consists of 363 vested warrants to purchase shares of Common Stock for Mr. Snell. Mr. Snell resigned effective November 14, 2012.
(20) Includes shares beneficially owned by all directors and named executive officers providing service to the Company at December 31, 2012 and all the directors and executive officers providing service to the Company at July 30, 2013 as a group. The directors and executive officers included in this group are Michael F. O’Donnell, Mark S. Dailey, Daniel Hopkin, Dean MacDonald, Michael Montelongo, Robert W. Sperry, Robert F. Stott, Rocco Romanella, Ronald Lejman, Daniel Yannantuono, C. Scott Hisey, Kevin McClelland, Kyle Hall, Elizabeth Downey, Norman Snell, Andrew Herning, Donald W. Gately, Stanley G. Jones, Glorminda McAllister, Kathleen McCarthy, R. Christopher Perkins, Shannon D. Schell, James Brennan and Carole Dalton Slover.
ITEM 13. CERTAIN RELATIONSHIPS AND RELATED TRANSACTIONS, AND DIRECTOR INDEPENDENCE
Related Party Transactions
The Company adheres to policies and procedures for the review, approval, and ratification of related-party transactions to ensure that any such transactions are fair, reasonable and in the Company’s best interest. All significant relationships and transactions are separately identified by management if they meet the definition of a related party or a related-party transaction. Related-party transactions include transactions that have occurred or are currently proposed in which the Company was or will be a participant and in which any related person had or will have a direct or indirect material interest. All related-party transactions are reviewed, approved and documented by the appropriate level of the Company’s management and Board of Directors in accordance with these policies and procedures.
At the current time, there are no relationships or related transactions to report under Item 404 of Regulation S-K.
Director Independence
The Board has conducted a review of the independence of the directors under the standards for independence established by the NASDAQ Stock Market LLC. During this review, the Board considered any transactions and relationships between a director or member of that director’s immediate family and the Company and its subsidiaries and affiliates. The Board also examined any transactions and relationships between directors or their affiliates and members of the Company’s senior management or their affiliates. The purpose of this review was to determine whether any such relationships or transactions were inconsistent with a determination that the director is independent. The Board, in applying the above-referenced standards, has affirmatively determined that the Company’s current independent directors are Messrs. Sperry, Dailey, Hopkin, MacDonald, Montelongo, O’Donnell and Stott.
As to the individuals, it was determined that they did not fail any of the tests set forth in Rule 4200(a)(15) of the NASDAQ Stock Market, Inc. and that none of the aforementioned transactions represented a material relationship.
ITEM 14. PRINCIPAL ACCOUNTANT FEES AND SERVICES
Fees paid to the Independent Registered Public Accounting Firm
During the years ended December 31, 2012 and December 31, 2011, professional services were performed for the Company by Ernst & Young, LLP (“EY”), the Company’s independent registered public accounting firm. Set forth below is information relating to the aggregate fees billed by EY for professional services rendered for each year. All fees and services were pre-approved by the Audit Committee in accordance with the Audit Committee’s pre-approval policy.
Audit Fees — The aggregate fees billed, or to be billed, for EY’s audit of the Company’s consolidated annual financial statements and services that are normally provided by the independent registered public accounting firm in connection with statutory and regulatory filings or engagements were approximately $3.5 million for fiscal year 2012 and $1.0 million for fiscal year 2011. Included in the amount for fiscal year 2012 are fees related to the audit of the Company’s restated consolidated financial statements.
Audit-Related Fees — During fiscal years 2012 and 2011, EY billed the Company $43,000 and $236,000, respectively, for audit related services, primarily related to acquisition due diligence services.
Tax Fees — EY did not perform any professional services for the Company during 2012 or 2011 relating to tax compliance, tax advice and tax planning.
All Other Fees — EY did not provide other services not included above during 2012 or 2011.
Pre-approval Policy for Services by Independent Registered Accounting Firm
All audit, audit-related and non-audit services were pre-approved by the Audit Committee, which concluded that the provision of such services by Ernst & Young LLP was compatible with the maintenance of that firm’s independence in the conduct of its auditing functions. The Audit and Non-Audit Services Pre-Approval Policy provides for (i) general pre-approval of certain specified services and (ii) specific pre-approval of all other permitted services, as well as proposed services exceeding pre-approved cost levels. The policy authorizes the Audit Committee to delegate pre-approval authority with respect to permitted services to one or more of its members.
For both types of pre-approval, the Audit Committee will consider whether such services are consistent with the SEC’s rules on auditor independence. The Audit Committee will also consider whether the independent registered public accounting firm is best positioned to provide the most effective and efficient service, for reasons such as its familiarity with the Company’s business, people, culture, accounting systems, risk profile and other factors, and whether the service might enhance the Company’s ability to manage or control risk or improve audit quality. All such factors will be considered as a whole, and no one factor is necessarily determinative.
ITEM 15. EXHIBITS AND FINANCIAL STATEMENT SCHEDULES
(a) The following documents are filed as part of this report:
(1) Financial Statements:
· Report of Independent Registered Public Accounting Firm
· Consolidated Balance Sheets as of December 31, 2012 and 2011
· Consolidated Statements of Comprehensive Income or Loss for the years ended December 31, 2012, 2011 and 2010
· Consolidated Statements of Changes in Stockholders’ Equity for the years ended December 31, 2012, 2011 and 2010
· Consolidated Statements of Cash Flows for the years ended December 31, 2012, 2011 and 2010
· Notes to Consolidated Financial Statements
(2) Financial Schedules
All financial schedules are not applicable and therefore have been omitted.
(b) Exhibits
|
| 2.1 |
| Asset Purchase Agreement, dated as of March 30, 2011, among the Company, Pinnacle Wireless, Inc., Current Flow Technologies Corporation, Michael Hayford, Timothy Walters, Christopher Love, Michael Rubenstein and Manny Medina. (Incorporated herein by reference from Company’s Current Report on Form 8-K filed on April 21, 2011.) |
|
|
|
|
|
|
| 2.2 |
| Asset Purchase Agreement, dated as of September 14, 2012, among the Company, DirectSat USA, LLC, Skylink LTD and Mr. John Larbus. (Incorporated herein by reference from Company’s Current Report on Form 8-K filed on September 14, 2012.) |
|
|
|
|
|
|
| 2.3 |
| Asset Purchase Agreement, dated as of December 28, 2012, by and between the Company, Advanced Communications USA, Inc., Nex-Link USA Communications, Inc. and Unitek Canada, Inc., and NX Utilities, LLC and the Members (as defined therein). (Incorporated herein by reference from Company’s Current Report on Form 8-K filed on January 4, 2013.) |
+ |
| 3.1 |
| Amended and Restated Certificate of Incorporation of the Company, as amended to date hereof. |
|
|
|
|
|
|
| 3.2 |
| Certificate of Designation for the Berliner Series A Preferred Stock of Berliner Communications, Inc. (Incorporated herein by reference from Company’s Current Report on Form 8-K filed on January 27, 2010.) |
|
|
|
|
|
|
| 3.3 |
| Certificate of Designation for the Berliner Series B Preferred Stock of Berliner Communications, Inc. (Incorporated herein by reference from Company’s Current Report on Form 8-K filed on January 27, 2010.) |
|
|
|
|
|
|
| 3.4 |
| Amended and Restated Bylaws of Berliner Communications, Inc. (Incorporated herein by reference from Company’s Current Report on Form 8-K filed on January 27, 2010.) |
|
|
|
|
|
|
| 4.1 |
| Registration Rights Agreement, dated as of January 27, 2010, by and between Berliner Communications, Inc. and those holders of capital stock of Berliner listed on Exhibit A thereto. (Incorporated herein by reference from Company’s Current Report on Form 8-K filed on January 27, 2010.) |
|
|
|
|
|
|
| 4.2 |
| Form of Substitute Option. (Incorporated herein by reference from Company’s Current Report on Form 8-K filed on January 27, 2010.) |
|
|
|
|
|
|
| 4.3 |
| Form of Substitute Warrant. (Incorporated herein by reference from Company’s Current Report on Form 8-K filed on January 27, 2010.) |
|
|
|
|
|
|
| 4.4 |
| Form of Warrant. (Incorporated herein by reference from Company’s Current Report on Form 8-K filed on July 22, 2010.) |
|
|
|
|
|
|
| 4.5 |
| Amendment No. 1 to Registration Rights Agreement, dated as of July 16, 2010. (Incorporated herein by reference from Company’s Current Report on Form 8-K filed on July 22, 2010.) |
|
|
|
|
|
| # | 10.1 |
| Employment Agreement, dated as of July 16, 2012, between the Company and Rocco Romanella. (Incorporated herein by reference from Company’s Current Report on Form 8-K filed on July 16, 2012.) |
|
|
|
|
|
| # | 10.2 |
| Restricted Stock Agreement, dated as of July 16, 2012, between the Company and Rocco Romanella. (Incorporated herein by reference from Company’s Current Report on Form 8-K filed on July 16, 2012.) |
|
|
|
|
|
+ | # | 10.3 |
| Form of Restricted Stock Unit Award Agreement for the Berliner Communications, Inc. 2009 Omnibus Equity and Incentive Compensation Plan. |
|
|
|
|
|
| # | 10.4 |
| Employment Agreement, dated as of December 1, 2010, by and between Unitek USA, LLC and Ronald J. Lejman. (Incorporated herein by reference from the Company’s Annual Report on Form 10-K filed on March 30, 2011. |
|
|
|
|
|
+ | # | 10.5 |
| Employment Agreement, dated December 1, 2010, by and between, UniTek USA LLC, and Daniel Yannantuono. |
|
|
|
|
|
+ | # | 10.6 |
| Employment Agreement, dated as of September 27, 2007, by and between UniTek USA, LLC, and Ralph C. Perkins. |
| # | 10.7. |
| Employment Agreement, dated December 1, 2010, by and between Unitek USA LLC, and Elizabeth Downey. (Incorporated herein by reference from the Company’s Annual Report on form 10-K filed on March 30, 2011. |
|
|
|
|
|
| # | 10.8 |
| Employment Agreement, dated as of December 1, 2010, by and between Unitek USA, LLC and Peter Giacalone. (Incorporated herein by reference from the Company’s Annual Report on Form 10-K filed on March 30, 2011.) |
|
|
|
|
|
| # | 10.9 |
| Separation of Employment Agreement and General Release, dated as of January 10, 2012, between UniTek and Peter Giacalone. (Incorporated herein by reference from Company’s Current Report on Form 8-K filed on January 17, 2012.) |
|
|
|
|
|
| # | 10.10 |
| Employment Agreement, dated as of December 1, 2010, by and between Unitek USA, LLC and C. Scott Hisey. (Incorporated herein by reference from the Company’s Annual Report on Form 10-K filed on March 30, 2011.) |
|
|
|
|
|
| # | 10.11 |
| Separation of Employment Agreement and General Release, dated as of January 10, 2012, between the Company and C. Scott Hisey. (Incorporated herein by reference from Company’s Current Report on Form 8-K filed on January 17, 2012.) |
|
|
|
|
|
| # | 10.12 |
| Consulting Agreement, dated as of January 13, 2012, between the Company and C. Scott Hisey. (Incorporated herein by reference from Company’s Current Report on Form 8-K filed on January 17, 2012.) |
|
|
|
|
|
| # | 10.13 |
| Amendment and Agreement, dated as of November 30, 2012, between the Company and C. Scott Hisey. (Incorporated herein by reference from Company’s Current Report on Form 8-K filed on December 5, 2012.) |
|
|
|
|
|
| # | 10.14 |
| Senior Executive Compensation Plan dated April 3, 2012. (Incorporated herein by reference from the Company’s Current Report on Form 8-K filed on April 9, 2012). |
|
|
|
|
|
| # | 10.15 |
| Retention Agreement, dated January 11, 2012 by and between the Company and Ronald J. Lejman. (Incorporated herein by reference from the Company’s Quarterly Report on Form 10-Q filed on May 9, 2012.) |
|
|
|
|
|
| # | 10.16 |
| Retention Agreement, dated January 11, 2012 by and between the Company and Daniel Yannantuono. (Incorporated herein by reference from the Company’s Quarterly Report on Form 10-Q filed on May 9, 2012.) |
|
|
|
|
|
| # | 10.17 |
| Retention Agreement, dated January 11, 2012 by and between the Company and Elizabeth Downey. (Incorporated herein by reference from the Company’s Quarterly Report on Form 10-Q filed on May 9, 2012.) |
|
|
|
|
|
| # | 10.18 |
| Retention Agreement, dated January 11, 2012 by and between the Company and Norman Snell. (Incoporated herein by reference from the Company’s Quarterly Report on Form 10-Q filed on May 9, 2012).0. |
|
|
|
|
|
| # | 10.19 |
| Retention Agreement, dated January 15, 2012 by and between the Company and Christopher Perkins. (Incorporated herein by reference from the Company’s Quarterly Report on Form 10-Q filed on May 9, 2012.) |
|
|
|
|
|
| # | 10.20 |
| Retention Agreement, dated January 23, 2012 by and between the Company and Kevin McClelland. (Incorporated herein by reference from the Company’s Quarterly Report on Form 10-Q filed on May 9, 2012.) |
|
|
|
|
|
|
| 10.21 |
| Form of D&O Indemnification Agreement. (Incorporated herein by reference from Company’s Current Report on Form 8-K filed on January 27, 2010.) |
|
|
|
|
|
|
| 10.22 |
| Indemnification Priority Agreement, dated as of January 27, 2010, by and among HM Capital Partners LLC, Berliner Communications, Inc., BCI Communications, Inc., Unitek USA, LLC, Unitek Holdings, Inc., Unitek Midco, Inc. and Unitek Acquisition, Inc. (Incorporated herein by reference from Company’s Current Report on Form 8-K filed on January 27, 2010.) |
| # | 10.23 |
| Unitek Holdings, Inc. 2007 Equity Incentive Plan. (Incorporated herein by reference from Company’s Current Report on Form 8-K filed on January 27, 2010.) |
|
|
|
|
|
| # | 10.24 |
| Berliner Communications, Inc. 2009 Omnibus Equity and Incentive Compensation Plan. (Incorporated herein by reference from the Company’s Proxy Statement for its 2009 Annual Meeting of Stockholders filed on October 27, 2009.) |
|
|
|
|
|
| # | 10.25 |
| Form of UniTek Global Services Deferred Compensation Plan. (Incorporated herein by reference from the Company’s Annual Report on Form 10-K filed on March 30, 2011.) |
|
|
|
|
|
|
| 10.26 |
| Nominating Agreement, dated as of November 16, 2010, by and among the Company and those holders of capital stock of the Company listed on Exhibit A thereto. (Incorporated herein by reference from the Company’s Annual Report on Form 10-K filed on March 30, 2011). |
|
|
|
|
|
|
| 10.27 |
| Monitoring and Oversight Termination Agreement, dated as of November 16, 2010, by and among the Company, BCI Communications, Inc., UniTek USA LLC, UniTek Holdings, Inc., UniTek Midco, Inc. and UniTek Acquisition, Inc., and HM Capital Partners I, LP. (Incorporated herein by reference from the Company’s Annual Report on Form 10-K filed on March 30, 2011). |
|
|
|
|
|
|
| 10.28 |
| Earnout Confirmation Agreement, dated as of September 14, 2012, among the Company, DirectSat USA, LLC, Skylink LTD and Mr. John Larbus. (Incorporated herein by reference from Company’s Current Report on Form 8-K filed on September 14, 2012.) |
|
|
|
|
|
|
| 10.29 |
| Credit Agreement by and among the Company, the several banks and other financial institutions or entities from time to time parties thereto, and FBR Capital Markets LT, Inc., dated as of April 15, 2011. (Incorporated herein by reference from the Company’s Quarterly Report on Form 10-Q filed on August 16, 2011.) |
|
|
|
|
|
|
| 10.30 |
| Term Loan Amendment, dated as of September 14, 2012, among the Company, the lending and other financial institutions from time to time party thereto and FBR Capital Markets LT, Inc. (Incorporated herein by reference from Company’s Current Report on Form 8-K filed on September 14, 2012.) |
|
|
|
|
|
|
| 10.31 |
| Revolving Credit and Security Agreement, by and among the Company (and certain subsidiaries of UniTek) and PNC Bank, National Association, dated as of April 15, 2011. (Incorporated herein by reference from the Company’s Quarterly Report on Form 10-Q filed on August 16, 2011.) |
|
|
|
|
|
|
| 10.32 |
| Revolver Amendment, dated as of September 13, 2012, among the Company, UniTek Acquisition, Inc., NexLink Global Services, Inc., UniTek USA, LLC, Advanced Communications USA, Inc., DirectSat USA, LLC, FTS USA, LLC, the financial institutions party to the Loan Agreement and PNC Bank, National Association. (Incorporated herein by reference from Company’s Current Report on Form 8-K filed on September 14, 2012.) |
|
|
|
|
|
|
| 10.33 |
| Forbearance Agreement, dated as of April 30, 2013, among the Company, the several banks and other financial institutions or entities from time to time parties thereto and FBR Capital Markets LT, Inc. (Incorporated herein by reference from Company’s Current Report on Form 8-K filed on May 3, 2013.) |
|
|
|
|
|
|
| 10.34 |
| Forbearance Agreement, dated as of April 30, 2013, among the Company, the several banks and other financial institutions or entities from time to time parties thereto and PNC Bank, National Association. (Incorporated herein by reference from Company’s Current Report on Form 8-K filed on May 3, 2013.) |
|
| 10.35 |
| Amendment to Forbearance Agreement, dated as of June 3, 2013, among the Company, the several banks and financial institutions signatory thereto and FBR Capital Markets LT, Inc. (Incorporated herein by reference from Company’s Current Report on Form 8-K filed on June 5, 2013.) |
|
|
|
|
|
|
| 10.36 |
| Amendment to Forbearance Agreement, dated as of June 5, 2013, among the Company, the several banks and other financial institutions or entities from time to time parties thereto and PNC Bank, National Association. (Incorporated herein by reference from Company’s Current Report on Form 8-K filed on June 5, 2013.) |
|
|
|
|
|
|
| 10.37 |
| Forbearance Agreement, dated as of June 7, 2013, among the Company, the several banks and other financial institutions or entities from time to time parties thereto and FBR Capital Markets LT, Inc. (Incorporated herein by reference from Company’s Current Report on Form 8-K filed on June 14, 2013.) |
|
|
|
|
|
|
| 10.38 |
| Amendment to Forbearance Agreement, dated as of June 13, 2013, among the Company, the several banks and other financial institutions or entities from time to time parties thereto and PNC Bank, National Association. (Incorporated herein by reference from Company’s Current Report on Form 8-K filed on June 14, 2013.) |
|
|
|
|
|
@ | + | 10.39 |
| Revolving Credit and Security Agreement, dated as of July 10, 2013, by and among the Company, certain subsidiaries thereof and Apollo Investment Corporation. |
|
|
|
|
|
|
| 10.40 |
| Forbearance Agreement, dated as of July 17, 2013, among the Company, the Subsidiary Guarantors signatory thereto, the several banks and financial institutions signatory thereto as Lenders and Cerberus Business Finance, LLC. (Incorporated herein by reference from Company’s Current Report on Form 8-K filed on July 18, 2013.) |
|
|
|
|
|
|
| 10.41 |
| Second Amendment and Limited Waiver to Credit Agreement, dated as of July 25, 2013, by and among the Company, the lenders party thereto, Cerberus Business Finance, LLC, and the Credit Support Parties (as defined therein). (Incorporated herein by reference from Company’s Current Report on Form 8-K filed on July 31, 2013.) |
|
|
|
|
|
|
| 10.42 |
| Form of Warrant. (Incorporated herein by reference from Company’s Current Report on Form 8-K filed on July 31, 2013.) (See schedule included in such exhibit for a list of recipients of warrants and the respective numbers of shares underlying the warrants issued to each recipient.) |
|
|
|
|
|
|
| 10.43 |
| Form of Registration Rights Agreement. (Incorporated herein by reference from Company’s Current Report on Form 8-K filed on July 31, 2013.) (See schedule included in such exhibit for a list of parties to such registration rights agreements.) |
|
|
|
|
|
|
| 10.44 |
| Amendment and Limited Waiver to Revolving Credit and Security Agreement and Fee Letter, dated as of July 25, 2013, by and among the Company, Unitek Acquisition, Inc., Pinnacle Wireless USA, Inc., Unitek USA, LLC, Advanced Communications USA, Inc., DirectSat USA, LLC, FTS USA, LLC, the Lenders party thereto and Apollo Investment Corporation. (Incorporated herein by reference from Company’s Current Report on Form 8-K filed on July 31, 2013.) |
@ | + | 10.45 |
| Home Services Provider Agreement, entered into as of October 15, 2012, between DIRECTV, LLC and DirectSat USA, LLC. |
|
|
|
|
|
@ | + | 10.46 |
| First Amendment to Home Services Provider Agreement, entered into as of January 1, 2013, between DIRECTV, LLC and DirectSat USA, LLC. |
|
|
|
|
|
+ |
| 21 |
| Subsidiaries of the Company |
|
|
|
|
|
+ |
| 23.1 |
| Consent of Ernst & Young LLP, independent registered public accounting firm |
|
|
|
|
|
+ |
| 31.1 |
| Certification of the Chief Executive Officer of UniTek Global Services, Inc. required by Rule 13a-14(a) under the Securities Exchange Act of 1934, as amended. |
|
|
|
|
|
+ |
| 31.2 |
| Certification of the Chief Financial Officer of UniTek Global Services, Inc. required by Rule 13a-14(a) under the Securities Exchange Act of 1934, as amended. |
|
|
|
|
|
|
| *32.1 |
| Certification of the Chief Executive Officer and Chief Financial Officer of UniTek Global Services, Inc. required by Rule 13a-14(b) under the Securities Exchange Act of 1934, as amended. |
|
|
|
|
|
|
| *101.INS |
| XBRL Instance Document |
|
|
|
|
|
|
| *101.SCH |
| XBRL Taxonomy Extension Schema |
|
|
|
|
|
|
| *101.CAL |
| XBRL Taxonomy Extension Calculation Linkbase |
|
|
|
|
|
|
| *101.LAB |
| XBRL Taxonomy Extension Label Linkbase |
|
|
|
|
|
|
| *101.PRE |
| XBRL Taxonomy Extension Presentation Linkbase |
|
|
|
|
|
|
| *101.DEF |
| XBRL Taxonomy Extension Definition Linkbase |
# |
|
|
| Management contract or compensatory plan or arrangement. |
|
|
|
|
|
+ |
|
|
| Filed herewith. |
|
|
|
|
|
* |
|
|
| Furnished herewith. |
|
|
|
|
|
@ |
|
|
| Certain information in this exhibit has been omitted and has been filed separately with the Securities and Exchange Commission pursuant to an application for confidential treatment. |
Pursuant to the requirements of Section 13 or 15(d) of the Securities Exchange Act of 1934, the registrant has duly caused this report to be signed on its behalf by the undersigned, thereunto duly authorized.
UNITEK GLOBAL SERVICES, INC.
Date: August 9, 2013 | By: | /s/ Rocco Romanella |
|
| Rocco Romanella |
|
| Chief Executive Officer |
|
| (Principal Executive Officer) |
|
|
|
Date: August 9, 2013 | By: | /s/ Andrew J. Herning |
|
| Andrew J. Herning |
|
| Chief Financial Officer |
|
| (Principal Financial Officer) |
|
|
|
Pursuant to the requirement of the Securities Exchange Act of 1934, this report has been signed below by the following persons on behalf of the registrant and in the capacities and on the dates indicated.
SIGNATURE |
| TITLE |
| DATE |
|
|
|
|
|
/s/ Michael O’Donnell |
| Director and Chairman of the Board |
| August 9, 2013 |
Michael O’Donnell |
|
|
|
|
|
|
|
|
|
/s/ Rocco Romanella |
| Chief Executive Officer and Director |
| August 9, 2013 |
Rocco Romanella |
| (Principal Executive Officer) |
|
|
|
|
|
|
|
/s/ Mark Dailey |
| Director |
| August 9, 2013 |
Mark Dailey |
|
|
|
|
|
|
|
|
|
/s/ Dan Hopkin |
| Director |
| August 9, 2013 |
Dan Hopkin |
|
|
|
|
|
|
|
|
|
/s/ Dean MacDonald |
| Director |
| August 9, 2013 |
Dean MacDonald |
|
|
|
|
|
|
|
|
|
/s/ Michael Montelongo |
| Director |
| August 9, 2013 |
Michael Montelongo |
|
|
|
|
|
|
|
|
|
/s/ Robert Sperry |
| Director |
| August 9, 2013 |
Robert Sperry |
|
|
|
|
|
|
|
|
|
/s/ Robert Stott |
| Director |
| August 9, 2013 |
Robert Stott |
|
|
|
|
|
|
|
|
|
/s/ Andrew J. Herning |
| Chief Financial Officer |
| August 9, 2013 |
Andrew J. Herning |
| (Principal Financial Officer) |
|
|
|
|
|
|
|
/s/ James Brennan |
| Corporate Controller |
| August 9, 2013 |
James Brennan |
|
|
|
|
|
|
|
|
|
UNITEK GLOBAL SERVICES, INC. AND SUBSIDIARIES
Index to Consolidated Financial Statements
F-2 | |
Consolidated Balance Sheets as of December 31, 2012 and 2011 | F-3 |
F-4 | |
F-5 | |
Consolidated Statements of Cash Flows for the years ended December 31, 2012, 2011 and 2010 | F-6 |
F-7 |
Report of Independent Registered Public Accounting Firm
The Board of Directors and Stockholders
UniTek Global Services, Inc.
We have audited the accompanying consolidated balance sheets of UniTek Global Services, Inc. and subsidiaries as of December 31, 2012 and 2011, and the related consolidated statements of comprehensive income or loss, changes in stockholders’ equity, and cash flows for each of the three years in the period ended December 31, 2012. These financial statements are the responsibility of the Company’s management. Our responsibility is to express an opinion on these financial statements based on our audits.
We conducted our audits in accordance with the standards of the Public Company Accounting Oversight Board (United States). Those standards require that we plan and perform the audit to obtain reasonable assurance about whether the financial statements are free of material misstatement. We were not engaged to perform an audit of the Company’s internal control over financial reporting. Our audits included consideration of internal control over financial reporting as a basis for designing audit procedures that are appropriate in the circumstances, but not for the purpose of expressing an opinion on the effectiveness of the Company’s internal control over financial reporting. Accordingly, we express no such opinion. An audit also includes examining, on a test basis, evidence supporting the amounts and disclosures in the financial statements, assessing the accounting principles used and significant estimates made by management, and evaluating the overall financial statement presentation. We believe that our audits provide a reasonable basis for our opinion.
In our opinion, the financial statements referred to above present fairly, in all material respects, the consolidated financial position of UniTek Global Services, Inc. and subsidiaries at December 31, 2012 and 2011, and the consolidated results of their operations and their cash flows for each of the three years in the period ended December 31, 2012, in conformity with U.S. generally accepted accounting principles.
As discussed in Note 2 to the consolidated financial statements, the accompanying consolidated financial statements as of and for the year ended December 31, 2011 have been restated to correct accounting errors related to recognition of revenues and cost of revenues and certain other identified errors.
/s/ Ernst & Young LLP
Philadelphia, Pennsylvania
August 9, 2013
UNITEK GLOBAL SERVICES, INC. AND SUBSIDIARIES
Consolidated Balance Sheets
(amounts in thousands, except share and per share amounts)
|
| December 31, |
| ||||
|
| 2012 |
| 2011 |
| ||
|
|
|
| (Restated) |
| ||
ASSETS |
|
|
|
|
| ||
CURRENT ASSETS |
|
|
|
|
| ||
Cash and cash equivalents |
| $ | 3,836 |
| $ | 533 |
|
Accounts receivable, net of allowances |
| 102,490 |
| 84,571 |
| ||
Inventories |
| 15,266 |
| 11,452 |
| ||
Prepaid expenses and other current assets |
| 7,560 |
| 4,532 |
| ||
Total current assets |
| 129,152 |
| 101,088 |
| ||
Property and equipment, net |
| 26,393 |
| 39,022 |
| ||
Amortizable intangible assets, net (includes amortizable customer relationships, net, of $38,090 and $29,783 at December 31, 2012 and 2011, respectively) |
| 42,013 |
| 34,418 |
| ||
Goodwill |
| 121,920 |
| 163,797 |
| ||
Deferred tax assets, net |
| 1,365 |
| 568 |
| ||
Other assets, net |
| 5,560 |
| 4,449 |
| ||
Total assets |
| $ | 326,403 |
| $ | 343,342 |
|
|
|
|
|
|
| ||
LIABILITIES AND STOCKHOLDERS’ EQUITY |
|
|
|
|
| ||
CURRENT LIABILITIES |
|
|
|
|
| ||
Accounts payable |
| $ | 48,845 |
| $ | 32,797 |
|
Accrued insurance |
| 16,248 |
| 13,659 |
| ||
Accrued compensation and benefits |
| 9,766 |
| 8,143 |
| ||
Current portion of contingent consideration |
| 1,935 |
| — |
| ||
Current portion of long-term debt |
| 3,450 |
| 16,663 |
| ||
Current portion of capital lease obligations |
| 7,688 |
| 9,631 |
| ||
Other current liabilities |
| 25,426 |
| 12,172 |
| ||
Total current liabilities |
| 113,358 |
| 93,065 |
| ||
Long-term debt, net of current portion |
| 153,014 |
| 95,554 |
| ||
Long-term capital lease obligations, net of current portion |
| 8,040 |
| 16,283 |
| ||
Contingent consideration, net of current portion |
| — |
| 14,852 |
| ||
Deferred tax liabilities |
| 706 |
| 5,511 |
| ||
Other liabilities |
| 2,982 |
| 2,415 |
| ||
Total liabilities |
| 278,100 |
| 227,680 |
| ||
|
|
|
|
|
| ||
Commitments and contingencies |
|
|
|
|
| ||
|
|
|
|
|
| ||
STOCKHOLDERS’ EQUITY |
|
|
|
|
| ||
Preferred Stock, $0.00002 par value (20 million shares authorized, no shares issued or outstanding) |
| — |
| — |
| ||
Common Stock, $0.00002 par value (200 million shares authorized, 18,736,278 and 16,305,369 shares issued and outstanding at December 31, 2012 and December 31, 2011, respectively) |
| — |
| — |
| ||
Additional paid-in capital |
| 260,077 |
| 249,745 |
| ||
Accumulated other comprehensive income |
| 57 |
| 18 |
| ||
Accumulated deficit |
| (211,831 | ) | (134,101 | ) | ||
Total stockholders’ equity |
| 48,303 |
| 115,662 |
| ||
Total liabilities and stockholders’ equity |
| $ | 326,403 |
| $ | 343,342 |
|
See accompanying notes
UNITEK GLOBAL SERVICES, INC. AND SUBSIDIARIES
Consolidated Statements of Comprehensive Income or Loss
(amounts in thousands, except per share amounts)
|
| Year Ended December 31, |
| |||||||
|
| 2012 |
| 2011 |
| 2010 |
| |||
|
|
|
| (Restated) |
|
|
| |||
|
|
|
|
|
|
|
| |||
Revenues |
| $ | 437,596 |
| $ | 351,456 |
| $ | 345,522 |
|
Cost of revenues |
| 356,794 |
| 279,978 |
| 284,244 |
| |||
Gross profit |
| 80,802 |
| 71,478 |
| 61,278 |
| |||
Selling, general and administrative expenses |
| 46,357 |
| 45,229 |
| 36,850 |
| |||
Expense (income) related to contingent consideration |
| 10,096 |
| (8,506 | ) | — |
| |||
Restructuring charges |
| 8,013 |
| — |
| 991 |
| |||
Impairment charges |
| 14,900 |
| — |
| — |
| |||
Depreciation and amortization |
| 26,469 |
| 24,291 |
| 25,193 |
| |||
Operating (loss) income |
| (25,033 | ) | 10,464 |
| (1,756 | ) | |||
Interest expense |
| 15,329 |
| 13,863 |
| 23,967 |
| |||
Loss on extinguishment of debt |
| — |
| 3,466 |
| 1,677 |
| |||
Other income, net |
| (1,244 | ) | (608 | ) | — |
| |||
Loss from continuing operations before income taxes |
| (39,118 | ) | (6,257 | ) | (27,400 | ) | |||
Income tax expense |
| 353 |
| 1,052 |
| 528 |
| |||
Loss from continuing operations |
| (39,471 | ) | (7,309 | ) | (27,928 | ) | |||
Loss from discontinued operations, net of income taxes |
| (38,259 | ) | (1,826 | ) | (2,653 | ) | |||
Net loss |
| $ | (77,730 | ) | $ | (9,135 | ) | $ | (30,581 | ) |
Other comprehensive income or loss: |
|
|
|
|
|
|
| |||
Foreign currency translation |
| 39 |
| (146 | ) | 104 |
| |||
Comprehensive loss |
| $ | (77,691 | ) | $ | (9,281 | ) | $ | (30,477 | ) |
|
|
|
|
|
|
|
| |||
Reconciliation of net loss to net loss attributable to common stockholders: |
|
|
|
|
|
|
| |||
Net loss |
| $ | (77,730 | ) | $ | (9,135 | ) | $ | (30,581 | ) |
Accretion of Series B Convertible Preferred Stock to liquidation value |
| — |
| — |
| 13,262 |
| |||
Deemed dividend on Series B Convertible Preferred Stock |
| — |
| — |
| 1,844 |
| |||
Net loss attributable to common stockholders |
| $ | (77,730 | ) | $ | (9,135 | ) | $ | (45,687 | ) |
|
|
|
|
|
|
|
| |||
Net loss attributable to common stockholders per share — basic and diluted: |
|
|
|
|
|
|
| |||
Continuing operations |
| $ | (2.18 | ) | $ | (0.46 | ) | $ | (10.77 | ) |
Discontinued operations |
| (2.10 | ) | (0.11 | ) | (0.66 | ) | |||
Total |
| $ | (4.28 | ) | $ | (0.57 | ) | $ | (11.43 | ) |
|
|
|
|
|
|
|
| |||
Weighted average shares of common stock outstanding — basic and diluted |
| 18,182 |
| 15,944 |
| 3,996 |
| |||
See accompanying notes
UNITEK GLOBAL SERVICES, INC. AND SUBSIDIARIES
Consolidated Statements of Changes in Stockholders’ Equity
(amounts in thousands)
|
|
|
|
|
|
|
| Accumulated |
|
|
|
|
| |||||
|
|
|
|
|
| Additional |
| Other |
|
|
|
|
| |||||
|
| Common Stock |
| Paid-in |
| Comprehensive |
| Accumulated |
|
|
| |||||||
|
| Shares |
| Amount |
| Capital |
| Income or Loss |
| Deficit |
| Total |
| |||||
|
|
|
|
|
|
|
|
|
|
|
|
|
| |||||
Balance at December 31, 2009 |
| 1,948 |
| $ | — |
| $ | 113,838 |
| $ | 60 |
| $ | (94,385 | ) | $ | 19,513 |
|
Net loss |
| — |
| — |
| — |
| — |
| (30,581 | ) | (30,581 | ) | |||||
Foreign currency translation |
| — |
| — |
| — |
| 104 |
| — |
| 104 |
| |||||
Shares of common stock issued in connection with: |
|
|
|
|
|
|
|
|
|
|
|
|
| |||||
Berliner – Holdings Merger |
| 475 |
| — |
| 22,446 |
| — |
| — |
| 22,446 |
| |||||
Capital contributions |
| 13 |
| — |
| 420 |
| — |
| — |
| 420 |
| |||||
Public offering |
| 9,725 |
| — |
| 84,433 |
| — |
| — |
| 84,433 |
| |||||
Conversion of Series B Convertible Preferred Stock |
| 2,986 |
| — |
| 28,368 |
| — |
| — |
| 28,368 |
| |||||
Business acquisitions |
| 7 |
| — |
| 585 |
| — |
| — |
| 585 |
| |||||
Accretion of Series B Convertible Preferred Stock to liquidation value |
| — |
| — |
| (13,262 | ) | — |
| — |
| (13,262 | ) | |||||
Deemed dividend on Series B Convertible Preferred Stock |
| — |
| — |
| (1,844 | ) |
|
|
|
| (1,844 | ) | |||||
Stock-based compensation |
| — |
| — |
| 2,025 |
| — |
| — |
| 2,025 |
| |||||
Balance as of December 31, 2010 |
| 15,154 |
| — |
| 237,009 |
| 164 |
| (124,966 | ) | 112,207 |
| |||||
Net loss, as restated |
| — |
| — |
| — |
| — |
| (9,135 | ) | (9,135 | ) | |||||
Foreign currency translation |
| — |
| — |
| — |
| (146 | ) | — |
| (146 | ) | |||||
Shares of common stock issued in connection with: |
|
|
|
|
|
|
|
|
|
|
|
|
| |||||
Stock-based compensation plans |
| 265 |
| — |
| (767 | ) | — |
| — |
| (767 | ) | |||||
Business acquisitions |
| 925 |
| — |
| 8,453 |
| — |
| — |
| 8,453 |
| |||||
Stock-based compensation |
| — |
| — |
| 5,107 |
| — |
| — |
| 5,107 |
| |||||
Other capital adjustments |
| (39 | ) | — |
| (57 | ) | — |
| — |
| (57 | ) | |||||
Balance as of December 31, 2011, as restated |
| 16,305 |
| — |
| 249,745 |
| 18 |
| (134,101 | ) | 115,662 |
| |||||
Net loss |
| — |
| — |
| — |
| — |
| (77,730 | ) | (77,730 | ) | |||||
Foreign currency translation |
| — |
| — |
| — |
| 39 |
| — |
| 39 |
| |||||
Shares of common stock issued in connection with: |
|
|
|
|
|
|
|
|
|
|
|
|
| |||||
Stock-based compensation plans |
| 326 |
| — |
| (362 | ) | — |
| — |
| (362 | ) | |||||
Business acquisitions |
| 2,105 |
| — |
| 5,789 |
| — |
| — |
| 5,789 |
| |||||
Stock-based compensation |
| — |
| — |
| 4,905 |
| — |
| — |
| 4,905 |
| |||||
Balance as of December 31, 2012 |
| 18,736 |
| $ | — |
| $ | 260,077 |
| $ | 57 |
| $ | (211,831 | ) | $ | 48,303 |
|
See accompanying notes
UNITEK GLOBAL SERVICES, INC. AND SUBSIDIARIES
Consolidated Statements of Cash Flows
(amounts in thousands)
|
| Years Ended December 31, |
| |||||||
|
| 2012 |
| 2011 |
| 2010 |
| |||
|
|
|
| (Restated) |
|
|
| |||
Cash flows from operating activities: |
|
|
|
|
|
|
| |||
Net loss |
| $ | (77,730 | ) | $ | (9,135 | ) | $ | (30,581 | ) |
Adjustments to reconcile net loss to net cash provided by (used in) operating activities: |
|
|
|
|
|
|
| |||
Provision for doubtful accounts |
| 4,819 |
| 1,678 |
| 1,895 |
| |||
Depreciation and amortization |
| 29,016 |
| 26,478 |
| 27,124 |
| |||
Impairment charges |
| 50,080 |
| — |
| — |
| |||
Non-cash interest expense |
| 2,180 |
| 1,945 |
| 9,749 |
| |||
Loss on extinguishment of debt |
| — |
| 3,466 |
| 1,677 |
| |||
Expense (income) related to contingent consideration |
| 10,096 |
| (8,506 | ) | — |
| |||
Stock-based compensation |
| 4,905 |
| 5,107 |
| 2,025 |
| |||
Gain on sale of property and equipment |
| (1,365 | ) | (702 | ) | (32 | ) | |||
Loss on sale of Wireline Group |
| 978 |
| — |
| — |
| |||
Deferred income taxes, net |
| (5,602 | ) | 3,320 |
| 1,647 |
| |||
Payment of contingent consideration |
| (1,560 | ) | — |
| — |
| |||
Changes in working capital: |
|
|
|
|
|
|
| |||
Accounts receivable |
| (28,029 | ) | (15,412 | ) | (16,449 | ) | |||
Inventories |
| (2,571 | ) | (426 | ) | (1,150 | ) | |||
Prepaid expenses and other assets |
| (4,268 | ) | (334 | ) | 232 |
| |||
Accounts payable and other liabilities |
| 28,001 |
| 1,620 |
| 883 |
| |||
Net cash provided by (used in) operating activities |
| 8,950 |
| 9,099 |
| (2,980 | ) | |||
|
|
|
|
|
|
|
| |||
Cash flows from investing activities: |
|
|
|
|
|
|
| |||
Acquisition of property and equipment |
| (5,642 | ) | (5,823 | ) | (3,902 | ) | |||
Proceeds from sale of property and equipment |
| 2,133 |
| 1,140 |
| 633 |
| |||
Cash restricted for acquisition of business |
| — |
| — |
| 133 |
| |||
Cash paid for acquisition of businesses, net of cash acquired |
| (16,858 | ) | (13,155 | ) | — |
| |||
Proceeds from sale of Wireline Group |
| 5,435 |
| — |
| — |
| |||
Net cash used in investing activities |
| (14,932 | ) | (17,838 | ) | (3,136 | ) | |||
|
|
|
|
|
|
|
| |||
Cash flows from financing activities: |
|
|
|
|
|
|
| |||
Proceeds from issuance of common shares |
| — |
| — |
| 86,362 |
| |||
Proceeds from issuance of preferred shares |
| — |
| — |
| 12,500 |
| |||
Proceeds from (repayments of) revolving credit facilities, net |
| 11,229 |
| 15,595 |
| (11,500 | ) | |||
Proceeds from long-term debt, net of debt discount |
| 33,750 |
| 97,000 |
| 20,000 |
| |||
Repayment of long-term debt |
| (1,277 | ) | (103,650 | ) | (75,889 | ) | |||
Repayment of capital leases |
| (11,585 | ) | (9,919 | ) | (5,972 | ) | |||
Payment of contingent consideration |
| (21,480 | ) | (2,602 | ) | — |
| |||
Payment of financing fees |
| (1,021 | ) | (3,929 | ) | (2,478 | ) | |||
Other financing activities |
| (362 | ) | (824 | ) | (1,510 | ) | |||
Net cash provided by (used in) financing activities |
| 9,254 |
| (8,329 | ) | 21,513 |
| |||
|
|
|
|
|
|
|
| |||
Effect of exchange rate on cash and cash equivalents |
| 31 |
| (115 | ) | 56 |
| |||
Net increase (decrease) in cash and cash equivalents |
| 3,303 |
| (17,183 | ) | 15,453 |
| |||
Cash and cash equivalents at beginning of period |
| 533 |
| 17,716 |
| 2,263 |
| |||
Cash and cash equivalents at end of period |
| $ | 3,836 |
| $ | 533 |
| $ | 17,716 |
|
|
|
|
|
|
|
|
| |||
Supplemental cash flow information: |
|
|
|
|
|
|
| |||
Interest paid |
| $ | 13,600 |
| $ | 13,152 |
| $ | 17,832 |
|
Income taxes paid |
| 879 |
| 186 |
| 235 |
| |||
|
|
|
|
|
|
|
| |||
Significant non-cash investing and financing activities: |
|
|
|
|
|
|
| |||
Fair value of equity paid for acquisition |
| $ | 5,789 |
| $ | 8,453 |
| $ | 22,446 |
|
Acquisition of property and equipment financed by capital leases |
| 4,313 |
| 16,941 |
| 4,338 |
| |||
Capital leases converted from operating leases |
| — |
| — |
| 10,196 |
| |||
Credit support fee paid in shares of Series B Preferred Stock |
| — |
| — |
| 765 |
| |||
See accompanying notes
UNITEK GLOBAL SERVICES, INC. AND SUBSIDIARIES
Notes to Consolidated Financial Statements
1. Business
UniTek Global Services, Inc. and its subsidiaries (“UniTek” or the “Company”) is a leading full-service provider of permanently outsourced infrastructure services, offering an end-to-end suite of technical services to customers in the wireless telecommunications, public safety, satellite television and broadband cable industries in the United States and Canada. The Company’s customers, which are primarily large telecommunications companies, satellite television and broadband cable companies, municipalities and related agencies, utilize its services to build and maintain their infrastructure and networks and to provide residential and commercial fulfillment services. These services are critical to the Company’s customers’ ability to deliver voice, video and data services to their end users.
The Company reports its results in two segments based on the services that it provides and the industries that it serves. The Company’s Fulfillment segment provides comprehensive installation and fulfillment services to customers in the satellite television and broadband cable industries. Revenues in this segment are primarily recurring in nature and based on predetermined rates for each type of service performed. The Company’s Engineering and Construction segment provides infrastructure services, systems integration for public safety and land mobile radio applications, construction and project management services to customers in the wireless telecommunications and public safety industries. Revenues in this segment are primarily contract-based and are recognized primarily using the percentage-of-completion method using certain estimated costs incurred to-date or milestones achieved to measure progress towards completion.
2. Restatement
As a result of an internal investigation conducted by the Audit Committee of the Company’s Board of Directors, with the assistance of outside independent counsel and a forensic accounting firm, it was determined that several employees of the Company’s Pinnacle Wireless subsidiary (included in the Company’s Engineering and Construction segment) engaged in fraudulent activities that resulted in improper revenue recognition that affected the results of previously filed annual and interim financial information. As a result, the Company undertook a process to restate its annual and interim financial information for the periods ended July 2, 2011, October 1, 2011, December 31, 2011, March 31, 2012, June 30, 2012 and September 29, 2012 (the “Restatement”).
The aforementioned errors related primarily to the following areas: (i) certain revenues that were recognized could not be supported by contractual agreements with the customer or were otherwise not recognizable under the percentage-of-completion method of U.S. generally accepted accounting principles (“GAAP”); (ii) the timing of recognition of project costs was accelerated for a number of public safety construction projects which affected the timing of revenue recognition under the percentage-of-completion method; (iii) the Company failed to combine two contracts for accounting purposes that were part of a single project with an overall profit margin; and (iv) estimates of the total cost to complete certain public safety construction projects were understated, which resulted in the acceleration of revenues under the percentage-of-completion method.
The aggregate impact of the Pinnacle revenue and related adjustments for the year ended December 31, 2011 decreased revenues and cost of revenues by $7.2 million and $1.4 million, respectively, and are included in the “Restatement Adjustments” column in the following table for the consolidated statement of comprehensive income or loss. These revenue and related adjustments also (decreased) increased accounts receivable, net, inventories, accounts payable and other liabilities at December 31, 2011 by $(7.2) million, $0.5 million, $(1.2) million, and $0.2 million, respectively, and are included in the “Restatement Adjustments” column in the following table for the consolidated balance sheet.
UNITEK GLOBAL SERVICES, INC. AND SUBSIDIARIES
Notes to Consolidated Financial Statements
As part of its restatement, the Company also identified certain other errors affecting the consolidated financial statements as of and for the year ended December 31, 2011:
· As a result of the aforementioned errors, the Company’s calculations of the fair value of contingent consideration was not performed correctly. Based on the correct estimates, the fair value of the contingent consideration liability decreased during 2011 from $25.8 million to $17.3 million, resulting in income related to contingent consideration of $8.5 million rather than expense of $3.6 million. After considering the cash payment made during 2011, the carrying value at December 31, 2011 is $14.9 million, all of which is long-term.
· Borrowings under the Revolving Loan Agreement, and related deferred financing costs, were not correctly classified as current portion of long-term debt and prepaid expenses and other current assets, respectively, in the consolidated balance sheet.
· The Company corrected the classification of cash overdraft balances from cash and cash equivalents to accounts payable in the consolidated balance sheet and adjusted its consolidated statement of cash flows accordingly.
· Certain other errors which were not individually material to the financial statements.
The effect of the restatement on previously issued annual financial information as of and for the year ended December 31, 2011 is set forth in this footnote. The effect of the restatement on the previously filed interim financial information is set forth in Note 21.
As discussed further in Notes 3 and 18, previously issued consolidated statements of comprehensive income or loss have been reclassified for the results of discontinued operations. In addition, previously issued consolidated balance sheets and consolidated statements of cash flows include certain other reclassifications to conform to the current presentation. Such reclassifications are presented separately in the tables below and have been separately noted in footnotes to each financial statement as applicable.
UNITEK GLOBAL SERVICES, INC. AND SUBSIDIARIES
Notes to Consolidated Financial Statements
The following table presents the consolidated balance sheet as previously reported, reclassifications, restatement adjustments and the consolidated balance sheet as restated at December 31, 2011:
(in thousands, except share and per share amounts) |
| Previously |
| Reclassifications(1) |
| Restatement |
| Restated |
| ||||
ASSETS |
|
|
|
|
|
|
|
|
| ||||
CURRENT ASSETS |
|
|
|
|
|
|
|
|
| ||||
Cash and cash equivalents |
| $ | 95 |
| $ | — |
| $ | 438 |
| $ | 533 |
|
Restricted cash |
| 68 |
| (68 | ) | — |
| — |
| ||||
Accounts receivable, net(2) |
| 91,533 |
| — |
| (6,962 | ) | 84,571 |
| ||||
Inventories |
| 10,985 |
| — |
| 467 |
| 11,452 |
| ||||
Prepaid expenses and other current assets |
| 3,299 |
| 68 |
| 1,165 |
| 4,532 |
| ||||
Total current assets |
| 105,980 |
| — |
| (4,892 | ) | 101,088 |
| ||||
Property and equipment, net |
| 39,022 |
| — |
| — |
| 39,022 |
| ||||
Amortizable customer relationships, net(3) |
| 29,783 |
| 4,635 |
| — |
| 34,418 |
| ||||
Other amortizable intangible assets, net(3) |
| 4,635 |
| (4,635 | ) | — |
| — |
| ||||
Goodwill |
| 163,797 |
| — |
| — |
| 163,797 |
| ||||
Deferred tax assets, net |
| 568 |
| — |
| — |
| 568 |
| ||||
Other assets, net |
| 5,095 |
| — |
| (646 | ) | 4,449 |
| ||||
Total assets |
| $ | 348,880 |
| $ | — |
| $ | (5,538 | ) | $ | 343,342 |
|
|
|
|
|
|
|
|
|
|
| ||||
LIABILITIES AND STOCKHOLDERS’ EQUITY |
|
|
|
|
|
|
|
|
| ||||
CURRENT LIABILITIES |
|
|
|
|
|
|
|
|
| ||||
Accounts payable |
| $ | 33,367 |
| $ | — |
| $ | (570 | ) | $ | 32,797 |
|
Accrued liabilities |
| 32,597 |
| (32,597 | ) | — |
| — |
| ||||
Accrued insurance(4) |
| — |
| 13,659 |
| — |
| 13,659 |
| ||||
Accrued compensation and benefits(4) |
| — |
| 7,634 |
| 509 |
| 8,143 |
| ||||
Current income taxes |
| 904 |
| (904 | ) | — |
| — |
| ||||
Current portion of contingent consideration |
| 26,958 |
| — |
| (26,958 | ) | — |
| ||||
Current portion of long-term debt |
| 1,000 |
| — |
| 15,663 |
| 16,663 |
| ||||
Current portion of capital lease obligations |
| 9,631 |
| — |
| — |
| 9,631 |
| ||||
Other current liabilities(4) |
| 518 |
| 12,208 |
| (554 | ) | 12,172 |
| ||||
Total current liabilities |
| 104,975 |
| — |
| (11,910 | ) | 93,065 |
| ||||
Long-term debt, net of current portion |
| 111,217 |
| — |
| (15,663 | ) | 95,554 |
| ||||
Long-term capital lease obligations, net of current portion |
| 16,283 |
| — |
| — |
| 16,283 |
| ||||
Contingent consideration, net of current portion |
| — |
| — |
| 14,852 |
| 14,852 |
| ||||
Deferred tax liabilities(5) |
| 5,511 |
| — |
| — |
| 5,511 |
| ||||
Other liabilities |
| 1,664 |
| — |
| 751 |
| 2,415 |
| ||||
Total liabilities |
| 239,650 |
| — |
| (11,970 | ) | 227,680 |
| ||||
|
|
|
|
|
|
|
|
|
| ||||
Commitments and contingencies |
|
|
|
|
|
|
|
|
| ||||
|
|
|
|
|
|
|
|
|
| ||||
STOCKHOLDERS’ EQUITY |
|
|
|
|
|
|
|
|
| ||||
Preferred Stock, $0.00002 par value (20 million shares authorized, no shares issued or outstanding) |
| — |
| — |
| — |
| — |
| ||||
Common Stock, $0.00002 par value (200 million shares authorized, 16,305,369 shares issued and outstanding) |
| — |
| — |
| — |
| — |
| ||||
Additional paid-in capital |
| 249,745 |
| — |
| — |
| 249,745 |
| ||||
Accumulated other comprehensive income |
| 18 |
| — |
| — |
| 18 |
| ||||
Accumulated deficit |
| (140,533 | ) | — |
| 6,432 |
| (134,101 | ) | ||||
Total stockholders’ equity |
| 109,230 |
| — |
| 6,432 |
| 115,662 |
| ||||
Total liabilities and stockholders’ equity |
| $ | 348,880 |
| $ | — |
| $ | (5,538 | ) | $ | 343,342 |
|
(1) Certain prior period amounts have been reclassified to conform to the current presentation.
(2) Previously reported as “Accounts receivable and unbilled revenue, net of allowances.”
(3) Currently reported as “Amortizable intangible assets, net.”
(4) Reclassifications relate to amounts reviously reported as “Accrued liabilities.”
(5) Previously reported as “Deferred income taxes.”
UNITEK GLOBAL SERVICES, INC. AND SUBSIDIARIES
Notes to Consolidated Financial Statements
The following table presents the consolidated statement of comprehensive income or loss as previously reported, reclassifications for discontinued operations, restatement adjustments and the consolidated statement of comprehensive income or loss as restated for the year ended December 31, 2011:
(in thousands, except per share amounts) |
| Previously |
| Reclassifications |
| Restatement |
| Restated |
| ||||
|
|
|
|
|
|
|
|
|
| ||||
Revenues |
| $ | 432,321 |
| $ | (74,264 | ) | $ | (6,601 | ) | $ | 351,456 |
|
Cost of revenues |
| 347,728 |
| (67,074 | ) | (676 | ) | 279,978 |
| ||||
Gross profit |
| 84,593 |
| (7,190 | ) | (5,925 | ) | 71,478 |
| ||||
Selling, general and administrative expenses |
| 48,383 |
| (2,903 | ) | (251 | ) | 45,229 |
| ||||
Expense (income) related to contingent consideration(1) |
| 3,600 |
| — |
| (12,106 | ) | (8,506 | ) | ||||
Depreciation and amortization |
| 26,335 |
| (2,044 | ) | — |
| 24,291 |
| ||||
Operating income |
| 6,275 |
| (2,243 | ) | 6,432 |
| 10,464 |
| ||||
Interest expense |
| 13,900 |
| (37 | ) | — |
| 13,863 |
| ||||
Loss on extinguishment of debt |
| 3,466 |
| — |
| — |
| 3,466 |
| ||||
Other income, net |
| (648 | ) | 40 |
| — |
| (608 | ) | ||||
Loss from continuing operations before income taxes |
| (10,443 | ) | (2,246 | ) | 6,432 |
| (6,257 | ) | ||||
Income tax expense |
| 4,289 |
| (3,237 | ) | — |
| 1,052 |
| ||||
Loss from continuing operations |
| (14,732 | ) | 991 |
| 6,432 |
| (7,309 | ) | ||||
Loss from discontinued operations, net of income taxes |
| (835 | ) | (991 | ) | — |
| (1,826 | ) | ||||
Net loss |
| $ | (15,567 | ) | $ | — |
| $ | 6,432 |
| $ | (9,135 | ) |
Other comprehensive income or loss: (2) |
|
|
|
|
|
|
|
|
| ||||
Foreign currency translation(2) |
| (146 | ) | — |
| — |
| (146 | ) | ||||
Comprehensive loss(2) |
| $ | (15,713 | ) | $ | — |
| $ | 6,432 |
| $ | (9,281 | ) |
|
|
|
|
|
|
|
|
|
| ||||
Net loss per share — basic and diluted: |
|
|
|
|
|
|
|
|
| ||||
Continuing operations |
| $ | (0.93 | ) | 0.06 |
| 0.41 |
| $ | (0.46 | ) | ||
Discontinued operations |
| (0.05 | ) | (0.06 | ) | — |
| (0.11 | ) | ||||
Total |
| $ | (0.98 | ) | — |
| 0.41 |
| $ | (0.57 | ) | ||
(1) Previously reported as “Change in fair value of contingent consideration.”
(2) Previously reported in the Statement of Changes in Stockholders’ Equity.
UNITEK GLOBAL SERVICES, INC. AND SUBSIDIARIES
Notes to Consolidated Financial Statements
The following table presents the consolidated statement of cash flows as previously reported, reclassifications, restatement adjustments and the consolidated statement of cash flows as restated for the year ended December 31, 2011:
(in thousands) |
| Previously |
| Reclassifications(1) |
| Restatement |
| Restated |
| ||||
|
|
|
|
|
|
|
|
|
| ||||
Cash flows from operating activities: |
|
|
|
|
|
|
|
|
| ||||
Net loss |
| $ | (15,567 | ) | $ | — |
| $ | 6,432 |
| $ | (9,135 | ) |
Adjustments to reconcile net loss to net cash provided by operating activities: |
|
|
|
|
|
|
|
|
| ||||
Loss from discontinued operations |
| 835 |
| (835 | ) | — |
| — |
| ||||
Provision for doubtful accounts |
| 1,678 |
| — |
| — |
| 1,678 |
| ||||
Depreciation and amortization |
| 26,335 |
| 143 |
| — |
| 26,478 |
| ||||
Amortization of deferred financing fees |
| 1,152 |
| (1,152 | ) | — |
| — |
| ||||
Change in fair value of warrants and interest-rate collar |
| 133 |
| (133 | ) | — |
| — |
| ||||
Accretion of debt discount |
| 660 |
| (660 | ) | — |
| — |
| ||||
Non-cash interest expense |
| — |
| 1,945 |
| — |
| 1,945 |
| ||||
Loss on extinguishment of debt |
| 3,466 |
| — |
| — |
| 3,466 |
| ||||
Expense (income) related to contingent consideration(2) |
| 3,600 |
| — |
| (12,106 | ) | (8,506 | ) | ||||
Stock-based compensation |
| 5,107 |
| — |
| — |
| 5,107 |
| ||||
Gain on sale of property and equipment |
| (702 | ) | — |
| — |
| (702 | ) | ||||
Deferred income taxes, net |
| 3,320 |
| — |
| — |
| 3,320 |
| ||||
Changes in working capital:(3) |
|
|
|
|
|
|
|
|
| ||||
Accounts receivable(4) |
| (22,373 | ) | — |
| 6,961 |
| (15,412 | ) | ||||
Inventories |
| 41 |
| — |
| (467 | ) | (426 | ) | ||||
Prepaid expenses and other assets |
| 184 |
| — |
| (518 | ) | (334 | ) | ||||
Accounts payable and other liabilities(5) |
| 1,378 |
| — |
| 242 |
| 1,620 |
| ||||
Net cash provided by operating activities — continuing operations |
| 9,247 |
|
|
|
|
|
|
| ||||
Net cash used in operating activities — discontinued operations |
| (692 | ) | 692 |
| — |
| — |
| ||||
Net cash provided by operating activities |
| 8,555 |
| — |
| 544 |
| 9,099 |
| ||||
|
|
|
|
|
|
|
|
|
| ||||
Cash flows from investing activities: |
|
|
|
|
|
|
|
|
| ||||
Acquisition of property and equipment |
| (5,801 | ) | — |
| (22 | ) | (5,823 | ) | ||||
Proceeds from sale of property and equipment |
| 1,140 |
| — |
| — |
| 1,140 |
| ||||
Cash paid for acquisition of businesses, net of cash acquired |
| (13,155 | ) | — |
| — |
| (13,155 | ) | ||||
Net cash used in investing activities |
| (17,816 | ) | — |
| (22 | ) | (17,838 | ) | ||||
|
|
|
|
|
|
|
|
|
| ||||
Cash flows from financing activities: |
|
|
|
|
|
|
|
|
| ||||
Proceeds from revolving credit facilities, net |
| 6,000 |
| 15,595 |
| (6,000 | ) | 15,595 |
| ||||
Proceeds from existing revolving credit facilities, net |
| 15,595 |
| (15,595 | ) | — |
| — |
| ||||
Proceeds from long-term debt, net of debt discount(6) |
| 97,000 |
| — |
| — |
| 97,000 |
| ||||
Repayment and extinguishment of prior long-term debt |
| (108,900 | ) | 108,900 |
| — |
| — |
| ||||
Repayment of existing long-term debt |
| (750 | ) | 750 |
| — |
| — |
| ||||
Repayment of long-term debt |
| — |
| (109,650 | ) | 6,000 |
| (103,650 | ) | ||||
Repayment of capital leases |
| (9,919 | ) | — |
| — |
| (9,919 | ) | ||||
Payment of contingent consideration |
| (2,518 | ) | — |
| (84 | ) | (2,602 | ) | ||||
Payment of financing fees(7) |
| (3,929 | ) | — |
| — |
| (3,929 | ) | ||||
Other financing activities |
| (824 | ) | — |
| — |
| (824 | ) | ||||
Net cash used in financing activities |
| (8,245 | ) | — |
| (84 | ) | (8,329 | ) | ||||
|
|
|
|
|
|
|
|
|
| ||||
Effect of exchange rate on cash and cash equivalents |
| (115 | ) | — |
| — |
| (115 | ) | ||||
Net decrease in cash and cash equivalents |
| (17,621 | ) | — |
| 438 |
| (17,183 | ) | ||||
Cash and cash equivalents at beginning of period |
| 17,716 |
| — |
| — |
| 17,716 |
| ||||
Cash and cash equivalents at end of period |
| $ | 95 |
| $ | — |
| $ | 438 |
| $ | 533 |
|
UNITEK GLOBAL SERVICES, INC. AND SUBSIDIARIES
Notes to Consolidated Financial Statements
(in thousands) |
| Previously |
| Reclassifications(1) |
| Restatement |
| Restated |
| ||||
|
|
|
|
|
|
|
|
|
| ||||
Supplemental cash flow information: |
|
|
|
|
|
|
|
|
| ||||
Interest paid |
| $ | 13,152 |
| $ | — |
| $ | — |
| $ | 13,152 |
|
Income taxes paid |
| 186 |
| — |
| — |
| 186 |
| ||||
|
|
|
|
|
|
|
|
|
| ||||
Significant non-cash investing and financing activities: |
|
|
|
|
|
|
|
|
| ||||
Fair value of equity paid for acquisition |
| $ | 8,453 |
| $ | — |
| $ | — |
| $ | 8,453 |
|
Acquisition of property and equipment financed by capital leases |
| 16,941 |
| — |
| — |
| 16,941 |
| ||||
(1) Certain prior period amounts have been reclassified to conform to the current presentation.
(2) Previously reported as “Change in fair value of contingent consideration.”
(3) Previously reported as “Changes in assets and liabilities.”
(4) Previously reported as “Accounts receivable and unbilled revenue.”
(5) Previously reported as “Accounts payable and accrued liabilities.”
(6) Previously reported as “Proceeds from issuance of long-term debt, net of debt discount.”
(7) Previously reported as “Financing fees.”
UNITEK GLOBAL SERVICES, INC. AND SUBSIDIARIES
Notes to Consolidated Financial Statements
3. Basis of Presentation
As discussed further in Notes 2 and 21, the Company has restated its consolidated financial statements as of December 31, 2011 and for the year then ended, as well as its unaudited interim condensed consolidated financial information as of and for the quarterly and year-to-date periods ended September 29, 2012, June 30, 2012, March 31, 2012, December 31, 2011, October 1, 2011 and July 2, 2011.
The consolidated financial statements include the accounts of the Company and its wholly-owned subsidiaries. All intercompany transactions and balances have been eliminated in consolidation.
As discussed further in Note 18, the Company’s previously filed consolidated statements of comprehensive income or loss and related footnote disclosures have been reclassified for the results of discontinued operations to conform to the current presentation. The consolidated balance sheets, statements of cash flows and related footnote disclosures, including disclosures of changes in balance sheet amounts, reflect the total operations of the Company, including discontinued operations.
4. Summary of Significant Accounting Policies
The following is a summary of the significant accounting policies followed in the preparation of the accompanying consolidated financial statements.
Use of Estimates
The preparation of financial statements in conformity with U.S. generally accepted accounting principles (“GAAP”) requires the Company to make estimates and assumptions that affect the reported amounts of certain assets and liabilities, amounts contained in certain of the notes to the consolidated financial statements, and the revenues and expenses reported for the periods covered by the financial statements. Although such assumptions are based on management’s best knowledge of current events and actions the Company may undertake in the future, actual results could differ significantly from those estimates and assumptions. The Company’s more significant estimates relate to revenue recognition, impairment testing of goodwill, indefinite-lived intangible assets and other long-lived assets, the allowance for doubtful accounts, accrued insurance, income taxes, business combinations, including valuation of contingent consideration, and litigation and contingencies.
In the ordinary course of accounting for the items discussed above, the Company makes changes in estimates as appropriate and as the Company becomes aware of circumstances surrounding those estimates. Such changes in estimates are reflected in reported results of operations in the period in which the changes are made, and if material, their effects are disclosed in the notes to the consolidated financial statements.
Business Combinations
The Company accounts for business combinations by estimating the fair value of consideration paid for acquired businesses, including contingent consideration, and allocating that amount to the fair values of assets acquired and liabilities assumed, with the remainder assigned to goodwill. The estimates of fair values are determined utilizing customary valuation procedures and techniques, which require the Company, among other things, to estimate future cash flows and discount rates. The accounting for business combinations is preliminary and subject to potential adjustment until finalized, no later than one year from the date of acquisition.
The Company recognizes the acquisition date fair value of contingent consideration as part of the consideration transferred in a business combination. Contingent consideration is classified as either a liability or equity in accordance with GAAP. If classified as a liability, the liability is remeasured to fair value at each subsequent reporting date until the contingency is resolved, with changes in fair value recorded on the consolidated statement of comprehensive income or loss. If classified as equity, contingent consideration is not remeasured and subsequent settlement is accounted for within equity.
UNITEK GLOBAL SERVICES, INC. AND SUBSIDIARIES
Notes to Consolidated Financial Statements
Cash and Cash Equivalents
The Company considers all highly liquid instruments purchased with an original maturity of three months or less to be cash equivalents.
Accounts Receivable, Net of Allowances
Accounts receivable are customer obligations for services rendered to such customers under normal trade terms. The Company’s customers are video content providers, communications carriers, other corporate entities and municipal and governmental agencies located primarily in the United States and Canada. The Company performs periodic credit evaluations of its customers’ financial condition but generally does not require its customers to provide collateral. Trade accounts receivable and contract billings are recorded at the invoiced amount and do not bear interest. Unbilled revenue represents revenue recognized on infrastructure equipment construction and installation contracts that are not yet billed or billable pursuant to contract terms. Unbilled revenue is generally billed within three months subsequent to the provision of the services, although for some customers such periods may extend longer.
The Company maintains an allowance for doubtful accounts for estimated losses resulting from the inability of customers to make required payments. The Company records a specific reserve for known or suspected doubtful accounts receivable. For all other accounts, the Company records a general reserve based on the length of time receivables are past due and historical write-off experience. The Company evaluates the adequacy of the reserve using several factors including length of time a receivable is past due, historical experience with the customer, changes in the customer’s credit worthiness, the customer’s payment history, the length of the customer’s relationship with the Company, the customer’s financial condition, availability of mechanics’ and other liens, existence of payment bonds and other sources of payment, current industry trends and current economic trends. Account balances are charged off against the allowance when they are deemed uncollectible. The provision for doubtful accounts is recorded as a reduction to revenues or in selling, general and administrative expenses depending upon whether the related revenues have been billed to the customer.
Concentration Risks
Financial instruments which potentially subject the Company to concentration of credit risk consist principally of accounts receivable. The Company does not enter into financial instruments for trading or speculative purposes.
Inventories
Inventories consist primarily of materials and supplies purchased from the customer and other suppliers used for installation fulfillment services and wireless construction. The Company’s inventories in the Fulfillment segment include serialized and non-serialized inventories. Serialized inventories consist primarily of receivers and similar devices which are usually supplied by the customer for installation purposes. Non-serialized inventories consist of dishes, poles, cables, switches and various other parts. Inventories for the Fulfillment segment are stated at the lower of cost or market using the first in, first out method. The Company’s inventories in the Engineering and Construction segment consist primarily of off-the-shelf inventories used on construction and engineering projects. Inventories for the Engineering and Construction segment are stated at lower of cost or market using the average cost method.
UNITEK GLOBAL SERVICES, INC. AND SUBSIDIARIES
Notes to Consolidated Financial Statements
Property and Equipment, Net
Property and equipment consist of vehicles, equipment and computers, land and buildings, leasehold improvements and assets under capital leases. Each class of asset is recorded at cost and depreciated using the straight-line method over the estimated useful lives. Vehicles are depreciated over five to seven years. Equipment and computers are depreciated over a period of three to eight years. Buildings are depreciated over 15 years. Leasehold improvements are depreciated over the term of the lease or the estimated useful life, whichever is shorter. Assets under capital leases are depreciated over the lesser of the lease term or the asset’s estimated useful life. Maintenance and repairs are charged to expense as incurred. Significant renewals and betterments are capitalized. The Company capitalizes certain costs incurred in connection with developing or obtaining internal use software, which are included within equipment and computers. At the time of retirement or other disposition of property and equipment, the cost and accumulated depreciation or amortization are removed from the accounts and any resulting gain or loss is reflected in the consolidated statements of comprehensive income or loss. All depreciation of property and equipment is included in the consolidated statements of comprehensive income or loss in depreciation and amortization.
Goodwill and Other Intangible Assets
Goodwill represents the excess of purchase price over the fair value of the net tangible assets and intangible assets acquired in a business combination. The Company amortizes intangible assets, consisting of customer relationships (including backlog), trade names and technology, and non-compete agreements from acquired businesses on a straight-line basis over the estimated lives of those assets.
The Company reviews goodwill and indefinite-lived intangible assets for impairment at least annually or more often if an event occurs or circumstances change which indicates that their carrying amount may not exceed their fair value. The annual impairment review is performed as of the first day of the fourth quarter of each fiscal year based upon information and estimates available at that time. To perform the impairment testing, the Company first assesses qualitative factors to determine whether it is more likely than not that the fair values of its reporting units is less than their carrying amounts as a basis for determining whether or not to perform the quantitative two-step goodwill impairment test. The Company then estimates the fair value of each reporting unit not meeting the qualitative criteria and each indefinite-lived intangible asset and compares their fair values to their carrying values. If the carrying value of a reporting unit exceeds its fair value, the Company determines the implied fair value of goodwill assigned to that reporting unit by deducting the estimated fair value of its net assets, other than goodwill, from its overall fair value. If the fair value of goodwill or indefinite-lived intangible assets is less than its carrying amount, the Company recognizes an impairment loss for the difference.
Goodwill and any additions to goodwill related to acquired businesses are assigned to individual reporting units. The Company has currently established its reporting units at the operating segment level.
Long-Lived Assets
The Company reviews long-lived assets, consisting primarily of property and equipment and intangible assets with finite lives, for recoverability whenever events or changes in circumstances indicate that the carrying value of the assets may not be recoverable. In analyzing recoverability, management uses projections of future undiscounted cash flows from the assets. These projections are based on management’s view of growth rates for the related business, anticipated future economic conditions and estimates of residual values. If the future undiscounted cash flows of such assets are less than their carrying value, the Company recognizes an impairment loss for the amount by which their carrying value exceeds their fair value.
Deferred Financing Fees
Costs associated with obtaining long-term debt are deferred and amortized to interest expense on a straight-line basis, which approximates the effective interest method, over the term of the related debt. Such costs related to borrowings under the Revolving Loan Agreement that are classified as a current liability are included in prepaid expenses and other current assets, and the remaining balance is included in other assets, net, on the consolidated balance sheets.
UNITEK GLOBAL SERVICES, INC. AND SUBSIDIARIES
Notes to Consolidated Financial Statements
Accrued Insurance
The Company maintains high-deductible insurance policies for workers’ compensation, general liability, automobile, medical and dental claims. Because most claims against the Company do not exceed its deductibles, the Company is effectively self-insured for substantially all claims. Insurance reserves are established for estimates of the loss that the Company will ultimately incur on reported claims and claims that have been incurred but not yet reported. The Company’s insurance reserves incorporate historical loss experience and judgments about the present and expected levels of cost per claim. Trends in actual experience are a significant factor in the determination of such reserves. The Company updates its estimates and the appropriateness of its reserves quarterly based upon known facts, historical trends and its judgments regarding future claims.
Lease Obligations
The Company leases vehicles primarily for performing fulfillment services to the pay television industry. Leases are accounted for either as operating or capital depending on the terms of the lease. Operating lease payments are expensed as incurred. Capital leases are included on the consolidated balance sheets as property and equipment and capital lease obligations. The acquisition of property and equipment financed by capital leases are excluded from the consolidated statements of cash flows and disclosed as a significant non-cash investing and financing activity.
Fair Value Measurements
Fair value is a market-based measurement, not an entity-specific measurement, and represents the price that would be received to sell an asset or paid to transfer a liability in an orderly transaction between market participants at the measurement date. Valuation techniques such as the market approach (comparable market prices), the income approach (present value of future income or cash flow), and the cost approach (cost to replace the service capacity of an asset or replacement cost) may be used to determine fair value, which are each based upon observable and unobservable inputs. Observable inputs reflect market data obtained from independent sources, while unobservable inputs reflect the Company’s market assumptions.
The Company uses a three-tier valuation hierarchy based upon observable and non-observable inputs, as described below:
· Level 1 — Quoted market prices in active markets for identical assets or liabilities at the measurement date.
· Level 2 — Observable market based inputs or other observable inputs corroborated by market data at the measurement date, other than quoted prices included in Level 1, either directly or indirectly.
· Level 3 — Significant unobservable inputs that cannot be corroborated by observable market data and reflect the use of significant management judgment. These values are generally determined using valuation models that utilize management’s estimates of market participant assumptions.
The Company determines the estimated fair value of assets and liabilities using available market information and commonly accepted valuation methodologies. However, considerable judgment is required in interpreting market data to develop the estimates of fair value. The use of different assumptions or estimation methodologies could have a material effect on the estimated fair values.
Warranty
We generally warrant the work we perform for a one to two-year period following substantial completion of a project. We have not historically accrued material liabilities for potential warranty claims, but during 2012 and 2011 as a result of the Pinnacle acquisition, we accrued warranty expense of $0.5 million and $0.2 million, respectively, for estimated long-term warranty claims on large projects. As of December 31, 2012 and 2011, the warranty liability of $0.7 million and $0.2 million, respectively, was included in other liabilities in the accompanying consolidated balance sheets.
Legal and Regulatory Contingencies
From time to time, the Company is a party to various lawsuits, claims, or other legal proceedings and is subject, due to the nature of its business, to governmental agency oversight, audits, investigations and review. Legal and regulatory contingencies are reflected in the Company’s consolidated financial statements based on management’s assessment of the expected outcome or resolution of the contingencies. The Company accrues for contingencies when it is probable a liability has been incurred and the amount of loss can be reasonably estimated.
UNITEK GLOBAL SERVICES, INC. AND SUBSIDIARIES
Notes to Consolidated Financial Statements
Revenue Recognition
The Company recognizes revenues when persuasive evidence of an arrangement exists, delivery has occurred or services have been rendered, the price is fixed or determinable and collectability is reasonably assured. Revenues are recognized net of any estimated allowances.
Fulfillment
The Company recognizes revenues from installation and fulfillment services as the services are rendered. Fulfillment services are performed pursuant to work orders under master service or similar types of service agreements that specify units of service to be performed for a contractually stated fixed price per unit. Revenues from fulfillment services are reported net of equipment costs payable to the customer because the Company acts as an agent with respect to the equipment.
Engineering and Construction
The Company recognizes revenues from infrastructure construction, equipment installation and project management contracts under the percentage-of-completion method based on the percentage of costs incurred to-date compared to estimated total costs at completion. Engineering and construction services are performed pursuant to work orders under agreements or master agreements that specify units of service to be performed for a contractually stated price per unit that the Company is entitled to receive upon satisfactory completion of each unit. Contracts generally become billable upon satisfaction of contractually-specified performance milestones per individual contract terms or, in most cases, for work completed to-date in the event of project termination. The Company combines contracts when they are, in effect, parts of a single project with an overall profit margin. The Company reviews and revises its determination of total contract revenues and its estimates of total cost quarterly as work progresses. Any adjustments to earnings arising from such revisions are made cumulatively through the date of revision and included in results of operations in the period of revision. Costs used to determine percentage-of-completion include direct costs such as materials, labor and subcontractor costs and indirect costs specifically allocable or identifiable to each contract, such as indirect labor, supplies, tools and repairs. Contract losses are recognized currently if it becomes known that a contract will be performed at an overall loss. The Company recognizes revenues from standalone site acquisition and zoning service contracts based upon output measures using contract milestones as the basis.
Unbilled contract revenues represent revenues recognized on infrastructure construction and equipment installation contracts that are not yet billed or billable pursuant to contract terms. Billings in excess of costs and estimated earnings represent the value of services to customers that have been billed as of the balance sheet date but for which the requisite services have not yet been rendered.
Certain contracts include multiple deliverables, typically involving the design, construction and implementation of public safety radio networks with a separate maintenance component for a specific period of time following implementation. The maintenance component of these contracts is typically for a period of one to ten years. The Company accounts for the maintenance component of these contracts as a separate unit of accounting with the revenue being recognized on a pro-rata basis over the term of the maintenance period. The revenue for the remaining portion of the contract is recognized on the percentage-of-completion method. The value assigned to each unit of accounting is determined primarily based upon its separate selling price. The liability associated with these maintenance contracts is reflected within other current liabilities and other liabilities.
Costs relating to customer claims and change orders are expensed in the period incurred unless approved by the customer or persuasive evidence exists that the costs will be recovered, in which case they are included in the Company’s estimates of total contract revenues and costs. The Company determines the likelihood that costs relating to claims and change orders will be recovered based upon past practices or specific discussions, correspondence or negotiation with the customer.
At any time the Company has numerous contracts in progress which can be at various stages of completion. Accounting for revenues and profits on long-term projects requires estimates of progress towards completion to determine the extent of profit recognition. These estimates may be revised as additional information becomes available. The Company reviews all significant contracts on a quarterly basis and revises its estimates as appropriate.
The most significant estimates that the Company must make in order to recognize revenues are determining (i) the total estimated cost of each project at completion, including whether and when any contracts will be performed at an overall loss, and therefore recognizing that loss immediately; (ii) the relative values of each unit of accounting under multiple-element arrangements; (iii) the likelihood that costs related to claims and change orders will be recoverable; and (iv) for certain contracts, the estimation of total contract revenue. Such estimates, by their nature, involve judgment regarding future uncertainties and could result in significant changes in estimate in the future.
UNITEK GLOBAL SERVICES, INC. AND SUBSIDIARIES
Notes to Consolidated Financial Statements
Stock-Based Compensation
Stock-based compensation is based on the grant-date fair value of awards ultimately expected to vest. The Company estimates forfeitures at the time of grant in order to estimate the amount of stock-based awards that will ultimately vest. Limited historical forfeiture data is available. As such, management has based the estimated forfeiture rate on expected employee turnover and reevaluates its estimates each period. The Company estimates the fair value of restricted stock units (“RSUs”) and non-vested restricted shares on the date of grant based on quoted market prices for the Company’s common stock and the fair value of stock options on the date of grant primarily using the Black-Scholes option-pricing model. Compensation expense for all stock-based awards is recognized on a straight-line basis or as the awards vest if sooner over the requisite service periods.
Income Taxes
The provision or benefit for income taxes consists of taxes currently due plus deferred taxes related primarily to differences between the basis of assets and liabilities for financial and income tax reporting. Deferred tax assets and liabilities represent the future tax return consequences of those differences, which will either be deductible or taxable when the assets and liabilities are recovered or settled. Deferred tax assets are also recognized for operating losses that are available to offset future taxable income. Deferred tax assets and liabilities are reflected at income tax rates applicable to the period in which the deferred tax assets and liabilities are expected to be realized or settled. As changes in tax laws or rates are enacted, deferred tax assets and liabilities are adjusted through the provision or benefit for income taxes.
The Company establishes tax valuation allowances to reduce deferred tax assets, such as tax loss carryforwards, to net realizable value. The Company considers future pretax income and ongoing prudent and feasible tax planning strategies in assessing the net realizable value of deferred tax assets and the need for such a valuation allowance. In the event that the Company determines that it may not be able to realize all or part of the net deferred tax asset in the future, a valuation allowance for the deferred tax asset is charged against the provision or benefit for income taxes in the period such determination is made. The establishment of the valuation allowance does not preclude the Company from utilizing its deferred tax assets in the future; however, the Company has experienced an ownership change as defined under Section 382 of the Internal Revenue Code, and therefore the use of the net operating loss carry forwards is subject to limitation.
The Company provides an intra-period tax allocation of the provision or benefit for income taxes to continuing operations and discontinued operations.
Uncertain Tax Positions
The Company recognizes uncertain tax positions in its financial statements when minimum recognition criteria are met in accordance with current accounting guidance. The Company recognizes interest and penalties accrued on any unrecognized tax benefits as a component of income tax expense
UNITEK GLOBAL SERVICES, INC. AND SUBSIDIARIES
Notes to Consolidated Financial Statements
Discontinued Operations
The Company reports the results of operations of a business as discontinued operations if the business has been disposed of or is classified as held for sale, the operations and cash flows of the business have been or will be eliminated from ongoing operations as a result of a disposal transaction and there will not be any significant continuing involvement in the operations of the business after the disposal transaction. The results of discontinued operations, including any gain or loss recognized as a result of a disposal transaction, are reclassified from continuing operations to income or loss from discontinued operations in the consolidated statements of comprehensive income or loss for current and prior periods commencing in the period in which the business meets the criteria of a discontinued operation.
Net Income or Loss per Share
Basic net income or loss per share is computed by dividing net income or loss attributable to common stockholders by the weighted average number of shares of common stock outstanding during the periods presented. Diluted net income or loss attributable to common stockholders per share is computed by dividing net income or loss attributable to common stockholders by the weighted average number of shares of common stock outstanding during the periods adjusted for the dilutive effect, if any, of the exercise or conversion of instruments into common stock, such as non-vested RSUs, non-vested restricted shares, stock options or warrants.
During the years ended December 31, 2012, 2011 and 2010, there were no differences in the amount of basic and diluted net income or loss attributable to common stockholders per share. During the years ended December 31, 2012, 2011 and 2010, 0.7 million, 0.8 million and 0.5 million shares, respectively, were excluded from the computations of diluted net income or loss attributable to common stockholders per share because their effects were anti-dilutive to the computation.
Foreign Currency Translation
The balance sheets of foreign subsidiaries are translated into United States dollars at current period-end rates, and the statements of comprehensive income or loss are translated at average monthly rates during each monthly period. Net exchange gains or losses resulting from the translation of foreign financial statements and the effect of exchange rate changes on intercompany transactions of a long-term investment nature are accumulated and credited or charged directly to a separate component of stockholders’ equity. Any foreign currency gains or losses related to transactions are charged to other income or expense, net.
UNITEK GLOBAL SERVICES, INC. AND SUBSIDIARIES
Notes to Consolidated Financial Statements
5. Business Combinations
The following table presents the calculation and allocation of purchase price for each business combination completed during the years ended December 31, 2012, 2011 and 2010:
(in thousands) |
| Skylink |
| Pinnacle |
| Berliner – |
| Cable |
| ||||
Calculation of purchase price: |
|
|
|
|
|
|
|
|
| ||||
Cash |
| $ | 14,000 |
| $ | 12,727 |
| $ | — |
| $ | 3,738 |
|
Fair value of deferred cash consideration |
| 4,018 |
| — |
| — |
| — |
| ||||
Fair value of equity issued |
| — |
| 8,453 |
| 22,446 |
| — |
| ||||
Fair value of contingent consideration |
| 5,332 |
| 25,800 |
| — |
| 484 |
| ||||
Purchase price |
| $ | 23,350 |
| $ | 46,980 |
| $ | 22,446 |
| $ | 4,222 |
|
|
|
|
|
|
|
|
|
|
| ||||
Allocation of purchase price: |
|
|
|
|
|
|
|
|
| ||||
Cash and cash equivalents |
| $ | — |
| $ | 451 |
| $ | 336 |
| $ | — |
|
Accounts receivable |
| 1,789 |
| 4,313 |
| 25,708 |
| — |
| ||||
Inventories |
| 1,548 |
| 652 |
| 898 |
| — |
| ||||
Prepaid expenses and other current assets |
| — |
| 192 |
| 2,575 |
| — |
| ||||
Property and equipment |
| 1,115 |
| 2,599 |
| 2,705 |
| 703 |
| ||||
Amortizable intangible assets |
| 17,490 |
| 28,686 |
| 4,898 |
| 1,014 |
| ||||
Goodwill |
| 3,752 |
| 16,817 |
| 8,665 |
| 2,709 |
| ||||
Other assets |
| — |
| 445 |
| 289 |
| — |
| ||||
Accounts payable and other current liabilities |
| (2,344 | ) | (3,700 | ) | (14,900 | ) | — |
| ||||
Capital lease obligations |
| — |
| (377 | ) | (611 | ) | (204 | ) | ||||
Long-term debt |
| — |
| — |
| (7,583 | ) | — |
| ||||
Other liabilities |
| — |
| (3,098 | ) | (534 | ) | — |
| ||||
Purchase price |
| $ | 23,350 |
| $ | 46,980 |
| $ | 22,446 |
| $ | 4,222 |
|
The following table presents additional information about acquired amortizable intangible assets:
(dollar amounts in thousands) |
| Skylink |
| Pinnacle |
| Berliner – |
| Cable |
| ||||
Amortizable intangible assets: |
|
|
|
|
|
|
|
|
| ||||
Customer relationships |
| $ | 17,000 |
| $ | 23,530 |
| $ | 4,490 |
| $ | 734 |
|
Non-compete agreements |
| 490 |
| 388 |
| 408 |
| 280 |
| ||||
Technology and trade names |
| — |
| 4,768 |
| — |
| — |
| ||||
Total |
| $ | 17,490 |
| $ | 28,686 |
| $ | 4,898 |
| $ | 1,014 |
|
|
|
|
|
|
|
|
|
|
| ||||
Weighted average amortization period: |
|
|
|
|
|
|
|
|
| ||||
Customer relationships |
| 7.0 years |
| 10.5 years |
| 4.8 years |
| 2.0 years |
| ||||
Non-compete agreements |
| 3.0 years |
| 2.0 years |
| 3.1 years |
| 1.0 years |
| ||||
Technology and trade names |
| — |
| 6.5 years |
| — |
| — |
| ||||
Total |
| 6.9 years |
| 9.7 years |
| 4.7 years |
| 1.7 years |
| ||||
The effect of the Restatement, which is more fully described in Note 2 to these consolidated financial statements, did not change the calculation or the allocation of the purchase price for the Pinnacle acquisition.
UNITEK GLOBAL SERVICES, INC. AND SUBSIDIARIES
Notes to Consolidated Financial Statements
Skylink
On September 14, 2012, the Company entered into an asset purchase agreement to purchase substantially all of the assets of Skylink LTD (“Skylink”) relating to its business of conducting video, Internet and multi-dwelling unit fulfillment and installation for DIRECTV in various markets in Indiana, Ohio and West Virginia.
In accordance with the asset purchase agreement, the Company agreed to pay the former owners of Skylink an aggregate purchase price of up to $23.4 million, subject to certain conditions and adjustments as set forth in the agreement, consisting of (i) a cash payment at closing of $14.0 million, (ii) a scheduled payment of an estimated working capital adjustment of $0.1 million, based on the actual net working capital at the closing date compared to an agreed-upon target net working capital, (iii) a $4.0 million minimum portion of the second earn-out payment as described in further detail below, and (iv) contingent consideration of up to $5.5 million.
The contingent consideration is in the form of earn-out payments. The initial earn-out payment of $3.5 million, which was paid in December 2012, was based upon the achievement of certain metrics related to the timely transition of operations to the Company. The second earn-out payment, consisting of a $4.0 million minimum payment and contingent consideration of up to an additional $2.0 million, is payable no later than May 31, 2013 and is based upon the achievement of revenue targets as defined in the asset purchase agreement. We are obligated to pay the amount above the minimum payment, subject to certain performance criteria after the date of acquisition. However, our obligation to make this payment requires certain conditions to be met, including conditions related to minimum levels of our liquidity after giving effect to such payments, which had not yet occurred as of the May 31, 2013 due date. Additionally, as of May 31, 2013 this obligation accrues interest at an amount equal to 10% per annum and contains an optional equity conversion right.
The right to the earn-out payments is evidenced by and subject to an earn-out confirmation agreement, also dated September 14, 2012, which provides that if the earn-out payments are not paid when due, the earn-out payments may, subject to the terms, conditions and limitations of the earn-out confirmation agreement, be converted into shares of UniTek common stock, which will be valued at the volume-weighted average of the closing prices of the common stock as quoted on the NASDAQ Global Market for the twenty (20) days prior to the applicable conversion date.
The customer relationships acquired consist primarily of contractual rights to perform fulfillment services for DIRECTV. We expect that these contracts will be renewed at the end of their four year remaining term.
The results of Skylink have been included in the Company’s results of operations of the Fulfillment segment since the date of acquisition. During the year ended December 31, 2012, the acquisition of Skylink contributed revenues of approximately $8.5 million and operating income of approximately $2.2 million. Acquisition related costs for the year ended December 31, 2012 were $0.2 million, which were recorded as a component of selling, general and administrative expenses. The Company has recognized goodwill of $3.8 million, which is expected to be tax-deductible, representing the value of the existing workforce as well as expected synergies from the combination of operations. The goodwill associated with the acquisition of Skylink is included in the Fulfillment segment’s assets.
UNITEK GLOBAL SERVICES, INC. AND SUBSIDIARIES
Notes to Consolidated Financial Statements
Pinnacle
Effective April 3, 2011, UniTek completed the acquisition of Pinnacle Wireless, Inc. (“Pinnacle”) pursuant to an Asset Purchase Agreement dated as of March 30, 2011, as amended on March 28, 2012 (the “Asset Purchase Agreement”). Pinnacle specializes in large-scale communications projects for transportation, public safety, entertainment, hospitality and enterprise-grade commercial real estate, which has expanded the Company’s presence in the two-way radio and wireless communications systems integration markets.
In accordance with the Asset Purchase Agreement, UniTek agreed to pay an aggregate purchase price of up to $50.7 million, subject to certain conditions and adjustments, consisting of a base purchase price of $20.7 million and earn-out payments of up to $30.0 million. The base purchase price of $20.7 million consisted of $12.7 million in cash and $8.0 million in shares of UniTek common stock. The number of shares of common stock was determined using the volume-weighted average of the closing prices of the common stock as quoted on the Nasdaq Global Market for the 20 days prior to March 31, 2011, which was $8.65 per share, resulting in the issuance of 924,856 shares of the Company’s common stock. Of the consideration paid in shares of the Company’s common stock, 578,037 shares were delivered at closing and 346,819 shares were placed into escrow, to be held until their release in accordance with the terms of the Asset Purchase Agreement.
The fair value of the 924,856 shares of common stock issued was determined based upon the closing price of the Company’s common stock of $9.14 per share on the last business day prior to April 3, 2011. The fair value of the contingent consideration of $25.8 million was determined using significant unobservable inputs, as discussed further below and in Note 11.
The results of Pinnacle have been included in the Company’s results of operations in the Engineering and Construction segment since the date of acquisition. During the year ended December 31, 2011, the acquisition of Pinnacle contributed revenues of approximately $21.4 million and operating loss of approximately $2.8 million. Acquisition related costs for the year ended December 31, 2011 were $0.2 million, which were recorded as a component of selling, general and administrative expenses. The Company has recognized goodwill of $16.8 million, which is tax-deductible, arising from the acquisition representing the value of the existing workforce as well as expected synergies from the combination of operations. The goodwill associated with the acquisition of Pinnacle is included in the Engineering and Construction segment’s assets.
UNITEK GLOBAL SERVICES, INC. AND SUBSIDIARIES
Notes to Consolidated Financial Statements
Contingent Consideration
The contingent consideration was in the form of up to three separate earn-out payments based upon the achievement of incremental earnings before interest, taxes, depreciation and amortization (“EBITDA”) performance targets as defined in the Asset Purchase Agreement, so long as the actual EBITDA is in excess of pre-defined EBITDA thresholds, up to an aggregate maximum amount of $30.0 million, using the formulas described in the following table:
No. |
| EBITDA Measurement Period |
| EBITDA Threshold |
| Earn-out Formula |
| |
|
|
|
|
|
|
|
| |
1 |
| April 3, 2011 to September 30, 2011 |
| $ | 2.5 million |
| 1.5 x (Period 1 EBITDA - $2 million) |
|
2 |
| April 3, 2011 to March 31, 2012 |
| $ | 5.0 million |
| 5.0 x (Period 2 EBITDA - $4 million) |
|
3 |
| April 1, 2012 to March 31, 2013 |
| Period 2 EBITDA |
| 3.0 x (Period 3 EBITDA - Period 2 EBITDA) |
| |
The aggregate earn-out payments were originally payable 60% in cash and 40% in equity, but the Asset Purchase Agreement was subsequently amended on March 28, 2012 to limit the total number of shares issued (including those that had been issued in connection with the April 2011 closing of the acquisition) to 3,029,856, with the remainder of the earn-out payments payable in cash.
The fair value of the contingent consideration was determined on the acquisition date and subsequently updated using a Monte Carlo simulation model applied to the Company’s estimate of Pinnacle’s expected EBITDA performance at each of the measurement dates, as further described in Note 11. Changes in the fair value of the contingent consideration during each period subsequent to the acquisition date were recognized in earnings.
The earn-out payments were calculated using EBITDA prior to the Restatement, and resulted in the payment of the first two earn-outs, which together satisfied the maximum amount specified in the Asset Purchase Agreement. The first payment was calculated to be $2.4 million and paid during the quarter ended December 31, 2011. The second payment was calculated to be $25.3 million and paid during the quarter ended June 30, 2012, consisting of $19.5 million of cash and shares of common stock with an issuance date fair value of $5.8 million. The difference between the $30.0 million maximum consideration and the aggregate payments of $27.8 million resulted from the decrease in the fair value of the Company’s common stock between the date that the value of the shares was measured under the terms of the Asset Purchase Agreement and the date that the shares were issued.
The number of shares of common stock issued in connection with the second earn-out payment was initially determined using the volume-weighted average of the closing prices of the common stock as quoted on the NASDAQ Global Market for the 20 day period ended March 30, 2012, the date that the Company originally believed the maximum earn-out was earned by the Sellers based on improper revenue recognition (see Note 2). The average price was $3.65 per share, resulting in the issuance of 2,105,000 shares of the Company’s common stock, which was the maximum number of shares remaining under the terms of the amended Asset Purchase Agreement. The fair value of these shares for accounting purposes was determined using the Company’s closing stock price on June 8, 2012, the day before the date of issuance, of $2.75 per share.
As a result of the Restatement of the Company’s results of operations for 2011 and the first three interim periods in 2012, the fair value of the estimated aggregate contingent consideration measured at October 1, 2011, December 31, 2011 and March 31, 2012 have been restated based on the Monte Carlo simulation model. See Note 11 for additional details regarding the fair value measurements.
During the quarter ended June 30, 2012, the entire contingent consideration liability to the sellers was settled by virtue of the transfer of the aggregate cash and equity consideration described above, which represented the maximum contingent consideration payable under the Asset Purchase Agreement. While the Company made the aforementioned earn-out payments with a fair value for accounting purposes of $27.8 million, based on the Restatement of the Company’s results of operations and the related EBITDA calculations, no earn-out was due or payable under the Asset Purchase Agreement. The difference between the restated contingent consideration liability of $23.3 million recorded as of March 31, 2012 and the fair value of the consideration transferred during the quarter ended June 30, 2012 of $25.3 million was recognized as additional expense related to contingent consideration in the consolidated statement of comprehensive income or loss. Despite the determination that no amount was actually payable based on the six month or one year results of Pinnacle, subsequent to the settlement of this liability in the quarter ended June 30, 2012, the Company no longer measured or recorded a contingent consideration liability related to the projected EBITDA for the twelve month period ending March 31, 2013, the third earn-out period.
The Company intends to seek repayment of the contingent consideration paid, and any amount recovered will be reflected in the consolidated statement of comprehensive income or loss at such time as the amount is determined and the gain has been realized.
UNITEK GLOBAL SERVICES, INC. AND SUBSIDIARIES
Notes to Consolidated Financial Statements
Berliner — Holdings Merger
On January 27, 2010, Berliner Communications, Inc. (“Berliner”), Berliner’s wholly-owned subsidiary BCI East, Inc. and UniTek Holdings, Inc. (“Holdings”) entered into an agreement and plan of merger (the “Berliner – Holdings Merger” or the “Merger”) whereby each outstanding share of the common stock of Holdings (the “Holdings Common Stock”) was converted into the right to receive shares of the Company’s common stock at an effective exchange ratio of one-to-one. In addition, each share of Series A Preferred Stock of Holdings (the “Holdings Preferred Stock”) was converted into the right to receive 0.02 shares of Series B Convertible Preferred Stock (“Series B Preferred”). The Merger expanded UniTek’s presence in the wireless telecommunications market for site acquisition and construction of wireless cell towers and related services.
The fair value of the equity issued was determined based upon the underlying value of the UniTek stock as determined by a third-party valuation and the exchange rate established in the Merger agreement. Based on the number of shares of Holdings capital stock and Berliner capital stock outstanding as of January 27, 2010, the stockholders of Holdings immediately prior to the Merger held more than 80% of the voting capital stock of Berliner outstanding immediately following the Merger.
The results of Berliner have been included in the Company’s results of operations in the Engineering and Construction segment since the date of the Merger. During the year ended December 31, 2010, Berliner contributed revenue of approximately $81.2 million and an operating loss of $4.8 million. Acquisition related costs for the year ended December 31, 2010 were $1.9 million, which were recorded as a component of selling, general and administrative expenses. The Company has recognized goodwill of $8.7 million, which is not tax-deductible, arising from the acquisition representing the value of the existing workforce as well as expected synergies from the combination of operations. The goodwill associated with the Merger is included in the Engineering and Construction segment’s assets.
Cable Acquisitions
The Company acquired certain broadband cable fulfillment businesses (the “Cable Acquisitions”) during the years ended December 31, 2012 and 2011:
· On March 2, 2012, the Company acquired substantially all of the assets and assumed certain liabilities of Cableview Communications Inc. (“Cableview”), a provider of broadband cable installation services in the eastern United States, for a total purchase price of $2.9 million;
· On January 3, 2012, the Company acquired substantially all of the assets and assumed certain liabilities of Streamline Communications, Inc., a provider of broadband cable installation services in the greater Dallas, Texas market, for a total purchase price of $0.5 million.
· On October 6, 2011, the Company acquired substantially all of the assets and assumed certain liabilities of Oasis Communications, LLC d/b/a Wyretech, a provider of broadband cable installation services primarily in the state of Texas, for a total purchase price of approximately $0.6 million.
· On February 28, 2011, the Company acquired substantially all of the assets and assumed certain liabilities of DA Technologies, Inc., a provider of broadband cable installation services in the southeastern United States, for a total purchase price of $0.3 million.
The Cable Acquisitions have expanded the Company’s broadband cable installation presence in certain geographies across the United States and enhanced the Company’s customer diversification.
The Company issued contingent consideration to acquire Cableview in the form of earn-outs. The earn-outs are based on the achievement of certain revenue levels for the six- and 12-month periods subsequent to the acquisition date up to maximum amounts of $0.4 million and $1.4 million, respectively.
The results of the Cable Acquisitions have been included in the Company’s results of operations in the Fulfillment segment since their respective acquisition dates. The contribution of the Cable Acquisitions to consolidated revenues and consolidated operating income was not material to the Company’s results of operations in the periods in which they were acquired. The Company has recognized goodwill of $2.7 million from the Cable Acquisitions, which will be tax-deductible, representing the value of the existing workforce as well as expected synergies from the combination of operations. The goodwill associated with the Cable Acquisitions is included in the Fulfillment segment’s assets.
UNITEK GLOBAL SERVICES, INC. AND SUBSIDIARIES
Notes to Consolidated Financial Statements
Unaudited Pro Forma Financial Information
The following table presents unaudited pro forma revenues and income or loss from continuing operations as if the acquisitions completed in 2012 and 2011 occurred on January 1 of the comparable prior annual period:
|
| Year Ended December 31, |
| |||||||
(in thousands) |
| 2012 |
| 2011 |
| 2010 |
| |||
|
|
|
|
|
|
|
| |||
Revenues |
| $ | 456,898 |
| $ | 385,426 |
| $ | 367,894 |
|
Loss from continuing operations |
| (37,862 | ) | (5,804 | ) | (29,791 | ) | |||
The operating results of the Cable Acquisitions were not included in the pro forma operating results presented above because they were not material on a pro forma basis to the Company’s consolidated revenues or loss from continuing operations.
6. Accounts Receivable, Net of Allowances
The following table presents the components of accounts receivable, net of allowances:
|
| December 31, |
| ||||
(in thousands) |
| 2012 |
| 2011 |
| ||
|
|
|
| (Restated) |
| ||
|
|
|
|
|
| ||
Trade accounts receivable |
| $ | 22,954 |
| $ | 35,651 |
|
Contract billings |
| 37,246 |
| 23,528 |
| ||
Unbilled contract revenues |
| 42,287 |
| 14,767 |
| ||
Other unbilled revenues |
| 3,686 |
| 13,978 |
| ||
Retainage |
| 2,657 |
| 258 |
| ||
Accounts receivable, gross |
| 108,830 |
| 88,182 |
| ||
Allowance for doubtful accounts |
| (6,340 | ) | (3,611 | ) | ||
Accounts receivable, net of allowances |
| $ | 102,490 |
| $ | 84,571 |
|
All components of accounts receivable are expected to be collected within one year. Retainage has been billed but is not due until completion of performance and acceptance by customers according to the terms of contracts, which is expected to be in 2014.
The following table presents the components of unbilled contract revenues and billings in excess of costs and estimated earnings:
|
| December 31, |
| ||||
(in thousands) |
| 2012 |
| 2011 |
| ||
|
|
|
| (Restated) |
| ||
|
|
|
|
|
| ||
Costs on in-process contracts |
| $ | 85,842 |
| $ | 37,123 |
|
Estimated earnings, net of estimated losses |
| 30,822 |
| 13,003 |
| ||
Less: progress billings |
| (79,023 | ) | (35,359 | ) | ||
|
| $ | 37,641 |
| $ | 14,767 |
|
|
|
|
|
|
| ||
Unbilled contract revenues |
| $ | 42,287 |
| $ | 14,767 |
|
Billings in excess of costs and estimated earnings |
| (4,646 | ) | — |
| ||
|
| $ | 37,641 |
| $ | 14,767 |
|
The following table presents changes in the allowance for doubtful accounts:
|
| Year Ended December 31, |
| |||||||
(in thousands) |
| 2012 |
| 2011 |
| 2010 |
| |||
|
|
|
|
|
|
|
| |||
Balance at beginning of the year |
| $ | 3,611 |
| $ | 3,192 |
| $ | 2,445 |
|
Provision for doubtful accounts |
| 4,819 |
| 1,678 |
| 1,895 |
| |||
Amounts charged against allowances, net of collections |
| (2,090 | ) | (1,259 | ) | (1,148 | ) | |||
Balance at end of the year |
| $ | 6,340 |
| $ | 3,611 |
| $ | 3,192 |
|
UNITEK GLOBAL SERVICES, INC. AND SUBSIDIARIES
Notes to Consolidated Financial Statements
7. Concentration Risks
The following table presents customer concentration information as a percentage of revenues:
|
| Year Ended December 31, |
|
|
| ||||
|
| 2012 |
| 2011 |
| 2010 |
| Primary Segment |
|
Revenues from top 10 customers |
| >90 | % | >90 | % | >90 | % |
|
|
Revenues from significant customers: |
|
|
|
|
|
|
|
|
|
DIRECTV |
| 43 | % | 56 | % | 55 | % | Fulfillment |
|
AT&T |
| 17 | % | 1 | % | — |
| Engineering & Construction |
|
Comcast |
| 15 | % | 17 | % | 17 | % | Fulfillment |
|
At December 31, 2012, credit risk was concentrated with four customers that accounted for 76% of accounts receivable, net of allowances. Amounts due from these four customers represented 52%, 9%, 8% and 6%, respectively, of the Company’s accounts receivable, net of allowances.
At December 31, 2011, credit risk was concentrated with four customers that accounted for 50% of accounts receivable, net of allowances. Amounts due from these four customers represented 18%, 11%, 11% and 10%, respectively, of the Company’s total accounts receivable, net of allowances.
8. Property and Equipment, Net
The following table presents the components of property and equipment, net:
|
| December 31, |
| ||||
(in thousands) |
| 2012 |
| 2011 |
| ||
|
|
|
|
|
| ||
Vehicles |
| $ | 3,150 |
| $ | 4,747 |
|
Equipment and computers |
| 29,154 |
| 28,216 |
| ||
Land and buildings |
| 400 |
| 400 |
| ||
Leasehold improvements |
| 2,426 |
| 1,933 |
| ||
Assets under capital leases |
| 33,216 |
| 38,824 |
| ||
Property and equipment, gross |
| 68,346 |
| 74,120 |
| ||
Less: accumulated depreciation |
| (41,953 | ) | (35,098 | ) | ||
Property and equipment, net |
| $ | 26,393 |
| $ | 39,022 |
|
Depreciation expense, including depreciation of assets under capital leases, was $15.9 million, $13.4 million and $10.1 million for the years ended December 31, 2012, 2011 and 2010, respectively.
The Company capitalizes certain costs incurred in connection with developing or obtaining internal use software, which is included as a component of equipment and computers. Capitalized software costs are amortized over a period of three years. As of December 31, 2012 and December 31, 2011, the Company had $1.6 million and $2.4 million, respectively, of capitalized software costs remaining to be amortized. During the years ended December 31, 2012, 2011 and 2010, the Company capitalized approximately $0.1 million, $0.4 million and $1.0 million, respectively, of software costs for internal use.
UNITEK GLOBAL SERVICES, INC. AND SUBSIDIARIES
Notes to Consolidated Financial Statements
9. Goodwill and Other Intangible Assets
The following table presents changes in goodwill by segment:
(in thousands) |
| Fulfillment |
| Engineering & |
| Total |
| |||
|
|
|
|
|
|
|
| |||
Balance at December 31, 2010 |
| $ | 104,875 |
| $ | 41,672 |
| $ | 146,547 |
|
Acquisitions |
| 452 |
| 16,817 |
| 17,269 |
| |||
Foreign currency translation |
| (19 | ) | — |
| (19 | ) | |||
Balance at December 31, 2011 |
| 105,308 |
| 58,489 |
| 163,797 |
| |||
Acquisitions |
| 6,009 |
| — |
| 6,009 |
| |||
Impairment charges |
| — |
| (47,905 | ) | (47,905 | ) | |||
Foreign currency translation |
| 19 |
| — |
| 19 |
| |||
Balance at December 31, 2012 |
| $ | 111,336 |
| $ | 10,584 |
| $ | 121,920 |
|
Accumulated impairment losses at December 31, 2012, 2011 and 2010, were $14.9 million, $32.4 million and $32.4 million, respectively, resulting from the 2009 impairment of goodwill assigned to the wireline reporting unit, a portion of the Engineering and Construction segment, which the Company sold in December 2012, and the 2012 impairment of the goodwill assigned to the wireless reporting unit (which includes Pinnacle), also part of the Engineering and Construction segment.
The following table presents the components of amortizable intangible assets, net:
(in thousands) |
| December 31, |
| Weighted |
| December 31, |
| Weighted |
| ||
Amortizable intangible assets: |
|
|
|
|
|
|
|
|
| ||
Customer relationships |
| $ | 116,222 |
| 8.0 years |
| $ | 98,662 |
| 9.0 years |
|
Non-compete agreements |
| 2,591 |
| 2.7 years |
| 1,971 |
| 2.5 years |
| ||
Technology and trade names |
| 4,768 |
| 6.5 years |
| 4,768 |
| 6.5 years |
| ||
Total amortizable intangible assets |
| 123,581 |
|
|
| 105,401 |
|
|
| ||
|
|
|
|
|
|
|
|
|
| ||
Accumulated amortization: |
|
|
|
|
|
|
|
|
| ||
Customer relationships |
| 78,132 |
|
|
| 68,879 |
|
|
| ||
Non-compete agreements |
| 1,971 |
|
|
| 1,476 |
|
|
| ||
Technology and trade names |
| 1,465 |
|
|
| 628 |
|
|
| ||
Total accumulated amortization |
| 81,568 |
|
|
| 70,983 |
|
|
| ||
|
|
|
|
|
|
|
|
|
| ||
Amortizable intangible assets, net |
| $ | 42,013 |
|
|
| $ | 34,418 |
|
|
|
Amortization expense for the years ended December 31, 2012, 2011 and 2010 was $10.6 million, $10.9 million and $15.1 million, respectively.
The following table presents estimated amortization expense for each of the following five years and thereafter (in thousands):
Year ending December 31, |
|
|
| |
2013 |
| $ | 6,994 |
|
2014 |
| 6,092 |
| |
2015 |
| 5,934 |
| |
2016 |
| 5,093 |
| |
2017 |
| 4,720 |
| |
Thereafter |
| 13,180 |
| |
Total |
| $ | 42,013 |
|
UNITEK GLOBAL SERVICES, INC. AND SUBSIDIARIES
Notes to Consolidated Financial Statements
10. Long-Term Debt
On April 15, 2011, the Company completed a refinancing of all of its existing debt by entering into (i) a Credit Agreement (the “Term Loan Agreement”) by and among the Company and the several banks and other financial institutions or entities that are parties to the Term Loan Agreement; and (ii) a Revolving Credit and Security Agreement (the “Revolving Loan Agreement”) by and among the Company and PNC Bank, National Association. Both the Term Loan and the Revolving Loan may be used for general business purposes.
During July 2013, the Company completed an additional refinancing of all of its existing debt as described further in Note 22.
The following table presents the components of long-term debt:
|
| December 31, |
| ||||
(in thousands) |
| 2012 |
| 2011 |
| ||
|
|
|
| (Restated) |
| ||
|
|
|
|
|
| ||
Term Loan, net of debt discounts of $3,401 and $2,696, respectively |
| $ | 129,572 |
| $ | 96,554 |
|
Revolving Loan |
| 26,892 |
| 15,663 |
| ||
Total long-term debt |
| 156,464 |
| 112,217 |
| ||
Current portion of long-term debt |
| 3,450 |
| 16,663 |
| ||
Long-term debt, net of current portion |
| $ | 153,014 |
| $ | 95,554 |
|
The Term Loan Agreement consists of a $135.0 million term loan (the “Term Loan”). The Term Loan Agreement requires quarterly repayments of the Term Loan totaling 1.00% per annum of the Term Loan amount until maturity of the debt in 2018. The Term Loan bears interest at one, two, three or six month LIBOR (with a floor of 1.50%) plus a margin of 7.50%. The interest rate on the Term Loan was 9.00% at December 31, 2012. The original amount of the Term Loan and subsequent incremental draws were issued at discounts ranging from three to four percent, which are being accreted and charged to interest expense over the remaining life of the Term Loan.
The Revolving Loan Agreement consists of a $75.0 million revolving credit facility (“Revolving Loan”) with up to $35.0 million available for issuance of letters of credit. The Revolving Loan matures in 2016. The available amount under the Revolving Loan Agreement is determined by the amount and the characteristics of the Company’s receivables. The Company may draw on the Revolving Loan and repay amounts borrowed in unlimited repetition up to the available amount so long as no event of default has occurred and is continuing. The interest rate on the Revolving Loan can be a combination of LIBOR (with no floor) and / or a base rate plus a margin of between 2.25% and 2.75%. The interest rate on the Revolving Loan was 3.37% at December 31, 2012. The Revolving Loan also requires payment of a commitment fee of 0.375% based on the unused balance of the facility. As of December 31, 2012, the Company had $23.9 million in letters of credit outstanding. See Note 22 for information on the refinancing of this Revolving Loan in July 2013 on terms substantially different from these terms.
Subject to certain terms and conditions, the Term Loan Agreement and the Revolving Loan Agreement include accordion features that provide for additional availability under the Term Loan and the Revolving Loan. During the year ended December 31, 2012, the Company exercised its right to increase its borrowings under the Term Loan by a total of $35.0 million, bringing the Term Loan to its current principal amount of $135.0 million prior to annual amortization payments. At December 31, 2012, $15.0 million and $25.0 million would have been available under the accordion features of the Term Loan Agreement and the Revolving Loan Agreement if the Company were not in default of its covenants under such agreements.
The Term Loan Agreement and the Revolving Loan Agreement contain customary representations and warranties as well as provisions for repayment, guarantees, other security and customary events of default. The Term Loan Agreement and the Revolving Loan Agreement also provide the lenders security interests in the collateral of the Company. The Revolving Loan Agreement has a first lien security interest in the Company’s accounts receivable and inventory, and the Term Loan Agreement has a second lien interest in the accounts receivable and inventory and a first lien interest in all other assets of the Company.
The Revolving Loan Agreement requires that the Company maintain a lock-box arrangement with the lender and also contains a subjective acceleration clause. As a result, borrowings under the Revolving Loan Agreement have been classified as a current liability for all periods prior to December 31, 2012. As discussed in Note 22, on July 10, 2013 the Company refinanced its borrowings under the Revolving Loan Agreement on a long-term basis by entering into a new credit agreement. Accordingly, as of December 31, 2012, the Company has excluded from current liabilities the proceeds from the new credit agreement that were applied to retire the short-term obligation and has included in current liabilities only the amount that was repaid subsequent to December 31, 2012 and prior to the refinancing transaction, or $2.1 million.
UNITEK GLOBAL SERVICES, INC. AND SUBSIDIARIES
Notes to Consolidated Financial Statements
The following table presents future maturities of long-term debt, excluding debt discounts, for each of the following five years and thereafter (in thousands):
Year ending December 31, |
|
|
| |
2013 |
| $ | 3,450 |
|
2014 |
| 1,350 |
| |
2015 |
| 1,350 |
| |
2016 |
| 26,142 |
| |
2017 |
| 1,350 |
| |
Thereafter |
| 126,223 |
| |
Total |
| $ | 159,865 |
|
Covenants and Defaults
The Term Loan Agreement and the Revolving Loan Agreement require the Company to be in compliance with specified financial covenants, as defined in each agreement, including (i) a Consolidated Leverage Ratio; and (ii) a Fixed Charge Coverage Ratio of not less than 1.2 to 1.0 for every fiscal quarter ended after the end of fiscal year 2011; and (iii) certain other covenants related to the operation of UniTek’s business in the ordinary course. The Consolidated Leverage Ratio declines over time and is described as follows:
Q2 2011 |
| 4.75:1.00 |
|
Q3 2011 |
| 4.50:1.00 |
|
Q4 2011 |
| 4.25:1.00 |
|
Q1 2012 |
| 4.00:1.00 |
|
Q2 2012 |
| 3.75:1.00 |
|
Q3 2012 – Q1 2013 |
| 3.50:1.00 |
|
Q2 2013 – Q4 2015 |
| 3.25:1.00 |
|
In the event of noncompliance with these financial covenants and other defined events of default, the lenders are entitled to certain remedies, including acceleration of the repayment of amounts outstanding on the Term Loan and the Revolving Loan. As discussed in Note 2, the Company restated its 2011 financial statements as well as interim financial statements for certain quarters of 2011 and 2012. The result of those restatements, as well as the delay in filing the Company’s 2012 and first quarter 2013 financial statements on a timely basis with the SEC, and certain misrepresentations by former members of management, created events of default and covenant compliance violations under the Term Loan Agreement and the Revolving Loan Agreement.
The Term Loan and Revolving Loan lenders signed a Standstill and Forbearance agreement on June 14, 2013, that temporarily extended the standstill periods contained in the original April 30, 2013 Forbearance Agreements, which provided that the lenders would not exercise their rights in response to the Company’s failure to comply with the terms of the agreements. These Forbearance Agreements provided, among other things, that the Company’s indebtedness would become due and payable on or around June 30, 2013 unless the Company received a commitment for refinancing. The Forbearance Agreements also required the Company to retain a financial advisor to assist the Company in completing a restructuring of its debt.
As further described in Note 22, in July 2013, the Company and Apollo Investment Corporation entered into and closed on a Revolving Credit and Security Agreement which provides a $75 million asset-based revolving credit facility (the “ABL Facility”) that has a term expiring on April 15, 2016. The funds available under the ABL Facility were used to replace the Company’s previous Revolving Loan dated April 15, 2011. Additionally, the ABL Facility increases the Company’s borrowing availability as compared to its previous revolving credit facility by $30 million through October 31, 2013, $25 million from November 1, 2013 through November 30, 2013 and $20 million thereafter, at an adjustable interest rate that is at an interest rate of LIBOR (with a 1% floor) plus 925 basis points, which is significantly higher than the April 15, 2011 Revolving Loan.
As further described in Note 22, on July 25, 2013, the Company entered into a Second Amendment and Limited Waiver to Credit Agreement with the Term Lenders. In connection therewith, and in exchange for the issuance of 3.8 million warrants at an exercise price of $0.01 per share as well as an amendment fee of 2.0% of the loan amount, existing defaults were waived for periods including through December 31, 2012 as well as the quarters ended March 31, 2013 and June 30, 2013, financial covenants were modified, and the interest rate was increased by 200 basis points (for cash interest) and an additional 400 basis points (for payment in kind interest, added to the principal of the loan). As a result, the balance of the Term Loan outstanding as of December 31, 2012, excluding principal payments of $1.4 million due in 2013, have been classified as long-term liabilities.
UNITEK GLOBAL SERVICES, INC. AND SUBSIDIARIES
Notes to Consolidated Financial Statements
11. Fair Value Measurements
Assets and Liabilities for which Fair Value is only Disclosed
The carrying values of accounts receivable, accounts payable, accrued insurance, accrued compensation and benefits and financial instruments included in other assets and other liabilities are reflected in the consolidated balance sheets at historical cost, which is materially representative of their fair value due to the relatively short-term maturities of these assets and liabilities. The carrying values of capital lease obligations and long-term debt approximate fair value because they bear interest at rates available to the Company at the respective balance sheet dates for obligations with similar terms and remaining maturities (Level 2 measurements).
Recurring Fair Value Measurements
The following tables present the Company’s assets and liabilities measured at fair value on a recurring basis:
|
| December 31, 2012 |
| ||||||||||
(in thousands) |
| Fair Value |
| Quoted Prices |
| Significant |
| Significant |
| ||||
Assets |
|
|
|
|
|
|
|
|
| ||||
Cash and cash equivalents |
| $ | 3,836 |
| $ | 3,836 |
| $ | — |
| $ | — |
|
Deferred compensation plan assets |
| 1,093 |
| 1,093 |
| — |
| — |
| ||||
Total |
| $ | 4,929 |
| $ | 4,929 |
| $ | — |
| $ | — |
|
Liabilities |
|
|
|
|
|
|
|
|
| ||||
Contingent consideration |
| $ | 1,935 |
| $ | — |
| $ | — |
| $ | 1,935 |
|
Interest rate swap |
| 114 |
| — |
| 114 |
| — |
| ||||
Total |
| $ | 2,049 |
| $ | — |
| $ | 114 |
| $ | 1,935 |
|
|
| December 31, 2011 (Restated) |
| ||||||||||
(in thousands) |
| Fair Value |
| Quoted Prices |
| Significant |
| Significant |
| ||||
Assets |
|
|
|
|
|
|
|
|
| ||||
Cash and cash equivalents |
| $ | 533 |
| $ | 533 |
| $ | — |
| $ | — |
|
Deferred compensation plan assets |
| 551 |
| 551 |
| — |
| — |
| ||||
Total |
| $ | 1,084 |
| $ | 1,084 |
| $ | — |
| $ | — |
|
Liabilities |
|
|
|
|
|
|
|
|
| ||||
Contingent consideration |
| $ | 14,852 |
| $ | — |
| $ | — |
| $ | 14,852 |
|
Interest rate swap |
| 133 |
| — |
| 133 |
| — |
| ||||
Total |
| $ | 14,985 |
| $ | — |
| $ | 133 |
| $ | 14,852 |
|
UNITEK GLOBAL SERVICES, INC. AND SUBSIDIARIES
Notes to Consolidated Financial Statements
Fair Value Measurements with Significant Unobservable Inputs
The following table presents changes in assets and liabilities measured at fair value using significant unobservable inputs:
(in thousands) |
| Contingent |
| |
|
| (Restated) |
| |
|
|
|
| |
Balance at December 31, 2010 |
| $ | 160 |
|
Acquisitions |
| 25,800 |
| |
Settlements — cash |
| (2,602 | ) | |
Changes in fair value |
| (8,506 | ) | |
Balance as of December 31, 2011 |
| 14,852 |
| |
Acquisitions |
| 5,816 |
| |
Settlements — cash |
| (23,040 | ) | |
Settlements — equity |
| (5,789 | ) | |
Changes in fair value |
| 10,096 |
| |
Balance as of December 31, 2012 |
| $ | 1,935 |
|
Contingent consideration represents the fair value of earn-out payments for the acquisitions of Pinnacle, Skylink and Cableview.
Pinnacle
The agreement to purchase Pinnacle Wireless, Inc. (“Pinnacle”) provided for the payment of contingent consideration in the form of earn-out payments, not to exceed $30.0 million, based on the achievement of contractual EBITDA performance targets for the six months ended September 30, 2011, the twelve months ended March 31, 2012 and / or the twelve months ended March 31, 2013. The Asset Purchase Agreement provided that if the September 30, 2011 or March 31, 2012 performance targets were not met, the entire earn-out, or some portion thereof, still could be earned based on Pinnacle’s actual EBITDA attained for the twelve months ending March 31, 2013. The Company used a Monte Carlo simulation model applied to its estimate of Pinnacle’s expected EBITDA performance at each of the measurement dates to estimate the fair value of the potential earn-out. The significant assumptions used in this valuation methodology depended upon considerable judgment, including forecasted EBITDA, an estimate of the volatility of Pinnacle’s earnings based upon a selected peer group and an interest rate tied to the Company’s credit risk profile with terms approximating the earn-out periods. Utilizing the estimated peer group volatility and a range of projected EBITDA outcomes between 80% and 120% of the estimated EBITDA, the estimated range of outcomes on an undiscounted basis was expected to be between $17.4 million and $30.0 million as of the purchase date on April 3, 2011.
At the date of the Pinnacle acquisition, the fair value of the contingent consideration was estimated to be $25.8 million, which the Company was required to remeasure in subsequent periods until the liability was settled. At October 1, 2011, the estimated fair value of the earn-out declined by $13.1 million to $12.7 million due to reduced profitability forecasts. At December 31, 2011, the estimated fair value of the earn-out increased to $17.3 million based on (i) Pinnacle’s actual 2011 EBITDA and (ii) Pinnacle’s revised EBITDA forecasts for the twelve month periods ending March 31, 2012 and 2013, and the carrying value was reduced by a $2.4 million prepayment of the liability. The net adjustment for 2011 of $8.5 million was included as income related to contingent consideration in the Company’s consolidated statement of comprehensive income or loss for the year ended December 31, 2011. At March 31, 2012, using information then available, the estimated fair value of the earn-out increased to $23.3 million based on (i) Pinnacle’s revised EBITDA forecast for the twelve months ending March 31, 2013 and (ii) the provisions of the agreement to purchase Pinnacle regarding the calculation of the earn-out for that period.
Based on Pinnacle’s pre-restatement EBITDA data, in December 2011 and June 2012, the Company transferred an aggregate of $27.8 million in cash and shares of common stock. These payments exceeded the fair value of the liability at March 31, 2012, resulting in additional expense of $1.9 million that was included in the consolidated statement of comprehensive income or loss for the three months ended June 30, 2012. Based on currently available information, it has been determined that no earn-out was payable under the agreement to purchase Pinnacle.
UNITEK GLOBAL SERVICES, INC. AND SUBSIDIARIES
Notes to Consolidated Financial Statements
Skylink
The fair value of contingent consideration related to the acquisition of Skylink was calculated using the average of probability-weighted contingent consideration payments resulting from expected revenues at each of the measurement dates. The significant assumptions used in these calculations included forecasted revenues and the estimated likelihood for each performance scenario. The fair value of the Skylink contingent consideration of $5.3 million, of which the initial earn-out payment of $3.5 million was paid in December 2012, reflects the Company’s belief that the revenue target is highly likely to be fully met; however, should actual results differ from the Company’s expectations, each $1.0 million shortfall of actual revenue compared to the target would decrease the fair value of the Skylink contingent consideration by approximately $0.2 million. As of December 31, 2012, the Company has not yet paid the $4.0 million minimum payment for the second earn-out or the remaining portion of contingent consideration of up to $2.0 million (which has an estimated fair value of $1.9 million at December 31, 2012), both of which were payable on May 31, 2013. However, the obligation to make these payments required certain conditions to be met, including minimum levels of our liquidity after giving effect to such payments, which had not yet occurred after December 31, 2012. Additionally, as of May 31, 2013 this obligation accrues interest at an amount equal to 10% per annum and contains an optional equity conversion right.
Nonrecurring Fair Value Measurements
The Company was required to perform certain nonrecurring fair value measurements during the year ended December 31, 2012. The Company did not perform any significant measurement of assets or liabilities at fair value on a nonrecurring basis during the years ended December 31, 2011 and 2010. The following table presents assets and liabilities that were measured at fair value on a nonrecurring basis during the year ended December 31, 2012:
(in thousands) |
| Fair Value |
| Quoted Prices |
| Significant |
| Significant |
| Impairment |
| |||||
Assets |
|
|
|
|
|
|
|
|
|
|
| |||||
Property and equipment — Wireline Group |
| $ | 3,094 |
| $ | — |
| $ | — |
| $ | 3,094 |
| $ | 2,175 |
|
Goodwill — Wireline Group |
| — |
| — |
| — |
| — |
| 33,005 |
| |||||
Goodwill — wireless reporting unit |
| 10,630 |
| — |
| — |
| 10,630 |
| 14,900 |
| |||||
Total |
| $ | 13,724 |
| $ | — |
| $ | — |
| $ | 13,724 |
| $ | 50,080 |
|
UNITEK GLOBAL SERVICES, INC. AND SUBSIDIARIES
Notes to Consolidated Financial Statements
Impairments of Assets of Wireline Group
The Company determined that the net assets of the wireline telecommunications business unit met the definition of a disposal group held for sale at September 29, 2012 (the “Wireline Group”). The Company estimated the future cash flows of the property and equipment of the Wireline Group and determined that their carrying value exceeded both the sum of their undiscounted cash flows and their fair values, resulting in an impairment charge of $2.2 million. The estimated future cash flows used in the undiscounted cash flow test and the fair value measurement were based on anticipated growth rates for the Wireline Group, future economic conditions and residual values (Level 3 measurements).
The Company estimated the fair value of the Wireline Group and determined that the implied fair value of the goodwill was zero, resulting in an impairment charge of $33.0 million. The fair value of the goodwill was implied by calculating the fair value of the Wireline Group and subtracting from that the fair values of the assets attributable to the reporting unit other than goodwill. The fair value of the reporting unit was determined by considering both a market approach, including private bid information obtained by the Company (Level 2 measurements) and the future discounted cash flows attributable to each, which was determined using the Company’s internal operating forecasts, weighted-average cost of capital, and certain other assumptions (Level 3 measurements). The fair values of the other assets and liabilities attributable to the Wireline Group, other than property and equipment, were calculated using historical cost, which was materially representative of their fair values due to the relatively short-term nature of the assets and liabilities (Level 2 measurements) and was used only for purposes of calculating the implied fair value of goodwill.
Subsequent to the goodwill impairment, the Company measured the fair values of the assets held for sale and the liabilities held for sale of the Wireline Group, less estimated selling costs, and determined that their carrying values did not exceed this amount.
The $35.2 million of charges for the impairments of property and equipment and goodwill in the Wireline Group were included as components of loss from discontinued operations on the consolidated statement of comprehensive income or loss for the year ended December 31, 2012.
Impairment of Wireless Reporting Unit Goodwill
When the Company performed its annual goodwill impairment test in the fourth quarter of 2012, it determined that the fair value of the Wireless reporting unit (part of the Engineering & Construction segment) exceeded the carrying value. The Company determined fair value using a combination of the market-based approach and the income approach relying on a discounted cash flow analysis. Determining fair value requires the exercise of significant judgment, including judgment about appropriate discount rates, perpetual growth rates, the amount and timing of expected future cash flows, as well as relevant comparable company earnings multiples for the market-based approach. The cash flows employed in the discounted cash flow analyses are based on the Company’s internal business model for 2013 and, for years beyond 2013 the growth rates used are an estimate of the future growth in the industry in which the Company participates, considering its liquidity position and the refinancing of its debt which occurred in July 2013 (See Note 22). The discount rates used in the discounted cash flow analyses are intended to reflect the risks inherent in the future cash flows of the reporting unit and are based on an estimated cost of capital, which was determined based on the Company’s estimated cost of capital relative to its capital structure. In addition, the market-based approach utilizes comparable company public trading values, research analyst estimates and, where available, values observed in private market transactions.
The analysis indicated that the reporting unit fair value was below its book value as of September 30, 2012, and accordingly, the Company performed the second step in the analysis. The second step required that the Company allocate the fair value of the reporting unit to all assets and liabilities as if the reporting unit had been acquired in a business combination at the date of the impairment test. The Company then compared the implied fair value of the reporting unit’s goodwill to its carrying amount (for the wireless reporting unit, that amount was $25.5 million as of September 30, 2012). Since the carrying amount of the goodwill exceeded its implied fair value, the Company recognized an impairment loss in an amount equal to that excess. In the fourth quarter of 2012, the carrying value of goodwill exceeded its implied fair value and the Company recorded a noncash, pre-tax impairment charge of $14.9 million.
Derivative Instruments
The Company is required to maintain interest rate hedge agreements covering a notional amount of not less than 50% of the debt outstanding under the Term Loan Agreement. As of December 31, 2012, the Company had entered into interest rate collar agreements having an aggregate notional principal amount of $67.5 million. These interest rate collar agreements matured on July 15, 2013. The fair value of the interest rate collar liability was $0.1 million at December 31, 2012 and 2011 and was recorded within other current liabilities with changes in fair value recorded as a component of interest expense. The valuation of the interest rate collar agreements represents the estimate of the net present value of expected cash flows from each transaction between the Company and the financial institution using relevant mid-market data inputs and based on the assumption of no unusual market conditions or forced liquidations. Due to the Company’s limited use of derivative instruments, there was no significant concentration of credit risk with respect to derivative transactions as of December 31, 2012 or 2011.
UNITEK GLOBAL SERVICES, INC. AND SUBSIDIARIES
Notes to Consolidated Financial Statements
12. Lease Obligations
The Company rents office space, equipment, trucks and other assets under non-cancelable operating and capital leases, certain of which contain purchase option terms. Operating lease payments are expensed as incurred. Leases meeting certain criteria are capitalized, with the related asset being recorded in property and equipment and an offsetting amount recorded as a liability. As of December 31, 2012 and 2011 the total cost of assets under capital leases was approximately $33.2 million and $38.8 million, respectively, and the related accumulated depreciation was approximately $18.1 million and $13.7 million, respectively. Operating lease expense was approximately $10.7 million, $6.3 million and $8.5 million for the years ended December 31, 2012, 2011, and 2010, respectively, and is included as a component of cost of revenues or selling, general and administrative expenses depending on the nature of the lease.
The following table presents future minimum lease payments under capital and noncancelable operating leases as of December 31, 2012:
(in thousands) |
| Capital |
| Operating |
| ||
Year ending December 31, |
|
|
|
|
| ||
2013 |
| $ | 7,843 |
| $ | 9,809 |
|
2014 |
| 5,033 |
| 8,502 |
| ||
2015 |
| 2,603 |
| 6,267 |
| ||
2016 |
| 526 |
| 2,508 |
| ||
2017 |
| 38 |
| 658 |
| ||
Thereafter |
| — |
| — |
| ||
Total minimum lease payments |
| $ | 16,043 |
| $ | 27,744 |
|
Amounts representing interest |
| 315 |
|
|
| ||
Capital lease obligations |
| 15,728 |
|
|
| ||
Current portion of capital lease obligations |
| 7,688 |
|
|
| ||
Capital lease obligations, net of current portion |
| $ | 8,040 |
|
|
| |
13. Legal and Regulatory Contingencies
There has been a consolidated class action law suit filed in the United States District Court for the Eastern District of Pennsylvania against the Company and certain of its current and former officers entitled In Re UniTek Global Services, Inc. Securities Litigation, Civil Action NO. 13-2119. The case alleges that the Company made misstatements and omissions regarding its business, its financial condition and its internal controls and systems in violation of the Sections 10(b) and 20(a) of the Securities Exchange Act of 1934 and Rule 10b-5 thereunder. Subject to certain limitations, the Company is obligated to indemnify its current and former officers in connection with any regulatory or litigation matter. This obligation arises under the terms of the Company’s Amended and Restated Articles of Incorporation, the Company’s Amended and Restated Bylaws and Delaware law. An obligation to indemnify generally means that the Company is required to pay or reimburse the individual’s reasonable legal expenses and possibly damages and other liabilities that may be incurred. The Company believes that it is likely that any potential loss exposure above its deductible of $0.3 million would be covered under the related insurance policies. No costs related to these indemnifications were recorded in 2012, 2011 or 2010.
The Company also is involved in certain other legal and regulatory actions from time to time which arise in the ordinary course of the Company’s business. The Company accrues for such matters when it is probable a liability has been incurred and the amount of loss can be reasonably estimated. The Company is unable to predict the outcome of these matters, but does not believe that the ultimate resolution of such matters will have a material adverse effect on the consolidated financial position, results of operations or cash flows of the Company. However, if certain of such matters were determined adversely to the Company, although the ultimate liability arising therefrom would not be material to the financial position of the Company, it could be material to its results of operations in an individual quarterly or annual period.
14. Related-Party Transactions
The Company adheres to policies and procedures for the review, approval, and ratification of related-party transactions to ensure that any such transactions are fair, reasonable and in the Company’s best interest. All significant relationships and transactions are separately identified by management if they meet the definition of a related party or a related-party transaction. Related-party transactions include transactions that have occurred or are currently proposed in which the Company was or will be a participant and in which any related person had or will have a direct or indirect material interest. All related-party transactions are reviewed, approved and documented by the appropriate level of the Company’s management and Board of Directors in accordance with these policies and procedures.
UNITEK GLOBAL SERVICES, INC. AND SUBSIDIARIES
Notes to Consolidated Financial Statements
15. Stockholders’ Equity
The Company is authorized to issue 220 million shares, consisting of (i) 200 million shares of common stock, par value $0.00002 per share and (ii) 20 million shares of preferred stock, par value $0.00002 per share.
On January 27, 2010, Berliner and Holdings entered into the Merger Agreement. Pursuant to the terms and conditions of the Merger Agreement, each outstanding share of the common stock of Holdings was converted into the right to receive shares of the Company’s common stock at an effective exchange ratio of one-to-one, pursuant to the terms of the Merger Agreement. In addition, each share of Series A preferred stock of Holdings was converted into the right to receive 0.02 shares of Series B Preferred.
In January 2010, the Company issued 250,000 shares of its Series B Convertible Preferred Stock for aggregate proceeds of $12.5 million. Upon issuance, the Series B Preferred had an optional conversion feature to common stock, such that the initial conversion ratio was 50 shares of common stock for each share of Series B Preferred, subject to standard anti-dilution adjustments. In addition, in the event of liquidation, dissolution or winding up of the Company, the Series B Preferred had a liquidation preference. As a result of the occurrence of a deemed liquidation event in connection with the Company’s underwritten public offering in November 2010 (the “Equity Offering”), the carrying value of the Series B Preferred was adjusted to its maximum redemption amount, or Liquidation Preference, through an accretion charge of $13.3 million to equity.
In connection with the Equity Offering, the Company entered into an agreement with the holders of the Series B Preferred to satisfy the liquidation preference that the Series B Preferred holders were entitled to as a result of the offering by issuing to those holders shares of common stock. The parties agreed that the fair value of the common stock for purposes of the satisfaction of the Liquidation Preference would be defined as the public offering price in the Equity Offering of $9.50, less a 6.5% discount, which resulted in the issuance of approximately 3.0 million shares of common stock in exchange for all outstanding shares of Series B Preferred. The fair value of the discount was $1.8 million, which was recorded as a deemed dividend on the Series B Preferred. Both the accretion charge of $13.3 million and the deemed dividend of $1.8 million have been treated as increases to net loss in the statement of comprehensive income or loss for the year ended December 31, 2010 in order to arrive at net loss attributable to common stockholders.
On November 16, 2010, the Company completed an underwritten public offering of 9.5 million shares of common stock at a price of $9.50 per share, and on December 6, 2010, the Company sold an additional 225,284 shares of common stock at a price of $9.50 per share arising from the underwriters’ partial exercise of their over-allotment option. After deducting underwriting fees and offering costs, the Company generated net proceeds of approximately $84.4 million. The Company used the net proceeds from the Equity Offering to repay approximately $64.0 million of indebtedness, with the remaining net proceeds to be used for general corporate purposes, including for working capital to support the execution of the Company’s backlog. The Company incurred costs of approximately $1.5 million, excluding underwriters’ fees, which were reclassified to additional paid-in-capital upon the closing of the Equity Offering.
Warrants
The following table presents outstanding warrants to purchase shares of the Company’s common stock as of December 31, 2012:
Issued to |
| Shares |
| Grant Date |
| Expiration Date |
| Weighted |
| |
UniTek employees |
| 11,384 |
| September 26, 2007 |
| September 26, 2017 |
| $ | 140.00 |
|
Former owners of UniTek Holdings |
| 77,902 |
| September 26, 2007 |
| September 26, 2017 |
| 140.00 |
| |
Former owners of acquired broadband cable business |
| 2,456 |
| December 2, 2010 |
| December 2, 2020 |
| 56.00 |
| |
Total |
| 91,742 |
|
|
|
|
| 137.75 |
| |
During the years ended December 31, 2012 and 2011, no warrants to purchase shares were exercised, and there were no new issuances of warrants.
In July 2013, the Company issued 3.8 million warrants to its lenders in connection with a refinancing of its debt. See Notes 10 and 22 for further information.
UNITEK GLOBAL SERVICES, INC. AND SUBSIDIARIES
Notes to Consolidated Financial Statements
16. Stock-Based Compensation
As of December 31, 2012, the Company sponsored three stock-based compensation plans; the 1999 Securities Plan (the “1999 Plan”), the 2007 Equity Incentive Plan (the “2007 Plan”) and the 2009 Omnibus Securities Plan (the “2009 Plan”) (collectively, the “Plans”).
The Plans provide for the grant of RSUs, stock options and certain other stock-based instruments. As of December 31, 2012, a total of 1.8 million shares of the Company’s common stock had been authorized for issuance under the 2009 Plan, of which 0.6 million shares remain eligible for the grant of awards. There were no remaining shares authorized or eligible for grant under the 1999 Plan or the 2007 Plan.
The Plans are administered by the Compensation Committee of the Board of Directors or by one or more committees of the Board of Directors as designated. The administrator of the Plans and its authorized delegates have the authority to select the persons to whom awards may be granted, the number, type and value of awards and the terms and conditions of awards. Stock options expire no later than ten years after the date the stock option is granted.
Participation in the Plans is limited to employees, directors and consultants. The plan administrator, in its sole discretion, will determine which participants are eligible to participate in the Plans.
An award under the Plans will become vested only if the vesting conditions set forth in the award agreement are satisfied. The vesting conditions include performance of services for a specified period. In granting performance-based awards, which are regulated by Section 162(m) of the Internal Revenue Code, the plan administrator is bound to follow the criteria established under the 2007 Plan. Generally, options vest over a three to five-year period. Upon a change of control as defined under the 2007 Plan and subject to approval of the Board of Directors, all of the outstanding awards could immediately vest. As of December 31, 2012, the Board of Directors had made no such election. Upon a change of control as defined under the 2009 Plan, the Plan automatically terminates unless provision is made for continuation of the Plan and for the assumption or continuance of the awards.
Unless terminated earlier by the Board of Directors, the 2007 Plan will terminate on September 25, 2017, and the 1999 and 2009 plans will terminate on September 24, 2019.
During the years ended December 31, 2012, 2011, and 2010 the Company incurred stock-based compensation expense of $4.9 million, $5.1 million, and $2.0 million, respectively, as a component of selling, general and administrative expense. Stock-based compensation expense for the year ended December 31, 2012 included $2.6 million for the acceleration of RSU vesting related to the separations of the Chief Executive Officer, Executive Chairman, Chief Administrative Officer and Chief Information Officer as well as accelerated vesting of director RSUs. Stock-based compensation expense for the year ended December 31, 2011 included $2.3 million related to the modification of prior stock options exchanged in connection with the tender offer discussed below.
As of December 31, 2012, there was $2.9 million of total unrecognized compensation cost related to non-vested stock-based compensation arrangements. That cost is expected to be recognized over a weighted-average period of 1.7 years.
UNITEK GLOBAL SERVICES, INC. AND SUBSIDIARIES
Notes to Consolidated Financial Statements
Tender Offer
On December 9, 2010, the Company commenced a tender offer to exchange, for RSUs or replacement options, certain eligible options then outstanding under the following stock option plans: (i) the 1999 Plan; (ii) the 2007 Plan; and (iii) the 2009 Plan. Eligible options fell within one of the following three groups: (i) non-Homerun Portion (as defined below) stock options that were granted under the 2007 Plan and were vested as of December 31, 2010 (“Group 1”); (ii) non-Homerun Portion stock options that were unvested as of December 31, 2010 and any Homerun Portion stock options (whether vested or unvested) that were granted under the 2007 Plan (“Group 2”); and (iii) vested and unvested stock options granted under the 1999 Plan and the 2009 Plan (“Group 3”). The “Homerun Portion” of a 2007 Plan stock option grant was the 40% portion of each stock option grant, whether vested or unvested, that becomes exercisable (at its then current exercise price) only if and when the fair value of the Company’s common stock is at least $168.00 per share.
Each tendered eligible option was cancelled in exchange for either a grant of RSUs or a replacement option, depending on whether the tendered eligible option was in Group 1, Group 2 or Group 3. In exchange for each tendered eligible option in Group 1 and Group 3, the holder was granted a replacement option with an exercise price per share equal to the fair value of the Company’s common stock on the first business day following the expiration of the tender offer, January 10, 2011. Except for the exercise price and the date of grant, all other material terms and provisions (including post-termination exercise periods) of the eligible options remained unchanged. In exchange for the tender of all eligible options in Group 2, each holder received a grant of RSUs under the 2009 Plan.
The tender offer expired on January 7, 2011, and pursuant to the tender offer, eligible options to purchase an aggregate of 296,833 shares of the Company’s common stock were validly tendered and not withdrawn, and the Company accepted for repurchase these eligible options. The holders of eligible options who validly tendered eligible options received an aggregate of 688,976 RSUs and 96,204 replacement options, repriced at an exercise price of $9.42 per share. For more information, refer to the Company’s Tender Offer Statement on Schedule TO, as filed with the SEC on December 9, 2010, as amended on December 28, 2010 and January 10, 2011. The Company issued an additional 74,202 RSUs on January 10, 2011 to eligible employees and members of the Board of Directors who were not eligible to participate in the tender offer or that did not hold any Group 2 options.
The Company accounted for the tender offer as a modification of the existing stock options. For Group 1 and Group 3 vested options, the Company recorded stock-based compensation expense of $0.4 million expense in the quarter ended April 2, 2011 for the aggregate difference between the fair value of the stock options before and after the modification. For Group 2 options, the Company recorded $1.9 million of stock-based compensation expense in the quarter ended April 2, 2011 for the incremental fair value of the replacement RSUs and the amortization of the unrecognized original grant date fair value of the stock options tendered in the exchange.
Plan Activity
The following table presents the changes in stock options, RSUs and restricted shares:
|
| Stock Options |
| RSUs |
| Restricted Shares |
| |||||||||
|
| Shares |
| Weighted |
| Shares |
| Weighted |
| Shares |
| Weighted |
| |||
Outstanding at December 31, 2011 |
| 89,291 |
| $ | 10.28 |
| 487,726 |
| $ | 9.46 |
| — |
| $ | — |
|
Granted |
| — |
| — |
| 388,195 |
| 3.80 |
| 192,307 |
| 2.60 |
| |||
Exercised / Vested |
| — |
| — |
| (582,455 | ) | 7.16 |
| — |
| — |
| |||
Cancelled / Forfeited |
| (56,314 | ) | 10.19 |
| (61,894 | ) | 8.07 |
| — |
| — |
| |||
Outstanding at December 31, 2012 |
| 32,977 |
| 10.42 |
| 231,572 |
| 6.12 |
| 192,307 |
| 2.60 |
| |||
UNITEK GLOBAL SERVICES, INC. AND SUBSIDIARIES
Notes to Consolidated Financial Statements
The following table presents the weighted average grant date fair value of stock options, RSUs and restricted shares granted:
|
| Year Ended December 31, |
| |||||||
|
| 2012 |
| 2011 |
| 2010 |
| |||
|
|
|
|
|
|
|
| |||
Stock options |
| $ | — |
| $ | 9.42 |
| $ | — |
|
RSUs |
| 3.80 |
| 9.45 |
| — |
| |||
Restricted shares |
| 2.60 |
| — |
| — |
| |||
At December 31, 2012, substantially all options outstanding were vested and exercisable with a weighted-average remaining contractual life of 5.1 years and no intrinsic value. The fair value of RSUs vested during the years ended December 31, 2012 and 2011 was $1.9 million and $2.8 million, respectively. Upon vesting or exercise of awards, the Company’s policy is to issue new common shares to the holder.
Long-Term Incentive Plan
The Company sponsors a Long-Term Incentive Plan (“LTI Plan”) as part of a broader compensation plan for participating senior executives of the Company. Under the LTI Plan, each participant shall receive an annual target grant of RSUs, valued as a percentage of the participant’s base salary, that consists 50% of time-vested RSUs that vest in equal annual installments over the four-year period following the date of grant, and 50% of performance-vested RSUs that vest at the end of a three-year period following the date of grant, based upon the achievement of annual performance conditions established by the Compensation Committee of the Board of Directors for each year during the grant period. The number of performance-vested RSUs ultimately earned will vary based on achievement with respect to each of the established annual performance targets. In this regard, if achievement of the target goal is at less than 90%, no performance-based RSUs will be earned. If achievement is between 90% and 100% of target, then the number of RSUs earned will be prorated from 50% (at 90% achievement) to 100% (at 100% achievement) of the initial grant. If achievement is over 100% of target, then the number of RSUs earned will be increased commensurate with the percentage of achievement over target, with a maximum award of 150% of the initial grant.
In connection with the LTI Plan, the Company issued 268,509 RSUs during the year ended December 31, 2012.
Other Activity
On July 16, 2012, Rocco Romanella joined the Company as Chief Executive Officer and was granted 192,307 non-plan restricted shares of the common stock of the Company, which are subject to service-based vesting in equal semi-annual installments over the two-year period following the grant date. Additionally, members of the Board of Directors received a total of 171,422 RSUs as a portion of their compensation for their service on the Board for 2012.
During the year ended December 31, 2012, 82,671 RSUs awarded to the Company’s employees vested as scheduled, and the Company directors vested in 226,953 RSUs. In addition, the Company’s Chief Executive Officer, Executive Chairman, Chief Administrative Officer and Chief Information Officer left the Company and entered into agreements entitling them to the immediate vesting of 107,143 RSUs, 75,000 RSUs, 56,543 RSUs and 34,145 RSUs, respectively.
��
UNITEK GLOBAL SERVICES, INC. AND SUBSIDIARIES
Notes to Consolidated Financial Statements
17. Income Taxes
The following table presents the components of income or loss from continuing operations before income taxes:
|
| Year Ended December 31, |
| |||||||
(in thousands) |
| 2012 |
| 2011 |
| 2010 |
| |||
|
|
|
| (Restated) |
|
|
| |||
|
|
|
|
|
|
|
| |||
United States |
| $ | (39,058 | ) | $ | (5,977 | ) | $ | (27,219 | ) |
Foreign |
| (60 | ) | (280 | ) | (181 | ) | |||
Loss from continuing operations before income taxes |
| $ | (39,118 | ) | $ | (6,257 | ) | $ | (27,400 | ) |
The following table presents the components of income tax expense or benefit:
|
| Year Ended December 31, |
| |||||||
(in thousands) |
| 2012 |
| 2011 |
| 2010 |
| |||
|
|
|
| (Restated) |
|
|
| |||
Current income tax expense: |
|
|
|
|
|
|
| |||
Federal |
| $ | — |
| $ | 223 |
| $ | — |
|
Foreign |
| 313 |
| 55 |
| 65 |
| |||
State |
| 160 |
| 692 |
| 43 |
| |||
Total |
| 473 |
| 970 |
| 108 |
| |||
Deferred income tax expense (benefit): |
|
|
|
|
|
|
| |||
Federal |
| 143 |
| 85 |
| 336 |
| |||
Foreign |
| (304 | ) | (21 | ) | — |
| |||
State |
| 41 |
| 18 |
| 84 |
| |||
Total |
| (120 | ) | 82 |
| 420 |
| |||
Income tax expense |
| $ | 353 |
| $ | 1,052 |
| $ | 528 |
|
The following table presents the components of deferred tax assets, net and deferred tax liabilities:
|
| December 31, |
| ||||
(in thousands) |
| 2012 |
| 2011 |
| ||
|
|
|
| (Restated) |
| ||
Deferred tax assets, net: |
|
|
|
|
| ||
Net operating losses |
| $ | 35,000 |
| $ | 27,448 |
|
Depreciation and amortization |
| 21,616 |
| 18,352 |
| ||
Accrued liabilities |
| 11,550 |
| 7,448 |
| ||
Goodwill |
| 11,199 |
| 2,542 |
| ||
Stock-based compensation |
| 676 |
| 977 |
| ||
Other |
| 979 |
| 737 |
| ||
Deferred tax assets, gross |
| 81,020 |
| 57,504 |
| ||
Valuation allowance |
| (79,655 | ) | (53,576 | ) | ||
Deferred tax assets, net |
| $ | 1,365 |
| $ | 3,928 |
|
|
|
|
|
|
| ||
Deferred tax liabilities: |
|
|
|
|
| ||
Goodwill |
| $ | 706 |
| $ | 5,511 |
|
Contingent consideration |
|
| — |
|
| 3,360 |
|
Deferred tax liabilities |
| $ | 706 |
| $ | 8,871 |
|
During the years ended December 31, 2012 and 2011, the valuation allowance for deferred tax assets increased by $26.1 million and decreased by $1.5 million, respectively.
UNITEK GLOBAL SERVICES, INC. AND SUBSIDIARIES
Notes to Consolidated Financial Statements
Because the Company has not yet achieved profitable operations outside of Canada, the Company determined that its non-Canadian deferred tax assets do not satisfy the criteria for realizability and established a full valuation allowance for such assets. Additionally, for tax purposes, certain goodwill is being amortized. In periods when the book basis of tax deductible goodwill exceeds its tax basis, the Company records a deferred tax liability because the basis difference will not reverse within the periods that the Company’s deferred tax assets will be recognized.
The following table presents the reconciliation of income tax expense or benefit as calculated using the U.S. statutory federal income tax rate of 35% to income tax expense or benefit:
|
| Year Ended December 31, |
| |||||||
(in thousands) |
| 2012 |
| 2011 |
| 2010 |
| |||
|
|
|
|
|
|
|
| |||
Income tax benefit at U.S. statutory federal rate |
| $ | (13,691 | ) | $ | (2,190 | ) | $ | (9,590 | ) |
Shortfall of tax benefit on stock-based compensation |
| 953 |
| 88 |
| — |
| |||
Nondeductible expenses |
| 2,076 |
| 716 |
| 793 |
| |||
Provision to return adjustment |
| (195 | ) | 414 |
| (510 | ) | |||
Change in blended state rate |
| (1,043 | ) | 1,797 |
| (1,330 | ) | |||
Change in valuation allowance |
| 15,106 |
| (481 | ) | 12,313 |
| |||
Other |
| (2,853 | ) | 708 |
| (1,148 | ) | |||
Income tax expense |
| $ | 353 |
| $ | 1,052 |
| $ | 528 |
|
At December 31, 2012 and 2011, the Company had federal net operating loss carryforwards of approximately $86.6 million and $69.3 million, respectively, which begin to expire in 2014 and will be fully expired in 2032. The Company has experienced an ownership change as defined under Section 382 of the Internal Revenue Code and therefore the use of the net operating loss carry forwards is subject to limitation.
Uncertain Tax Positions
As of December 31, 2011, the Company had accrued $0.9 million in federal and state taxes, interest and penalties, substantially all of which had been settled as of December 31, 2012. The Company’s tax returns for the years ended December 31, 2008 through December 31, 2011 are still subject to examination by tax jurisdictions.
UNITEK GLOBAL SERVICES, INC. AND SUBSIDIARIES
Notes to Consolidated Financial Statements
18. Discontinued Operations
On December 28, 2012, the Company entered into an Asset Purchase Agreement (the “Wireline Sale Agreement”) to sell substantially all of the assets of the wireline telecommunications business (the “Wireline Group”) to NX Utilities, LLC (“NX Utilities”). Further, our former executive who previously headed the Wireline Group, is now a minority owner of NX Utilities and he left the Company following the transaction.
The total value of the Wireline Group’s assets (less liabilities transferred) that were sold under the Wireline Sale Agreement was estimated at $6.9 million as of the effective date of the agreement. As outlined in the Wireline Sale Agreement, the Company will transfer to NX Utilities the Wireline Group’s assets (less applicable liabilities) to NX Utilities in two stages, the first stage of which occurred on December 28, 2012 and the second stage occurred on March 2, 2013. At the request of NX Utilities, the Company continued to operate certain markets of the Wireline Group through the second stage of the closing. However, under the terms of the Wireline Sale Agreement, the Company did not bear the risk and rewards of these assets subsequent to the effective date of the agreement. Therefore, these assets were included in the sale as of December 31, 2012.
The purchase price for the assets sold (less liabilities transferred), subject to certain adjustments, under the Wireline Sale Agreement was $5.9 million, and was payable to the Company in two installments. The first installment of $5.4 million was due upon the closing of the Wireline Sale Agreement and was collected by the Company at December 28, 2012. The second installment of $0.5 million was held in escrow until the second stage of the asset transfers between the Company and NX Utilities. As of December 31, 2012, the Company reported the second installment of the purchase price as a receivable in prepaid expenses and other current assets in the consolidated balance sheet.
The Company also retained certain working capital assets (mainly receivables) of the Wireline Group in lieu of additional cash consideration. The value of these working capital assets as of December 31, 2012 is approximately $4.1 million.
On July 15, 2013, NX Utilities submitted a request to reconcile and resolve the final payment due associated with the Wireline Sale Agreement including transactions that had occurred subsequent to the sale. The claim related to the Wireline Group’s assets (less liabilities transferred) that were transferred by the Company to NX Utilities in December 2012, and the Company has recorded its best estimate of the liability to the buyers. The Company believes that neither this liability nor any additional liability that may result from the final reconciliation is material to its financial position or results of operations.
The Wireline Group was previously reported as part of the Engineering and Construction segment, and as a result of this transaction, its results of operations have been reclassified as discontinued operations for all periods presented. The discontinued operations for the year ended December 31, 2012 included pre-tax impairment charges of $35.2 million related to the impairments of the Wireline Group’s goodwill and property and equipment and the preliminary loss related to the sale of the Wireline Group for approximately $1.0 million.
The following table presents the results of discontinued operations:
|
| Year Ended December 31, |
| |||||||
(in thousands) |
| 2012 |
| 2011 |
| 2010 |
| |||
|
|
|
|
|
|
|
| |||
Revenues |
| $ | 48,692 |
| $ | 76,741 |
| $ | 60,144 |
|
(Loss) income from discontinued operations before income taxes |
| (43,739 | ) | 1,411 |
| (1,279 | ) | |||
Income tax (benefit) expense from discontinued operations |
| (5,480 | ) | 3,237 |
| 1,374 |
| |||
Loss from discontinued operations |
| $ | (38,259 | ) | $ | (1,826 | ) | $ | (2,653 | ) |
UNITEK GLOBAL SERVICES, INC. AND SUBSIDIARIES
Notes to Consolidated Financial Statements
19. Restructuring
During 2012, the Company made changes to its management structure in order to reposition executive resources from non-core activities to support the continued growth in wireless and fulfillment services. Restructuring charges of $8.0 million for the year ended December 31, 2012 resulted from the separation of our former Chief Executive Officer and Chief Information Officer and the elimination of certain management positions including the Executive Chairman and the Chief Administrative Officer. The majority of costs associated with those activities were incurred during the year ended December 31, 2012, with minimal additional costs expected in future periods, although future payments of approximately $2.8 million are expected to occur primarily in 2013. Additionally, the former General Counsel separated from the Company in March 2013, resulting in an additional $0.6 million of severance costs payable in 2013 and 2014.
During 2010, the Company incurred $1.0 million of restructuring charges (of which $0.9 million was paid in 2011 and the balance was paid in 2012) related to the merger with Berliner, consisting primarily of termination and severance costs for former Berliner executive management and regional leadership as part of the realignment of operations.
The following table presents the changes in accrued restructuring costs:
(in thousands) |
| One-Time |
| Other |
| Total |
| |||
|
|
|
|
|
|
|
| |||
Balance at December 31, 2011 |
| $ | — |
| $ | — |
| $ | — |
|
Restructuring charges: |
|
|
|
|
|
|
| |||
Continuing operations |
| 6,077 |
| 1,936 |
| 8,013 |
| |||
Discontinued operations |
| 279 |
| — |
| 279 |
| |||
Amounts paid |
| (3,544 | ) | (1,936 | ) | (5,480 | ) | |||
Balance at December 31, 2012 |
| $ | 2,812 |
| $ | — |
| $ | 2,812 |
|
The amounts reflected in the table as “Other” represent charges and payments related to the search for the Company’s new Chief Executive Officer and amounts paid to management to continue employment with the Company through the conclusion of that search.
UNITEK GLOBAL SERVICES, INC. AND SUBSIDIARIES
Notes to Consolidated Financial Statements
20. Segment Reporting
The Company reports its results in two segments based on the services that it provides and the industries that it serves. The Fulfillment segment provides comprehensive installation and fulfillment services to companies in the satellite television and broadband cable industries and represents the aggregation of the satellite and broadband cable operating segments of the Company. Revenues in this segment are primarily recurring in nature and are based on predetermined rates for each type of service performed. The Engineering and Construction segment provides infrastructure services, systems integration for public safety and land mobile radio applications, construction and project management services to customers in the wireless telecommunications and public safety industries. Revenues in this segment are primarily contract-based ranging in duration to as much as three years and are recognized primarily using the percentage-of-completion method using estimated costs incurred to-date or milestones achieved to measure progress towards completion. Transactions within and between segments are generally made on a basis to reflect the market value of the services and have been eliminated in consolidation.
As described in Note 18, during the year ended December 31, 2012, the Company sold the net assets of the Wireline Group. As a result, its results of operations have been excluded from the reported results of the Engineering and Construction segment, and segment information for prior periods has been restated to reflect the discontinued operation classification.
The Company evaluates the performance of its operating segments based on several factors of which the primary financial measure is segment EBITDA. Management believes segment operating income or loss represents the closest GAAP measure to segment EBITDA.
The following table presents selected segment financial information for the year ended December 31, 2012:
(in thousands) |
| Fulfillment |
| Engineering & |
| Total |
| |||
|
|
|
|
|
|
|
| |||
Revenues |
| $ | 305,307 |
| $ | 132,289 |
| $ | 437,596 |
|
Cost of revenues |
| 243,503 |
| 113,291 |
| 356,794 |
| |||
Gross profit |
| 61,804 |
| 18,998 |
| 80,802 |
| |||
Selling, general and administrative expenses |
| 27,276 |
| 19,081 |
| 46,357 |
| |||
Income (expense) related to contingent consideration |
| (381 | ) | 10,477 |
| 10,096 |
| |||
Restructuring charges |
| 5,222 |
| 2,791 |
| 8,013 |
| |||
Impairment charges |
| — |
| 14,900 |
| 14,900 |
| |||
Depreciation and amortization |
| 19,615 |
| 6,854 |
| 26,469 |
| |||
Operating income (loss) |
| $ | 10,072 |
| $ | (35,105 | ) | $ | (25,033 | ) |
Interest expense, net |
|
|
|
|
| 15,329 |
| |||
Other income, net |
|
|
|
|
| (1,244 | ) | |||
Loss from continuing operations before income taxes |
|
|
|
|
| $ | (39,118 | ) | ||
|
|
|
|
|
|
|
| |||
Acquisition of property and equipment: |
|
|
|
|
|
|
| |||
Continuing operations |
| $ | 2,269 |
| $ | 2,368 |
| $ | 4,637 |
|
Discontinued operations |
| — |
| 1,005 |
| 1,005 |
| |||
Total |
| $ | 2,269 |
| $ | 3,373 |
| $ | 5,642 |
|
UNITEK GLOBAL SERVICES, INC. AND SUBSIDIARIES
Notes to Consolidated Financial Statements
The following table presents selected segment financial information for the year ended December 31, 2011:
(in thousands) |
| Fulfillment |
| Engineering & |
| Total |
| |||
|
| (Restated) |
| (Restated) |
| (Restated) |
| |||
|
|
|
|
|
|
|
| |||
Revenues |
| $ | 286,734 |
| $ | 64,722 |
| $ | 351,456 |
|
Cost of revenues |
| 219,749 |
| 60,229 |
| 279,978 |
| |||
Gross profit |
| 66,985 |
| 4,493 |
| 71,478 |
| |||
Selling, general and administrative expenses |
| 29,173 |
| 16,056 |
| 45,229 |
| |||
Income related to contingent consideration |
| — |
| (8,506 | ) | (8,506 | ) | |||
Depreciation and amortization |
| 17,991 |
| 6,300 |
| 24,291 |
| |||
Operating income (loss) |
| $ | 19,821 |
| $ | (9,357 | ) | $ | 10,464 |
|
Interest expense, net |
|
|
|
|
| 13,863 |
| |||
Loss on extinguishment of debt |
|
|
|
|
| 3,466 |
| |||
Other income, net |
|
|
|
|
| (608 | ) | |||
Loss from continuing operations before income taxes |
|
|
|
|
| $ | (6,257 | ) | ||
|
|
|
|
|
|
|
| |||
Acquisition of property and equipment: |
|
|
|
|
|
|
| |||
Continuing operations |
| $ | 2,759 |
| $ | 1,578 |
| $ | 4,337 |
|
Discontinued operations |
| — |
| 1,486 |
| 1,486 |
| |||
Total |
| $ | 2,759 |
| $ | 3,064 |
| $ | 5,823 |
|
The following table presents selected segment financial information for the year ended December 31, 2010:
(in thousands) |
| Fulfillment |
| Engineering & |
| Total |
| |||
|
|
|
|
|
|
|
| |||
Revenues |
| $ | 270,009 |
| $ | 75,513 |
| $ | 345,522 |
|
Cost of revenues |
| 217,939 |
| 66,305 |
| 284,244 |
| |||
Gross profit |
| 52,070 |
| 9,208 |
| 61,278 |
| |||
Selling, general and administrative expenses |
| 23,911 |
| 12,939 |
| 36,850 |
| |||
Restructuring charges |
| — |
| 991 |
| 991 |
| |||
Depreciation and amortization |
| 21,784 |
| 3,409 |
| 25,193 |
| |||
Operating income (loss) |
| $ | 6,375 |
| $ | (8,131 | ) | $ | (1,756 | ) |
Interest expense, net |
|
|
|
|
| 23,967 |
| |||
Loss on extinguishment of debt |
|
|
|
|
| 1,677 |
| |||
Other income, net |
|
|
|
|
| — |
| |||
Loss from continuing operations before income taxes |
|
|
|
|
| $ | (27,400 | ) | ||
|
|
|
|
|
|
|
| |||
Acquisition of property and equipment: |
|
|
|
|
|
|
| |||
Continuing operations |
| $ | 1,872 |
| $ | 1,635 |
| $ | 3,507 |
|
Discontinued operations |
| — |
| 395 |
| 395 |
| |||
Total |
| $ | 1,872 |
| $ | 2,030 |
| $ | 3,902 |
|
At December 31, 2012, the total assets of the Fulfillment segment and the Engineering and Construction segment were $193.0 million and $133.4 million, respectively, compared to $181.1 million and $162.2 million at December 31, 2011, respectively. The increase of $11.9 million in the Fulfillment segment was driven by the acquisition of Skylink, the Cable Acquisitions, and capital additions, partially offset by depreciation and amortization. The decrease of $28.8 million in the Engineering and Construction segment was driven by the impairment of property and equipment and goodwill of the Wireline Group, the subsequent sale of the Wireline Group and depreciation and amortization, partially offset by increases in working capital in the wireless business and capital additions. As of December 31, 2012 and 2011, approximately $5.3 million and $5.8 million, respectively, of the Company’s assets related to its Canadian operations.
During the years ended December 31, 2012, 2011, and 2010, the Company derived approximately $15.4 million, $15.0 million and $16.6 million of its revenues, respectively, from customers located in Canada. All of the revenue derived from outside of the United States was within the Fulfillment segment.
UNITEK GLOBAL SERVICES, INC. AND SUBSIDIARIES
Notes to Consolidated Financial Statements
21. Unaudited Quarterly Financial Information
The following tables present unaudited consolidated quarterly financial information for each of the quarters in 2012 and 2011:
|
| Three Months Ended |
| ||||||||||
(in thousands) |
| March 31, |
| June 30, |
| September 29, |
| December 31, |
| ||||
|
| (Restated) |
| (Restated) |
| (Restated) |
|
|
| ||||
|
|
|
|
|
|
|
|
|
| ||||
Revenues |
| $ | 86,139 |
| $ | 100,046 |
| $ | 130,482 |
| $ | 120,929 |
|
Gross profit |
| 12,723 |
| 18,629 |
| 27,658 |
| 21,792 |
| ||||
(Loss) income from continuing operations before income taxes |
| (21,160 | ) | (3,394 | ) | 4,457 |
| (19,021 | ) | ||||
Net loss |
| (23,021 | ) | (5,454 | ) | (26,609 | ) | (22,646 | ) | ||||
Net loss per share — basic and diluted |
| (1.39 | ) | (0.29 | ) | (1.42 | ) | (1.20 | ) | ||||
|
| Three Months Ended |
| ||||||||||
(in thousands) |
| April 2, |
| July 2, |
| October 1, |
| December 31, |
| ||||
|
|
|
| (Restated) |
| (Restated) |
| (Restated) |
| ||||
|
|
|
|
|
|
|
|
|
| ||||
Revenues |
| $ | 75,581 |
| $ | 83,554 |
| $ | 99,359 |
| $ | 92,962 |
|
Gross profit |
| 13,084 |
| 18,528 |
| 21,283 |
| 18,583 |
| ||||
(Loss) income from continuing operations before income taxes |
| (7,269 | ) | (7,466 | ) | 14,254 |
| (5,776 | ) | ||||
Net (loss) income |
| (7,875 | ) | (7,710 | ) | 13,672 |
| (7,222 | ) | ||||
Net (loss) income per share — basic and diluted |
| (0.52 | ) | (0.48 | ) | 0.84 |
| (0.44 | ) | ||||
During the three months ended December 31, 2012, the Company sold the Wireline Group resulting in a loss on sale of $1.0 million, which was included in loss from discontinued operations and discussed further at Note 18. In addition, the Company incurred restructuring charges of $1.6 million, described further at Note 19, and goodwill impairment charges of $14.9 million, described further at Note 11.
The Company uses a fiscal quarterly calendar based on a four week, four week and five week basis consistently in all periods presented.
UNITEK GLOBAL SERVICES, INC. AND SUBSIDIARIES
Notes to Consolidated Financial Statements
Restatement of Unaudited Interim Condensed Consolidated Financial Statements
As discussed further in Note 2, the Company has restated its interim condensed consolidated financial statements as of and for the quarterly and year-to-date periods ended September 29, 2012, June 30, 2012, March 31, 2012, December 31, 2011, October 1, 2011 and July 2, 2011 (the “Restated Quarterly Periods”).
As discussed further in Note 2, it was determined that fraudulent activities at the Company’s Pinnacle Wireless subsidiary resulted in improper revenue recognition that affected the results of previously filed interim financial information. The aggregate impact of these revenue and related adjustments to previously filed interim financial information is presented in the following tables:
|
| Three Months Ended |
| ||||||||||||||||
(in thousands) |
| September 29, |
| June 30, |
| March 31, |
| December 31, |
| October 1, |
| July 2, |
| ||||||
|
| (Unaudited) |
| (Unaudited) |
| (Unaudited) |
| (Unaudited) |
| (Unaudited) |
| (Unaudited) |
| ||||||
Increase (decrease) to: |
|
|
|
|
|
|
|
|
|
|
|
|
| ||||||
Revenues |
| $ | 1,416 |
| $ | (4,551 | ) | $ | (7,380 | ) | $ | (3,387 | ) | $ | (2,603 | ) | $ | (1,203 | ) |
Cost of revenues |
| 2,247 |
| (1,342 | ) | (2,940 | ) | (731 | ) | (547 | ) | (157 | ) | ||||||
(in thousands) |
| September 29, |
| June 30, |
| March 31, |
|
|
| October 1, |
| July 2, |
| |||||
|
| (Unaudited) |
| (Unaudited) |
| (Unaudited) |
|
|
| (Unaudited) |
| (Unaudited) |
| |||||
Increase (decrease) to: |
|
|
|
|
|
|
|
|
|
|
|
|
| |||||
Accounts receivable, net |
| $ | (12,880 | ) | $ | (19,124 | ) | $ | (14,573 | ) |
|
| $ | (3,805 | ) | $ | (1,203 | ) |
Inventories |
| 1,266 |
| 1,152 |
| 631 |
|
|
| — |
| — |
| |||||
Prepaid expenses and other current assets |
| 500 |
| — |
| — |
|
|
| — |
| — |
| |||||
Accounts payable |
| (2,339 | ) | (5,034 | ) | (4,032 | ) |
|
| (863 | ) | (257 | ) | |||||
Other liabilities |
| 5,462 |
| 470 |
| 288 |
|
|
| 158 |
| 100 |
| |||||
Accumulated deficit |
| 14,237 |
| 13,408 |
| 10,198 |
|
|
| 3,100 |
| 1,046 |
| |||||
UNITEK GLOBAL SERVICES, INC. AND SUBSIDIARIES
Notes to Consolidated Financial Statements
As part of its restatement, the Company also identified certain other errors affecting the previously filed interim financial information. The following summarizes those errors:
· As a result of the aforementioned errors, the Company’s quarterly fair value estimates of contingent consideration for the Pinnacle acquisition, including the fair value of equity transferred, were not performed correctly. The impact of this adjustment is shown on the following tables:
|
| Three Months Ended |
| |||||||||||||
(in thousands) |
| June 30, |
| March 31, |
| December 31, |
| October 1, |
| July 2, |
| |||||
|
| (Unaudited) |
| (Unaudited) |
| (Unaudited) |
| (Unaudited) |
| (Unaudited) |
| |||||
Favorable (unfavorable) change to: |
|
|
|
|
|
|
|
|
|
|
| |||||
Income or expense related to contingent consideration |
| $ | (2,067 | ) | $ | (8,734 | ) | $ | (989 | ) | $ | 13,095 |
| $ | — |
|
(in thousands) |
| June 30, 2012 |
| March 31, 2012 |
|
|
| October 1, |
| July 2, |
|
|
| (Unaudited) |
| (Unaudited) |
|
|
| (Unaudited) |
| (Unaudited) |
|
Increase (decrease) to: |
|
|
|
|
|
|
|
|
|
|
|
Goodwill |
| — |
| — |
|
|
| 1,860 |
| 1,860 |
|
Current portion of contingent consideration |
| — |
| (19,540 | ) |
|
| (18,142 | ) | 2,618 |
|
Contingent consideration, net of current portion |
| — |
| 23,262 |
|
|
| 6,907 |
| (758 | ) |
Additional paid-in capital |
| (1,305 | ) | (7,094 | ) |
|
| — |
| — |
|
Accumulated deficit |
| (1,305 | ) | (3,372 | ) |
|
| (13,095 | ) | — |
|
· The revenue recognition method for the Company’s contract with another wireless customer was not applied consistently, resulting in the incorrect timing of costs and revenues recognized in prior interim financial statements. This adjustment increased (decreased) both revenues and accounts receivable, net by $(4.0) million, $2.6 million and $1.4 million for the three months ended September 29, 2012, June 30, 2012 and March 31, 2012, respectively, and increased (decreased) both cost of revenues and accounts payable by $(3.2) million, $2.1 million and $1.1 million for those same periods, respectively. In addition, the Company made a mathematical error in the calculation of its revenue recognized for that same customer. This adjustment increased revenues by $1.2 million for the three and nine months ended September 29, 2012.
· Borrowings under the Revolving Loan Agreement, and related deferred financing costs, were not correctly classified as current portion of long-term debt and prepaid expenses and other current assets, respectively, in the condensed consolidated balance sheets.
· The Company corrected the classification of cash overdraft balances from cash and cash equivalents to accounts payable in the condensed consolidated balance sheets and adjusted its condensed consolidated statements of cash flows accordingly.
· Certain other errors which were not deemed material to the financial statements unless taken together with the errors previously described were corrected.
As discussed further in Notes 3 and 18, the Company’s previously filed consolidated statements of comprehensive income or loss have been reclassified for the results of discontinued operations. In addition, the Company’s previously filed consolidated balance sheets and statements of cash flows include certain other reclassifications to conform to the current presentation. Such reclassifications have been reflected within the “Previously Reported, as Reclassified” column and are described in Note 2.
UNITEK GLOBAL SERVICES, INC. AND SUBSIDIARIES
Notes to Consolidated Financial Statements
|
| Condensed Consolidated Balance Sheets |
| |||||||||||||||||||||||||
|
| September 29, 2012 |
| June 30, 2012 |
| March 31, 2012 |
| |||||||||||||||||||||
(in thousands, except share and per share |
| Previously |
| Restatement Adjustments |
| Restated |
| Previously |
| Restatement |
| Restated |
| Previously |
| Restatement |
| Restated |
| |||||||||
ASSETS |
|
|
|
|
|
|
|
|
|
|
|
|
|
|
|
|
|
|
| |||||||||
CURRENT ASSETS |
|
|
|
|
|
|
|
|
|
|
|
|
|
|
|
|
|
|
| |||||||||
Cash and cash equivalents |
| $ | 445 |
| $ | 285 |
| $ | 730 |
| $ | — |
| $ | 241 |
| $ | 241 |
| $ | 5,054 |
| $ | (430 | ) | $ | 4,624 |
|
Accounts receivable, net |
| 116,464 |
| (11,690 | ) | 104,774 |
| 104,748 |
| (15,124 | ) | 89,624 |
| 90,427 |
| (13,173 | ) | 77,254 |
| |||||||||
Inventories |
| 17,307 |
| 1,266 |
| 18,573 |
| 10,059 |
| 1,153 |
| 11,212 |
| 9,711 |
| 631 |
| 10,342 |
| |||||||||
Prepaid expenses and other current assets |
| 2,636 |
| 2,487 |
| 5,123 |
| 6,623 |
| 1,199 |
| 7,822 |
| 3,840 |
| 1,452 |
| 5,292 |
| |||||||||
Assets held for sale |
| 18,746 |
| — |
| 18,746 |
| — |
| — |
| — |
| — |
| — |
| — |
| |||||||||
Total current assets |
| 155,598 |
| (7,652 | ) | 147,946 |
| 121,430 |
| (12,531 | ) | 108,899 |
| 109,032 |
| (11,520 | ) | 97,512 |
| |||||||||
Property and equipment, net |
| 29,419 |
| (362 | ) | 29,057 |
| 36,733 |
| (205 | ) | 36,528 |
| 38,733 |
| (85 | ) | 38,648 |
| |||||||||
Amortizable intangible assets, net |
| 45,082 |
| — |
| 45,082 |
| 29,993 |
| — |
| 29,993 |
| 32,603 |
| — |
| 32,603 |
| |||||||||
Goodwill |
| 136,525 |
| — |
| 136,525 |
| 166,053 |
| — |
| 166,053 |
| 165,870 |
| — |
| 165,870 |
| |||||||||
Deferred tax assets, net |
| 1,078 |
| — |
| 1,078 |
| 958 |
| — |
| 958 |
| 848 |
| — |
| 848 |
| |||||||||
Other assets |
| 5,417 |
| (583 | ) | 4,834 |
| 5,371 |
| (571 | ) | 4,800 |
| 5,104 |
| (609 | ) | 4,495 |
| |||||||||
Total assets |
| $ | 373,119 |
| $ | (8,597 | ) | $ | 364,522 |
| $ | 360,538 |
| $ | (13,307 | ) | $ | 347,231 |
| $ | 352,190 |
| $ | (12,214 | ) | $ | 339,976 |
|
|
|
|
|
|
|
|
|
|
|
|
|
|
|
|
|
|
|
|
| |||||||||
LIABILITIES AND STOCKHOLDERS’ EQUITY |
|
|
|
|
|
|
|
|
|
|
|
|
|
|
|
|
|
|
| |||||||||
CURRENT LIABILITIES |
|
|
|
|
|
|
|
|
|
|
|
|
|
|
|
|
|
|
| |||||||||
Accounts payable |
| $ | 50,536 |
| $ | (1,219 | ) | $ | 49,317 |
| $ | 36,539 |
| $ | (1,441 | ) | $ | 35,098 |
| $ | 26,441 |
| $ | (2,932 | ) | $ | 23,509 |
|
Accrued insurance |
| 15,778 |
| — |
| 15,778 |
| 15,197 |
| — |
| 15,197 |
| 14,441 |
| — |
| 14,441 |
| |||||||||
Accrued compensation and benefits |
| 7,341 |
| (635 | ) | 6,706 |
| 8,143 |
| 13 |
| 8,156 |
| 4,533 |
| 211 |
| 4,744 |
| |||||||||
Current portion of contingent consideration |
| 1,947 |
| — |
| 1,947 |
| 84 |
| — |
| 84 |
| 20,025 |
| (19,541 | ) | 484 |
| |||||||||
Current portion of long-term debt |
| 1,350 |
| 35,153 |
| 36,503 |
| 1,500 |
| 28,110 |
| 29,610 |
| 1,000 |
| 34,152 |
| 35,152 |
| |||||||||
Current portion of capital lease obligations |
| 9,083 |
| — |
| 9,083 |
| 10,142 |
| — |
| 10,142 |
| 9,862 |
| — |
| 9,862 |
| |||||||||
Other current liabilities |
| 19,560 |
| 5,360 |
| 24,920 |
| 15,453 |
| (163 | ) | 15,290 |
| 15,081 |
| (414 | ) | 14,667 |
| |||||||||
Liabilities held for sale |
| 9,151 |
| — |
| 9,151 |
| — |
| — |
| — |
| — |
| — |
| — |
| |||||||||
Total current liabilities |
| 114,746 |
| 38,659 |
| 153,405 |
| 87,058 |
| 26,519 |
| 113,577 |
| 91,383 |
| 11,476 |
| 102,859 |
| |||||||||
Long-term debt, net of current portion |
| 163,604 |
| (35,153 | ) | 128,451 |
| 142,350 |
| (28,110 | ) | 114,240 |
| 129,563 |
| (34,152 | ) | 95,411 |
| |||||||||
Long-term capital lease obligations, net of current portion |
| 8,875 |
| — |
| 8,875 |
| 13,358 |
| — |
| 13,358 |
| 14,812 |
| — |
| 14,812 |
| |||||||||
Contingent consideration, net of current portion |
| — |
| — |
| — |
| — |
| — |
| — |
| — |
| 23,262 |
| 23,262 |
| |||||||||
Deferred tax liabilities |
| 801 |
| — |
| 801 |
| 7,511 |
| — |
| 7,511 |
| 6,493 |
| — |
| 6,493 |
| |||||||||
Other liabilities |
| 1,330 |
| 1,401 |
| 2,731 |
| 1,441 |
| 1,234 |
| 2,675 |
| 1,553 |
| 1,052 |
| 2,605 |
| |||||||||
Total liabilities |
| 289,356 |
| 4,907 |
| 294,263 |
| 251,718 |
| (357 | ) | 251,361 |
| 243,804 |
| 1,638 |
| 245,442 |
| |||||||||
|
|
|
|
|
|
|
|
|
|
|
|
|
|
|
|
|
|
|
| |||||||||
STOCKHOLDERS’ EQUITY |
|
|
|
|
|
|
|
|
|
|
|
|
|
|
|
|
|
|
| |||||||||
Preferred Stock, $0.00002 par value (20 million shares authorized, no shares issued or outstanding) |
| — |
| — |
| — |
| — |
| — |
| — |
| — |
| — |
| — |
| |||||||||
Common Stock, $0.00002 par value (200 million shares authorized, 18,712,747, 18,616,124 and 16,458,246 issued and outstanding at September 29, 2012, June 30, 2012 and March 31, 2012, respectively) |
| — |
| — |
| — |
| — |
| — |
| — |
| — |
| — |
| — |
| |||||||||
Additional paid-in capital |
| 260,694 |
| (1,304 | ) | 259,390 |
| 259,691 |
| (1,304 | ) | 258,387 |
| 258,690 |
| (7,093 | ) | 251,597 |
| |||||||||
Accumulated other comprehensive income |
| 54 |
| — |
| 54 |
| 59 |
| — |
| 59 |
| 59 |
| — |
| 59 |
| |||||||||
Accumulated deficit |
| (176,985 | ) | (12,200 | ) | (189,185 | ) | (150,930 | ) | (11,646 | ) | (162,576 | ) | (150,363 | ) | (6,759 | ) | (157,122 | ) | |||||||||
Total stockholders’ equity |
| 83,763 |
| (13,504 | ) | 70,259 |
| 108,820 |
| (12,950 | ) | 95,870 |
| 108,386 |
| (13,852 | ) | 94,534 |
| |||||||||
Total liabilities and stockholders’ equity |
| $ | 373,119 |
| $ | (8,597 | ) | $ | 364,522 |
| $ | 360,538 |
| $ | (13,307 | ) | $ | 347,231 |
| $ | 352,190 |
| $ | (12,214 | ) | $ | 339,976 |
|
UNITEK GLOBAL SERVICES, INC. AND SUBSIDIARIES
Notes to Consolidated Financial Statements
|
| Condensed Consolidated Balance Sheets |
| ||||||||||||||||
|
| October 1, 2011 |
| July 2, 2011 |
| ||||||||||||||
(in thousands, except share and per share amounts) |
| Previously |
| Restatement |
| Restated |
| Previously |
| Restatement |
| Restated |
| ||||||
ASSETS |
|
|
|
|
|
|
|
|
|
|
|
|
| ||||||
CURRENT ASSETS |
|
|
|
|
|
|
|
|
|
|
|
|
| ||||||
Cash and cash equivalents |
| $ | 69 |
| $ | 1,021 |
| $ | 1,090 |
| $ | 7,522 |
| $ | (149 | ) | $ | 7,373 |
|
Accounts receivable, net |
| 88,860 |
| (3,806 | ) | 85,054 |
| 77,240 |
| (1,203 | ) | 76,037 |
| ||||||
Inventories |
| 12,272 |
| — |
| 12,272 |
| 10,577 |
| — |
| 10,577 |
| ||||||
Prepaid expenses and other current assets |
| 3,871 |
| 1,372 |
| 5,243 |
| 3,450 |
| 1,142 |
| 4,592 |
| ||||||
Total current assets |
| 105,072 |
| (1,413 | ) | 103,659 |
| 98,789 |
| (210 | ) | 98,579 |
| ||||||
Property and equipment, net |
| 33,478 |
| — |
| 33,478 |
| 29,594 |
| — |
| 29,594 |
| ||||||
Amortizable intangible assets, net |
| 36,912 |
| — |
| 36,912 |
| 38,414 |
| — |
| 38,414 |
| ||||||
Goodwill |
| 161,421 |
| 1,860 |
| 163,281 |
| 161,303 |
| 1,860 |
| 163,163 |
| ||||||
Deferred tax assets, net |
| 493 |
| — |
| 493 |
| 433 |
| — |
| 433 |
| ||||||
Other assets |
| 5,112 |
| (686 | ) | 4,426 |
| 5,195 |
| (723 | ) | 4,472 |
| ||||||
Total assets |
| $ | 342,488 |
| $ | (239 | ) | $ | 342,249 |
| $ | 333,728 |
| $ | 927 |
| $ | 334,655 |
|
|
|
|
|
|
|
|
|
|
|
|
|
|
| ||||||
LIABILITIES AND STOCKHOLDERS’ EQUITY |
|
|
|
|
|
|
|
|
|
|
|
|
| ||||||
CURRENT LIABILITIES |
|
|
|
|
|
|
|
|
|
|
|
|
| ||||||
Accounts payable |
| $ | 29,665 |
| $ | 587 |
| $ | 30,252 |
| $ | 29,623 |
| $ | (135 | ) | $ | 29,488 |
|
Accrued insurance |
| 13,733 |
| — |
| 13,733 |
| 12,632 |
| — |
| 12,632 |
| ||||||
Accrued compensation and benefits |
| 8,012 |
| 347 |
| 8,359 |
| 8,279 |
| 413 |
| 8,692 |
| ||||||
Current portion of contingent consideration |
| 21,181 |
| (18,142 | ) | 3,039 |
| 21,181 |
| 2,618 |
| 23,799 |
| ||||||
Current portion of long-term debt |
| 1,000 |
| 16,751 |
| 17,751 |
| 1,000 |
| 16,567 |
| 17,567 |
| ||||||
Current portion of capital lease obligations |
| 9,183 |
| — |
| 9,183 |
| 7,769 |
| — |
| 7,769 |
| ||||||
Other current liabilities |
| 13,978 |
| (355 | ) | 13,623 |
| 13,818 |
| (248 | ) | 13,570 |
| ||||||
Total current liabilities |
| 96,752 |
| (812 | ) | 95,940 |
| 94,302 |
| 19,215 |
| 113,517 |
| ||||||
Long-term debt, net of current portion |
| 112,450 |
| (16,751 | ) | 95,699 |
| 112,407 |
| (16,567 | ) | 95,840 |
| ||||||
Long-term capital lease obligations, net of current portion |
| 11,684 |
| — |
| 11,684 |
| 8,989 |
| — |
| 8,989 |
| ||||||
Contingent consideration, net of current portion |
| 2,759 |
| 6,907 |
| 9,666 |
| 2,854 |
| (758 | ) | 2,096 |
| ||||||
Deferred tax liabilities |
| 4,465 |
| — |
| 4,465 |
| 3,476 |
| — |
| 3,476 |
| ||||||
Other liabilities |
| 2,240 |
| 512 |
| 2,752 |
| 2,096 |
| 384 |
| 2,480 |
| ||||||
Total liabilities |
| 230,350 |
| (10,144 | ) | 220,206 |
| 224,124 |
| 2,274 |
| 226,398 |
| ||||||
|
|
|
|
|
|
|
|
|
|
|
|
|
| ||||||
STOCKHOLDERS’ EQUITY |
|
|
|
|
|
|
|
|
|
|
|
|
| ||||||
Preferred Stock, $0.00002 par value (20 million shares authorized, no shares issued or outstanding) |
| — |
| — |
| — |
| — |
| — |
| — |
| ||||||
Common Stock, $0.00002 par value (200 million shares authorized, 16,350,433 and 16,187,487 issued and outstanding at October 1, 2011 and July 2, 2011, respectively) |
| — |
| — |
| — |
| — |
| — |
| — |
| ||||||
Additional paid-in capital |
| 249,014 |
| — |
| 249,014 |
| 248,578 |
| — |
| 248,578 |
| ||||||
Accumulated other comprehensive income |
| (92 | ) | — |
| (92 | ) | 230 |
| — |
| 230 |
| ||||||
Accumulated deficit |
| (136,784 | ) | 9,905 |
| (126,879 | ) | (139,204 | ) | (1,347 | ) | (140,551 | ) | ||||||
Total stockholders’ equity |
| 112,138 |
| 9,905 |
| 122,043 |
| 109,604 |
| (1,347 | ) | 108,257 |
| ||||||
Total liabilities and stockholders’ equity |
| $ | 342,488 |
| $ | (239 | ) | $ | 342,249 |
| $ | 333,728 |
| $ | 927 |
| $ | 334,655 |
|
UNITEK GLOBAL SERVICES, INC. AND SUBSIDIARIES
Notes to Consolidated Financial Statements
|
| Condensed Consolidated Statements of Comprehensive Income or Loss |
| ||||||||||||||||
|
| Three Months Ended September 29, 2012 |
| Three Months Ended October 1, 2011 |
| ||||||||||||||
(in thousands, except per share amounts) |
| Previously |
| Restatement |
| Restated |
| Previously |
| Restatement |
| Restated |
| ||||||
|
|
|
|
|
|
|
|
|
|
|
|
|
| ||||||
Revenues |
| $ | 132,193 |
| $ | (1,711 | ) | $ | 130,482 |
| $ | 101,855 |
| $ | (2,496 | ) | $ | 99,359 |
|
Cost of revenues |
| 104,488 |
| (1,664 | ) | 102,824 |
| 78,631 |
| (555 | ) | 78,076 |
| ||||||
Gross profit |
| 27,705 |
| (47 | ) | 27,658 |
| 23,224 |
| (1,941 | ) | 21,283 |
| ||||||
Selling, general and administrative expenses |
| 10,592 |
| 507 |
| 11,099 |
| 11,335 |
| (96 | ) | 11,239 |
| ||||||
Income related to contingent consideration |
| — |
| — |
| — |
| — |
| (13,095 | ) | (13,095 | ) | ||||||
Restructuring charges |
| 1,594 |
| — |
| 1,594 |
| — |
| — |
| — |
| ||||||
Depreciation and amortization |
| 6,701 |
| — |
| 6,701 |
| 5,624 |
| — |
| 5,624 |
| ||||||
Operating income (loss) |
| 8,818 |
| (554 | ) | 8,264 |
| 6,265 |
| 11,250 |
| 17,515 |
| ||||||
Interest expense |
| 3,883 |
| — |
| 3,883 |
| 3,313 |
| — |
| 3,313 |
| ||||||
Other income, net |
| (76 | ) | — |
| (76 | ) | (52 | ) | — |
| (52 | ) | ||||||
Income from continuing operations before income taxes |
| 5,011 |
| (554 | ) | 4,457 |
| 3,004 |
| 11,250 |
| 14,254 |
| ||||||
Income tax expense |
| 293 |
| — |
| 293 |
| 354 |
| — |
| 354 |
| ||||||
Income from continuing operations |
| 4,718 |
| (554 | ) | 4,164 |
| 2,650 |
| 11,250 |
| 13,900 |
| ||||||
Loss from discontinued operations, net of income taxes |
| (30,773 | ) | — |
| (30,773 | ) | (228 | ) | — |
| (228 | ) | ||||||
Net (loss) income |
| $ | (26,055 | ) | $ | (554 | ) | $ | (26,609 | ) | $ | 2,422 |
| $ | 11,250 |
| $ | 13,672 |
|
Other comprehensive income or loss: |
|
|
|
|
|
|
|
|
|
|
|
|
| ||||||
Foreign currency translation |
| (5 | ) | — |
| (5 | ) | (322 | ) | — |
| (322 | ) | ||||||
Comprehensive (loss) income |
| $ | (26,060 | ) | $ | (554 | ) | $ | (26,614 | ) | $ | 2,100 |
| $ | 11,250 |
| $ | 13,350 |
|
|
|
|
|
|
|
|
|
|
|
|
|
|
| ||||||
Net income (loss) per share — basic and diluted: |
|
|
|
|
|
|
|
|
|
|
|
|
| ||||||
Continuing operations |
| $ | 0.25 |
| $ | (0.03 | ) | $ | 0.22 |
| $ | 0.16 |
| $ | 0.69 |
| $ | 0.85 |
|
Discontinued operations |
| (1.64 | ) | — |
| (1.64 | ) | (0.01 | ) | — |
| (0.01 | ) | ||||||
Total |
| $ | (1.39 | ) | $ | (0.03 | ) | $ | (1.42 | ) | $ | 0.15 |
| $ | 0.69 |
| $ | 0.84 |
|
|
|
|
|
|
|
|
|
|
|
|
|
|
| ||||||
Weighted average shares of common stock outstanding — basic and diluted |
| 18,732 |
| — |
| 18,732 |
| 16,350 |
| — |
| 16,350 |
| ||||||
|
|
|
|
|
|
|
|
|
|
|
|
|
| ||||||
Antidilutive shares excluded from computations of diluted net income or loss per share |
| 753 |
| — |
| 753 |
| 699 |
| — |
| 699 |
| ||||||
UNITEK GLOBAL SERVICES, INC. AND SUBSIDIARIES
Notes to Consolidated Financial Statements
|
| Condensed Consolidated Statements of Comprehensive Income or Loss |
| ||||||||||||||||
|
| Three Months Ended June 30, 2012 |
| Three Months Ended July 2, 2011 |
| ||||||||||||||
(in thousands, except per share amounts) |
| Previously |
| Restatement |
| Restated |
| Previously |
| Restatement |
| Restated |
| ||||||
|
|
|
|
|
|
|
|
|
|
|
|
|
| ||||||
Revenues |
| $ | 101,940 |
| $ | (1,894 | ) | $ | 100,046 |
| $ | 84,608 |
| $ | (1,054 | ) | $ | 83,554 |
|
Cost of revenues |
| 80,945 |
| 472 |
| 81,417 |
| 65,166 |
| (140 | ) | 65,026 |
| ||||||
Gross profit |
| 20,995 |
| (2,366 | ) | 18,629 |
| 19,442 |
| (914 | ) | 18,528 |
| ||||||
Selling, general and administrative expenses |
| 9,632 |
| 453 |
| 10,085 |
| 12,123 |
| 432 |
| 12,555 |
| ||||||
(Income) expense related to contingent consideration |
| (400 | ) | 2,067 |
| 1,667 |
| — |
| — |
| — |
| ||||||
Restructuring charges |
| 797 |
| — |
| 797 |
| — |
| — |
| — |
| ||||||
Depreciation and amortization |
| 6,697 |
| — |
| 6,697 |
| 6,609 |
| — |
| 6,609 |
| ||||||
Operating income (loss) |
| 4,269 |
| (4,886 | ) | (617 | ) | 710 |
| (1,346 | ) | (636 | ) | ||||||
Interest expense |
| 3,613 |
| — |
| 3,613 |
| 3,478 |
| — |
| 3,478 |
| ||||||
Loss on extinguishment of debt |
| — |
| — |
| — |
| 3,466 |
| — |
| 3,466 |
| ||||||
Other income, net |
| (836 | ) | — |
| (836 | ) | (114 | ) | — |
| (114 | ) | ||||||
Income (loss) from continuing operations before income taxes |
| 1,492 |
| (4,886 | ) | (3,394 | ) | (6,120 | ) | (1,346 | ) | (7,466 | ) | ||||||
Income tax expense |
| 90 |
| — |
| 90 |
| 9 |
| — |
| 9 |
| ||||||
Income (loss) from continuing operations |
| 1,402 |
| (4,886 | ) | (3,484 | ) | (6,129 | ) | (1,346 | ) | (7,475 | ) | ||||||
Loss from discontinued operations, net of income taxes |
| (1,970 | ) | — |
| (1,970 | ) | (235 | ) | — |
| (235 | ) | ||||||
Net loss |
| $ | (568 | ) | $ | (4,886 | ) | $ | (5,454 | ) | $ | (6,364 | ) | $ | (1,346 | ) | $ | (7,710 | ) |
Other comprehensive income or loss: |
|
|
|
|
|
|
|
|
|
|
|
|
| ||||||
Foreign currency translation |
| — |
| — |
| — |
| 6 |
| — |
| 6 |
| ||||||
Comprehensive loss |
| $ | (568 | ) | $ | (4,886 | ) | $ | (5,454 | ) | $ | (6,358 | ) | $ | (1,346 | ) | $ | (7,704 | ) |
|
|
|
|
|
|
|
|
|
|
|
|
|
| ||||||
Net income (loss) per share — basic and diluted: |
|
|
|
|
|
|
|
|
|
|
|
|
| ||||||
Continuing operations |
| $ | 0.07 |
| $ | (0.26 | ) | $ | (0.19 | ) | $ | (0.39 | ) | $ | (0.08 | ) | $ | (0.47 | ) |
Discontinued operations |
| (0.10 | ) | — |
| (0.10 | ) | (0.01 | ) | — |
| (0.01 | ) | ||||||
Total |
| $ | (0.03 | ) | $ | (0.26 | ) | $ | (0.29 | ) | $ | (0.40 | ) | $ | (0.08 | ) | $ | (0.48 | ) |
|
|
|
|
|
|
|
|
|
|
|
|
|
| ||||||
Weighted average shares of common stock outstanding — basic and diluted |
| 18,629 |
| — |
| 18,629 |
| 16,019 |
| — |
| 16,019 |
| ||||||
|
|
|
|
|
|
|
|
|
|
|
|
|
| ||||||
Antidilutive shares excluded from computations of diluted net income or loss per share |
| 729 |
| — |
| 729 |
| 856 |
| — |
| 856 |
| ||||||
UNITEK GLOBAL SERVICES, INC. AND SUBSIDIARIES
Notes to Consolidated Financial Statements
|
| Condensed Consolidated Statements of |
| ||||||||||
|
| Three Months Ended |
| ||||||||||
|
| March 31, 2012 |
| April 2, 2011 |
| ||||||||
(in thousands, except per share amounts) |
| Previously |
| Restatement |
| Restated |
| Previously |
| ||||
|
|
|
|
|
|
|
|
|
| ||||
Revenues |
| $ | 92,697 |
| $ | (6,558 | ) | $ | 86,139 |
| $ | 75,581 |
|
Cost of revenues |
| 75,470 |
| (2,054 | ) | 73,416 |
| 62,497 |
| ||||
Gross profit |
| 17,227 |
| (4,504 | ) | 12,723 |
| 13,084 |
| ||||
Selling, general and administrative expenses |
| 12,352 |
| (46 | ) | 12,306 |
| 9,999 |
| ||||
(Income) expense related to contingent consideration |
| (324 | ) | 8,734 |
| 8,410 |
| — |
| ||||
Restructuring charges |
| 4,009 |
| — |
| 4,009 |
| — |
| ||||
Depreciation and amortization |
| 6,392 |
| — |
| 6,392 |
| 5,881 |
| ||||
Operating loss |
| (5,202 | ) | (13,192 | ) | (18,394 | ) | (2,796 | ) | ||||
Interest expense |
| 3,000 |
| — |
| 3,000 |
| 4,467 |
| ||||
Other income, net |
| (234 | ) | — |
| (234 | ) | 6 |
| ||||
Loss from continuing operations before income taxes |
| (7,968 | ) | (13,192 | ) | (21,160 | ) | (7,269 | ) | ||||
Income tax benefit |
| (68 | ) | — |
| (68 | ) | (210 | ) | ||||
Loss from continuing operations |
| (7,900 | ) | (13,192 | ) | (21,092 | ) | (7,059 | ) | ||||
Loss from discontinued operations, net of income taxes |
| (1,929 | ) | — |
| (1,929 | ) | (816 | ) | ||||
Net loss |
| $ | (9,829 | ) | $ | (13,192 | ) | $ | (23,021 | ) | $ | (7,875 | ) |
Other comprehensive income or loss: |
|
|
|
|
|
|
|
|
| ||||
Foreign currency translation |
| 41 |
| — |
| 41 |
| 60 |
| ||||
Comprehensive loss |
| $ | (9,788 | ) | $ | (13,192 | ) | $ | (22,980 | ) | $ | (7,815 | ) |
|
|
|
|
|
|
|
|
|
| ||||
Net loss per share — basic and diluted: |
|
|
|
|
|
|
|
|
| ||||
Continuing operations |
| $ | (0.47 | ) | $ | (0.80 | ) | $ | (1.27 | ) | $ | (0.47 | ) |
Discontinued operations |
| (0.12 | ) | — |
| (0.12 | ) | (0.05 | ) | ||||
Total |
| $ | (0.59 | ) | $ | (0.80 | ) | $ | (1.39 | ) | $ | (0.52 | ) |
|
|
|
|
|
|
|
|
|
| ||||
Weighted average shares of common stock outstanding — basic and diluted |
| 16,545 |
| — |
| 16,545 |
| 15,154 |
| ||||
|
|
|
|
|
|
|
|
|
| ||||
Antidilutive shares excluded from computations of diluted net income or loss per share |
| 625 |
| — |
| 625 |
| 838 |
| ||||
UNITEK GLOBAL SERVICES, INC. AND SUBSIDIARIES
Notes to Consolidated Financial Statements
|
| Condensed Consolidated Statements of Comprehensive Income or Loss |
| ||||||||||||||||
|
| Nine Months Ended September 29, 2012 |
| Nine Months Ended October 1, 2011 |
| ||||||||||||||
(in thousands, except per share amounts) |
| Previously |
| Restatement |
| Restated |
| Previously |
| Restatement |
| Restated |
| ||||||
|
|
|
|
|
|
|
|
|
|
|
|
|
| ||||||
Revenues |
| $ | 326,830 |
| $ | (10,163 | ) | $ | 316,667 |
| $ | 262,044 |
| $ | (3,550 | ) | $ | 258,494 |
|
Cost of revenues |
| 260,903 |
| (3,246 | ) | 257,657 |
| 206,294 |
| (695 | ) | 205,599 |
| ||||||
Gross profit |
| 65,927 |
| (6,917 | ) | 59,010 |
| 55,750 |
| (2,855 | ) | 52,895 |
| ||||||
Selling, general and administrative expenses |
| 32,576 |
| 914 |
| 33,490 |
| 33,457 |
| 336 |
| 33,793 |
| ||||||
(Income) expense related to contingent consideration |
| (724 | ) | 10,801 |
| 10,077 |
| — |
| (13,095 | ) | (13,095 | ) | ||||||
Restructuring charges |
| 6,400 |
| — |
| 6,400 |
| — |
| — |
| — |
| ||||||
Depreciation and amortization |
| 19,790 |
| — |
| 19,790 |
| 18,114 |
| — |
| 18,114 |
| ||||||
Operating income (loss) |
| 7,885 |
| (18,632 | ) | (10,747 | ) | 4,179 |
| 9,904 |
| 14,083 |
| ||||||
Interest expense |
| 10,496 |
| — |
| 10,496 |
| 11,258 |
| — |
| 11,258 |
| ||||||
Loss on extinguishment of debt |
| — |
| — |
| — |
| 3,466 |
| — |
| 3,466 |
| ||||||
Other income, net |
| (1,146 | ) | — |
| (1,146 | ) | (160 | ) | — |
| (160 | ) | ||||||
Loss from continuing operations before income taxes |
| (1,465 | ) | (18,632 | ) | (20,097 | ) | (10,385 | ) | 9,904 |
| (481 | ) | ||||||
Income tax expense |
| 315 |
| — |
| 315 |
| 153 |
| — |
| 153 |
| ||||||
Loss from continuing operations |
| (1,780 | ) | (18,632 | ) | (20,412 | ) | (10,538 | ) | 9,904 |
| (634 | ) | ||||||
Loss from discontinued operations, net of income taxes |
| (34,672 | ) | — |
| (34,672 | ) | (1,279 | ) | — |
| (1,279 | ) | ||||||
Net loss |
| $ | (36,452 | ) | $ | (18,632 | ) | $ | (55,084 | ) | $ | (11,817 | ) | $ | 9,904 |
| $ | (1,913 | ) |
Other comprehensive income or loss: |
|
|
|
|
|
|
|
|
|
|
|
|
| ||||||
Foreign currency translation |
| 36 |
| — |
| 36 |
| (256 | ) | — |
| (256 | ) | ||||||
Comprehensive loss |
| $ | (36,416 | ) | $ | (18,632 | ) | $ | (55,048 | ) | $ | (12,073 | ) | $ | 9,904 |
| $ | (2,169 | ) |
|
|
|
|
|
|
|
|
|
|
|
|
|
| ||||||
Net loss per share — basic and diluted: |
|
|
|
|
|
|
|
|
|
|
|
|
| ||||||
Continuing operations |
| $ | (0.10 | ) | $ | (1.04 | ) | $ | (1.14 | ) | $ | (0.67 | ) | $ | 0.63 |
| $ | (0.04 | ) |
Discontinued operations |
| (1.93 | ) | — |
| (1.93 | ) | (0.08 | ) | — |
| (0.08 | ) | ||||||
Total |
| $ | (2.03 | ) | $ | (1.04 | ) | $ | (3.07 | ) | $ | (0.75 | ) | $ | 0.63 |
| $ | (0.12 | ) |
|
|
|
|
|
|
|
|
|
|
|
|
|
| ||||||
Weighted average shares of common stock outstanding — basic and diluted |
| 17,969 |
| — |
| 17,969 |
| 15,839 |
| — |
| 15,839 |
| ||||||
|
|
|
|
|
|
|
|
|
|
|
|
|
| ||||||
Antidilutive shares excluded from computations of diluted net income or loss per share |
| 702 |
| — |
| 702 |
| 798 |
| — |
| 798 |
| ||||||
UNITEK GLOBAL SERVICES, INC. AND SUBSIDIARIES
Notes to Consolidated Financial Statements
|
| Condensed Consolidated Statements of Comprehensive Income or Loss |
| ||||||||||||||||
|
| Six Months Ended June 30, 2012 |
| Six Months Ended July 2, 2011 |
| ||||||||||||||
(in thousands, except per share amounts) |
| Previously |
| Restatement |
| Restated |
| Previously |
| Restatement |
| Restated |
| ||||||
|
|
|
|
|
|
|
|
|
|
|
|
|
| ||||||
Revenues |
| $ | 194,637 |
| $ | (8,452 | ) | $ | 186,185 |
| $ | 160,189 |
| $ | (1,054 | ) | $ | 159,135 |
|
Cost of revenues |
| 156,415 |
| (1,582 | ) | 154,833 |
| 127,663 |
| (140 | ) | 127,523 |
| ||||||
Gross profit |
| 38,222 |
| (6,870 | ) | 31,352 |
| 32,526 |
| (914 | ) | 31,612 |
| ||||||
Selling, general and administrative expenses |
| 21,984 |
| 407 |
| 22,391 |
| 22,122 |
| 432 |
| 22,554 |
| ||||||
Income (expense) related to contingent consideration |
| (724 | ) | 10,801 |
| 10,077 |
| — |
| — |
| — |
| ||||||
Restructuring charges |
| 4,806 |
| — |
| 4,806 |
| — |
| — |
| — |
| ||||||
Depreciation and amortization |
| 13,089 |
| — |
| 13,089 |
| 12,490 |
| — |
| 12,490 |
| ||||||
Operating loss |
| (933 | ) | (18,078 | ) | (19,011 | ) | (2,086 | ) | (1,346 | ) | (3,432 | ) | ||||||
Interest expense |
| 6,613 |
| — |
| 6,613 |
| 7,945 |
| — |
| 7,945 |
| ||||||
Loss on extinguishment of debt |
| — |
| — |
| — |
| 3,466 |
| — |
| 3,466 |
| ||||||
Other income, net |
| (1,070 | ) | — |
| (1,070 | ) | (108 | ) | — |
| (108 | ) | ||||||
Loss from continuing operations before income taxes |
| (6,476 | ) | (18,078 | ) | (24,554 | ) | (13,389 | ) | (1,346 | ) | (14,735 | ) | ||||||
Income tax expense (benefit) |
| 22 |
| — |
| 22 |
| (201 | ) | — |
| (201 | ) | ||||||
Loss from continuing operations |
| (6,498 | ) | (18,078 | ) | (24,576 | ) | (13,188 | ) | (1,346 | ) | (14,534 | ) | ||||||
Loss from discontinued operations, net of income taxes |
| (3,899 | ) | — |
| (3,899 | ) | (1,051 | ) | — |
| (1,051 | ) | ||||||
Net loss |
| $ | (10,397 | ) | $ | (18,078 | ) | $ | (28,475 | ) | $ | (14,239 | ) | $ | (1,346 | ) | $ | (15,585 | ) |
Other comprehensive income or loss: |
|
|
|
|
|
|
|
|
|
|
|
|
| ||||||
Foreign currency translation |
| 41 |
| — |
| 41 |
| 66 |
| — |
| 66 |
| ||||||
Comprehensive loss |
| $ | (10,356 | ) | $ | (18,078 | ) | $ | (28,434 | ) | $ | (14,173 | ) | $ | (1,346 | ) | $ | (15,519 | ) |
|
|
|
|
|
|
|
|
|
|
|
|
|
| ||||||
Net loss per share — basic and diluted: |
|
|
|
|
|
|
|
|
|
|
|
|
| ||||||
Continuing operations |
| $ | (0.37 | ) | $ | (1.03 | ) | $ | (1.40 | ) | $ | (0.84 | ) | $ | (0.09 | ) | $ | (0.93 | ) |
Discontinued operations |
| (0.22 | ) | — |
| (0.22 | ) | (0.07 | ) | — |
| (0.07 | ) | ||||||
Total |
| $ | (0.59 | ) | $ | (1.03 | ) | $ | (1.62 | ) | $ | (0.91 | ) | $ | (0.09 | ) | $ | (1.00 | ) |
|
|
|
|
|
|
|
|
|
|
|
|
|
| ||||||
Weighted average shares of common stock outstanding — basic and diluted |
| 17,587 |
| — |
| 17,587 |
| 15,584 |
| — |
| 15,584 |
| ||||||
|
|
|
|
|
|
|
|
|
|
|
|
|
| ||||||
Antidilutive shares excluded from computations of diluted net income or loss per share |
| 677 |
| — |
| 677 |
| 847 |
| — |
| 847 |
| ||||||
UNITEK GLOBAL SERVICES, INC. AND SUBSIDIARIES
Notes to Consolidated Financial Statements
|
| Condensed Consolidated Statements of Cash Flows |
| ||||||||||||||||
|
| Nine Months Ended September 29, 2012 |
| Nine Months Ended October 1, 2011 |
| ||||||||||||||
(in thousands) |
| Previously Reported, |
| Restatement Adjustments |
| Restated |
| Previously Reported, |
| Restatement Adjustments |
| Restated |
| ||||||
|
|
|
|
|
|
|
|
|
|
|
|
|
| ||||||
Net cash (used in) provided by operating activities |
| $ | (5,193 | ) | $ | 350 |
| $ | (4,843 | ) | $ | 306 |
| $ | 1,021 |
| $ | 1,327 |
|
|
|
|
|
|
|
|
|
|
|
|
|
|
| ||||||
Cash flows from investing activities: |
|
|
|
|
|
|
|
|
|
|
|
|
| ||||||
Acquisition of property and equipment |
| (4,602 | ) | 363 |
| (4,239 | ) | (4,221 | ) | — |
| (4,221 | ) | ||||||
Proceeds from sale of property and equipment |
| 1,917 |
| — |
| 1,917 |
| 342 |
| — |
| 342 |
| ||||||
Cash paid for acquisition of businesses, net of cash acquired |
| (16,858 | ) | — |
| (16,858 | ) | (12,581 | ) | — |
| (12,581 | ) | ||||||
Net cash used in investing activities |
| (19,543 | ) | 363 |
| (19,180 | ) | (16,460 | ) | — |
| (16,460 | ) | ||||||
|
|
|
|
|
|
|
|
|
|
|
|
|
| ||||||
Cash flows from financing activities: |
|
|
|
|
|
|
|
|
|
|
|
|
| ||||||
Proceeds from revolving credit facilities, net |
| 19,490 |
| — |
| 19,490 |
| 22,683 |
| (6,000 | ) | 16,683 |
| ||||||
Proceeds from long-term debt, net of debt discount |
| 33,750 |
| — |
| 33,750 |
| 97,000 |
| — |
| 97,000 |
| ||||||
Repayment of long-term debt |
| (888 | ) | — |
| (888 | ) | (109,400 | ) | 6,000 |
| (103,400 | ) | ||||||
Repayment of capital leases |
| (8,928 | ) | — |
| (8,928 | ) | (6,862 | ) | — |
| (6,862 | ) | ||||||
Payment of contingent consideration |
| (17,114 | ) | (866 | ) | (17,980 | ) | — |
| — |
| — |
| ||||||
Payment of financing fees |
| (1,016 | ) | — |
| (1,016 | ) | (3,929 | ) | — |
| (3,929 | ) | ||||||
Other financing activities |
| (194 | ) | — |
| (194 | ) | (824 | ) | — |
| (824 | ) | ||||||
Net cash provided by (used in) financing activities |
| 25,100 |
| (866 | ) | 24,234 |
| (1,332 | ) | — |
| (1,332 | ) | ||||||
|
|
|
|
|
|
|
|
|
|
|
|
|
| ||||||
Effect of exchange rate on cash and cash equivalents |
| (14 | ) | — |
| (14 | ) | (161 | ) | — |
| (161 | ) | ||||||
Net increase (decrease) in cash and cash equivalents |
| 350 |
| (153 | ) | 197 |
| (17,647 | ) | 1,021 |
| (16,626 | ) | ||||||
Cash and cash equivalents at beginning of period |
| 95 |
| 438 |
| 533 |
| 17,716 |
| — |
| 17,716 |
| ||||||
Cash and cash equivalents at end of period |
| $ | 445 |
| $ | 285 |
| $ | 730 |
| $ | 69 |
| $ | 1,021 |
| $ | 1,090 |
|
|
|
|
|
|
|
|
|
|
|
|
|
|
| ||||||
Supplemental cash flow information: |
|
|
|
|
|
|
|
|
|
|
|
|
| ||||||
Interest paid |
| $ | 8,993 |
| $ | — |
| $ | 8,993 |
| $ | 10,591 |
| $ | — |
| $ | 10,591 |
|
Income taxes paid |
| 784 |
| — |
| 784 |
| 244 |
| — |
| 244 |
| ||||||
|
|
|
|
|
|
|
|
|
|
|
|
|
| ||||||
Significant non-cash investing and financing activities: |
|
|
|
|
|
|
|
|
|
|
|
|
| ||||||
Fair value of equity paid for acquisition |
| $ | 7,093 |
| $ | (1,304 | ) | $ | 5,789 |
| $ | 8,453 |
| $ | — |
| $ | 8,453 |
|
Acquisition of property and equipment financed by capital leases |
| 3,788 |
| — |
| 3,788 |
| 8,851 |
| — |
| 8,851 |
| ||||||
UNITEK GLOBAL SERVICES, INC. AND SUBSIDIARIES
Notes to Consolidated Financial Statements
|
| Condensed Consolidated Statements of Cash Flows |
| ||||||||||||||||
|
| Six Months Ended June 30, 2012 |
| Six Months Ended July 2, 2011 |
| ||||||||||||||
(in thousands) |
| Previously |
| Restatement |
| Restated |
| Previously |
| Restatement |
| Restated |
| ||||||
|
|
|
|
|
|
|
|
|
|
|
|
|
| ||||||
Net cash (used in) provided by operating activities |
| $ | (3,147 | ) | $ | 464 |
| $ | (2,683 | ) | $ | 3,315 |
| $ | (149 | ) | $ | 3,166 |
|
|
|
|
|
|
|
|
|
|
|
|
|
|
| ||||||
Cash flows from investing activities: |
|
|
|
|
|
|
| — |
| — |
| — |
| ||||||
Acquisition of property and equipment |
| (3,117 | ) | 205 |
| (2,912 | ) | (2,788 | ) | — |
| (2,788 | ) | ||||||
Proceeds from sale of property and equipment |
| 1,607 |
| — |
| 1,607 |
| 357 |
| — |
| 357 |
| ||||||
Cash paid for acquisition of businesses, net of cash acquired |
| (2,858 | ) | — |
| (2,858 | ) | (12,581 | ) | — |
| (12,581 | ) | ||||||
Net cash used in investing activities |
| (4,368 | ) | 205 |
| (4,163 | ) | (15,012 | ) | — |
| (15,012 | ) | ||||||
|
|
|
|
|
|
|
|
|
|
|
|
|
| ||||||
Cash flows from financing activities: |
|
|
|
|
|
|
|
|
|
|
|
|
| ||||||
Proceeds from revolving credit facilities, net |
| 12,447 |
| — |
| 12,447 |
| 22,566 |
| (6,000 | ) | 16,566 |
| ||||||
Proceeds from long-term debt, net of debt discount |
| 19,200 |
| — |
| 19,200 |
| 97,000 |
| — |
| 97,000 |
| ||||||
Repayment of long-term debt |
| (250 | ) | — |
| (250 | ) | (109,150 | ) | 6,000 |
| (103,150 | ) | ||||||
Repayment of capital leases |
| (6,255 | ) | — |
| (6,255 | ) | (4,594 | ) | — |
| (4,594 | ) | ||||||
Payment of contingent consideration |
| (17,114 | ) | (866 | ) | (17,980 | ) | — |
| — |
| — |
| ||||||
Payment of financing fees |
| (514 | ) | — |
| (514 | ) | (3,824 | ) | — |
| (3,824 | ) | ||||||
Other financing activities |
| (194 | ) | — |
| (194 | ) | (515 | ) | — |
| (515 | ) | ||||||
Net cash provided by financing activities |
| 7,320 |
| (866 | ) | 6,454 |
| 1,483 |
| — |
| 1,483 |
| ||||||
|
|
|
|
|
|
|
|
|
|
|
|
|
| ||||||
Effect of exchange rate on cash and cash equivalents |
| 100 |
| — |
| 100 |
| 20 |
| — |
| 20 |
| ||||||
Net decrease in cash and cash equivalents |
| (95 | ) | (197 | ) | (292 | ) | (10,194 | ) | (149 | ) | (10,343 | ) | ||||||
Cash and cash equivalents at beginning of period |
| 95 |
| 438 |
| 533 |
| 17,716 |
| — |
| 17,716 |
| ||||||
Cash and cash equivalents at end of period |
| $ | — |
| $ | 241 |
| $ | 241 |
| $ | 7,522 |
| $ | (149 | ) | $ | 7,373 |
|
|
|
|
|
|
|
|
|
|
|
|
|
|
| ||||||
Supplemental cash flow information: |
|
|
|
|
|
|
|
|
|
|
|
|
| ||||||
Interest paid |
| $ | 3,105 |
| $ | — |
| $ | 3,105 |
| $ | 8,018 |
| $ | — |
| $ | 8,018 |
|
Income taxes paid |
| 784 |
| — |
| 784 |
| 244 |
| — |
| 244 |
| ||||||
|
|
|
|
|
|
|
|
|
|
|
|
|
| ||||||
Significant non-cash investing and financing activities: |
|
|
|
|
|
|
|
|
|
|
|
|
| ||||||
Fair value of equity paid for acquisition |
| $ | 7,093 |
| $ | (1,304 | ) | $ | 5,789 |
| $ | 8,453 |
| $ | — |
| $ | 8,453 |
|
Acquisition of property and equipment financed by capital leases |
| 3,676 |
| — |
| 3,676 |
| 2,521 |
| — |
| 2,521 |
| ||||||
UNITEK GLOBAL SERVICES, INC. AND SUBSIDIARIES
Notes to Consolidated Financial Statements
|
| Condensed Consolidated Statements of Cash Flows |
| ||||||||||||||||
|
| Three Months Ended March 31, 2012 |
| Three Months Ended April 2, 2011 |
| ||||||||||||||
(in thousands) |
| Previously |
| Restatement |
| Restated |
| Previously |
| Restatement |
| Restated |
| ||||||
|
|
|
|
|
|
|
|
|
|
|
|
|
| ||||||
Net cash used in operating activities |
| $ | (7,644 | ) | $ | (953 | ) | $ | (8,597 | ) | (2,701 | ) | $ | — |
| $ | (2,701 | ) | |
|
|
|
|
|
|
|
|
|
|
|
|
|
| ||||||
Cash flows from investing activities: |
|
|
|
|
|
|
|
|
|
|
|
|
| ||||||
Acquisition of property and equipment |
| (1,916 | ) | 85 |
| (1,831 | ) | (1,026 | ) | — |
| (1,026 | ) | ||||||
Proceeds from sale of property and equipment |
| 406 |
| — |
| 406 |
| 79 |
| — |
| 79 |
| ||||||
Cash restricted for acquisition of business |
| (934 | ) | — |
| (934 | ) | — |
| — |
| — |
| ||||||
Cash paid for acquisition of businesses, net of cash acquired |
| — |
| — |
| — |
| (300 | ) | — |
| (300 | ) | ||||||
Net cash used in investing activities |
| (2,444 | ) | 85 |
| (2,359 | ) | (1,247 | ) | — |
| (1,247 | ) | ||||||
|
|
|
|
|
|
|
|
|
|
|
|
|
| ||||||
Cash flows from financing activities: |
|
|
|
|
|
|
|
|
|
|
|
|
| ||||||
Proceeds from revolving credit facilities, net |
| 18,489 |
| — |
| 18,489 |
| 1,000 |
| — |
| 1,000 |
| ||||||
Repayment of long-term debt |
| (250 | ) | — |
| (250 | ) | (735 | ) | — |
| (735 | ) | ||||||
Repayment of capital leases |
| (2,987 | ) | — |
| (2,987 | ) | (2,174 | ) | — |
| (2,174 | ) | ||||||
Other financing activities |
| (213 | ) | — |
| (213 | ) | — |
| — |
| — |
| ||||||
Net cash provided by (used in) financing activities |
| 15,039 |
| — |
| 15,039 |
| (1,909 | ) | — |
| (1,909 | ) | ||||||
|
|
|
|
|
|
|
|
|
|
|
|
|
| ||||||
Effect of exchange rate on cash and cash equivalents |
| 8 |
| — |
| 8 |
| (2 | ) | — |
| (2 | ) | ||||||
Net increase (decrease) in cash and cash equivalents |
| 4,959 |
| (868 | ) | 4,091 |
| (5,859 | ) | — |
| (5,859 | ) | ||||||
Cash and cash equivalents at beginning of period |
| 95 |
| 438 |
| 533 |
| 17,716 |
| — |
| 17,716 |
| ||||||
Cash and cash equivalents at end of period |
| $ | 5,054 |
| $ | (430 | ) | $ | 4,624 |
| $ | 11,857 |
| $ | — |
| $ | 11,857 |
|
|
|
|
|
|
|
|
|
|
|
|
|
|
| ||||||
Supplemental cash flow information: |
|
|
|
|
|
|
|
|
|
|
|
|
| ||||||
Interest paid |
| $ | 2,653 |
| $ | — |
| $ | 2,653 |
| $ | 3,799 |
| $ | — |
| $ | 3,799 |
|
Income taxes paid |
| 784 |
| — |
| 784 |
| — |
| — |
| — |
| ||||||
|
|
|
|
|
|
|
|
|
|
|
|
|
| ||||||
Significant non-cash investing and financing activities: |
|
|
|
|
|
|
|
|
|
|
|
|
| ||||||
Fair value of equity paid for acquisition |
| $ | 7,093 |
| $ | (7,093 | ) | $ | — |
| $ | — |
| $ | — |
| $ | — |
|
Acquisition of property and equipment financed by capital leases |
| 1,583 |
| — |
| 1,583 |
| 1,855 |
| — |
| 1,855 |
| ||||||
UNITEK GLOBAL SERVICES, INC. AND SUBSIDIARIES
Notes to Consolidated Financial Statements
Restatement of Unaudited Quarterly Financial Information
The Company has also restated its quarterly financial information for the three months ended December 31, 2011, as presented in the following table:
|
| Three Months Ended December 31, 2011 |
| |||||||
(in thousands, except per share amounts) |
| Previously |
| Restatement |
| Restated |
| |||
|
|
|
|
|
|
|
| |||
Revenues |
| $ | 96,013 |
| $ | (3,051 | ) | $ | 92,962 |
|
Gross profit |
| 21,653 |
| (3,070 | ) | 18,583 |
| |||
Loss from continuing operations before income taxes |
| (2,304 | ) | (3,472 | ) | (5,766 | ) | |||
Net loss |
| (3,750 | ) | (3,472 | ) | (7,222 | ) | |||
Net loss per share — basic and diluted |
| (0.23 | ) | (0.21 | ) | (0.44 | ) | |||
21A. Unaudited Quarterly Basis of Presentation
The unaudited condensed consolidated financial statements included in Note 21 and related lettered notes, when taken together with the audited consolidated financial statements included herein, have been prepared in accordance with accounting principles generally accepted in the United States (“GAAP”) for interim financial statements and pursuant to the rules and regulations of the United States Securities and Exchange Commission (“SEC”). In the Company’s opinion, the accompanying unaudited condensed consolidated financial statements include all adjustments, which are of a normal and recurring nature, necessary to present fairly the results of its operations and cash flows at the dates and for the periods indicated. The results of operations for the interim periods are not necessarily indicative of the results for the full fiscal year. The condensed consolidated financial statements include the accounts of UniTek and its wholly-owned subsidiaries. All intercompany accounts have been eliminated in consolidation. The unaudited condensed consolidated financial statements included in Note 21 should be read in conjunction with the audited consolidated financial statements.
21B. Unaudited Quarterly Business Combinations
The acquisition of Skylink contributed revenues and operating income of $1.3 million and $0.3 million, respectively, during the three and nine months ended September 29, 2012.
The acquisition of Pinnacle contributed revenues of $7.2 million and $12.4 million during the three and nine months ended October 1, 2011 and $5.2 million during the three and six months ended July 2, 2011. The acquisition of Pinnacle contributed operating loss of $1.1 million and $1.7 million during the three and nine months ended October 1, 2011 and $0.6 million during the three and six months ended July 2, 2011.
UNITEK GLOBAL SERVICES, INC. AND SUBSIDIARIES
Notes to Consolidated Financial Statements
21C. Unaudited Quarterly Accounts Receivable, Net
The following table presents the components of accounts receivable, net of allowances:
(in thousands) |
| September 29, |
| June 30, |
| March 31, |
| October 1, |
| June 2, |
| |||||
|
| (Restated) |
| (Restated) |
| (Restated) |
| (Restated) |
| (Restated) |
| |||||
|
|
|
|
|
|
|
|
|
|
|
| |||||
Trade accounts receivable |
| $ | 23,111 |
| $ | 32,736 |
| $ | 32,742 |
| $ | 38,235 |
| $ | 30,471 |
|
Contract billings |
| 37,731 |
| 27,070 |
| 20,452 |
| 17,910 |
| 19,298 |
| |||||
Unbilled contract revenues |
| 36,214 |
| 21,865 |
| 16,128 |
| 18,693 |
| 15,636 |
| |||||
Other unbilled revenues |
| 8,572 |
| 9,899 |
| 10,646 |
| 13,372 |
| 13,726 |
| |||||
Retainage |
| 2,955 |
| 1,711 |
| 701 |
| — |
| — |
| |||||
Accounts receivable, gross |
| 108,583 |
| 93,281 |
| 80,669 |
| 88,210 |
| 79,131 |
| |||||
Allowance for doubtful accounts |
| (3,809 | ) | (3,657 | ) | (3,415 | ) | (3,156 | ) | (3,094 | ) | |||||
Accounts receivable, net of allowances |
| $ | 104,774 |
| $ | 89,624 |
| $ | 77,254 |
| $ | 85,054 |
| $ | 76,037 |
|
The following table presents changes in the allowance for doubtful accounts:
|
| Three Months Ended |
| |||||||||||||
(in thousands) |
| September 29, |
| June 30, |
| March 31, |
| October 1, |
| June 2, |
| |||||
|
| (Restated) |
|
|
|
|
|
|
|
|
| |||||
|
|
|
|
|
|
|
|
|
|
|
| |||||
Balance at beginning of the period |
| $ | 3,657 |
| $ | 3,415 |
| $ | 3,611 |
| $ | 3,094 |
| $ | 2,907 |
|
Provision for doubtful accounts |
| 1,209 |
| 483 |
| 385 |
| 75 |
| 371 |
| |||||
Amounts charged against allowances, net of collections |
| (1,057 | ) | (241 | ) | (581 | ) | (13 | ) | (184 | ) | |||||
Balance at end of the period |
| $ | 3,809 |
| $ | 3,657 |
| $ | 3,415 |
| $ | 3,156 |
| $ | 3,094 |
|
UNITEK GLOBAL SERVICES, INC. AND SUBSIDIARIES
Notes to Consolidated Financial Statements
21D. Unaudited Quarterly Fair Value Measurements
Assets and Liabilities for which Fair Value is only Disclosed
For all periods disclosed below, the carrying values of accounts receivable, accounts payable, and financial instruments included in other assets, other current liabilities and other liabilities were reflected in the consolidated balance sheets at historical cost, which was materially representative of their fair value due to the relatively short-term maturities of these assets and liabilities, and the carrying values of long-term debt and capital lease obligations approximated fair value because they bear interest at rates currently available to the Company for obligations with similar terms and remaining maturities (Level 2 measurements).
Recurring Fair Value Measurements
The following tables present the Company’s assets and liabilities measured at fair value on a recurring basis as of the end of each quarterly period presented:
|
| September 29, 2012 |
| June 30, 2012 |
| March 31, 2012 |
| ||||||||||||||||||||||||||||||
(in thousands) |
| Total |
| Level 1 |
| Level 2 |
| Level 3 |
| Total |
| Level 1 |
| Level 2 |
| Level 3 |
| Total |
| Level 1 |
| Level 2 |
| Level 3 |
| ||||||||||||
|
| (Restated) |
| (Restated) |
| (Restated) |
| ||||||||||||||||||||||||||||||
Assets |
|
|
|
|
|
|
|
|
|
|
|
|
|
|
|
|
|
|
|
|
|
|
|
|
| ||||||||||||
Cash and cash equivalents |
| $ | 730 |
| $ | 730 |
| $ | — |
| $ | — |
| $ | 241 |
| $ | 241 |
| $ | — |
| $ | — |
| $ | 4,624 |
| $ | 4,624 |
| $ | — |
| $ | — |
|
Deferred compensation plan assets |
| 767 |
| 767 |
| — |
| — |
| 716 |
| 716 |
| — |
| — |
| 764 |
| 764 |
| — |
| — |
| ||||||||||||
Total |
| $ | 1,497 |
| $ | 1,497 |
| $ | — |
| $ | — |
| $ | 957 |
| $ | 957 |
| $ | — |
| $ | — |
| $ | 5,388 |
| $ | 5,388 |
| $ | — |
| $ | — |
|
|
|
|
|
|
|
|
|
|
|
|
|
|
|
|
|
|
|
|
|
|
|
|
|
|
| ||||||||||||
Liabilities |
|
|
|
|
|
|
|
|
|
|
|
|
|
|
|
|
|
|
|
|
|
|
|
|
| ||||||||||||
Contingent consideration |
| $ | 1,947 |
| $ | — |
| $ | — |
| $ | 1,947 |
| $ | 84 |
| $ | — |
| $ | — |
| $ | 84 |
| $ | 23,746 |
| $ | — |
| $ | — |
| $ | 23,746 |
|
Interest rate swap |
| 143 |
| — |
| 143 |
| — |
| 113 |
| — |
| 113 |
| — |
| 136 |
| — |
| 136 |
| — |
| ||||||||||||
Total |
| $ | 2,090 |
| $ | — |
| $ | 143 |
| $ | 1,947 |
| $ | 197 |
| $ | — |
| $ | 113 |
| $ | 84 |
| $ | 23,882 |
| $ | — |
| $ | 136 |
| $ | 23,746 |
|
|
| October 1, 2011 |
| July 2, 2011 |
|
|
|
|
|
|
|
|
| ||||||||||||||||||||
(in thousands) |
| Total |
| Level 1 |
| Level 2 |
| Level 3 |
| Total |
| Level 1 |
| Level 2 |
| Level 3 |
|
|
|
|
|
|
|
|
| ||||||||
|
| (Restated) |
| (Restated) |
|
|
|
|
|
|
|
|
| ||||||||||||||||||||
Assets |
|
|
|
|
|
|
|
|
|
|
|
|
|
|
|
|
|
|
|
|
|
|
|
|
| ||||||||
Cash and cash equivalents |
| $ | 1,090 |
| $ | 1,090 |
| $ | — |
| $ | — |
| $ | 7,373 |
| $ | 7,373 |
| $ | — |
| $ | — |
|
|
|
|
|
|
|
|
|
Deferred compensation plan assets |
| 354 |
| 354 |
| — |
| — |
| 284 |
| 284 |
| — |
| — |
|
|
|
|
|
|
|
|
| ||||||||
Total |
| $ | 1,444 |
| $ | 1,444 |
| $ | — |
| $ | — |
| $ | 7,657 |
| $ | 7,657 |
| $ | — |
| $ | — |
|
|
|
|
|
|
|
|
|
|
|
|
|
|
|
|
|
|
|
|
|
|
|
|
|
|
|
|
|
|
|
|
|
|
| ||||||||
Liabilities |
|
|
|
|
|
|
|
|
|
|
|
|
|
|
|
|
|
|
|
|
|
|
|
|
| ||||||||
Contingent consideration |
| $ | 12,705 |
| $ | — |
| $ | — |
| $ | 12,705 |
| $ | 25,895 |
| $ | — |
| $ | — |
| $ | 25,895 |
|
|
|
|
|
|
|
|
|
Interest rate swap |
| 151 |
| — |
| 151 |
| — |
| — |
| — |
| — |
| — |
|
|
|
|
|
|
|
|
| ||||||||
Total |
| $ | 12,856 |
| $ | — |
| $ | 151 |
| $ | 12,705 |
| $ | 25,895 |
| $ | — |
| $ | — |
| $ | 25,895 |
|
|
|
|
|
|
|
|
|
Nonrecurring Fair Value Measurements
The Company was required to perform certain nonrecurring fair value measurements during the three months ended September 29, 2012. Please refer to Note 11 for further information on this event.
UNITEK GLOBAL SERVICES, INC. AND SUBSIDIARIES
Notes to Consolidated Financial Statements
Fair Value Measurements with Significant Unobservable Inputs
The following table presents changes in assets and liabilities measured at fair value using significant unobservable inputs:
|
| Three Months Ended |
| |||||||||||||
(in thousands) |
| September 29, |
| June 30, |
| March 31, |
| October 1, |
| July 2, |
| |||||
|
| (Restated) |
| (Restated) |
| (Restated) |
| (Restated) |
| (Restated) |
| |||||
Contingent Consideration: |
|
|
|
|
|
|
|
|
|
|
| |||||
Balance at beginning of period |
| $ | 84 |
| $ | 23,746 |
| $ | 14,852 |
| $ | 25,895 |
| $ | 160 |
|
Acquisitions |
| 5,332 |
|
|
| 484 |
| — |
| 25,800 |
| |||||
Settlements – cash |
| — |
| (19,540 | ) |
|
| (95 | ) | (65 | ) | |||||
Settlements – payables |
| (3,469 | ) |
|
|
|
| — |
| — |
| |||||
Settlements – equity |
| — |
| (5,789 | ) |
|
| — |
| — |
| |||||
Changes in fair value |
| — |
| 1,667 |
| 8,410 |
| (13,095 | ) | — |
| |||||
Balance at end of period |
| $ | 1,947 |
| $ | 84 |
| $ | 23,746 |
| $ | 12,705 |
| $ | 25,895 |
|
21E. Unaudited Quarterly Restructuring
The following table presents the changes in accrued restructuring costs:
|
| Three Months Ended |
|
|
|
|
| |||||||
(in thousands) |
| September 29, |
| June 30, |
| March 31, |
|
|
|
|
| |||
|
|
|
|
|
|
|
|
|
|
|
| |||
One-time termination benefits: |
|
|
|
|
|
|
|
|
|
|
| |||
Balance at beginning of period |
| $ | 1,992 |
| $ | 2,300 |
| $ | — |
|
|
|
|
|
Restructuring charges: |
|
|
|
|
|
|
|
|
|
|
| |||
Continuing operations |
| 667 |
| 219 |
| 3,578 |
|
|
|
|
| |||
Discontinued operations |
| — |
| — |
| 279 |
|
|
|
|
| |||
Amounts paid |
| (612 | ) | (527 | ) | (1,557 | ) |
|
|
|
| |||
Balance at end of period |
| $ | 2,047 |
| $ | 1,992 |
| $ | 2,300 |
|
|
|
|
|
|
|
|
|
|
|
|
|
|
|
|
| |||
Other: |
|
|
|
|
|
|
|
|
|
|
| |||
Balance at beginning of period |
| $ | 600 |
| $ | 350 |
| $ | — |
|
|
|
|
|
Restructuring charges: |
|
|
|
|
|
|
|
|
|
|
| |||
Continuing operations |
| 927 |
| 578 |
| 431 |
|
|
|
|
| |||
Discontinued operations |
| — |
| — |
| — |
|
|
|
|
| |||
Amounts paid |
| (227 | ) | (328 | ) | (81 | ) |
|
|
|
| |||
Balance at end of period |
| $ | 1,300 |
| $ | 600 |
| $ | 350 |
|
|
|
|
|
|
|
|
|
|
|
|
|
|
|
|
| |||
Total: |
|
|
|
|
|
|
|
|
|
|
| |||
Balance at beginning of period |
| $ | 2,592 |
| $ | 2,650 |
| $ | — |
|
|
|
|
|
Restructuring charges: |
|
|
|
|
|
|
|
|
|
|
| |||
Continuing operations |
| 1,594 |
| 797 |
| 4,009 |
|
|
|
|
| |||
Discontinued operations |
| — |
| — |
| 279 |
|
|
|
|
| |||
Amounts paid |
| (839 | ) | (855 | ) | (1,638 | ) |
|
|
|
| |||
Balance at end of period |
| $ | 3,347 |
| $ | 2,592 |
| $ | 2,650 |
|
|
|
|
|
UNITEK GLOBAL SERVICES, INC. AND SUBSIDIARIES
Notes to Consolidated Financial Statements
21F. Unaudited Quarterly Discontinued Operations
The following table presents quarterly results of discontinued operations:
|
| Three Months Ended |
| Three Months Ended |
| Three Months Ended |
| ||||||||||||
(in thousands, except per share amounts) |
| September 29, |
| October 1, |
| June 30, |
| July 2, |
| March 31, |
| April 2, |
| ||||||
|
|
|
|
|
|
|
|
|
|
|
|
|
| ||||||
Revenues |
| $ | 10,165 |
| $ | 18,726 |
| $ | 13,485 |
| $ | 21,523 |
| $ | 15,555 |
| $ | 16,076 |
|
(Loss) income from discontinued operations before income taxes |
| (37,836 | ) | 653 |
| (1,151 | ) | 645 |
| (1,186 | ) | (94 | ) | ||||||
Income tax (benefit) expense from discontinued operations |
| (7,063 | ) | 881 |
| 819 |
| 880 |
| 743 |
| 722 |
| ||||||
Loss from discontinued operations |
| $ | (30,773 | ) | $ | (228 | ) | $ | (1,970 | ) | $ | (235 | ) | $ | (1,929 | ) | $ | (816 | ) |
|
|
|
|
|
|
|
|
|
|
|
|
|
| ||||||
Net loss per share — basic and diluted: |
| $ | (1.64 | ) | $ | (0.01 | ) | $ | (0.10 | ) | $ | (0.01 | ) | $ | (0.12 | ) | $ | (0.05 | ) |
|
| Nine Months Ended |
| Six Months Ended |
|
|
|
|
| ||||||||
(in thousands, except per share amounts) |
| September 29, |
| October 1, |
| June 30, |
| July 2, |
|
|
|
|
| ||||
|
|
|
|
|
|
|
|
|
|
|
|
|
| ||||
Revenues |
| $ | 39,205 |
| $ | 56,325 |
| $ | 29,039 |
| $ | 37,599 |
|
|
|
|
|
(Loss) income from discontinued operations before income taxes |
| (40,173 | ) | 1,204 |
| (2,337 | ) | 551 |
|
|
|
|
| ||||
Income tax (benefit) expense from discontinued operations |
| (5,501 | ) | 2,483 |
| 1,562 |
| 1,602 |
|
|
|
|
| ||||
Loss from discontinued operations |
| $ | (34,672 | ) | $ | (1,279 | ) | $ | (3,899 | ) | $ | (1,051 | ) |
|
|
|
|
|
|
|
|
|
|
|
|
|
|
|
|
|
| ||||
Net loss per share — basic and diluted: |
| $ | (1.93 | ) | $ | (0.08 | ) | $ | (0.22 | ) | $ | (0.07 | ) |
|
|
|
|
UNITEK GLOBAL SERVICES, INC. AND SUBSIDIARIES
Notes to Consolidated Financial Statements
21G. Unaudited Quarterly Segment Information
The following tables present quarterly segment information:
|
| Three Months Ended |
| Three Months Ended |
| Three Months Ended |
| ||||||||||||
(in thousands) |
| September 29, |
| October 1, |
| June 30, |
| July 2, |
| March 31, |
| April 2, |
| ||||||
|
| (Restated) |
| (Restated) |
| (Restated) |
| (Restated) |
| (Restated) |
|
|
| ||||||
Revenues: |
|
|
|
|
|
|
|
|
|
|
|
|
| ||||||
Fulfillment |
| $ | 84,629 |
| $ | 81,814 |
| $ | 71,115 |
| $ | 68,627 |
| $ | 68,857 |
| $ | 63,589 |
|
Engineering & Construction |
| 45,853 |
| 17,545 |
| 28,931 |
| 14,927 |
| 17,282 |
| 11,992 |
| ||||||
Total |
| $ | 130,482 |
| $ | 99,359 |
| $ | 100,046 |
| $ | 83,554 |
| $ | 86,139 |
| $ | 75,581 |
|
|
|
|
|
|
|
|
|
|
|
|
|
|
| ||||||
Operating income (loss) |
|
|
|
|
|
|
|
|
|
|
|
|
| ||||||
Fulfillment |
| $ | 6,644 |
| $ | 9,353 |
| $ | 3,438 |
| $ | 3,959 |
| $ | (2,776 | ) | $ | 313 |
|
Engineering & Construction |
| 1,620 |
| 8,162 |
| (4,055 | ) | (4,595 | ) | (15,618 | ) | (3,109 | ) | ||||||
Total |
| $ | 8,264 |
| $ | 17,515 |
| $ | (617 | ) | $ | (636 | ) | $ | (18,394 | ) | $ | (2,796 | ) |
|
| Nine Months Ended |
| Six Months Ended |
|
|
|
|
| ||||||||
(in thousands) |
| September 29, |
| October 1, |
| June 30, |
| July 2, |
|
|
|
|
| ||||
|
| (Restated) |
| (Restated) |
| (Restated) |
| (Restated) |
|
|
|
|
| ||||
Revenues: |
|
|
|
|
|
|
|
|
|
|
|
|
| ||||
Fulfillment |
| $ | 224,601 |
| $ | 214,030 |
| $ | 139,972 |
| $ | 132,216 |
|
|
|
|
|
Engineering & Construction |
| 92,066 |
| 44,464 |
| 46,213 |
| 26,919 |
|
|
|
|
| ||||
Total |
| $ | 316,667 |
| $ | 258,494 |
| $ | 186,185 |
| $ | 159,135 |
|
|
|
|
|
|
|
|
|
|
|
|
|
|
|
|
|
|
| ||||
Operating income (loss) |
|
|
|
|
|
|
|
|
|
|
|
|
| ||||
Fulfillment |
| $ | 7,306 |
| $ | 13,625 |
| $ | 662 |
| $ | 4,272 |
|
|
|
|
|
Engineering & Construction |
| (18,053 | ) | 458 |
| (19,673 | ) | (7,704 | ) |
|
|
|
| ||||
Total |
| $ | (10,747 | ) | $ | 14,083 |
| $ | (19,011 | ) | $ | (3,432 | ) |
|
|
|
|
At September 29, 2012, June 30, 2012, March 31, 2012, October 1, 2011 and July 2, 2011 the total assets of the Fulfillment segment and the Engineering and Construction segment were $203.1 million and $161.4 million, $174.9 million and $172.3 million, $176.3 million and $163.7 million, $181.7 million and $160.5 million, and $173.1 million and $161.6 million, respectively. The most notable change was between the second and third quarters of 2012, which reflects an increase in the Fulfillment segment and a decrease in the Engineering and Construction segment. The increase in the Fulfillment segment was driven by the acquisition of Skylink, the Cable Acquisitions, and capital additions, partially offset by depreciation and amortization. The decrease in the Engineering and Construction segment was driven by the impairment of property and equipment and goodwill of the Wireline Group and depreciation and amortization, partially offset by increases in working capital in the wireless business and capital additions.
UNITEK GLOBAL SERVICES, INC. AND SUBSIDIARIES
Notes to Consolidated Financial Statements
22. Subsequent events
Stock-Based Compensation
On January 2, 2013, the Company awarded 377,983 RSUs to members of its management under the LTI Plan and 124,032 RSUs to members of the Board of Directors as a portion of their compensation for their service on the Board for 2013. On April 24, 2013 and June 4, 2013, the Company awarded 14,424 and 47,850 RSU’s, respectively, to new members of management.
Termination of Officers
As a result of an internal investigation conducted by the Audit Committee of the Company’s Board of Directors, with the assistance of outside independent counsel and a forensic accounting firm, it was determined that several employees of the Company’s Pinnacle Wireless subsidiary engaged in fraudulent activities that resulted in improper revenue recognition.
In connection with the Audit Committee investigation, Michael Hayford, President of the Pinnacle Wireless Division and several other employees of the Pinnacle Wireless division have been terminated. In addition, the Company’s Chief Financial Officer, Corporate Controller and another finance department employee have been terminated. None of the terminated individuals will receive severance.
NASDAQ
On April 16, 2013, the Company received a letter from NASDAQ stating that the Company is not in compliance with NASDAQ Listing Rule 5250(c)(1) (“Rule 5250(c)(1)”) because the Company did not timely file its Annual Report on Form 10-K for the year ended December 31, 2012 (the “Form 10-K”). The Company subsequently submitted to NASDAQ a plan to regain compliance with Rule 5250(c)(1), and on May 14, 2013, NASDAQ notified the Company that NASDAQ had determined to grant the Company an exception, through October 14, 2013, to regain compliance with the rule.
On May 20, 2013, the Company received an additional letter from NASDAQ stating that the Company also failed to comply with Rule 5250(c)(1) because the Company did not file its Quarterly Report on Form 10-Q for the quarter ended March 30, 2013 (the “Form 10-Q”). The Company has submitted an update to NASDAQ confirming that it expects to file the Form 10-Q before the October 14, 2013 exception deadline already granted for the filing of the Form 10-K. NASDAQ has advised the Company that it has also been afforded an exception until October 14, 2013 to file the Form 10-Q.
Litigation
There has been a consolidated class action law suit filed in the United States District Court for the Eastern District of Pennsylvania against the Company and certain of its current and former officers entitled In Re UniTek Global Services, Inc. Securities Litigation, Civil Action NO. 13-2119. The case alleges that the Company made misstatements and omissions regarding its business, its financial condition and its internal controls and systems in violation of the Sections 10(b) and 20(a) of the Securities Exchange Act of 1934 and Rule 10b-5 thereunder. Subject to certain limitations, the Company is obligated to indemnify its current and former officers in connection with any regulatory or litigation matter. This obligation arises under the terms of the Company’s Amended and Restated Articles of Incorporation, the Company’s Amended and Restated Bylaws and Delaware law. An obligation to indemnify generally means that the Company is required to pay or reimburse the individual’s reasonable legal expenses and possibly damages and other liabilities that may be incurred. The Company believes that it is likely that any potential loss exposure above its deductible of $0.3 million would be covered under the related insurance policies.
UNITEK GLOBAL SERVICES, INC. AND SUBSIDIARIES
Notes to Consolidated Financial Statements
Loan Compliance, Refinancing and Term Loan Amendment
In April 2013 the Company announced as a result of an internal investigation being conducted by the Audit Committee of the Company’s Board of Directors, it will restate its financial results for the year ended December 31, 2011 as well as certain 2012 and 2011 interim periods and a delay in the filing of its 2012 Annual Report on Form 10-K.
On April 30, 2013 the Company entered into a “Term Forbearance Agreement” and a “Revolver Forbearance Agreement” with its Term Loan Lenders and Revolving Loan Lenders to address certain events of default relative to, among other things, the failure to deliver its 2012 annual financial statements, the accuracy of previously provided financial statements and the provision to provide other financial information. The agreements provided for standstill periods expiring on May 30, 2012. Pursuant to this agreement, the Company paid a fee equal to 0.50% of the principal amount of the outstanding Term Loans as of April 30, 2013, or $0.7 million, which fee was added to the Term Loans as of April 30, 2013, and a fee of $0.1 million related to the Revolving Loan.
On June 3, 2013 and June 5, 2013, respectively, the Company entered into amendments to the Term Forbearance Agreement and the Revolver Forbearance Agreement with the Term Loan Lenders and Revolving Loan Lenders to extend through June 6, 2013 the termination of the standstill periods contained in such agreements. In addition to the Events of Default already subject to the Term Forbearance Agreement and the Revolver Forbearance Agreement, the amendment to the Term Forbearance Agreement also applies to an event of default relating to the interest payment that was due from the Company under the Term Loan Agreement on May 29, 2013 but was not paid until June 7, 2013.
On June 7, 2013 and June 13, 2013, respectively, the Company entered into further agreements with the Term Loan Lenders and Revolving Loan Lenders, the effect of which was to amend the original Term Forbearance Agreement and the Revolver Forbearance Agreement. These agreements extended through June 30, 2013 (subject to extension to July 10, 2013 under certain circumstances) the termination of the standstill periods contained in such forbearance agreements (“Forbearance Period”), and required the payment of a fee of $0.1 million related to the Revolving Loan.
The June 7, 2013 Term Forbearance Agreement describes certain events of default (as defined in the Term Loan Agreement) that have occurred or may occur in the future and provides that the parties to such Forbearance Agreement have agreed to a standstill period in respect of such events of default (collectively, the “Term Loan Known Defaults”) for a period during which, among other things, the Company would have the opportunity to deliver audited financial statements and related deliverables. Such standstill period terminated on July 10, 2013. Pursuant to the Term Forbearance Agreement, the Company will pay to the Term Lenders a forbearance fee equal to 2.50% of the principal amount of the outstanding Term Loans as of the effective date of the Term Forbearance Agreement, or $3.3 million, which fee was added to the principal amount of the outstanding Term Loans as of June 30, 2013. The Term Forbearance Agreement requires the Company to engage a financial advisor acceptable to the term lenders and to provide the term lenders with full access to such advisor during the forbearance period. The Term Forbearance Agreement also contains other covenants and restrictions customary to such agreements. On June 7, 2013, as a condition to the effectiveness of the Term Forbearance Agreement, the Company paid to the term lenders the interest payment that was originally due on May 29, 2013.
The June 13, 2013 Revolver Forbearance Agreement describes certain events of default (as defined in the Revolving Loan Agreement) that have occurred or may occur in the future and provides that the parties to the Revolver Forbearance Agreement have agreed to a standstill period in respect of such Events of Default (collectively, the “Revolver Loan Known Defaults”) for a period during which, among other things, the Company would have the opportunity to deliver audited financial statements and related deliverables required to be delivered pursuant to the Revolving Loan Agreement. The amendment to the Revolver Forbearance Agreement extended the standstill period in the Revolver Forbearance Agreement to July 10, 2013. The Amendment to the Revolver Forbearance Agreement required the Company to engage a financial advisor acceptable to the revolving lenders and to provide the revolving lenders with full access to such advisor during the forbearance period.
As required by the forbearance agreements the Company has engaged a financial advisor acceptable to the Revolving Loan Lenders and the Term Loan Lenders to, among other things, explore refinancing alternatives for its indebtedness and to address its tightening financial covenants and liquidity situation.
UNITEK GLOBAL SERVICES, INC. AND SUBSIDIARIES
Notes to Consolidated Financial Statements
Refinancing of Revolving Credit Facility
On July 10, 2013, the Company entered into a Revolving Credit and Security Agreement and Amended and Restated Fee Letter, both dated as of July 10, 2013 and amended on July 25, 2013 (collectively the “Revolving Credit Agreement”), by and among the Company, certain subsidiaries thereof, and Apollo Investment Corporation (“Apollo”). The Revolving Credit Agreement provides for a $75.0 million revolving credit facility (the “Revolving Loan”). Availability under the Revolving Loan is tied to a borrowing base that is calculated based on a percentage of eligible receivables, less the maximum amount of all undrawn letters of credit, less such reserves as the agent may reasonably deem necessary, plus an amount not to exceed the “Additional Borrowing Base Amount” (as defined in the Revolving Credit Agreement). The “Additional Borrowing Base Amount” shall mean (i) from July 10, 2013 through October 31, 2013, an amount equal to $30.0 million, (ii) from November 1, 2013 through and including November 30, 2013, an amount equal to $25.0 million and (iii) thereafter, an amount equal to $20.0 million.
The Revolving Loan may be used for general business purposes and matures on April 15, 2016. As a result of this refinancing, the Company used the proceeds of the Revolving Loan from Apollo to cash collateralize existing letters of credit issued by a prior Revolving Lender in an amount of $24.7 million (103% of the underlying letters of credit), as well as for the following purposes (in thousands):
Repayment of previous Revolving Loan and accrued costs |
| $ | 25,083 |
|
Payment of commitment fees (July 1 and at closing) |
| 3,000 |
| |
Payment of advisory and legal fees |
| 1,191 |
| |
The fees paid of $4.2 million are expected to be recorded as debt issuance costs and amortized over the life of the Revolving Loan. Costs associated with the prior Revolving Loan that was repaid of approximately $0.5 million are expected to be written off to expense as a result of this transaction.
The Company and its subsidiaries that are co-borrowers under the Revolving Credit Agreement may draw on the Revolving Loan and repay amounts borrowed in unlimited repetition up to the maximum allowed amount so long as no event of default has occurred and is continuing. The interest rate on the Revolving Loan as amended is LIBOR (subject to a 1% floor) plus a margin of between 9.25% or the Alternate Base Rate (currently the prime rate plus a margin of 8.25%). The Revolving Loan is subject to a commitment fee of 2.0% on the Maximum Revolving Advance Amount less the (i) average daily unpaid balance of revolving advances plus (ii) the maximum undrawn amount of all outstanding letters of credit.
Letters of credit up to $35.0 million may be issued pursuant to the Revolving Credit Agreement at an annual interest rate equal to 9.0%. However, all issued and outstanding letters of credit reduce the availability on a dollar for dollar basis.
The Revolving Credit Agreement contains customary representations and warranties as well as provisions for repayment, guarantees and other security. Specifically, the Revolving Credit Agreement provides the Revolving Lenders with security interests in the collateral of the Company and certain subsidiaries thereof. The Revolving Credit Agreement also contains customary events of default (which are in some cases subject to certain exceptions, thresholds and grace periods) including, but not limited to, nonpayment of principal and interest, failure to perform or observe covenants, breaches of representations and warranties and certain bankruptcy-related events.
The Revolving Credit Agreement requires the Company and certain subsidiaries thereof to be in compliance with specified covenants, including (i) a “Fixed Charge Coverage Ratio” (as such term is defined in the Revolving Credit Agreement) of not less than 1.2 to 1.0 for every fiscal quarter ended from and after the fiscal quarter ending March 31, 2014; and (ii) certain other covenants related to the operation of the Company’s business in the ordinary course. In the event of noncompliance with the financial covenant and other defined events of default, the Revolving Lenders are entitled to certain remedies, including acceleration of the repayment of amounts outstanding on the Revolving Loan.
Pursuant to its receipt of a commitment letter from Apollo for the Revolving Credit Agreement, the Company paid a commitment fee equal to 4% of the aggregate amount of the commitment under the Revolving Credit Facility, which totaled $3.0 million. An exit fee equal to 1% of the aggregate commitment under the Revolving Credit Facility is payable if the obligations under the Revolving Credit Facility are not paid in full and the Revolving Credit Facility is not voluntarily terminated within one year, and subject to certain other conditions set forth in the Amended and Restated Fee Letter.
UNITEK GLOBAL SERVICES, INC. AND SUBSIDIARIES
Notes to Consolidated Financial Statements
Amendment of Term Loan
On July 17, 2013, the Company entered into an amendment to the Term Loan Forbearance Agreement to extend the standstill period through July 26, 2013. Effective July 25, 2013, the Company and the Term Lenders entered into a Second Amendment and Limited Waiver to Credit Agreement (“Amended Term Loan”) whereby the Term Lenders have, among other things:
· Waived existing defaults related to the accuracy of financial information and delivery by the Company of certain financial information, including the delay in filing its audited financial statements for the year ended December 31, 2012 related to the Restatements.
· Waived any actual or potential financial covenant violations for the twelve month periods ending on each quarterly calculation date from June 30, 2011 through June 30, 2013.
· Waived cross defaults related to events of default under the Revolving Loan Agreement.
· Waived the event of default related to the failure to timely pay the interest payment due on May 29, 2013, such payment being made on June 7, 2013.
· Increased the monthly interest payable in cash at a rate equal to either LIBOR (with a 1.50% floor) plus 9.50% or the prime rate plus 8.50% (“Cash Interest”), plus, in either case, an amount to be added to the principal balance of the term loan at an annual rate equal to 4.00% of the outstanding balance (“PIK Interest”).
· Modified the mandatory prepayments of annual Excess Cash Flow (“ECF”), as defined to (a) increase the rate from 50% to 75% of ECF paid annually until the Consolidated Leverage Ratio is below 2.50:1.00, and (b) increased the minimum liquidity to $10 million (for the 2013 calculation payable in 2014) after giving effect to such payment of ECF.
· Reduced the limitation on the aggregate principal amount of outstanding capital lease obligations to no more than $15.0 million at any point in time.
· Limited Consolidated Capital Expenditures (as defined to exclude capital expenditures related to capital leases) to not exceed (a) $7,000,000 for the 2013 fiscal year and (b) $8,000,000 per annum for each fiscal year thereafter; provided, that (i) up to 100% of such amount in 2013 or the years thereafter, if not so expended in the fiscal year for which it is permitted, may be carried over for expenditure in the next succeeding fiscal year.
· Modified financial covenants for the Consolidated Leverage Ratio and Fixed Charge Coverage Ratio were modified for the twelve month periods ending September 30, 2013 and going forward, as shown in the table below for the next six quarters.
Fiscal Quarter |
| Consolidated Leverage Ratio |
| Fixed Charge Coverage Ratio |
|
September 30, 2013 |
| 5.65:1.00 |
| 1.29:1.00 |
|
December 31, 2013 |
| 4.90:1.00 |
| 1.32:1.00 |
|
March 31, 2014 |
| 4.87:1.00 |
| 1.25:1.00 |
|
June 30, 2014 |
| 4.26:1.00 |
| 1.31:1.00 |
|
September 30, 2014 |
| 4.11:1.00 |
| 1.32:1.00 |
|
December 31, 2014 |
| 3.94:1.00 |
| 1.38:1.00 |
|
Thereafter, the Consolidated Leverage Ratio decreases from 3.96 for the period ended March 31, 2015 down to 1.65 for the period ending December 31, 2017 and thereafter, and the Fixed Charge Coverage Ratio increases from 1.46 to 2.82 for the same time period.
UNITEK GLOBAL SERVICES, INC. AND SUBSIDIARIES
Notes to Consolidated Financial Statements
The amended term loans will continue to mature on April 15, 2018. In connection with the Term Amendment, the Company has issued warrants to the Term Lenders, exercisable at $0.01 per share, for shares of the Company’s common stock equal to 19.99% of the shares outstanding prior to the date of the Term Amendment (exercisable into approximately 3.8 million shares). The lenders also received a waiver and amendment fee, which has been added to the principal balance of the term loan, equal to 2.00% of the outstanding loan balance, or $2.8 million.
The warrants are subject to a Registration Rights Agreement which requires the Company to file a registration statement by November 15, 2013 to provide for resales and transfers of the common stock issuable upon any conversion or exercise of the warrants. If the registration statement filed is not declared effective within 120 days thereafter, subject to certain conditions, exceptions and grace periods, the Company must pay liquidated damages pursuant to the terms of the Registration Rights Agreement.
As a result of the Term Loan Forbearance Agreement, and related amendments, and the Amended Term Loan, the approximate outstanding balance of the Term Loans (prior to debt discount) was as follows as of July 26, 2013 (in thousands):
Amount outstanding at December 31, 2012 |
| $ | 132,973 |
|
Forbearance fees (0.5% and 2.5%) |
| 4,031 |
| |
Noncash penalty interest added to Term Loan |
| 1,339 |
| |
Amortization payments and other, net |
| (623 | ) | |
Second amendment waiver and amendment fee (2%) |
| 2,754 |
| |
Principal amount outstanding at July 26, 2013 |
| $ | 140,474 |
|
The Company incurred approximately $1.3 million in penalty interest for the period from October 1, 2012 through March 31, 2013 associated with the Forbearance Agreements, of which $0.7 million was included in interest expense for the fourth quarter of 2012 and the remaining amount will be included in interest expense in 2013. Additionally, due to the defaults, the Company paid additional cash interest of $0.9 million on the Term Loan from April 1, 2013 to July 26, 2013, and additional cash interest of $0.1 million associated with defaults pursuant to the Revolving Credit Agreement through July 10, 2013. The forbearance fees paid of $4.0 million are expected to be amortized as financing costs over the forbearance periods. The Company is still evaluating the accounting for the unamortized debt issuance costs and original issue discount from Term Loan to determine what, if any, amount should be charged to expense as a result of this transaction, as well as whether the refinancing should be treated as a modification or an extinguishment of the existing debt. Furthermore, the Company is evaluating the accounting for (i) fees paid for the amendment and waiver, and (ii) the valuation of the warrants issued in connection with the Amended Term Loan, as well as any derivatives that may be embedded in these instruments, to determine how much would be treated as additional debt issuance costs, increases to stockholders’ equity or charged to expense. The amounts associated with these conclusions could be significant.
DIRECTV, LLC
On May 16, 2013 the Company announced that its subsidiary, DirectSat USA, LLC, had received a letter from DIRECTV, LLC providing 180-day notice of the termination of its master services agreement with DirectSat, effective November 8, 2013. Shortly following receipt of the notice, DirectSat entered into an agreement with DIRECTV, LLC providing that the 180-day notice of termination will be automatically withdrawn upon the Company’s refinancing, by July 31, 2013, of its debt on terms that satisfy certain requirements including $10 million of liquidity, the continued work on completion of its consolidated financial statements and the satisfaction of other conditions. As a result of the Revolving Loan refinancing and Term Loan Amendment in July 2013, the Company concluded that the conditions had been satisfied. On July 25, 2013, DIRECTV, LLC formally withdrew its notice of termination after the Company notified it that the Company had satisfied all conditions requested.