Table of Contents
Exhibit 99.1
PROVINCE OF MANITOBA
ANNUAL REPORT
FOR THE YEAR ENDED
MARCH 31, 2003

PROVINCE DU MANITOBA
RAPPORT ANNUEL
POUR L’EXERCICE TERMINÉ
LE 31 MARS 2003
Includes:
| • | The Year in Review |
| • | Economic Report |
| • | Financial Indicators |
| • | Volume I — Public Accounts |
Sommaire:
| • | Bilan de L’année |
| • | Rapport économique |
| • | Indicateurs financiers |
| • | Volume I des comptes publics |
Table of Contents
HIS HONOUR PETER LIBA
Lieutenant-Governor of the Province of Manitoba
May It Please Your Honour:
I have the privilege of presenting, for the information of Your Honour, the Annual Report of the Province of Manitoba for the year ended March 31, 2003. This document completes the government’s accountability reporting for the year. The Report includes a review of this year’s results relative to the government’s budget. It also contains economic statistics and indicators of the financial health of the Province.
Included in this Annual Report is Volume 1 of the Public Accounts. The Public Accounts have been structured to reflect the intent to focus more attention on the summary results of the government reporting entity while still reporting on the government’s stewardship over the Consolidated Fund that is comprised of the Operating and Special Funds. It contains the summary financial statements of the reporting entity in section 1 and special purpose financial statements of the Operating Fund in section 2.
Section 6 of the Balanced Budget, Debt Repayment and Taxpayer Accountability Act requires the Minister of Finance to report on compliance with the Act in the audited financial statements of the Operating Fund for each fiscal year. The Combined Statement of Revenue and Expense shows a positive balance of $4 million in the Operating Fund. The Government is therefore in compliance with the Act. In accordance with the Balanced Budget legislation, this positive balance will be transferred to the Province’s Fiscal Stablilization Fund.
| /s/ Greg Selinger Honourable Greg Selinger Minister of Finance |
Office of the Minister of Finance
September, 2003
Table of Contents
SON HONNEUR PETER LIBA
Lieutenant-gouverneur de la province du Manitoba
Votre Honneur,
J’ai le privilège de vous présenter, à titre informatif, le Rapport annuel de la province du Manitoba pour l’exercice financier qui s’est terminé le 31 mars 2003. Cette nouvelle présentation du document complète le compte rendu des activités du gouvernement pour l’exercice. Le Rapport comprend une récapitulation des résultats de l’exercice par rapport au budget du gouvernement. Il contient également des statistiques économiques et des indicateurs de la santé financière de la province.
Ce rapport annuel comprend le Volume 1 des comptes publics. Les comptes publics ont été structurés de façon à exprimer l’intention du gouvernement de consacrer plus d’attention aux résultats sommaires de l’entité comptable du gouvernement tout en continuant de rendre des comptes sur la gestion par le gouvernement du fonds consolidé, lequel est composé du fonds de fonctionnement ainsi que du fonds spécial. La section 1 contient les états financiers sommaires de l’entité comptable et la section 2 renferme les états financiers à vocation spéciale relatifs au fonds de fonctionnement.
En vertu de l’article 6 de la Loi sur l’équilibré budgétaire, le remboursement de la dette et l’obligation de rendre compte aux contribuables, le ministre des Finances est tenu de faire rapport sur le respect de la Loi dans les états financiers vérifiés du fonds de fonctionnement pour chaque exercice financier. L’état des résultats et des bénéfices non répartis indique un solde positif de 4 millions de dollars dans le fonds de fonctionnement. Le gouvernement s’est donc conformé à la Loi. En vertu de la Loi sur le budget équilibré, le solde positif sera transféré au Fonds de stabilisation des recettes de la province dans le but de faire en sorte que des provisions soient disponibles.
| /s/ Greg Selinger Monsieur Greg Selinger Ministre des Finances |
Bureau du Ministre des Finances
Septembre 2003
TABLE OF CONTENTS
Table of Contents
| TABLE OF CONTENTS | PAGE | |||||
| Minister’s Message — The Year in Review | 7 | |||||
| Economic Report | 16 | |||||
| Financial Indicators — Summary Financial Statements | 21 | |||||
| Operating Fund Discussions and Analysis | 29 | |||||
| Operating Fund Details of Budgetary Performance | 30 | |||||
| Financial Indicators — Operating Fund Financial Statements | 33 | |||||
| Public Accounts — Volume 1 | ||||||
| Summary Financial Statements | 43 | |||||
| Special Purpose Statements: Operating Fund | 83 | |||||
| TABLE DES MATIÈRES | PAGE | |||||
| Message du ministre — Bilan de l’année | 7 | |||||
| Rapport économique | 16 | |||||
| Indicateurs financiers — États financiers sommaires | 21 | |||||
| Fonds de fonctionnement — Discussions et analyses | 29 | |||||
| Fonds de fonctionnement — Performance budgétaire détaillée | 30 | |||||
| Indicateurs financiers — États financiers du fonds de fonctionnement | 33 | |||||
| Volume 1 des comptes publics | ||||||
| États financiers sommaires | 43 | |||||
| États financiers à vocation spéciale : fonds de fonctionnement | 83 | |||||
Table of Contents
MINISTER’S MESSAGE
YEAR-END REVIEW
I am pleased to present the Public Accounts of Manitoba for the fiscal year ended March 31, 2003 and to report the following review of our achievements during the year.
Our Government has honoured its commitment to building Manitoba’s affordability advantage and has done so with a balanced approach to meeting our province’s needs. Over three years, we have implemented a plan for reductions in personal and business taxes, while continuing to meet our debt reduction targets. We have achieved stable economic growth in all parts of the province. Our unemployment rate remains the lowest in the country.
At the same time, we have continued to invest in vital public services. Among our most notable achievements in the fiscal year 2002/03, we have:
| • | reinforced both capital and operating support for health care; |
| • | maintained a 10 percent reduction in post-secondary tuition fees for three consecutive years while also providing significant resources to develop our community colleges; and |
| • | continued to implement innovative programs that contribute to early childhood development. |
The 2002/03 Manitoba Budget outlined initiatives in ten main areas.
1. Investing in Manitoba’s Future
In 2002/03, our Government continued to fund Manitoba schools at the rate of economic growth.
Total support for public education including direct operating grants, capital contributions, teachers’ pension costs and education tax credits was $1.1 billion.
MESSAGE DU MINISTRE
BILAN DE L’ANNÉE
Je suis heureux de présenter les comptes publics du Manitoba pour l’exercice terminé le 31 mars 2002 et de vous offrir une récapitulation des réalisations de l’année.
Notre gouvernement a rempli son engagement d’augmenter la capacité financière du Manitoba en adoptant une approche équilibrée dans sa réponse aux besoins de notre province. En trois ans, nous avons mis en oeuvre un plan visant à réduire l’impôt des particuliers et des sociétés, tout en continuant d’atteindre nos objectifs de réduction de la dette. Nous sommes parvenus à une croissance économique stable dans toutes les régions de la province. Notre taux de chômage demeure le plus faible au Canada.
Au cours de la même période, nous avons continué d’investir dans les services publics vitaux. Parmi nos réalisations les plus notables de l’exercice 2002-2003, nous avons :
| • | renforcé notre soutien aux immobilisations et au fonctionnement dans le secteur de la santé; |
| • | maintenu pour la troisième année consécutive la réduction de 10 % des frais de scolarité pour les études postsecondaires, tout en consacrant des ressources importantes au développement de nos collèges communautaires; |
| • | continué de mettre en oeuvre des programmes novateurs qui contribuent au développement des jeunes enfants. |
Le budget 2002-2003 du Manitoba prévoyait des initiatives dans dix secteurs principaux.
1. Investir dans l’avenir du Manitoba
En 2002-2003, notre gouvernement a continué de financer les écoles du Manitoba au rythme de la croissance économique. Le soutien total accordé à l’éducation publique sous forme de subventions directes de fonctionnement, d’apport de capitaux, de coûts liés aux régimes de retraite des enseignants et de crédit d’impôt pour études s’élevait à 1,1 milliard de dollars.
7
Table of Contents
As promised, we have taken action to redirect resources to the classroom as much as possible through amalgamation of school divisions from 57 to 38. We also continued to address the infrastructure deficit of post-secondary institutions. Our colleges and universities rebuilt with over $10.5 million in provincial investments.
Our goal has been to put a college or university education within reach of every young person who meets the entrance requirement. Over the period 1999 to 2002, enrolments have increased by almost 21.4 percent at colleges and universities. General tuition fees for Manitoba students were kept 10 percent lower than they were in 1999. In addition, we:
| • | eliminated property taxes for the universities, phased in over five years, beginning in 2002/03; |
| • | increased operating grants to universities and colleges by $28.6 million or 10.3 percent over three years; |
| • | provided 18 new and expanded college programs through the College Expansion Initiative in 2002/03; and |
| • | increased educational opportunities in 2002/03 for over 350 students with the opening of Phase One of Red River College’s downtown campus on Princess Street. |
2. Moving Ahead on Health Care
In 2002/03, our Government strengthened support for health care with an increase in funding of $163 million to a total of $2.8 billion.
We are continuing to find ways to deliver services even more cost-effectively and efficiently. Over the past year, we completed the amalgamation in southern Manitoba of the Regional Health Authorities of Marquette and South Westman. We initiated three new partnerships with other provinces to deliver specialized services on a regional basis.
We have continued to implement a comprehensive recruitment and retention strategy to meet the shortage of health care professionals. Over 400 nursing graduates entered the workforce this year. Our Family Doctor Connection has received over 44,000 calls since its launch in 2002.
Tel que promis, nous avons cherché à réacheminer en classe le plus de ressources possible. Pour ce faire, nous avons regroupé des divisions scolaires, dont le nombre est passé de 57 à 38. Nous avons continué de corriger le déficit infrastructurel des établissements d’enseignement postsecondaire. Des investissements provinciaux dépassant 10,5 millions de dollars ont ainsi permis à nos collèges et universités d’entamer des travaux de reconstruction.
Notre objectif est de mettre l’enseignement collégial et universitaire à la portée de tous les jeunes qui satisfont aux conditions d’admission. De 1999 à 2002, le nombre d’inscriptions dans les collèges et universités a augmenté de presque 21,4 %. Dans l’ensemble, les droits de scolarité des étudiants du Manitoba étaient toujours de 10 % inférieurs à leur niveau de 1999. Nous avons aussi :
| • | commencé à éliminer graduellement l’impôt foncier des universités sur une période de cinq ans à partir de 2002-2003; |
| • | augmenté les subventions de fonctionnement aux collèges et universités de 28,6 millions de dollars ou 10,3 % sur une période de trois ans; |
| • | proposé 18 nouveaux programmes collégiaux et programmes élargis dans le cadre de l’Initiative d’expansion des collèges communautaires en 2002-2003; |
| • | augmenté les possibilités d’enseignement offertes à plus de 350 étudiants en 2002-2003, avec l’ouverture du campus du Red River College situé sur la rue Princess (phase I). |
2. Continuer sur notre lancée en matière de santé
En 2002-2003, notre gouvernement a renforcé le soutien accordé au secteur de la santé en augmentant son financement par 163 million de dollars à un total de 2,8 milliards de dollars.
Nous continuons de trouver des moyens d’offrir des services de façon encore plus rentable et efficace. Au cours de la dernière année, nous avons terminé la fusion des offices régionaux de la santé de Marquette et du Sud-Ouest, au sud du Manitoba. Nous avons aussi établi trois nouveaux partenariats avec d’autres provinces dans le but d’offrir des services spécialisés sur une base régionale.
Nous avons poursuivi l’établissement d’une stratégie de recrutement et de maintien des effectifs solide pour mettre fin à la pénurie de professionnels de la santé. Plus de 400 diplômés en sciences infirmières ont joint la population active pendant l’année. La ligne téléphonique d’orientation vers les médecins de famille a reçu plus de 44 000 appels depuis son lancement en 2002.
8
Table of Contents
We initiated six major capital projects in 2002/03 with a total budget of $137 million, including the largest health capital project in Manitoba history at the Health Sciences Centre — expanding, modernizing and providing new technology.
With support from the federal government, in 2002/03 we provided $19.3 million to the regional health authorities for needed equipment and expanded hours of operation for equipment such as MRIs, the gamma knife and CT scanners. Our Government further provided over $22 million in 2002/03 to the regional health authorities for other basic and specialized equipment, like dialysis machines.
Other initiatives for 2002/03 included new community mental health measures, encompassing a support worker certificate program and training for mental health and addiction support workers; and a $5.5 million overhaul of emergency and cancer care services at Victoria General Hospital.
3. Strengthening Families
Healthy families are key to building Manitoba’s future. New investments in child care and Healthy Child Manitoba throughout our mandate demonstrate our strong commitment to early childhood development.
In 2002/03, we fully implemented the Healthy Baby Program, and expanded BabyFirst to more families. We piloted a new Healthy Schools initiative, and continued to enhance important programs to prevent fetal alcohol spectrum disorders. Under our very successful Parent Child Centred Approach, 26 coalitions received support for early childhood initiatives throughout the province.
From April 2000 to March 2003, Manitoba’s commitment for early childhood development has increased by over $40 million, which has been supported financially through a partnership with the federal government. In 2002/03, we built on these investments by introducing a multi-year child care plan that focuses on providing accessible quality care for children. In 2002/03, funding for Child Day Care was approximately $70 million.
Avec un budget de 137 millions de dollars, nous avons entrepris six projets d’immobilisations majeurs en 2002-2003, dont l’expansion et la modernisation du Centre des sciences de la santé, qui comprend l’ajout de nouvelles technologies, ce qui en fait le plus grand projet d’immobilisations de l’histoire du Manitoba dans le domaine de la santé.
Avec l’appui du gouvernement fédéral, nous avons versé, en 2002-2003, 19,3 millions de dollars aux offices régionaux de la santé pour l’achat de l’équipement requis et la prolongation du temps d’utilisation de matériel comme les appareils d’IRM, le scalpel Gamma et le tomodensitomètre. En 2002-2003, notre gouvernement a également versé plus de 22 millions de dollars aux offices régionaux de la santé pour qu’ils se procurent d’autre équipement de base et appareils spécialisés comme les dialyseurs.
Parmi les autres initiatives soutenues en 2002-2003 mentionnons l’introduction de nouvelles mesures communautaires en matière de santé mentale, dont un programme de certificat à l’intention des travailleurs de soutien et un programme de formation pour les travailleurs de soutien en santé mentale et en toxicomanie, ainsi qu’un projet de 5,5 millions de dollars visant la restructuration des services d’urgence et d’oncologie au Victoria General Hospital.
3. Consolider les familles
Assurer la santé des familles aide à préparer l’avenir du Manitoba. Les nouveaux investissements réalisés au cours de notre mandat dans les services à l’enfance et Enfants en santé Manitoba démontrent notre ferme engagement à l’égard du développement des jeunes enfants.
En 2002-2003, nous avons mis en oeuvre le programme Bébés en santé dans son intégralité et étendu le programme Priorité aux bébés à d’autres familles. Nous avons mis à l’essai l’initiative Écoles en santé et continué d’encourager d’importants projets visant la prévention du syndrome d’alcoolisme foetal. Notre Approche axée sur les parents et les enfants remporte un grand succès; 26 coalitions ayant obtenu une aide financière pour leurs initiatives à l’égard des jeunes enfants dans l’ensemble de la province.
D’avril 2000 à mars 2003, les fonds investis par le Manitoba dans le développement des jeunes enfants ont dépassé les 40 millions de dollars, grâce à un soutien financier découlant d’un partenariat avec le gouvernement fédéral. En 2002-2003, nous avons bâti sur ces bases en introduisant un plan pluriannuel des services à l’enfance axé sur la prestation de soins pour enfants abordables et de qualité. En 2002-2003, le financement des services de garde de jour pour enfants s’établissait à environ 70 millions de dollars.
9
Table of Contents
Our commitment to families is further demonstrated through the restoration of the National Child Benefit Supplement (NCBS). In 2002/03, we fully restored the NCBS for families with children age seven to eleven years.
Our government has demonstrated leadership in building a society that includes all citizens in community life. In 2002/03, we established the Disabilities Issues Office, and improved supports for adults and families with children who have disabilities.
4. Building safe, secure communities
Working with families, communities and other levels of government, we created programs like Neighbourhoods Alive! and the Winnipeg Housing and Homelessness Initiative to aid community revitalization. The Winnipeg Housing and Homelessness Initiative has approved funding for the repair, rehabilitation or redevelopment of over 1,200 housing units in Winnipeg.
In September 2002, the governments of Canada and Manitoba signed a five-year, $50.8 million Affordable Housing Agreement, which will improve the supply of affordable rental units and new housing in the province. Working in partnership with neighbourhood renewal corporations, community groups and private developers, we expect to create up to 2,500 affordable housing units under this initiative.
In 2002/03, we implemented a number of public safety initiatives to counter street gangs, organized crime, auto theft, and impaired driving. We also launched a new action plan to address child sexual exploitation, and continued to strengthen supports available to victims of crime. We announced that the Portage Correctional Institution for Women will be replaced with a modern female correctional centre.
5. Building the Economy; Strength in Diversity
Our achievements in health care, education and community development depend on a strong and growing economy. Manitoba’s diversified economy served us well in 2002/03:
Notre engagement envers les familles est encore plus évident avec le rétablissement du Supplément de la prestation nationale pour enfants (SPNE). En 2002-2003, nous avons rétabli le SPNE dans son intégralité pour les familles avec des enfants de sept à onze ans.
Notre gouvernement a pris les devants en bâtissant une société qui amène tous les citoyens à participer à la vie communautaire. En 2002-2003, nous avons créé le Bureau des personnes handicapées et amélioré le soutien fourni aux familles ayant des enfants handicapés.
4. Renforcer la sécurité des collectivités
En travaillant avec les familles, les collectivités et les autres ordres de gouvernement, nous avons mis sur pied des programmes comme Quartiers vivants et l’Initiative Logement et Sans-abri de Winnipeg, qui a approuvé le financement nécessaire à la réparation, à la réhabilitation et au réaménagement de plus de 1 200 unités de logement à Winnipeg.
En septembre 2002, les gouvernements du Canada et du Manitoba ont signé l’Entente de financement du logement abordable, s’élevant à 50,8 millions de dollars répartis sur cinq ans, qui permettra d’accroître le nombre de logements abordables et de nouveaux logements dans la province. En partenariat avec les organismes de rénovation des quartiers, les groupes communautaires et les promoteurs immobiliers, on a l’intention de créer jusqu’à 2 500 unités de logement abordable dans le cadre de ce projet.
En 2002-2003, nous avons mis sur pied un certain nombre de projets afin de combattre les gangs de rues, le crime organisé, les vols de biens et d’automobiles et la conduite avec facultés affaiblies. Nous avons aussi lancé un nouveau plan d’action pour mettre fin à l’exploitation sexuelle des enfants et continué de consolider les services de soutien offerts aux victimes de crime. Enfin, nous avons annoncé le remplacement du centre correctionnel pour femmes de Portage par un établissement pour femmes plus moderne.
5. L’économie manitobaine : la force de la diversité
Les progrès réalisés dans les secteurs de la santé, de l’éducation et du développement communautaire vont de pair avec une économie en pleine croissance. La diversité de l’économie du Manitoba nous a bien servis en 2002-2003 :
10
Table of Contents
| • | We outperformed western provinces in real GDP growth in 2002/03; |
| • | We had the lowest unemployment rate among all the provinces in 2002/03, at 5.2%; |
| • | Our labour force participation rate reached a record high of 69.2%, the second-highest participation rate among the provinces, behind Alberta; |
| • | Our farm cash receipts increased by 3.7% in 2002; |
| • | Our housing starts grew by 22.1% in 2002/03; and |
| • | Manitoba saw an increase of 3.0% in personal disposable income in 2002/03. |
Building for Manitoba’s successful future requires an ongoing commitment to research and innovation. Manitoba’s research and development spending relative to GDP is fourth-highest among the provinces. Manitoba has also experienced three consecutive years of increased private sector capital investment.
To date, about half of Manitoba’s hydro-electric potential has been developed. In partnership with Manitoba Hydro and the Nisichawayasihk Cree Nation (NCN), pre-project planning on a low-impact 200 mega watt project on the Burntwood River continued in 2002/03. We also entered into discussions with the Province of Ontario in 2002/03 regarding the feasibility of new hydro-electric generation in Manitoba and new transmission to Ontario.
With the support of the Official Opposition, we remain committed to an expanded Red River Floodway. For 2002/03, $360,000 was spent on initial expansion of the Floodway. Additionally, we provided over $20 million for flood protection for homes, businesses, farms and communities in the Red River Valley.
Solid transportation infrastructure is essential for economic growth and raising our collective standard of living. Spending on highway construction increased from 2001/02 by $18.5 million or almost 20 percent to over $112 million in 2002/03. We remain committed to the capital budget of $600 million in highway construction expenditure over five years that was announced in 2002/03.
| • | le taux de croissance réelle de notre PIB en 2002-2003 est supérieur à celui des autres provinces de l’Ouest; |
| • | notre taux de chômage, qui était de 5,2 % en 2002-2003, était le plus bas au pays; |
| • | notre taux de participation au marché du travail a atteint un niveau record (69,2 %), qui place le Manitoba au second rang derrière l’Alberta; |
| • | nos recettes monétaires agricoles ont augmenté de 3,7 % en 2002; |
| • | nos mises en chantier ont progressé de 22,1 % en 2002-2003; |
| • | le revenu disponible des Manitobains a augmenté de 3,0 % en 2002-2003. |
Bâtir un avenir prospère au Manitoba demande un engagement constant envers la recherche et l’innovation. Le Manitoba se situe au quatrième rang des provinces ayant le rapport le plus élevé entre leurs frais de recherche et développement et leur PIB. Les investissements de capitaux privés au Manitoba ont également augmenté pour la troisième année consécutive.
À ce jour, environ la moitié du potentiel hydroélectrique du Manitoba est exploitée. En partenariat avec Hydro Manitoba et la Nisichawayasihk Cree Nation (NCN), la phase préparatoire au projet de barrage de 200 mégawatts à faible impact de la rivière Burntwood s’est poursuivie en 2002-2003. Nous avons également amorcé des discussions avec la Province de l’Ontario en 2002-2003 concernant la faisabilité d’une nouvelle production hydroélectrique au Manitoba et d’une nouvelle transmission vers l’Ontario.
Notre engagement envers l’élargissement du canal de dérivation de la rivière Rouge est ferme et bénéficie du soutien de l’Opposition officielle. En 2002-2003, 360 000 $ ont été consacrés à l’élargissement initial du canal de dérivation. De plus, nous avons consacré plus de 20 millions de dollars pour la protection contre les inondations des maisons, des entreprises, des fermes et des localités situées dans la vallée de la rivière Rouge.
Il est essentiel de disposer d’une infrastructure de transport solide pour assurer la croissance économique et améliorer notre niveau de vie collectif. En 2002-2003, les fonds consacrés à la construction de routes ont augmenté de 18,5 millions de dollars ou presque 20 % par rapport à 2001-2002, pour atteindre 112 millions de dollars. Nous avons toujours l’intention de respecter notre budget en immobilisations consacré à la construction de routes annoncé en 2002-2003, qui est de 600 millions de dollars répartis sur cinq ans.
11
Table of Contents
6. Rural Communities
A number of initiatives have created a greater sense of hope and optimism in rural Manitoba. Our Bridging Generations Initiative is a land transfer program to help ease the transfer of family farms from one generation to the next. In 2002/03, 123 loans or a total of $14.6 million, were provided under the Program.
The Province, in partnership with the University of Manitoba, Western Economic Diversification and the private sector, is in the process of establishing a $25 million state-of-the-art functional foods and nutraceuticals research centre located in SMARTpark at the University of Manitoba. This facility, known as the Richardson Centre for Functional Foods and Nutraceuticals, will identify opportunities for Manitoba products to be processed into higher value-added functional foods.
In 2002/03, we provided $6 million for drainage projects in Manitoba communities, and support for livestock management initiatives that address water safety. We provided an additional $1 million through our Conservation District Program to improve drains and drainage-related infrastructure.
7. Urban Initiatives
Our urban centres are being transformed by a sustained period of growth and rejuvenation. The Neighbourhoods Alive! Initiative, which supports community-driven revitalization in designated neighbourhoods in Winnipeg, Brandon and Thompson, committed $3.5 million in 2002/03. In addition, in 2002/03 we implemented a $14 million Building Communities program, in full partnership with the City of Winnipeg.
In Brandon, funding has been approved for the repair, rehabilitation and development of over 400 housing units for low- and moderate-income families. Additional resources have expanded child day care services in the downtown area of Brandon.
8. Northern and Aboriginal Communities
In 2002/03, our Government continued to implement the Northern Development Strategy, expanding support particularly in the transportation, health and education/training sectors.
6. Collectivités rurales
Un certain nombre d’initiatives ont apporté un plus grand espoir et engendré davantage d’optimisme dans les collectivités rurales du Manitoba. C’est notamment le cas de l’initiative Pont entre les générations, un programme de transfert des terres conçu pour faciliter la transmission des exploitations agricoles familiales d’une génération à l’autre. En 2002-2003, 123 prêts totalisant 14,6 millions de dollars ont été consentis dans le cadre de ce programme.
En partenariat avec l’Université du Manitoba, le ministère de la Diversification de l’économie de l’Ouest et le secteur privé, la Province participe à la construction, dans le SMARTpark de l’Université, d’un Centre de recherche sur les aliments fonctionnels à la pointe de la technologie, dont le coût sera de 25 millions de dollars. Le Richardson Centre for Functional Foods and Nutraceuticals permettra de déterminer de quelle manière les produits du Manitoba peuvent être transformés en aliments fonctionnels à plus grande valeur ajoutée.
En 2002-2003, nous avons consacré 6 millions de dollars aux projets de drainage dans les localités manitobaines, en plus d’accorder un soutien aux initiatives de gestion du bétail qui tiennent compte de la qualité de l’eau. Un autre million de dollars a été versé dans le cadre de notre programme destiné aux districts de conservation, afin d’améliorer les drains et l’infrastructure de drainage.
7. Initiatives urbaines
Nos centres urbains sont en pleine transformation grâce à une période prolongée de construction et de revitalisation. En 2002-2003, nous avons annoncé un investissement de 3,5 millions de dollars dans le cadre de l’initiative Quartiers vivants, qui soutient la revitalisation de quartiers désignés à Winnipeg, Brandon et Thompson. Nous avons aussi établi le programme Renforcement des collectivités, qui dispose d’un budget de 14 millions de dollars, en partenariat avec la Ville de Winnipeg.
À Brandon, une aide financière a été approuvée pour la réparation, la réfection et la création de plus de 400 unités de logement destinées aux familles à revenu faible et modéré. D’autres ressources ont permis d’accroître les services de garde pour enfants au centre de Brandon.
8. Collectivités autochtones et du Nord
En 2002-2003, notre gouvernement a poursuivi sa mise en oeuvre de la Stratégie de développement du Nord, notamment dans les secteurs du transport, de la santé et de l’éducation.
12
Table of Contents
We are proud that Manitoba is the first province to give Aboriginal peoples province-wide responsibility for child and family services, providing for the establishment of Métis and First Nations Child and Family Services Authorities. Additional contributions in 2002/03 have increased total spending for this initiative to $2.5 million.
Working with Aboriginal and community partners, we initiated a Northern Housing Strategy to address housing challenges in the North and opened a Northern Model House in Thompson to demonstrate new technologies in housing construction.
Northern Manitoba also benefited from $2 million in federal/provincial funding for mining exploration. Our Government also introduced a 10 percent Mineral Exploration Tax Credit in 2002/03.
9. Environmental stewardship
Our economic strategy is sustainable because it respects the environment. In 2002/03, we acted on the recommendations in the Manitoba Climate Change Task Force Report by endorsing ratification of the Kyoto Protocol by the Federal Government and developing our own Climate Change Action Plan and the Manitoba Climate Change Action Fund.
Our Government’s efforts to reduce greenhouse gas emissions through development of renewable energy sources included working with Manitoba Hydro in a number of other areas:
| • | Examining the development of an east-west power grid that could enable the increased transfer of renewable energy to other provinces; |
| • | Development of new low-impact hydroelectric facilities, such as Wuskwatim; |
| • | Negotiating a Wind Energy Monitoring Program; |
| • | Conducting a Landfill Gas Study; and |
| • | Developing a provincial hydrogen strategy in consultation with industry stakeholders. |
Nous sommes fiers d’annoncer que le Manitoba est la première province à donner aux Autochtones l’entière responsabilité des services à l’enfant et à la famille dans l’ensemble de la province, en prévoyant l’établissement de régies des services à l’enfant et à la famille pour les Métis et les Premières Nations. Des cotisations supplémentaires versées en 2002-2003 ont augmenté les dépenses totales pour cette initiative à 2,5 millions de dollars.
Avec nos partenaires autochtones et communautaires, nous avons adopté une Stratégie de logement dans le Nord afin de répondre aux problèmes de logement dans cette région. Nous avons aussi ouvert une maison modèle à Thompson, où sont démontrées les nouvelles technologies en matière de construction domiciliaire.
Le nord du Manitoba a également bénéficié d’une aide financière fédérale-provinciale de deux millions de dollars consacrée à l’exploration minière. Enfin, notre gouvernement a proposé en 2002-2003 un nouveau crédit d’impôt à l’exploration minière de dix pour cent.
9. Gérance de l’environnement
Notre stratégie économique est durable, car elle respecte l’environnement. En 2002-2003, nous avons donné suite aux recommandations du rapport du Groupe de travail sur le changement climatique au Manitoba en endossant la ratification du Protocole de Kyoto par le gouvernement fédéral, en élaborant notre propre plan d’action sur le changement climatique et en créant le Fonds d’action sur le changement climatique.
Les efforts de notre gouvernement visant à réduire les émissions de gaz à effet de serre par le développement de sources d’énergie renouvelables comprenaient des projets conjoints avec Hydro Manitoba dans divers domaines :
| • | examen du développement d’un réseau électrique est-ouest qui pourrait se traduire par un plus grand transfert d’énergie renouvelable dans d’autres provinces; |
| • | création de nouvelles installations hydroélectriques à faible impact comme Wuskwatim; |
| • | négociation relative au programme de surveillance de l’énergie éolienne; |
| • | étude des gaz d’enfouissement; |
| • | élaboration d’une stratégie provinciale concernant l’hydrogène en consultation avec les intervenants de l’industrie. |
13
Table of Contents
Like other jurisdictions across North America, we have come to recognize the environmental and economic benefits of increased ethanol use for agricultural diversification and in meeting our climate change objectives, and established a new ethanol office.
10. Balanced Budget and Fiscal Stewardship
Manitoba’s economic performance was among the top five provinces in 2002/03. Notwithstanding this, Corporation Income Tax revenue dropped by over $146 million this year.
A major reduction in Personal Income Tax came into effect on January 1, 2002: the middle-bracket tax rate dropped from 16.2 percent to 15.4 percent. Further, the value of the personal non-refundable tax credit amounts increased by three percent. The changes we have delivered in our first three Budgets resulted in average Personal Income Tax savings of 11.5 percent.
In 2002/03, the federal government informed provinces that it had erred in its personal income tax remittances to Manitoba and several other provinces for up to 30 years. We were able to achieve a satisfactory resolution later that year with the federal government that will mitigate some of the effects, including an offset as well as a one-time transitionary payment of $140 million. Nonetheless, Manitoba will continue to feel the effects of this error as we adjust to a new, lower revenue track.
The $150 million in Hydro distributions, forecasted for 2001/02, was received and recorded in 2002/03. Budgetary revenue for 2002/03 totaled just over $6.9 billion — less than one percent more than 2001/02 actuals.
We realized net revenue of $77 million for the fiscal year 2002/03, prior to interfund transfers. The draw on the Fiscal Stabilization Fund, budgeted at $93 million, was only $23 million. We achieved a positive balance for Balanced Budget purposes of $4 million and, for the third consecutive year, $96 million was transferred to the Debt Retirement Fund. This fund helps to meet our goal of eliminating the General Purpose Debt and funding the province’s long-term pension liability. In 2002/03, $48 million of our $96 million debt retirement payment was allocated to address our pension liability.
In 2000, we introduced the first plan to reduce our overall pension liability. For the first time in 40 years, effective October 1, 2002, the full pension costs for each new employee became the responsibility of the hiring department or Government agency.
Comme d’autres gouvernements d’Amérique du Nord, nous reconnaissons maintenant les avantages que procure l’utilisation accrue de l’éthanol pour la diversification agricole et pour les objectifs que nous poursuivons dans le dossier du changement climatique. Nous avons aussi créé un nouveau bureau responsable de cette question.
10. Perspectives financières et équilibre budgétaire
En 2002-2003, le Manitoba se classait parmi les cinq provinces ayant affiché les meilleures performances économiques. Mais les recettes provenant de l’impôt sur les bénéfices des sociétés ont tout de même connu une réduction de plus de 146 millions de dollars.
Une réduction majeure de l’impôt sur le revenu des particuliers a pris effet le 1er janvier 2002, quand le taux de prélèvement pour la tranche d’imposition intermédiaire est passé de 16,2 à 15,4 %. De plus, la valeur des crédits d’impôt non remboursables a augmenté de 3 %. Les changements introduits dans les trois premiers budgets de notre gouvernement se sont traduits par une épargne fiscale moyenne de 11,5 % de l’impôt sur le revenu des particuliers.
En 2002-2003, le gouvernement fédéral a fait état d’une erreur dans ses remboursements de l’impôt sur le revenu des particuliers versés à plusieurs provinces, dont le Manitoba, erreur qui remontait jusqu’à 30 ans. Plus tard dans l’année, nous sommes parvenus à un règlement satisfaisant avec le gouvernement fédéral qui atténuera certains des effets escomptés. Ce règlement prévoit une compensation ainsi qu’un paiement de transition unique de 140 millions de dollars. Le Manitoba continuera tout de même de ressentir les effets de cette erreur en se rajustant à la diminution des recettes qui en découle.
Les répartitions d’Hydro Manitoba de 2001-2002, qui s’élevaient à 150 millions de dollars, ont été reçus et inscrits en 2002-2003. Les recettes budgétaires pour l’exercice 2002-2003 ont totalisé un peu plus de 6,9 milliards de dollars, soit une hausse inférieure à un pour cent par rapport aux recettes réelles de 2001-2002.
Nous avons affiché des recettes nettes de 77 millions de dollars au cours de l’exercice 2002-2003, avant les transferts interfonds. L’apport du Fonds de stabilisation des recettes n’a été que de 23 millions de dollars au lieu des 93 millions de dollars prévus. Nous avons obtenu un bilan positif de 4 millions de dollars au chapitre de l’équilibre budgétaire. Pour la troisième année consécutive, 96 millions de dollars ont été consacrés au remboursement de la dette. Ces fonds contribuent à répondre à nos objectifs d’élimination de la dette générale et de capitalisation de l’obligation provinciale à long terme découlant des régimes de retraite. En 2002-2003, 48 des 96 millions de dollars affectés au paiement de la dette ont été consacrés à l’obligation découlant des régimes de retraite.
En 2000, nous avons introduit le premier plan de réduction de toute l’obligation découlant des régimes de retraite. Le 1er octobre 2002, pour la première fois en 40 ans, le coût entier du régime de retraite de chaque nouveau fonctionnaire a commencé à être pris en charge par le ministère ou l’organisme gouvernemental qui l’embauche.
14
Table of Contents
Conclusion
Our Government continues to address the top priorities of Manitobans and meet the commitments set out in April of 2002 in a balanced and sustainable fashion. We have maintained quality public health care, created new education opportunities, and enhanced supports for families and safer communities - -while continuing to develop our economy and create jobs, maintain budget balances and debt repayment schedules, and provide additional tax relief for Manitobans. These results for the 2002/03 fiscal year reflect our commitment to provide responsible and affordable Government for Manitobans.
Conclusion
Notre gouvernement continue de répondre aux grandes priorités des Manitobains et de respecter ses engagements d’avril 2002 d’une manière équilibrée et durable. Nous avons maintenu des services de santé publics de qualité, amélioré les conditions d’accès à l’éducation, augmenté le soutien aux familles et aidé les collectivités à devenir plus sûres. Nous avons aussi continué d’assurer l’essor économique et de créer des emplois, de maintenir l’équilibre budgétaire, de respecter le calendrier du paiement de la dette et d’accorder un nouvel allégement fiscal aux Manitobains. Les résultats de l’exercice 2002-2003 sont conformes à notre engagement envers les Manitobains, qui s’attendent à être représentés par un gouvernement responsable et à l’écoute.
15
Table of Contents
ECONOMIC REPORT/RAPPORT ÉCONOMIQUE
Manitoba’s economy is one of the most diversified in Canada. This diversity is an ongoing source of strength and stability. Over the last five years, Manitoba’s real economic growth has been the most stable among provinces.
Strong consumer expenditure growth in 2002 increased real growth in Manitoba last year to 3.1%, just below the national growth rate of 3.3%. Manitoba’s real GDP advanced 1.5% in 2001.
Manitoba’s largest industry, manufacturing, posted 1.4% real growth in 2002. Real output in construction and agriculture increased 8.5% and 5.3%, respectively while the mining, other primary and utilities industries all declined.
Manitoba’s service industries together account for over 73% of the total economy. All fifteen service industry categories posted gains in 2002.
Gross Domestic Product
In 2002, Manitoba’s economy posted its tenth consecutive year of real Gross Domestic Product (GDP) growth, increasing 3.1%. Nominal GDP advanced 3.5% to $35.9 billion.
L’économie manitobaine est l’une des plus diversifiées du Canada. Cette diversité est une source permanente de force et de stabilité. Au cours des cinq dernières années, la croissance économique réelle du Manitoba a été l’une des plus stables des provinces canadiennes.
En 2002, la croissance des dépenses de consommation a fait augmenter la croissance réelle du Manitoba à 3,1 %, soit juste en deçà du taux national de croissance (3,3 %). Le PIB réel du Manitoba avait augmenté de 1,5 % en 2001.
La croissance réelle de la principale industrie du Manitoba, l’industrie manufacturière, était de 1,4 % en 2002. La production réelle dans les secteurs de la construction et de l’agriculture a augmenté de 8,5 % et de 5,3 % respectivement, mais a diminué dans les secteurs des mines, des autres industries primaires et des services publics.
Le secteur des services au Manitoba représente à lui seul plus de 73 % de l’économie totale. Les quinze catégories que compte ce secteur ont toutes enregistré des profits en 2002.
Produit intérieur brut
En 2002, l’économie manitobaine a connu sa dixième année consécutive de croissance du produit intérieur brut (PIB) réel, soit une augmentation de 3,1 %. Le PIB nominal, qui a augmenté de 3,5 %, se chiffre à 35,9 milliards de dollars.
Real GDP Growth (Percent Change)
Croissance du PIB réel (en pourcentage)
16
Table of Contents
Population
Manitoba’s population at July 1, 2002 — the official population for the year — was 1,150,800. The population growth for the year was 1,700 persons, an increase of 0.2% from the previous year.
Employment and Incomes
Total 2002 employment in Manitoba averaged 567,000, an increase of 1.6% from 2001. Part-time employment increased by 5.2% while full-time employment increased 0.8%. Manitoba’s unemployment rate increased 0.2% in 2002 to 5.2%. The Manitoba unemployment rate was the lowest in Canada and well below the national average of 7.7%.
Total personal income in Manitoba grew 2.4% in 2002. Personal disposable income (personal income after accounting for direct taxes and similar charges) grew 3.0%. Total labour income increased by 4.2%.
Population
La population du Manitoba au 1er juillet 2002 — statistique officielle pour cette année-là — s’élevait à 1 150 800 habitants. L’accroissement démographique pour l’année a été de 1 700 habitants, soit une augmentation de 0,2 % par rapport à l’année précédente.
Emploi et revenu
Au Manitoba, on a enregistré un total approximatif de 567 000 emplois pour 2002, soit une augmentation de 1,6 % par rapport à 2001. Les emplois à temps partiel ont augmenté de 5,2 % et les emplois à plein temps ont augmenté de 0,8 %. Le taux de chômage du Manitoba a augmenté de 0,2 % en 2002 pour atteindre 5,2 %. Le taux de chômage du Manitoba était le plus faible du Canada, bien en dessous de la moyenne nationale qui se situe à 7,7 %.
Le revenu total des particuliers a augmenté de 2,4 % au Manitoba en 2002. Le revenu disponible des particuliers (revenu personnel après les impôts directs et autres imputations similaires) a augmenté de 3,0 %. Le revenu total du travail a augmenté de 4,2 %.
Unemployment Rates (Percent)
Taux de chômage (en pourcentage)
17
Table of Contents
Investment
Total capital investment in 2002, as measured by Statistics Canada’s survey of private and public investment, increased 1.6% in 2002 to a record-high level of $5.68 billion. Private capital investment increased by 0.8% while public capital investment jumped by 4.0%.
Among industries, the growth in capital investment was led by housing (+18%), health and social services (+8%), public administration (+7%) and other services and construction (both +5%).
Investissements
Selon le sondage mené par Statistique Canada sur les investissements privés et publics, le total des investissements de capitaux a augmenté de 1,6 % en 2002 pour atteindre un niveau record de 5,68 milliards de dollars. Les investissements de capitaux privés ont augmenté de 0,8 %, tandis que les investissements de capitaux publics ont bondi de 4,0 %.
Les secteurs ayant le plus bénéficié de la croissance des investissements de capitaux sont l’immobilier (+ 18 %), la santé et les services sociaux (+ 8 %), l’administration publique (+ 7 %), ainsi que les autres services et la construction (+ 5 %).
Capital Investment (Billions of Dollars)
Investissements de capitaux (en milliards de dollars)
Sectoral Developments
Manitoba’s manufacturing shipments increased 0.6% in 2002, below the 1.9% increase for Canada overall. Good performance in the shipment of clothing, furniture, machinery and plastics helped offset declines in electrical, wood, chemicals and printing.
Développements sectoriels
Les expéditions de produits manufacturés du Manitoba ont augmenté de 0,6 % en 2002, ce qui est inférieur à la moyenne canadienne de 1,9 %. Les bons résultats observés dans les secteurs du vêtement, du meuble, de la machinerie et du plastique ont permis de compenser la baisse dans les secteurs de l’électricité, du bois, des produits chimiques et de l’imprimerie.
18
Table of Contents
Value of Manufacturing Shipments (Billions of Dollars)
Valeur des expéditions de produits manufacturées (en milliards de dollars)
Farm cash receipts for 2002 increased 3.7% to $3.8 billion, above the national increase of 2.1%. Receipts from crops increased 23.5%, with increases in all crop categories. Wheat and oilseeds accounted for about two-thirds of total crop receipts in 2002. Livestock receipts decreased 3.4%, with declines in hogs and cattle and calves. Direct payments declined 42.7%.
Les recettes monétaires agricoles ont augmenté de 3,7 % en 2002 pour atteindre 3,8 milliards de dollars, ce qui est supérieur à la moyenne nationale de 2,1 %. Les recettes tirées des récoltes ont augmenté de 23,5 %, avec des augmentations observées dans toutes les catégories de récoltes. Les recettes tirées des ventes de blé et de graines oléagineuses ont représenté environ les deux tiers du total des recettes tirées des récoltes en 2002. Les recettes tirées de la vente de bétail ont diminué de 3,4 %, en raison de la baisse dans les industries du porc, des bovins et des veaux. Les paiements directs ont aussi diminué de 42,7 %.
Growth in Farm Cash Receipts (Percentage Change)
Croissance des recettes monétaires agricoles (en pourcentage)

19
Table of Contents
The total value of mineral production in Manitoba declined 4.0% in 2002 to $982 million. The value of nickel produced declined 3.5% as a result of lower production volumes that were partially offset by higher prices. Nickel accounted for over 40% of total mineral production in Manitoba last year. The value of copper and zinc production also slipped in 2002, due to lower production volumes and weaker prices.
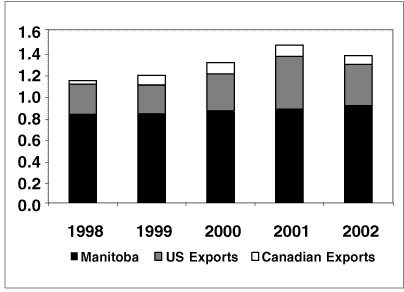
The value of hydro-electric sales by Manitoba HydroElectric Board decreased 6.6% due to low water levels. Manitoba sales increased 3.2% while export sales, principally to the United States, declined 20.8%.
The value of retail trade in Manitoba increased 7.2% in 2002 to $10.6 billion. This was the largest annual increase since 1997. The good performance was driven, in large part, by a 12.1% increase in motor vehicle sales last year. Retail sales in Winnipeg advanced 7.3%, while non-Winnipeg sales increased 6.9%.
Hydro-Electricity Sales
(Billions of Dollars)
Ventes d’énergie électrique
(en milliards de dollars)
La valeur totale de la production minérale au Manitoba a diminué de 4,0 % en 2002, pour atteindre 982 millions de dollars. La valeur de la production de nickel a diminué de 3,5 % en raison de la baisse du volume de production, mais cette baisse a été compensée en partie par la hausse des prix. Le nickel a représenté plus de 40 % du total de la production minérale au Manitoba l’an dernier. La valeur de la production du cuivre et du zinc a également chuté en 2002, en raison de la baisse du volume de production et des prix.
La valeur des ventes d’énergie électrique par la Régie de l’hydro-électricité du Manitoba a diminué de 6,6 % en raison du bas niveau d’eau. Les ventes au Manitoba ont augmenté de 3,2 %, tandis que les ventes destinées à l’exportation, principalement vers les États-Unis, ont diminué de 20,8 %.
Les ventes de détail au Manitoba ont augmenté de 7,2 % en 2002 pour atteindre 10,6 milliards de dollars. Il s’agit de l’augmentation annuelle la plus importante à cet égard depuis 1997. Ces bons résultats ont été en grande partie dus à l’augmentation de 12,1 % des ventes d’automobiles l’année dernière. Les ventes de détail à Winnipeg ont progressé de 7,3 %, et les ventes à l’extérieur de Winnipeg ont augmenté de 6,9 %.
20
Table of Contents
FINANCIAL INDICATORS/INDICATEURS FINANCIERS
SUMMARY FINANCIAL STATEMENTS/ÉTATS FINANCIERS SOMMAIRES
The Summary Financial Statements report on the entire government reporting entity. This includes all Crown organizations and government business enterprises (GBE) which are owned or directly controlled by the government. The Manitoba Hydro-Electric Board and the Manitoba Crop Insurance Corporation are two examples of these. A detailed listing of all organizations comprising the reporting entity can be found on Schedule 8 of the statements. The practice of netting the revenues and expenses of government business enterprises when calculating summary financial indicators was changed in 2002/03. These indicators now reflect the revenues and expenses on a gross basis.
Expenses and Revenue
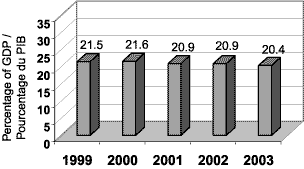
Total expenses in 2002/03 amounted to $11,321 million, an increase of $473 million or 4.4% over the 2001/02 fiscal year. Operating expenses, that is, total expenses less debt servicing costs, increased $612 million or 6.2% from 2001/02. Operating expenses amounted to 29.2% of Gross Domestic Product in 2002/03.
Total revenue in 2002/03 amounted to $11,086 million, an increase of $167 million or 1.5% over 2001/02. Federal transfers were $55 million higher than 2001/02. Revenues for the Manitoba Lotteries Corporation and the Manitoba Public Insurance Corporation increased $35 million and $37 million respectively.
Les états financiers sommaires concernent toute l’entité comptable du gouvernement, ce qui comprend tous les organismes de la Couronne et entreprises publiques que possède ou contrôle le gouvernement. La Régie de l’hydro-électricité du Manitoba et la Société d’assurance publique du Manitoba en sont deux exemples. La liste détaillée de tous les organismes formant l’entité comptable du gouvernement se trouve à l’annexe 8 des états financiers. La pratique qui consiste à présenter au net les revenus et dépenses des entreprises publiques au moment du calcul des états financiers sommaires a changé en 2002-2003. Ces données sont dorénavant présentées en chiffres bruts.
Recettes et dépenses
En 2002-2003, le total des dépenses s’élevait à 11 321 000 000 $, une hausse de 473 millions de dollars ou de 4,4 % comparativement à 2001-2002. Les dépenses de fonctionnement, soit le total des dépenses moins le coût du service de la dette, ont augmenté de 612 millions de dollars ou de 6,2 % depuis 2001-2002. En 2002-2003, les dépenses de fonctionnement s’élevaient à 29,2 % du PIB.
En 2002-2003, le total des recettes s’élevait à 11 086 000 000 $, une hausse de 167 millions de dollars ou de 1,5 % comparativement à 2001-2002. Les transferts fédéraux s’élevaient à 55 millions de dollars de plus qu’en 2001-2002. Les recettes de la Corporation manitobaine des loteries et de la Société d’assurance publique du Manitoba ont augmenté de 35 et de 37 millions de dollars respectivement.
21
Table of Contents
FINANCIAL INDICATORS/INDICATEURS FINANCIERS
SUMMARY FINANCIAL STATEMENTS/ÉTATS FINANCIERS SOMMAIRES
Total Expenses as a Percentage of GDP
Total des déspenses en pourcentage du PIB
Year Ended March 31, 2003
Exercice terminé le 31 mars 2003
Debt Service Charges
In 2002/03, the debt servicing cost reached a level of $856 million, representing approximately 7.6% of provincial expenses.
Frais de service de la dette
En 2002-2003, le coût du service de la dette a atteint 856 millions de dollars. Ce montant représente 7,6 % des dépenses provinciales.
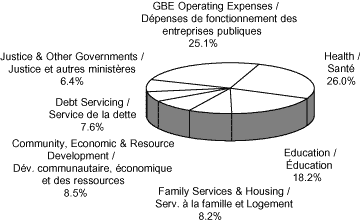
Major Expense Categories
Dépenses principales
22
Table of Contents
FINANCIAL INDICATORS/INDICATEURS FINANCIERS
SUMMARY FINANCIAL STATEMENTS/ÉTATS FINANCIERS SOMMAIRES
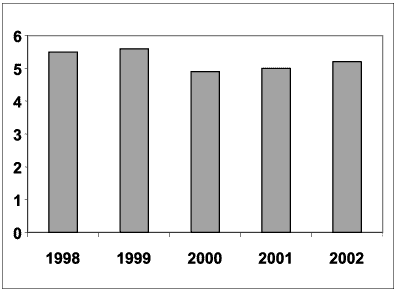
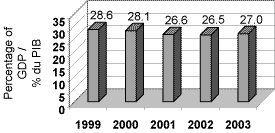
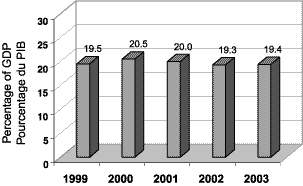
Net Debt to Provincial GDP
A measurement of debt growth in relation to economic growth, the Province’s ratio of net debt to GDP remained relatively stable at 27.0%.
Dette nette et PIB provincial
Le rapport entre la dette nette et le PIB, qui permet de comparer croissance de la dette et croissance économique, est demeuré relativement stable à 27,0 %.
Net Debt as a Percentage of GDP
Dette nette en pourcentage du PIB
Year Ended March 31, 2003
Exercice terminé le 31 mars 2003
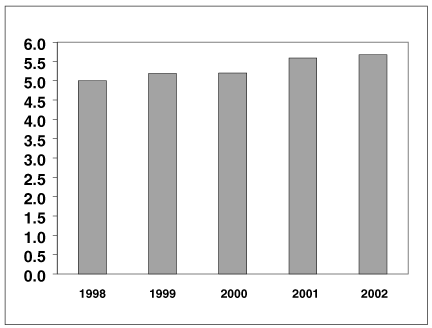
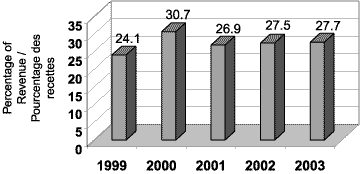
Debt Servicing Costs to Revenue
A measurement of debt servicing costs to revenue indicates whether the Province has more to spend on operations as opposed to debt servicing costs. In 2002/03, debt costs decreased to 7.7% from 9.1% in 2001/02.
Coût du service de la dette et recettes
Le coût du service de la dette par rapport aux recettes indique si la Province peut consacrer davantage de fonds au fonctionnement qu’au coût du service de la dette. En 2002-2003, ce coût a diminué de 9,1 à 7,7 % par rapport à 2001-2002.
Debt Servicing Costs as a Percentage of Provincial Revenue/
Coût du service de la dette en pourcentage des recettes
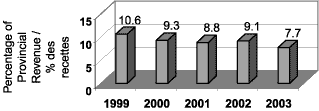
Year Ended March 31, 2003
Exercice terminé le 31 mars 2003
23
Table of Contents
FINANCIAL INDICATORS/INDICATEURS FINANCIERS
SUMMARY FINANCIAL STATEMENTS/ÉTATS FINANCIERS SOMMAIRES
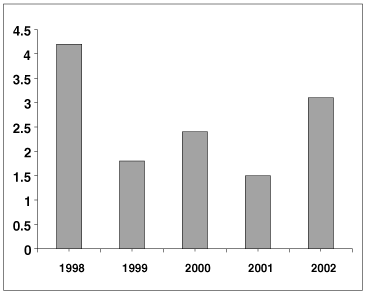
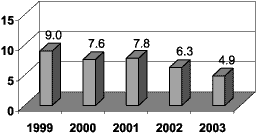
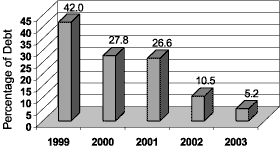
Foreign Debt to Net Debt
Decreasing the ratio of foreign currency debt to net government debt mitigates the risk of debt costs rising due to changes in foreign currency rates, and further improves the Province’s financial position. In 2002/03, the ratio of foreign debt to net debt decreased significantly for the fourth consecutive year, from 31.6% in 1999 to 3.9% currently.
Dette extérieure et dette nette
La diminution du pourcentage de la dette extérieure dans la dette nette du gouvernement réduit les risques d’une hausse du coût du service de la dette associée au taux de change, tout en aidant à améliorer la situation financière de la Province. En 2002-2003, ce pourcentage a beaucoup diminué pour la quatrième année consécutive, passant de 31,6 % en 1999 à 3,9 % à l’heure actuelle.
Foreign Debt as a Percentage of Net Debt/
Dette extèrieure en pourcentage de la dette nett
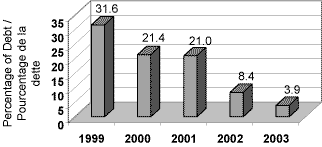
Year Ended March 31, 2003
Exercice terminé le 31 mars 2003
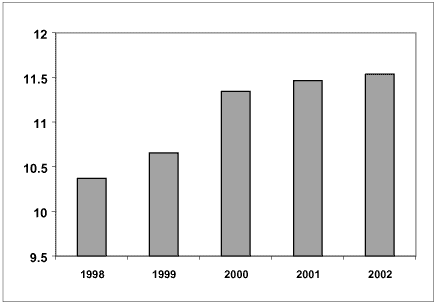
Net Debt per Capita
A decrease in the net debt per capita is an indication of a decreasing debt burden on a per person basis. This figure has remained relatively stable for the past five years, with an increase for 2002/03 to approximately $8,433.
Dette nette par habitant
Une diminution de la dette nette par habitant signale une réduction du fardeau de la dette par habitant. La dette nette par habitant est demeurée relativement stable au cours des cinq dernières années. En 2002-2003, elle a augmenté à environ 8 433 $.
Net Debt Per Capita/
Dette nette par Habitant
Year Ended March 31, 2003
Exercice terminé le 31 mars 2003
24
Table of Contents
FINANCIAL INDICATORS/INDICATEURS FINANCIERS
SUMMARY FINANCIAL STATEMENTS/ÉTATS FINANCIERS SOMMAIRES
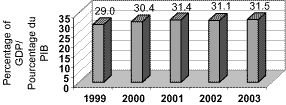
Own Source Revenue to Provincial GDP
A measurement of own-source revenue to provincial GDP indicates the level of taxes and charges the government requires for its operations relative to the economy. Over the last five years, this ratio has remained relatively stable, within a range of 22 - 26%.
Recettes autonomes et PIB provincial
Le rapport entre les recettes autonomes et le PIB provincial indique le niveau d’imposition et de frais requis par le gouvernement pour fonctionner sur le plan économique. Au cours des cinq dernières années, ce rapport est demeuré relativement stable, entre 22 et 26 %.
Own-Source Revenue as a Percentage of GDP/
Recettes autonomes en pourcentage du PIB
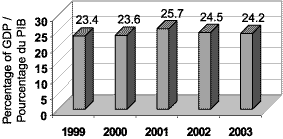
Year Ended March 31, 2003
Exercice terminé le 31 mars 2003
Federal Transfers to Own-Source Revenue
Federal transfers to own-source revenue is a measurement of the Province’s dependence on revenues from sources which are outside of its control.
Transferts fédéraux et recettes autonomes
Le pourcentage de recettes autonomes constitué de transferts fédéraux permet de mesurer le degré de dépendance aux recettes provenant de sources dont la Province n’assume pas le contrôle.
25
Table of Contents
FINANCIAL INDICATORS/INDICATEURS FINANCIERS
SUMMARY FINANCIAL STATEMENTS/ÉTATS FINANCIERS SOMMAIRES
Federal Transfer Pyaments as a Percentage of Own-Soucre Revenue/
Transferts fédéraux en pourcentage des recettes autonomes
Year Ended March 31, 2003
Exercice terminé le 31 mars 2003
26
Table of Contents
PROVINCE OF MANITOBA
OPERATING FUND
DISCUSSION AND ANALYSIS
AND
FINANCIAL INDICATORS
~
PROVINCE DU MANITOBA
DISCUSSIONS ET ANALYSES
FONDS DE FONCTIONNEMENT
ET
INDICATEURS FINANCIERS
27
Table of Contents
OPERATING FUND
DISCUSSION AND ANALYSIS
The Operating Fund reflects the central operations of the Government and is the basis for appropriations voted by the Legislature. It is through the Operating Fund that the Province records central government operations, including revenue, program expense, public debt costs and inter-fund transfers to debt/pension repayment and to/from the Fiscal Stabilization Fund. The Special Purpose Operating Fund and Special Funds financial statements provide a means of measuring results compared to voted appropriations and obligations with respect to The Balanced Budget, Debt Repayment and Taxpayer Accountability Act. The Operating Fund does not include the results of government enterprises and Crown organizations except to the extent that they may have received funding from or contributed revenue to the Operating Fund.
The following sections detail how the 2002/03 actual results varied from the 2002/03 Budget and the 2001/02 results.
The following pages present a brief analysis of actual results of the Operating Fund for the fiscal year ended March 31, 2003. Included are:
| • | Explanations of variances from the budget and from the previous year. |
| • | Financial indicators as they pertain specifically to the Operating Fund. |
FONDS DE FONCTIONNEMENT
DISCUSSION ET ANALYSE
Le fonds de fonctionnement renvoie aux opérations centrales du gouvernement et est à la base des autorisations votées par l’Assemblée législative. C’est à partir du fonds de fonctionnement que la Province inscrit ses opérations centrales du gouvernement qui englobent les recettes, les dépenses de programme, le coût de la dette publique et les transferts interfonds consacrés au remboursement de la dette, à l’obligation découlant des régimes de retraite et au Fonds de stabilisation des recettes. Le fonds de fonctionnement pour usage déterminé et les états financiers liés aux fonds spéciaux constituent un moyen de mesurer les résultats par rapport aux autorisations votées et aux obligations découlant de la Loi sur l’équilibre budgétaire, le remboursement de la dette et l’obligation de rendre compte aux contribuables. Le fonds de fonctionnement ne rend pas compte des résultats des organismes gouvernementaux et des corporations de la Couronne, sauf s’ils ont reçu un financement provenant du fonds de fonctionnement ou contribué au fonds.
Les sections qui suivent expliquent en détail les variations entre les résultats réels de 2002-2003 par rapport aux prévisions de 2002-2003 et aux résultats de 2001-2002.
Les pages qui suivent fournissent une brève analyse des résultats réels du fonds de fonctionnement pour l’exercice terminé le 31 mars 2003. On y trouve :
| • | une explication des écarts par rapport aux prévisions et à l’exercice précédent; |
| • | des indicateurs financiers propres au fonds de fonctionnement. |
29
Table of Contents
OPERATING FUND
DETAILS OF BUDGETARY
PERFORMANCE
Variance Explanations Compared to Budget
Net revenue of $77 million was realized for the fiscal year 2002/03, prior to interfund transfers. The draw on the Fiscal Stabilization Fund, budgeted at $93 million, was $23 million. A positive balance was achieved for Balanced Budget purposes of $4 million , compared to a budgeted amount of $10 million. In 2002/03, $48 million of our $96 million debt retirement payment was allocated to address our pension liability.
Total revenue was $80 million, or 1%, higher than the budget projection. This increase includes the $51 million adjustment to the Federal accounting error estimate. Expenses were $16 million, or 1%, higher than the budget projection.
Comparison to Budget
Excluding the distribution from Manitoba Hydro forecasted for 2001/02, total revenues decreased $70 million, or 1%, from the budget estimates. The decrease is primarily due to a $143 million, or 9.7%, decrease in Equalization revenue due to a federal data revision related to the Mining Tax base and other formula adjustments due to changes in the national economy and related revenues to be equalized among provinces. In addition, the 2002/03 distribution from Manitoba Hydro is limited to $53 million under the distribution arrangement. This is a reduction of $22 million from the budgeted level, and is a result of lower than expected water levels leading to lower Hydro profits. The Retail Sales Tax generated $1,007 million in revenue for 2002/03, a reduction of $26 million from the budget projection.
These revenue decreases are partially offset by a $13 million increase in Corporation Income Tax, a $10 million increase in Corporation Capital Tax and a $14 million increase in revenue from the Levy for Health and Education as a result of better than anticipated economic performance in the corporate sector. In addition, Canada Health and Social Transfer revenue increased $27 million, Manitoba
FONDS DE FONCTIONNEMENT
DÉTAILS DU RENDEMENT
BUDGÉTAIRE
Explications des écarts par rapport aux prévisions
Nous avons affiché des recettes nettes de 77 millions de dollars au cours de l’exercice 2002-2003, avant les transferts interfonds. L’apport du Fonds de stabilisation des recettes n’a été que de 23 millions de dollars au lieu des 93 millions de dollars prévus. Nous avons obtenu un bilan positif de 4 millions de dollars au chapitre de l’équilibre budgétaire, comparativement aux 10 millions de dollars projetés. En 2002-2003, 48 des 96 millions de dollars affectés au paiement de la dette ont été consacrés à l’obligation découlant des régimes de retraite.
Le total des recettes était de 80 millions de dollars ou 1 % plus élevé que les prévisions. Cette augmentation a compris l’ajustement de 51 million de dollars lié à l’erreur comptable du gouvernement fédéral. Les dépenses étaient de 16 millions de dollars ou 1 % supérieures aux prévisions.
Comparaisons avec les prévisions
Si l’on fait abstraction de la répartition prédite d’Hydro Manitoba pour 2001-2002, le total des recettes a diminué de 70 millions de dollars (1 %) par rapport aux prévisions. Cette baisse est due principalement à la réduction de 143 millions de dollars (9,7 %) dans les recettes de péréquation, en raison d’une révision des données fédérales liées à l’impôt minier ainsi qu’à divers rajustements de formule à la suite de changements de la situation économique nationale et de la répartition des recettes s’y rapportant parmi les provinces. De plus, répartition d’Hydro Manitoba en 2002-2003 s’est limité à 53 millions de dollars en vertu de l’accord de partage des recettes. C’est une réduction de 22 millions de dollars par rapport aux prévisions qui s’explique par des niveaux d’eau plus bas, qui génèrent moins de profits pour Hydro. Enfin, la Taxe sur les ventes au détail a généré 1 007 millions de dollars de recettes en 2002-2003, soit 26 millions de dollars de moins par rapport aux prévisions.
Ces baisses de recettes sont compensées en partie par une hausse de 13 millions de dollars des recettes tirées de l’impôt sur le bénéfice des sociétés, par une hausse de 10 millions de dollars des recettes tirées de l’Impôt sur le capital des corporations et à une hausse de 14 millions de dollars des recettes tirées de l’Impôt destiné à l’enseignement et aux services de santé, en raison d’un meilleur rendement économique que prévu dans le secteur corporatif. De plus, les recettes tirées du
30
Table of Contents
Lotteries Corporation net income increased $13 million and revenue from various other departmental revenue sources increased $31 million.
Total expenditures increased $16 million, or 1%, in total from the 2002/03 budget levels. The expenditure increase relates primarily to health care, agriculture and emergency expenditures. Health care expenditures increased $43 million as a result of wage settlements and continued price and volume pressures including pharmacare and medical services. Emergency expenditures are $21 million higher as a result of forest fire suppression and flood-related costs. Expenditures in most other departments are less than budgeted levels due to in-year expenditure management measures. Public debt servicing costs are $47 million, or 12.8%, less than budgeted as a result of a lower U.S. dollar debt exposure and lower interest rates.
Comparison to Previous Year
Total revenues increased by $125 million from the 2001/02 actual level excluding the distribution from Manitoba Hydro forecasted for 2001/02. The net increase is comprised of a number of increases and decreases, including increases related to the 2002/03 Manitoba Hydro distribution ($53 million), the Canada Health and Social Transfer ($71 million), Tobacco Tax ($42 million) due to the budgeted rate increase and Retail Sales Tax ($41 million, or 4.2%).
These increases were primarily offset by decreases in Corporation Income Tax ($146 million) resulting from a significant decline in national corporate income and a reduction in Equalization payments ($61 million) due to negative prior period adjustments. As well, revenues from Water Power Rentals were less than the previous year’s actuals ($12 million) due to lower water levels.
Transfert canadien en matière de santé et de programmes sociaux ont augmenté de 27 millions de dollars, les recettes nettes de la Corporation manitobaine des loteries ont augmenté de 13 millions de dollars et les recettes provenant de diverses sources ministérielles ont augmenté de 31 millions de dollars.
Le total des dépenses a augmenté de 16 millions de dollars ou 1 % par rapport aux prévisions de 2002-2003. L’augmentation des dépenses était liée principalement à la santé, à l’agriculture et aux dépenses d’urgence. Les dépenses en santé ont augmenté de 43 millions de dollars à la suite de règlements salariaux et de pressions soutenues sur les prix et les volumes touchant notamment les services pharmaceutiques et médicaux. Les dépenses urgentes s’élevaient à 21 millions de dollars de plus en raison des coûts liés à l’extinction des incendies de forêt et aux inondations. Les dépenses de la plupart des autres ministères étaient inférieures aux prévisions en raison des mises à jour des mesures de gestion des dépenses. Le coût du service de la dette publique était de 47 millions de dollars (12,8 %), ce qui est inférieur aux prévisions en raison de la réduction des créances en dollars américains et des taux d’intérêt.
Comparaisons avec l’exercice précédent
Le total des recettes a augmenté de 125 millions de dollars par rapport aux recettes réelles de 2001-2002, si l’on fait abstraction de la répartition d’Hydro Manitoba pour 2001-2002. L’augmentation nette est le résultat de hausses et de baisses diverses, dont la hausse liée au répartition d’Hydro Manitoba pour 2002-2003 (53 millions de dollars), au Transfert canadien en matière de santé et de programmes sociaux (71 millions de dollars), à la taxe sur le tabac (42 millions de dollars) due à l’augmentation du taux prévu au budget et à la Taxe sur les ventes au détail (41 millions de dollars ou 4,2 %).
Ces augmentations ont été compensées en grande partie par la réduction des recettes tirées de l’impôt sur les bénéfices des sociétés (146 millions de dollars) en raison de la chute des bénéfices des sociétés, ainsi qu’à la réduction des paiements de péréquation (61 millions de dollars) due aux ajustements sur exercices antérieurs négatifs. De plus, les recettes tirées des concessions d’énergie hydraulique ont été inférieures aux recettes réelles de l’exercice précédent (12 millions de dollars) en raison des niveaux d’eau qui étaient plus bas.
31
Table of Contents
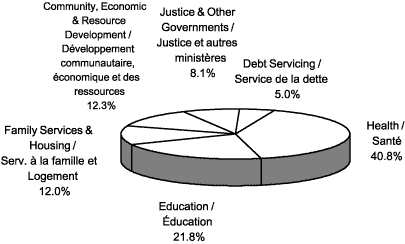
Total expenditures increased by $207 million or 3.1% from the 2001/02 actual level. Program expenditures increased $287 million primarily in the departments of Health ($163 million), Education ($45 million) and Family Services and Housing ($25 million), and Transportation and Government Services ($12 million). Offsetting the various increases was a $93 million year-over-year reduction in public debt servicing costs as a result of a lower U.S. dollar debt exposure and lower interest rates.
Le total des dépenses a augmenté de 207 millions de dollars ou 3,1 % par rapport au montant réel de 2001-2002. Les dépenses de programme ont augmenté de 287 millions de dollars, surtout dans les ministères de la Santé (163 millions de dollars), de l’Éducation (45 millions de dollars), des Services à la famille et du Logement (25 millions de dollars) et des Transports et des Services gouvernementaux (12 millions de dollars). Ces diverses hausses ont été compensées par la baisse de 93 millions de dollars sur douze mois du coût du service de la dette en raison de la réduction des créances en dollars américains et des taux d’intérêt.
32
Table of Contents
FINANCIAL INDICATORS/INDICATEURS FINANCIERS
OPERATING FUND/FONDS DE FONCTIONNEMENT
Expenses and Revenue
Total expenses in 2002/03 amounted to $6,944 million, an increase of $207 million or 3.1% over the 2001/02 fiscal year. Program expenses, that is, total expenses less the cost of servicing debt, increased $287 million from 2001/02. Program expenses amounted to 18.4% of Gross Domestic Product in 2002/03. Total revenue in 2002/03 amounted to $7,021 million, an increase of $275 million or 4.1% over 2001/02. This increase includes the $51 million adjustment to the Federal accounting error estimate. Federal transfers were $24 million higher than 2001/02. Corporate income taxes were $146 million lower, and personal income taxes were $23 million lower than 2001/02.
Recettes et dépenses
En 2002-2003, le total des dépenses s’élevait à 6 944 000 000 $, une hausse de 207 millions de dollars ou de 3,1 % comparativement à 2001-2002. Les dépenses de programme, soit le total des dépenses moins le coût du service de la dette, ont augmenté de 287 millions de dollars depuis 2001-2002. En 2002-2003, les dépenses de programme s’élevaient à 18,4 % du Produit intérieur brut.
En 2002-2003, le total des recettes s’élevait à 7 021 000 000 $, une hausse de 275 millions de dollars ou de 4,1 % comparativement à 2001-2002. Cette augmentation a compris l’ajustement de 51 million de dollars lié à l’erreur comptable du gouvernement fédéral. Les transferts fédéraux s’élevaient à 24 millions de dollars de plus qu’en 2001-2002.
L’impôt sur les bénéfices des sociétés a diminué de 146 millions de dollars et l’impôt sur le revenu des particuliers a augmenté de 23 millions de dollars par rapport à 2001-2002.
Total Expenses as a Percentage of GDP
Total des dépenses en pourcentage du PIB
Year Ended March 31, 2003
Exercice terminé le 31 mars 2003
Debt Service Charges
In 2002/03, the cost of servicing debt issued for the purpose of government programs reached a level of $347 million. This represented 5.0% of Operating Fund expenses, down significantly from 6.3% in 2001/02.
Frais de service de la dette
En 2002-2003, le coût du service de la dette afférente aux programmes gouvernementaux était de 347 millions de dollars. Ce montant représente 5,0 % des dépenses du Fonds de fonctionnement, comparativement à 6,3 % en 2001-2002, ce qui rend la baisse significative.
33
Table of Contents
FINANCIAL INDICATORS/INDICATEURS FINANCIERS
OPERATING FUND/FONDS DE FONCTIONNEMENT
Major Expense Categories
Dépenses en pourcentage du PIB
Net Debt to Provincial GDP
A measurement of debt growth in relation to economic growth, the Province’s 2002/03 ratio of net debt to GDP decreased, reflecting an improvement in the Province’s financial position.
Dette nette et PIB de la Province
Le rapport entre la dette nette et le PIB, qui permet de comparer croissance de la dette et croissance économique, a diminué au Manitoba en 2002-2003, signalant ainsi une amélioration de la situation financière de la Province.
Net Debt as a Percentage of GDP
Dette nette en pourcentage du PIB
Year Ended March 31, 2003
Exercice terminé le 31 mars 2003
34
Table of Contents
FINANCIAL INDICATORS/INDICATEURS FINANCIERS
OPERATING FUND/FONDS DE FONCTIONNEMENT
Debt Servicing Costs to Revenue
A measurement of debt servicing costs to revenue indicates whether the Province has more to spend on public programs as opposed to debt servicing costs. In 2002/03, debt servicing costs decreased significantly to 4.9% of revenue, from 6.3% in 2001/02.
Coût du service de la dette et recettes
Le coût du service de la dette par rapport aux recettes indique si la Province peut dépenser davantage dans les programmes publics. Le coût du service de la dette a énormément diminué, passant de 6,3 % des recettes en 2001-2002 à 4,9 % des recettes en 2002-2003.
Debt Servicing Costs as a Percentage of Provincial Revenue/
Coût du service de la dette en pourcentage des recettes
Year Ended March 31, 2003
Exercice terminé le 31 mars 2003
Foreign Debt to Net Debt
Decreasing the ratio of foreign currency debt to net government debt mitigates the risk of debt servicing costs rising due to changes in foreign currency rates, and further improves the Province’s financial position. In 2002/03, the ratio of foreign debt to net debt has decreased significantly for the last two years.
Dette extérieure et dette nette
La diminution du pourcentage de la dette extérieure dans la dette nette du gouvernement réduit les risques d’une hausse du coût du service de la dette associée au taux de change, tout en aidant à améliorer la situation financière de la Province. Ce pourcentage a beaucoup diminué au cours des deux dernières années.
Foreign Debt as a Percentage of Net Debt/
Dette extérieure en pourcentage de la dette nette
Year Ended March 31, 2003
Exercice terminé le 31 mars 2003
35
Table of Contents
FINANCIAL INDICATORS/INDICATEURS FINANCIERS
OPERATING FUND/FONDS DE FONCTIONNEMENT
Net Debt per Capita
A decrease in the net debt per capita is an indication of a decreasing debt burden on a per person basis. This figure has remained relatively stable for the past five years, with a decrease for 2002/03 to approximately $6,361.
Dette nette par habitant
Une diminution de la dette nette par habitant signale une réduction du fardeau de la dette par habitant. La dette nette par habitant est demeurée relativement stable au cours des cinq dernières années. En 2002-2003, elle a baissé à 6 361 $.
Net Debt Per Capita/
Dette nette par habitant
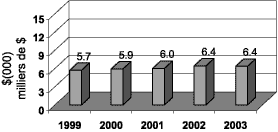
Year Ended March 31, 2003
Exercice terminé le 31 mars 2003
Own-Source Revenue to Provincial GDP
A measurement of own-source revenue to Provincial GDP indicates the level of taxes and charges the government requires for its operations relative to the economy. Over the last five years, this ratio has remained relatively stable.
Recettes autonomes et PIB provincial
Le rapport entre les recettes autonomes et le PIB provincial indique le niveau d’imposition et de frais requis par le gouvernement pour fonctionner sur le plan économique. Au cours des l’argent de l’économie de la Province. Au cours des cinq dernières années, ce rapport est demeuré relativement stable.
Own-Source Revenue as a Percentage of GDP/
Recettes autonomes en pourcentage du PIB
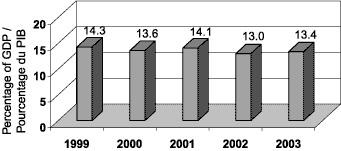
Year Ended March 31, 2003
Exercice terminé le 31 mars 2003
36
Table of Contents
FINANCIAL INDICATORS/INDICATEURS FINANCIERS
OPERATING FUND/FONDS DE FONCTIONNEMENT
Federal Transfers to Own-Source Revenue
Federal transfers to own-source revenue is a measurement of the Province’s dependence on revenues from sources which are outside of its control.
Transferts fédéraux et recettes autonomes
Le pourcentage de recettes autonomes constitué de transferts fédéraux permet de mesurer le degré de dépendance aux recettes provenant de sources dont la Province n’assume pas le contrôle.
Federal Transfer Payments as a Percentage of Own-Source Revenue/
Transferts fédéraux en pourcentage des recettes autonomes

Year Ended March 31, 2003
Exercice terminé le 31 mars 2003
37
Table of Contents
PUBLIC ACCOUNTS
VOLUME 1 FOR THE YEAR ENDED
MARCH 31, 2003
VOLUME 1
DES COMPTES PUBLICS
POUR L’EXERCICE TERMINÉ
LE 31 MARS 2003
Table of Contents
INTRODUCTION TO THE PUBLIC
ACCOUNTS OF MANITOBA
The Public Accounts of the Province of Manitoba are prepared by statutory requirement, in accordance with the Financial Administration Act, which is Chapter F55 of the Continuing Consolidation of the Statutes of Manitoba. The Public Accounts for the fiscal year ended March 31, 2003 consist of four volumes:
Volume 1
Volume 1 is published as part of the government’s Annual Report and has two sections:
| – | Section 1 — the Summary Financial Statements — reports on the entire government reporting entity. This includes all Crown organizations and government business enterprises which are owned or directly controlled by government. The Manitoba Crop Insurance Corporation and the Manitoba Hydro-Electric Board are two examples of these. A detailed listing of all organizations comprising the reporting entity can be found on Schedule 8 of the statements. |
| – | Section 2— the Operating and Special Funds Statements — are special purpose financial statements. The Operating Fund is the vehicle through which the government manages and controls the operations of government departments and programs, and does not include the results of government enterprises and Crown organizations except to the extent that they may have received funding from or contributed revenue to the Operating Fund. It is through the Operating Fund that the government reports on its stewardship of central government operations, including measurement of its results as compared to voted appropriations, and its obligations with respect to the Balanced Budget, Debt Retirement and Taxpayer Accountability Act. |
NOTE:
Volumes 2, 3 and 4 of the Public Accounts are published separately and are available for review at public libraries or for purchase at the Statutory Publications Branch of the department of Culture, Heritage and Tourism.
INTRODUCTION AUX COMPTES
PUBLICS DU MANITOBA
Les comptes publics de la Province du Manitoba sont préparés par obligation légale, conformément à la Loi sur la gestion des finances publiques, soit le chapitre 55 de la Codification permanente des lois du Manitoba. Les comptes publics pour l’exercice financier s’étant terminé le 31 mars 2003 comprennent quatre volumes.
Volume 1
Le volume 1 est inséré dans le Rapport annuel du gouvernement et se compose de deux sections.
La section 1, intitulée États financiers sommaires, rend compte de la totalité de l’entité comptable du gouvernement, ce qui comprend toutes les sociétés d’État et toutes les entreprises publiques qui appartiennent au gouvernement ou sont placées directement sous son contrôle. La Société d’assurance-récolte du Manitoba et la Régie de l’hydro-électricité du Manitoba en sont deux exemples. L’annexe 8 des états financiers comprend la liste détaillée de tous les organismes qui composent l’entité comptable.
La section 2, intitulée États financiers du fonds de fonctionnement et des fonds spéciaux, regroupe les états financiers à vocation spéciale. Le fonds de fonctionnement est l’outil dont se sert le gouvernement pour gérer et contrôler le fonctionnement des ministères et des programmes du gouvernement. Le fonds ne tient pas compte des résultats des entreprises publiques et des sociétés d’État, sauf si elles ont perçu du financement provenant du fonds ou si elles ont contribué à ses recettes. C’est par l’intermédiaire du fonds de fonctionnement que le gouvernement rend compte de sa gestion du fonctionnement du gouvernement central, gestion reflétée notamment par la mesure de ses résultats par rapport aux crédits approuvés et par le respect des obligations contenues dans la Loi sur l’équilibre budgétaire, le remboursement de la dette et l’obligation de rendre compte aux contribuables.
NOTE :
Les volumes 2, 3 et 4 des comptes publics sont publiés séparément. On peut les consulter dans les bibliothèques publiques ou s’en procurer un exemplaire à la Section des publications officielles du ministère de la Culture, du Patrimoine et du Tourisme.
41
Table of Contents
Volume 2
| – | Contains the audited Schedule of Public Sector Compensation Payments of $50,000 or more as paid through the Operating Fund as well as those paid by Special Operating Agencies. |
| – | Contains details of unaudited Operating Fund and Special Operating Agencies payments in excess of $5,000 to corporations, firms, individuals, other governments and government agencies. |
Volume 3
| – | Contains the details of the Operating Fund Financial Statements. |
| – | Contains the details of the Operating Fund borrowings and guarantees. |
| – | Contains the details of the Operating Fund revenue and expense. |
| – | Contains information provided under Statutory Requirement. |
| – | Contains information concerning certain Operating Fund financial indicators. |
| – | Contains glossary information. |
These statements are all unaudited with the exception of the following:
| – | The Report of Amounts Paid to Members of the Assembly; and |
| – | The Northern Affairs Fund |
Volume 4
| – | Contains the audited financial statements of funds, organizations, agencies and enterprises included in the Government Reporting Entity. |
Volume 2
| – | Ce volume contient le tableau vérifié des paiements d’indemnisation du secteur public totalisant 50 000 $ ou plus, qu’il s’agisse des paiements versés à même le fonds de fonctionnement ou de ceux versés par les organismes de service spécial. |
| – | Il indique également, en détail, les paiements non vérifiés totalisant plus de 5 000 $ et versés à même le fonds de fonctionnement, ou par les organismes de service spécial, à des sociétés, des entreprises, des particuliers et d’autres gouvernements ou organismes gouvernementaux. |
Volume 3
| – | Ce volume contient le détail des états financiers du fonds de fonctionnement. |
| – | Il contient le détail des emprunts et des garanties du fonds de fonctionnement. |
| – | Il contient le détail des recettes et des dépenses du fonds de fonctionnement. |
| – | Il contient des renseignements fournis par obligation légale. |
| – | Il contient des renseignements concernant certains indicateurs financiers du fonds de fonctionnement. |
| – | Il contient un glossaire. |
Ces états financiers sont tous non vérifiés, à l’exception des deux suivants :
| – | le rapport sur les sommes versées aux members de l’Assemblée législative; |
| – | le Fonds des Affaires du Nord. |
Volume 4
| – | Ce volume contient les états financiers vérifiés des fonds, des organisations, des organismes et des entreprises, y compris l’entité comptable du gouvernement. |
42
Table of Contents
SUMMARY FINANCIAL
STATEMENTS
FOR THE YEAR ENDED
March 31, 2003
43
Table of Contents
SECTION 1
SUMMARY FINANCIAL STATEMENTS
| TABLE OF CONTENTS | PAGE | ||||
| Statement of Responsibility | 46 | ||||
| Auditor’s Report | 49 | ||||
| Summary Statement of Financial Position | 51 | ||||
| Summary Statement of Revenue and Expense | 52 | ||||
| Summary Statement of Accumulated Deficit | 53 | ||||
| Summary Statement of Cash Flow | 54 | ||||
| Notes to the Summary Financial Statements | 55 | ||||
| Schedules to the Summary Financial Statements | 70 | ||||
| Schedule 1 — Summary Statement of Amounts Receivable | 70 | ||||
| Schedule 2 — Summary Statement of Loans and Advances | 71 | ||||
| Schedule 3 — Government Enterprises Schedule of Summary Operating Results and Financial Position | 72 | ||||
| Schedule 4 — Summary Statement of Long-Term Investments | 73 | ||||
| Schedule 5 — Summary Statement of Tangible Capital Assets | 74 | ||||
| Schedule 6 — Summary Statement of Borrowings | 75 | ||||
| Schedule 7 — Summary Statement of Accounts Payable, Accrued Charges, Provisions and Deferrals | 76 | ||||
| Schedule 8 — Funds, Organizations and Enterprises Comprising the Government Reporting Entity | 77 | ||||
| Schedule 9 — Reconciliation of Operating Fund Budgetary Balance to Summary Net Income | 80 | ||||
| Schedule 10 — Reconciliation of Operating Fund Accumulated Deficit to Summary Accumulated Deficit* | 81 | ||||
| Schedule 11 — Summary Statement of Expense by Type | 82 | ||||
| Schedule 12 — Summary Statement of Net Debt | 82 | ||||
45
Table of Contents
STATEMENT OF RESPONSIBILITY
The Summary Financial Statements are prepared under the direction of the Minister of Finance in accordance with the stated accounting policies of the government reporting entity and include summary statements of financial position, revenue and expense, accumulated deficit, cash flow, notes and schedules to the statements. Together, they present fairly, in all material respects, the financial condition of the government reporting entity at the fiscal year end and the results of its operations for the year then ended.
The government is responsible for the integrity and objectivity of the Summary Financial Statements. In the preparation of these statements, estimates are sometimes necessary because a precise determination of certain assets and liabilities is dependent on future events. The government believes such estimates have been based on careful judgements and have been properly reflected in the Summary Financial Statements.
These financial statements are tabled in the Legislature. They are referred to the Standing Committee on Public Accounts, which reports to the Legislature on the results of its examination together with any recommendations it may have with respect to the financial statements and accompanying audit opinion.
| On behalf of the Government | |
| /s/ Greg Selinger | |
| HONOURABLE GREG SELINGER Minister of Finance September 22, 2003 |
46
Table of Contents
Office of the Auditor General
500 — 330 Portage Avenue
Winnipeg, Manitoba
CANADA R3C 0C4
AUDITOR’S REPORT
On the Summary Financial Statements for the Government Reporting Entity
Province of Manitoba
To the Legislative Assembly of the Province of Manitoba
I have audited the summary statement of financial position of the Province of Manitoba as at March 31, 2003 and the summary statements of revenue and expense, accumulated deficit and cash flow for the year then ended. These financial statements are the responsibility of the Government of Manitoba. My responsibility is to express an opinion on these financial statements based on my audit.
I conducted my audit in accordance with Canadian generally accepted auditing standards. Those standards require that I plan and perform an audit to obtain reasonable assurance whether the financial statements are free of material misstatement. An audit includes examining, on a test basis, evidence supporting the amounts and disclosures in the financial statements. An audit also includes assessing the accounting principles used and significant estimates made by management, as well as evaluating the overall financial statements presentation.
In my opinion, these Summary Financial Statements for the Government Reporting Entity present fairly, in all material respects, the financial position of the Province of Manitoba as at March 31, 2003 and the results of its operations and its cash flow for the year then ended, in accordance with the accounting policies disclosed in Note 1 to the financial statements applied on a basis consistent with that of the preceding year.
| /s/ Jon W. Singleton | ||
| Winnipeg, Manitoba September 22, 2003 | Jon W. Singleton, CA•CISA Auditor General |
Table of Contents
SUMMARY FINANCIAL STATEMENTS
SUMMARY STATEMENT OF FINANCIAL POSITION
As at March 31, 2003
| ($ millions) | |||||||||||
| SCHEDULE | 2003 | 2002 | |||||||||
ASSETS | |||||||||||
| Cash and cash equivalents (Note 2) | 712 | 663 | |||||||||
| Temporary investments (Note 3) | 228 | 200 | |||||||||
1 | Amounts receivable | 730 | 880 | ||||||||
| Inventories | 27 | 26 | |||||||||
| Portfolio investments (Note 3) | 33 | 30 | |||||||||
2 | Loans and advances | 579 | 579 | ||||||||
3 | Equity in government enterprises (Note 6) | 1,369 | 1,528 | ||||||||
4 | Other long-term investments | 7 | 7 | ||||||||
| Deferred charge for non-devolved health care facilities (Note 1A5) | 133 | 137 | |||||||||
5 | Tangible capital assets | 2,001 | 1,874 | ||||||||
| Pension assets (Note 12) | 151 | 107 | |||||||||
| Assets of non-devolved health care facilities (Note 1A4) | 775 | 759 | |||||||||
TOTAL ASSETS | 6,745 | 6,790 | |||||||||
LIABILITIES | |||||||||||
6 | Borrowings | 19,746 | 20,682 | ||||||||
| Less: Sinking funds (Note 7) | (5,875 | ) | (6,551 | ) | |||||||
| Less: Debt incurred for and repayable by the Manitoba Hydro-Electric | |||||||||||
| Board and Manitoba Lotteries Corporation | (5,573 | ) | (5,871 | ) | |||||||
| 8,298 | 8,260 | ||||||||||
| Less: Unamortized foreign currency fluctuation | (81 | ) | (143 | ) | |||||||
| Net borrowings | 8,217 | 8,117 | |||||||||
7 | Accounts payable, accrued charges, provisions and deferrals | 1,913 | 1,954 | ||||||||
| Pension liability (Note 12) | 3,411 | 3,217 | |||||||||
| Liabilities of non-devolved health care facilities (Note 1A4) | 698 | 682 | |||||||||
TOTAL LIABILITIES | 14,239 | 13,970 | |||||||||
12 | ACCUMULATED DEFICIT | 7,494 | 7,180 | ||||||||
Information concerning the Government’s Guarantees, Financial Commitments, and Contingencies can be found in Notes 8, 9, and 10.
51
Table of Contents
SUMMARY FINANCIAL STATEMENTS
SUMMARY STATEMENT OF REVENUE AND EXPENSE
For the Year Ended March 31, 2003
| ($ millions) | ||||||||||||
| 2003 | 2002 | |||||||||||
REVENUE | ||||||||||||
| Manitoba Collections: | ||||||||||||
| Retail sales tax | 1,007 | 966 | ||||||||||
| Fuel taxes | 231 | 223 | ||||||||||
| Levy for health and education | 257 | 244 | ||||||||||
| Mining tax | 18 | 9 | ||||||||||
| Other taxes | 461 | 401 | ||||||||||
| Fees and other revenue | 1,109 | 1,034 | ||||||||||
| Government Enterprise Transfers (Schedule 3): | ||||||||||||
| Liquor Control Commission | 166 | 163 | ||||||||||
| Manitoba Hydro | 203 | — | ||||||||||
| Manitoba Lotteries Corporation | 266 | 248 | ||||||||||
| Income taxes: | ||||||||||||
| Corporation income tax | 160 | 306 | ||||||||||
| Individual income tax | 1,636 | 1,659 | ||||||||||
| Federal transfers: | ||||||||||||
| Equalization | 1,338 | 1,399 | ||||||||||
| Canada Health and Social Transfer | 756 | 685 | ||||||||||
| Medical Equipment Fund | 16 | 3 | ||||||||||
| Primary Care Transition Fund | 1 | — | ||||||||||
| Shared cost and other | 294 | 263 | ||||||||||
TOTAL REVENUE | 7,919 | 7,603 | ||||||||||
EXPENSES | ||||||||||||
| Health | 2,955 | 2,740 | ||||||||||
| Education | 2,059 | 1,998 | ||||||||||
| Family Services and Housing | 930 | 893 | ||||||||||
| Community, Economic and Resource Development | 960 | 908 | ||||||||||
| Justice and Other Government | 724 | 685 | ||||||||||
| Debt Servicing (Note 14) | 367 | 502 | ||||||||||
TOTAL EXPENSES (Schedule 11) | 7,995 | 7,726 | ||||||||||
NET LOSS BEFORE EXTRAORDINARY ITEM | (76 | ) | (123 | ) | ||||||||
Adjustment to estimate for Federal accounting error (Note 18) | 51 | — | ||||||||||
NET LOSS | (25 | ) | (123 | ) | ||||||||
Increase (decrease) in equity in government enterprises (Schedule 3) | (159 | ) | 113 | |||||||||
SUMMARY NET LOSS (Schedule 9) | (184 | ) | (10 | ) | ||||||||
52
Table of Contents
SUMMARY FINANCIAL STATEMENTS
SUMMARY STATEMENT OF ACCUMULATED DEFICIT
For the Year Ended March 31, 2003
| ($ millions) | ||||||||||
| 2003 | 2002 | |||||||||
| Opening accumulated deficit | (7,257 | ) | (6,982 | ) | ||||||
| Federal accounting error (Note 18) | — | (287 | ) | |||||||
| Accrual of employee future benefits | — | 14 | ||||||||
| Net income stabilization account (Note 4C) | (19 | ) | — | |||||||
| Tangible capital assets (Note 4A) | (6 | ) | 4 | |||||||
| Restatement of pension liability related to RHA employees (Note 4B) | (11 | ) | — | |||||||
| Municipal Tax Sharing (Note 4D) | (23 | ) | — | |||||||
| Net assets of devolved health care facilities | ||||||||||
| Adjustment re accrual of employee future benefits (Note 4E) | (7 | ) | 6 | |||||||
| Restatement of net assets to liabilities (Note 4E) | 4 | (5 | ) | |||||||
| Employee future benefits of non-devolved health care facilities (Note 4F) | (69 | ) | — | |||||||
| Repurchase of serial debentures (Note 1E) | 1 | 3 | ||||||||
| Summary net loss for the year | (184 | ) | (10 | ) | ||||||
| (7,571 | ) | (7,257 | ) | |||||||
| Equity in non-devolved health care facilities (Note 1C and Note 5) | ||||||||||
| Balance, beginning of year | 77 | 71 | ||||||||
| Recognition of non-devolved health care facilities | — | 3 | ||||||||
| Net income for the year | — | 3 | ||||||||
| 77 | 77 | |||||||||
| Closing accumulated deficit (Schedule 12) | (7,494 | ) | (7,180 | ) | ||||||
53
Table of Contents
SUMMARY FINANCIAL STATEMENTS
SUMMARY STATEMENT OF CASH FLOW
For the Year Ended March 31, 2003
| ($millions) | ||||||||||||
| 2003 | 2002 | |||||||||||
| Cash and cash equivalents provided by (used in) | ||||||||||||
| Operating activities: | ||||||||||||
| Summary net loss for the year | (184 | ) | (10 | ) | ||||||||
| Changes in non-cash items: | ||||||||||||
| Temporary investments | (28 | ) | 472 | |||||||||
| Amounts receivable | 142 | 33 | ||||||||||
| Valuation allowance | 24 | 8 | ||||||||||
| Inventories | (1 | ) | 5 | |||||||||
| Portfolio investments | (3 | ) | (8 | ) | ||||||||
| Accounts payable, accrued charges, provisions and deferrals | (41 | ) | 10 | |||||||||
| Pension liability | 194 | 167 | ||||||||||
| Amortization of foreign currency fluctuation | 17 | 58 | ||||||||||
| Amortization of debt discount | 10 | 14 | ||||||||||
| Amortization of investment discounts and premiums | (14 | ) | (4 | ) | ||||||||
| Amortization of tangible capital assets | 130 | 131 | ||||||||||
| Adjustment to Accumulated Deficit — Federal Accounting Error | — | (287 | ) | |||||||||
| Adjustment to Accumulated Deficit — Other | (130 | ) | 19 | |||||||||
| 116 | 608 | |||||||||||
| Changes in equity in government enterprises | (159 | ) | (113 | ) | ||||||||
| (43 | ) | 495 | ||||||||||
| Investing activities: | ||||||||||||
| Made | (1,494 | ) | (1,141 | ) | ||||||||
| Realized | 2,169 | 744 | ||||||||||
| Acquisition of tangible capital assets | (270 | ) | (202 | ) | ||||||||
| 405 | (599 | ) | ||||||||||
| Financing activities: | ||||||||||||
| Debt issued | 2,852 | 2,443 | ||||||||||
| Debt redeemed | (3,354 | ) | (2,051 | ) | ||||||||
| Changes in sinking funds | 189 | (208 | ) | |||||||||
| (313 | ) | 184 | ||||||||||
| Changes in cash and cash equivalents | 49 | 80 | ||||||||||
| Cash and cash equivalents, beginning of year | 663 | 583 | ||||||||||
| Cash and cash equivalents, end of year | 712 | 663 | ||||||||||
54
Table of Contents
SUMMARY FINANCIAL STATEMENTS
NOTES TO THE SUMMARY FINANCIAL STATEMENTS
FOR THE YEAR ENDED MARCH 31, 2003
| 1. | SIGNIFICANT ACCOUNTING POLICIES |
| A. | General Basis of Accounting |
| The Summary Financial Statements have been prepared in accordance with Canadian generally accepted accounting principles for senior governments as recommended by the Canadian Institute of Chartered Accountants (CICA), with the following exceptions: |
| 1) | Material adjustments may result from changes in accounting policy or from the correction of an error which are attributable to and identifiable with prior periods. It is the government’s practice to reflect the effects of such adjustments in the accumulated deficit. Prior year balances are not restated. |
| 2) | The process of establishing the completeness and reasonableness of the estimated historical cost of the tangible capital assets is ongoing. Reporting policies are currently being developed and information is being gathered for other expenditures which include infrastructure such as highways, bridges, and land acquired for public use. |
| 3) | The CICA recommends certain standards for reporting tangible capital assets and net debt. Although the government has adopted the standards related to tangible capital assets, it has not fully adopted the recommended presentation of net debt. Summary Net Debt (Schedule 12) provides a reconciliation from accumulated deficit to net debt. |
| 4) | The government has adopted a policy of including the assets, liabilities and equity of health care facilities, which have not devolved their ownership to Regional Health Authorities in its financial statements on a combined basis. However, the annual net income (loss) is recorded in the Summary Statement of Accumulated Deficit instead of the Summary Statement of Revenue and Expense. The assets and liabilities are not adjusted on a basis to be consistent with the accounting policies of the government reporting entity. |
| 5) | Prior to the 2000/01 fiscal year, individual health care facilities issued long-term debt in their own name to finance major capital acquisitions. In 2000/01, the Province began a program to finance such debt directly, taking advantage of its superior borrowing power and rates, and lowering the cost of health related borrowings for Manitoba. This debt is included as part of the Province’s general purpose borrowings. The related asset for non-devolved health care facilities is recorded as a deferred charge and amortized over the same period as the term of the debt issue. |
| These accounting policies have been developed and are applied in accordance with the provisions of The Financial Administration Act of the Province of Manitoba. |
| B. | The Reporting Entity |
| Various funds, Crown organizations and government enterprises comprising the government reporting entity are listed in Schedule 8. |
| The Operating Fund and Special Funds Special Purpose financial statements report amounts recorded as government revenue, expense on government programs, the lending and investment of government funds and the borrowing and repayment of debt. |
| To be considered a part of the government reporting entity, an organization must be accountable for the administration of its financial affairs and resources to a minister of the government, or directly to the Legislature, and must be owned and/or controlled by the government, as determined by legislative provisions or by a majority holding of voting share capital. |
55
Table of Contents
SUMMARY FINANCIAL STATEMENTS
| All educational institutions receive most of their financial resources from voted appropriations which are recorded as expenses. Some of these institutions are separately incorporated, not owned or controlled by the government and are required to report separately on their stewardship. Accordingly, they are not consolidated in these financial statements. Those educational institutions that are consolidated in these financial statements are listed in Schedule 8. |
| C. | Basis of Consolidation |
| Crown organizations are consolidated after adjusting their accounting policies to a basis consistent with the accounting policies of the government reporting entity. Inter-entity accounts and transactions are eliminated upon consolidation, except for retail sales tax and the levy for health and education. Where the fiscal year end dates of Crown organizations are not the same as that of the government reporting entity and their transactions significantly affect the financial statements, their financial results are updated to March 31. |
| Government enterprises, whose principal activity is carrying on a business, maintain their accounts in accordance with accounting principles which are generally accepted for business enterprises and which are considered appropriate to their individual objectives and circumstances. They derive the majority of their revenue from sources outside the government reporting entity. They are reported in these Summary Financial Statements using the modified equity method of accounting without adjusting their accounting policies to a basis consistent with that of the government reporting entity. The financial results of enterprises are not updated to March 31 where their fiscal year end is not the same as that of the government reporting entity, except when transactions which would significantly affect the summary financial statements occur during the intervening period. Inter-entity accounts and transactions with government enterprises are not eliminated, nor are normal operating inter-entity transactions disclosed separately. Supplementary financial information describing the financial position and results of operations of these enterprises is presented in Schedule 3. |
| All health care facilities are included in the summary financial statements. Certain facilities that were previously owned and operated by health corporations have transferred their ownership and operating control to Regional Health Authorities. These devolved facilities are consolidated on the same basis as Crown organizations. The assets, liabilities and equity of non-devolved health care facilities have not been consolidated herein but are disclosed on a combined basis. |
| D. | Basis of Specific Accounting Policies |
| Government of Canada Receipts |
| Generally, entitlements from the Government of Canada for transfer payments, the transfer having been authorized and any eligibility criteria met, as well as for the Province’s share of individual and corporation income tax pursuant to the Federal-Provincial Tax Collection Agreements are recorded on a cash basis for cash receipts received up to March 31 plus an accrual of prior period adjustments determined before June 30 each year. |
| Other Revenue |
| All other revenues are recorded on an accrual basis except when the accruals cannot be determined with a reasonable degree of certainty or when their estimation is impracticable. Recoveries of the debt servicing costs on self-supporting debt and revenue earned on investments and advances are recorded as a reduction of debt servicing expense. |
| Expenses |
| All expenses incurred for goods or services received are recorded on an accrual basis. Exceptions to this policy involve the acquisition of inventories acquired for the government’s use that are reflected as expenses when incurred. |
56
Table of Contents
SUMMARY FINANCIAL STATEMENTS
| Expenses include provisional amounts recorded in anticipation of future costs which are quantifiable and have been identified as obligations. Government transfers are recognized as expenses in the period during which the transaction is authorized and any eligibility criteria are met. |
| Gross Accounting Concept |
| Revenues and expenses are recorded in gross amounts with the following exceptions: |
| 1) | The municipal share of individual and corporation income taxes, which is collected through the Government of Canada and remitted by the Province of Manitoba to municipalities in accordance with The Provincial-Municipal Tax Sharing Act, is not recorded as revenue or expense. It is reflected as a reduction in individual and corporation income tax revenues. |
| 2) | Refunds of revenue are treated as reductions of current year revenue. |
| 3) | Decreases in valuation allowances previously provided are treated as reductions to expense. |
| 4) | Recoveries of the debt servicing costs on self-supporting debt and revenue earned on investments and advances are recorded as a reduction of debt servicing expense. |
| Liabilities and Assets |
| 1) | All borrowings are expressed in Canadian dollars and are shown net of sinking funds, unamortized debt issue costs and debt of the Province of Manitoba held as provincial investments. Foreign borrowings are converted at the exchange rate in effect at March 31 adjusted for any forward foreign exchange contract entered for settlement after the fiscal year end. Discounts or premiums, and commissions incurred at the time of the issue of debt are amortized monthly to debt servicing expense over the term of the debt. |
| 2) | The amount of the pension liability is based on actuarial calculations. When actual experience varies from actuarial estimates, the adjustments needed are amortized over the expected average remaining service life of the employee groups. |
| 3) | The year end translation adjustments reflecting the foreign currency fluctuation from the value at the issue date are recorded through the unamortized foreign currency fluctuation account and amortized monthly to debt servicing expense over the remaining term of the debt. The unamortized portion of foreign currency fluctuation also reflects the gains or losses on the conversion of foreign currency debt called prior to maturity using the rates in effect at the time of the call and these gains and losses are amortized over the original remaining term of the debt or over the term of the replacement issue, whichever is shorter. |
| 4) | Loans, advances and long-term investments are recorded at cost less valuation allowances. A valuation allowance is provided to reduce the value of the assets to their estimated realizable value or to reflect the impact of significant concessionary terms on outstanding loans. Premiums that may arise from the early repayment of loans or advances are reflected as deferred revenue and are amortized monthly to debt servicing expense over the term of the related debt issue. |
| 5) | Investments denominated in foreign currency are translated to the Canadian dollar equivalent at the exchange rate in effect at March 31, unless the rate of exchange or a forward foreign exchange contract fixing the value has been negotiated, in which case that rate or amount is used. The year end investment translation adjustments reflecting the foreign currency fluctuation between year ends are amortized monthly over the remaining life of the investment and included with debt servicing expense. Expenses and other transaction charges incurred on the purchase of investments during the year are charged to debt servicing expense. Those expenses incurred in foreign currency are translated at the exchange rate in effect on the transaction date. |
57
Table of Contents
SUMMARY FINANCIAL STATEMENTS
| 6) | Premiums paid on interest rate options are amortized monthly starting from the date the income is received over the period of the applicable agreement. If the option is exercised, the premium is amortized over the period from the date of receipt to the maturity date of the agreement. If the option is not exercised, any unamortized premium will be immediately taken into revenue. |
| 7) | Inventories held for resale are recorded at the lower of cost and net realizable value. |
| 8) | Tangible capital assets are amortized on a straight-line basis over their estimated useful lives as follows: |
| Land | Indefinite | ||||
| Buildings | 25 to 40 years | ||||
| Vehicles | 5 years | ||||
| Aircraft and vessels | |||||
| – Aircraft frames | 24 years | ||||
| – Aircraft motors | 5 years | ||||
| – Vessels | 24 years | ||||
| Machinery, equipment and furniture | 10 years | ||||
| Maintenance and road construction equipment | 15 years | ||||
| Computer hardware and software | 4 to 15 years | ||||
| Leasehold improvements | Life of lease | ||||
| One-half of the annual amortization is charged in the year of acquisition and in the year of disposal. Certain assets which have historical or cultural value including works of art, historical documents as well as historical and cultural artifacts are not recognized as tangible capital assets because a reasonable estimate of the future benefits associated with such property cannot be made. |
| 9) | All intangibles and items inherited by right of the Crown, such as Crown lands, forests, water, and mineral resources, are not recognized in government financial statements. A tangible capital asset received as a donation is recorded at its fair market value with the same amount being shown as a deferred contribution which is amortized to revenue on the same basis as the asset is amortized. Where the acquisition cost of a tangible capital asset is shared with other jurisdictions under a shared cost agreement, such contributions are deducted from the cost of the related asset with any amortization calculated on the net amount. |
| 10) | During the 2000/01 fiscal year, the Federal Government created a Health Equipment and Infrastructure Fund for investment in new medical equipment. The Province’s share of this fund was $37 million. Funding from the Health Equipment and Infrastructure Fund has been treated as deferred revenue and will be brought into revenue based on actual purchases of equipment according to a defined schedule. |
| 11) | Guarantees of the government are made through specific agreements or legislation to repay promissory notes, bank loans, lines of credit, mortgages and other securities. Provision for losses on guarantees are recorded when it is likely that a loss will occur. The amount of the loss provision represents the government’s best estimate of future payments less recoveries. |
| E. | Serial Debentures of School Divisions and Districts |
| The accumulated deficit of the government reporting entity includes amounts related to serial debentures of school divisions and districts, acquired by the government in prior years. The government is primarily responsible for funding the redemption of these debentures, accordingly these amounts are not reflected as assets. As the funding for annual redemptions flow from the appropriations of the government, to the school divisions and districts, and then back to the Province, the accumulated deficit of the government reporting entity is reduced by the amount of such redemptions. |
58
Table of Contents
SUMMARY FINANCIAL STATEMENTS
| F. | Use of Estimates |
| In the preparation of these financial statements, estimates are sometimes necessary because a precise determination of certain assets and liabilities is dependent on future events. These estimates have been based on management’s best judgements applied to available information. |
| 2. | CASH AND CASH EQUIVALENTS |
| Cash equivalents are recorded at cost. Market values approximate cost. Investment revenue earned on cash equivalents during the year was $12 million (2002 — $23 million). |
| 3. | TEMPORARY AND PORTFOLIO INVESTMENTS |
| Temporary investments are recorded at the lower of cost and market value. As at March 31, 2003, the cost of temporary investments was $228 million (2002 - $200 million) with a market value of $228 million (2002 — $200 million). Investment revenue earned on the temporary investments funds during the year was $6 million (2002 -$7 million). Portfolio investments are recorded at the lower of cost and net realizable value. As at March 31, 2003, the carrying value of portfolio investments was $33 million (2002 — $30 million). Portfolio investments earned $2 million during the year (2002 — $2 million). |
| 4. | ADJUSTMENTS TO ACCUMULATED DEFICIT |
| A. | Tangible Capital Assets |
| In 2000/01, the capitalization of the government’s Tangible Capital Assets was expanded to include the capitalization of land. As a result, $19 million was recorded as land in the 2000/01 financial statements. Subsequently, it was determined that although the methodology or process used to determine the cost of the land was satisfactory, an error occurred in the selection of the correct costing amounts. As a result of this error, capitalized land was overstated by $6 million. Accordingly, the adjustment to the valuation of land results in a $6 million increase to the accumulated deficit. |
| During the year, Tangible Capital Assets acquired in prior fiscal years having a cost of $12 million and accumulated amortization of $12 million (nil net book value) were identified and recorded (2002 — $4 million NBV). |
| B. | RHA Pension Liability |
| When Regional Health Authorities were created, the Civil Service Regulation was amended to designate the transferred civil service employees and the new hires as employees for the purpose of The Civil Services Superannuation Act. This resulted in the government recording and disclosing the related pension liability for these employees as part of the Civil Service Plan (see note 12A). |
| However, while the pension liability was recorded based on a December 31, 1998 Actuarial Report, an error occurred in the process by which the liability was updated annually. This error resulted in an annual understatement of the associated pension liability and also the annual pension expense by a similar amount. The pension liability and expense relating to the 2002/03 fiscal year has been properly recorded in the Summary Statement of Financial Position and the Summary Statement of Revenue and Expense. The amount relating to fiscal years 1998/99 to 2001/02 inclusive, $11 million, has been adjusted to the accumulated deficit. |
| C. | Net Income Stabilization Account |
| When the Net Income Stabilization Account (NISA) program was introduced in 1991, producers were only eligible to receive matching government funding, one-third of which is provided by the Province and two-thirds by the Government of Canada, if they made “matchable deposits.” On that basis, liabilities under the program were recorded in the accounts based on applicants meeting the two eligibility criteria, specifically |
59
Table of Contents
SUMMARY FINANCIAL STATEMENTS
| having made a “matchable deposit” and being in a claim position (having incurred a qualifying loss). However, in 1997, the agreement was amended to incorporate “automatic” deeming, which effectively removed the requirement for the producer to make a “matching deposit”. This amendment was not brought to the attention of the government until this year and therefore the prior years’ financial statements did not reflect the additional liability incurred commencing in 1997 when the amendment was approved. The net effect is an increase in the Province’s liability at March 31, 2002 of $19 million, which is recorded as an increase to the accumulated deficit. |
| D. | Municipal Tax Sharing |
| In accordance with The Provincial-Municipal Tax Sharing Act, the Province remits to municipalities the municipal share of individual and corporation income taxes, which is initially collected through the Government of Canada and then forwarded to the Province. Amounts are advanced to municipalities based on the estimated tax collections for the calendar year. As more accurate data is received on actual tax revenues, these advances are adjusted in subsequent payments. In order to properly reflect this arrangement, entitlements related to tax collections for the first three months of the next calendar year should be accrued in the accounts of the government. This was not done previously. Furthermore, it has been determined that amounts advanced for years prior to 2002 exceeded actual entitlements. The net effect of these two items is the accrual of a net payable to municipalities and a corresponding increase to the accumulated deficit of $23 million. |
| E. | Devolved Health Care Facilities |
| As a result of a restatement of unrestricted net assets for certain devolved health care facilities, the accumulated deficit as at March 31, 2003 was decreased by $4 million (2002 — $5 million increase). |
| In addition, the liabilities for employee future benefits were adjusted for certain devolved health care facilities as at March 31, 2001 and 2002. This resulted in an increase to accumulated deficit of $7 million at March 31, 2003 and a decrease to accumulated deficit of $6 million as at March 31, 2002. |
| F. | Non-Devolved Health Care Facilities |
| Non-devolved health care facilities record deferred charges for entitlements that relate to employee future benefits. Since these employee future benefit entitlements are reflected as liabilities of the government, the April 1, 2002 opening balance of $69 million has been restated resulting in a corresponding increase to accumulated deficit. |
| 5. | EQUITY IN NON-DEVOLVED HEALTH CARE FACILITIES |
| There has been no change to the equity of the non-devolved health care facilities for the year ended March 31, 2003 with an increase in the equity of $3 million for the year ended March 31, 2002. Net income (loss) has not been reflected in the Summary Statement of Revenue and Expense. |
| 6. | EQUITY IN GOVERNMENT ENTERPRISES |
| The category definitions are as follows: |
| Utility: |
| An enterprise which provides public utility services for a fee. |
| Insurance: |
| An enterprise which provides insurance coverage services to the public for a fee. |
| Finance: |
| Enterprises which provide regulatory control and are revenue generating, or enterprises which use economy of scale to deliver goods and services to non-government clients. |
| Resource Development: |
| Enterprises charged with the development of various industries and/or the delivery of various goods and services which will assist the provincial economy. |
60
Table of Contents
SUMMARY FINANCIAL STATEMENTS
| Included in the equity in government enterprises are equities which are restricted for use by provincial legislation and thereby not available to discharge government liabilities or to finance other government programs. |
| Equity in government enterprises is comprised of: |
| ($ millions) | |||||||||
| 2003 | 2002 | ||||||||
| Restricted Equity in Government Enterprises: | |||||||||
| Manitoba Hydro-Electric Board | 1,170 | 1,302 | |||||||
| Manitoba Public Insurance Corporation | 108 | 130 | |||||||
| Workers Compensation Board | 75 | 75 | |||||||
| 1,353 | 1,507 | ||||||||
| Unrestricted Equity in Government Enterprises: | |||||||||
| Leaf Rapids Town Properties Ltd | 1 | 2 | |||||||
| Manitoba Hazardous Waste Management Corporation | 2 | 5 | |||||||
| Manitoba Lotteries Corporation | 5 | 5 | |||||||
| Manitoba Product Stewardship Corporation | 5 | 6 | |||||||
| Manitoba Public Insurance Corporation | 3 | 3 | |||||||
| 16 | 21 | ||||||||
| Equity in Government Enterprises | 1,369 | 1,528 | |||||||
| 7. | SINKING FUNDS |
| Sinking funds are recorded at the lower of cost and market value. As at March 31, 2003, sinking funds had a cost of $5,875 million (2002 — $6,551 million) and a market value of $6,151 million (2002 — $6,946 million). Investment revenue earned on the sinking funds during the year was $254 million (2002 - $312 million). |
| Section 60 of The Financial Administration Act authorizes the Minister of Finance to provide for the creation and management of sinking funds for the orderly retirement of debt. The Minister of Finance may authorize, by directive, the amount, if any, to be allocated to the Province’s sinking fund. The Province’s sinking fund currently provides for the repurchase of foreign debt and the pre-funding of maturing debt issues. In addition, the Province’s sinking fund is invested principally in securities issued or guaranteed by Canadian provinces. |
| As provided by The Manitoba Hydro Act, the Manitoba Hydro-Electric Board (Hydro) is required to provide, prior to its fiscal year end in each year, amounts for sinking funds which are not less than the sum of i.) 1% of the principal amount of Hydro’s outstanding debt on the preceding March 31 and, ii.) 4% of the balance of cash and book value of securities in the sinking fund at such date. Sinking funds are invested in government bonds and the bonds of highly rated corporations and financial institutions. Interest earned on money and securities in the sinking fund is paid to Hydro. |
| The sinking funds are allocated as follows: |
| ($ millions) | ||||||||
| 2003 | 2002 | |||||||
| Province of Mantoba | 4,827 | 4,961 | ||||||
| Manitoba Hydro-Electric Board | 976 | 1,520 | ||||||
| Regional Health Authorities | 70 | 66 | ||||||
| University of Manitoba | 2 | 4 | ||||||
| Total sinking funds | 5,875 | 6,551 | ||||||
61
Table of Contents
SUMMARY FINANCIAL STATEMENTS
| 8. | GUARANTEES |
| The government reporting entity has guaranteed the repayment of debt, promissory notes, bank loans, lines of credit, mortgages and other securities. The outstanding guarantees are as follows: |
| ($ millions) | ||||||||
| 2003 | 2002 | |||||||
| Promissory notes, bank loans, lines of credit and other | 67 | 53 | ||||||
| Manitoba Grow Bonds | 8 | 8 | ||||||
| Total guarantees outstanding | 75 | 61 | ||||||
| Provision for future losses on guarantees in the amount of $17 million (2002 - $16 million) has been recorded in the accounts. Debt guaranteed by the Province is guaranteed as to principal and interest until the debt is matured or redeemed. |
| 9. | FINANCIAL COMMITMENTS |
| The government reporting entity has approved long-term financial arrangements of various entities wherein indebtedness has been issued that is not guaranteed by the government, but funding assistance is provided annually from appropriations of the Operating Fund. The government reporting entity has also made future commitments against appropriations under long-term contracts that cover the rental of tangible capital assets. These financial commitments as at March 31 are as follows: |
| ($ millions) | |||||||||
| 2003 | 2002 | ||||||||
| Financial arrangements for completed projects: | |||||||||
| Public Schools | 441 | 416 | |||||||
| Government | ||||||||||||||||
| Future commitments: | Enterprises | Other | ||||||||||||||
| Tangible capital assets, infrastructure and capital grants | 185 | 191 | 376 | 374 | ||||||||||||
| Rental of tangible capital assets | 34 | 111 | 145 | 189 | ||||||||||||
| Housing construction and approved mortgages | — | 12 | 12 | 17 | ||||||||||||
| 219 | 314 | 533 | 580 | |||||||||||||
| 974 | 996 | |||||||||||||||
| The government reporting entity has commitments which are not capital in nature, related primarily to future loans and grants and the maintenance of desktop equipment totalling $77 million (2002- $73 million). |
| In December of 2001, the government entered into a funding agreement with the City of Winnipeg and the TN Arena Limited Partnership regarding the True North Entertainment Complex. The Province’s maximum commitment, after Federal Infrastructure contributions, is $14 million (2002 — $13 million). The Province has funded $3 million to March 31, 2003 (2002 — $1 million). |
| 10. | CONTINGENCIES |
| The government has been named in various legal actions, including treaty land entitlements. No provision has been made at March 31, 2003 in the accounts where the final results are uncertain. |
62
Table of Contents
SUMMARY FINANCIAL STATEMENTS
| A. | Disaster Financial Assistance |
| A provision has been made at March 31, 2003 for all flood claims and other disaster financial assistance. The final amount of the government’s share of these costs under shared cost agreements is uncertain at the date these financial statements were issued. |
| B. | Northern Development Projects |
| The Province is contingently liable for legal claims associated with past Manitoba Hydro-Electric Board related northern development projects. The outcome of these claims is not determinable at this time. |
| 11. | ENVIRONMENTAL ISSUES |
| There are currently no accounting standards for environmental liabilities recommended for senior governments by the CICA, other than those that apply to corporate entities related to environmental damage they have created. Because of its role, government will in all probability assume costs where those responsible cannot or will not accept liability for their actions. The Province is in the process of cataloguing suspected contaminated mine and petroleum sites. This catalogue will include a determination of the liable party, an assessment of the nature and level of contamination, the need for clean-up versus containment, and a quantification of the estimated cost for clean-up. Once standards are established by the CICA for senior governments for the recognition and disclosure of these liabilities, their application in the Manitoba setting will be reviewed to determine the appropriate accounting treatment. |
| 12. | PENSION PLANS |
| The government of the Province of Manitoba supports six separate pension plans. These include the Civil Service Plan (CSP), the Teachers’ Plan (TP), the Members of the Legislative Assembly Plan (MLAP), the University of Manitoba Pension Plan, the Healthcare Employees Pension Plan (HEPP) and the Brandon University Retirement Plan. HEPP offers retirement benefits to employees of health care facilities. The pension plans for the universities of Manitoba and Brandon and HEPP are fully funded. There is no unfunded liability reported by the actuaries of the university pension plans and HEPP. |
| The government is required, under the amended provisions of The Balanced Budget, Debt Repayment and Taxpayer Accountability Act, to set aside funds beginning in 2000/01, to address the government’s unfunded pension liability. The minimum annual contribution must be sufficient to equal the contributions made by employees and teachers hired on or after April 1, 2000. While the minimum contribution was $9 million (2002 — $6 million) for the year ended March 31, 2003, the government set aside $48 million (2002 — $75 million) as pension assets. These funds are separately invested and maintained in trust accounts for the government and are increased by interest earned. The pension assets’ balance as at March 31, 2003 was $151 million (2002 — $107 million). |
| The actuarial valuations were based on a number of assumptions about future events, such as interest rates, wage and salary increases, inflation rates and rates of employee turnover, disability and mortality. Information about the economic assumptions used in the most recent actuarial valuations is provided below. Demographic assumptions used in the valuations reflect the experience of the plans. |
| Real Rate | Inflation | Investment Rate | |||||||||||||
| Plan | Latest Valuation | of Return | Rate | of Return | |||||||||||
| Civil Service | December 31, 2001 | 4.0 | % | 2.75 | % | 6.75 | % | ||||||||
| Teachers’ | January 1, 2001 | 4.0 | % | 3.0 | % | 7.0 | % | ||||||||
| MLA | March 31, 2000 | 4.0 | % | 3.0 | % | 7.0 | % | ||||||||
| University of Manitoba | December 31, 1999 | 4.0 | % | 3.0 | % | 7.0 | % | ||||||||
| Brandon University | December 31, 2000 | 4.0 | % | 3.0 | % | 7.0 | % | ||||||||
| HEPP | December 31, 2002 | 3.5 | % | 3.0 | % | 6.5 | % | ||||||||
| During the year, no amendments were made to any of the plans. |
63
Table of Contents
SUMMARY FINANCIAL STATEMENTS
| The components of the unfunded pension liability and expense are as follows: |
| ($ millions) | |||||||||||||
| Pension | Pension | ||||||||||||
| Expense | Liability | ||||||||||||
| 2003 | 2003 | 2002 | |||||||||||
| Civil Service Plan | |||||||||||||
| Pension Liability | 140 | 1,446 | 1,294 | ||||||||||
| Unamortized Net Actuarial Gains | 55 | 112 | |||||||||||
| Teachers’ Plan | |||||||||||||
| Pension Liability | 189 | 1,926 | 1,833 | ||||||||||
| Unamortized Actuarial Losses | (48 | ) | (53 | ) | |||||||||
| Members of the Legislative Assembly | |||||||||||||
| Pension Liability | 2 | 29 | 28 | ||||||||||
| Unamortized Actuarial Gains | 3 | 3 | |||||||||||
| Other Plans | 17 | — | — | ||||||||||
| 348 | 3,411 | 3,217 | |||||||||||
| The pension liabilities of government enterprises are disclosed in Schedule 3 with the exception of the Manitoba Liquor Control Commission which is part of the Civil Service Superannuation Fund amount noted above. |
| A. | Civil Service Plan |
| The Civil Service Superannuation Act (CSSA) established a defined benefit plan to provide benefits to employees of the Manitoba Civil Service and to participating agencies of the government through the Civil Service Superannuation Fund (CSSF). |
| As at March 31, 2003, the CSP had approximately 39,500 (2002 — 38,800) participants including active members, retired employees and former employees with entitlements. |
| Certain amendments to the CSSA were made in 1992 which required that the CSSF establish and fund a separate account in an amount sufficient to cover the government’s share of pension costs attributable to the 1992 amendments to the CSSA. The CSSF account maintained on behalf of the government at March 31, 2003 was $30 million (2002 — $29 million). |
| Effective December 15, 2000, the CSP was amended to include improved benefits. The cost of the plan amendments is fully funded from actuarially determined employee surpluses with no additional cost to the employer. The following describes the current terms of the CSP, with the previous terms indicated within brackets. |
| The lifetime pension calculation equals 2% of a member’s best five years average yearly pensionable earnings multiplied by pensionable service, minus 0.4% (previously 0.6%) of the average Canada Pension Plan (CPP) earnings for the same period multiplied by pensionable service since January 1, 1966. The CSSA requires that employees contribute 6.0% (previously 5.1%) on pensionable earnings up to the CPP maximum earnings, and 7.0% of pensionable earnings above the maximum. 89.8% of contributions are used to fund basic benefits and 10.2% of contributions are allocated for indexing benefits. Contributions continue until the employee’s retirement or other termination from service. Employee contributions for the year ended March 31, 2003 amounted to $65 million (2002 — $61 million). |
| Indexing benefits are not guaranteed and are paid only to the extent that the indexing adjustment account in CSSF can finance one-half of cost-of-living increases granted. The maximum annual adjustment is limited by legislation to two-thirds of the increase in the consumer price index for Canada. |
| The government does not make contributions to the CSSF during employees’ service. By legislation, however, it is required to pay 50% of the pension disbursements made from the CSSF. For the year ended March 31, 2003, payments of $79 million (2002 — $74 million) were made to the CSSF. |
64
Table of Contents
SUMMARY FINANCIAL STATEMENTS
| An actuarial valuation report of the government’s liability to the employees included in the CSSF was completed as of December 31, 2001. The report provides a formula to update the liability on an annual basis. In accordance with the formula, the government’s liability has been calculated on an indexed basis to be $1,445 million as at March 31, 2003 (2002 — $1,277 million). The report disclosed an experience loss of $50 million which will be amortized over the 15 year expected average remaining service life of the employee groups. The 2002/03 combined amortization was a $7 million credit to expenses (2002 — $10 million). |
| The pension liability has been adjusted by $11 million to reflect the correction of the prior year’s understatement of the liability for Regional Health Authorities (see Note 4B). |
| B. | Teachers’ Plan |
| The Teachers’ Pensions Act (TPA) established a defined benefit plan to provide pension benefits to teachers who have taught in public schools in Manitoba. |
| As at March 31, 2003, the Teachers’ Retirement Allowances Fund (TRAF) had approximately 29,500 (2002 — 29,000) participants including active members, retired teachers and former teachers with entitlements. |
| The lifetime pension calculation is based upon the lesser of A or B: |
| A) | The years of service prior to July 1, 1980, multiplied by 2% and the average salary of the best 7 of the final 12 years of service and years of service after July 1, 1980, multiplied by 2% and the average salary of the best 5 of the final 12 years of service; |
| less |
| The years of service from January 1, 1966, to July 1, 1980, multiplied by .6% and the average annual salary up to the yearly maximum pensionable earnings for the same period and years of service after July 1, 1980, multiplied by .6% and the annual salary up to the yearly maximum pensionable earnings for the same period. |
| B) | 70% of the weighted average annual salary of the member in the 7 and 5 year periods used above. |
| The TPA requires that teachers contribute 5.7% on pensionable earnings up to the CPP maximum earnings, and 7.3% on pensionable earnings above the maximum. 83.6% of contributions are used to fund basic benefits and 16.4% of contributions are allocated for indexing benefits. Contributions continue until the teacher’s retirement or other termination from service. Teacher contributions for the year ended March 31, 2003, amounted to $53 million (2002 — $47 million). |
| Indexing benefits are not guaranteed and are paid only to the extent that one half of the pension adjustment does not result in an unfunded pension liability in TRAF. |
| The government does not make contributions to TRAF during teachers’ service. By legislation, however, it is required to pay 50% of the pension disbursements and other disbursements made by TRAF as provided for in the TPA. For the year ended March 31, 2003, payments of $91 million (2002 — $84 million) were made to TRAF. |
| An actuarial report was completed for TRAF as of January 1, 2001, which determined the government’s pension liability on an indexed basis. The report provides a formula to update the liability on an annual basis. In accordance with the formula, the government’s liability has been calculated on an indexed basis to be $1,926 million at March 31, 2003 (2002 — $1,833 million). The report disclosed an experience loss of $57 million which will be amortized over the 13 year expected average remaining service life of the employee groups. The 2002/03 amortization was $5 million (2002 — $4 million). |
65
Table of Contents
SUMMARY FINANCIAL STATEMENTS
| C. | Members of the Legislative Assembly Plan |
| The pension plan for Members of the Legislative Assembly (MLAs) is established and governed by The Legislative Assembly Act (LAA). For MLAs elected prior to the dissolution of the Assembly of the 35th Legislature, the LAA provides for defined pension benefits based on years of service to April, 1995. For those elected after the 35th Legislature in April 1995, the LAA provides for matching contributions. As at March 31, 2003, there are 119 (2002 — 119) plan members who are entitled to receive future pension benefits in accordance with the LAA. |
| The calculation for defined pension benefits is equal to 3% of the average annual indemnities for the last five years served as a member or all the years served if less than five multiplied by the number of years of pensionable service up to April 1995. These entitlements are fully indexed to cost of living increases. |
| An actuarial valuation report of the government’s liability to the MLAs included in the pension plan was completed as of March 31, 2000. The report provides a formula to update the liability on an annual basis. In accordance with the formula, the government’s liability has been calculated on an indexed basis to be $29 million as at March 31, 2003 (2002 — $28 million). The report disclosed an experience gain of $4 million which will be amortized over the 10 year expected average remaining service life of the MLAs. |
| Under the matching contributions provisions, MLAs may contribute up to 7% of their remuneration toward a Registered Retirement Savings Plan (RRSP) of their choice. The government matches the member’s contributions on a current basis, consequently, there is no liability for past service benefits under this component of the plan. In the event that a member withdraws money from the RRSP while an active member of the Legislative Assembly, the government’s contribution would be refundable. |
| D. | University of Manitoba |
| The University of Manitoba administers the University of Manitoba Pension Plan (1970), The University of Manitoba GFT Pension Plan (1986) and The University of Manitoba Pension Plan (1993). These are trusteed pension plans. The Trustees are responsible for the custody of the Plans’ assets and issuance of annual financial statements, which do not form part of the Province’s Summary Financial Statements. |
| The University of Manitoba Pension Plan (1970) and University of Manitoba Pension Plan (1993) are both money purchase plans with a defined benefit minimum. The funding for the plans requires a matching contribution from the University and the employees. The surplus from the Plans and the matching contribution is adequate to fund the Plan and the current level of funding satisfies the requirements of The Manitoba Pensions Benefit Act. The plans are not indexed. |
| As at December 31, 2002, the University of Manitoba Pension Plans had 4,902 active members (2001 — 4,801), and 789 pensioners (2001 — 764). The plans do not offer deferred pension elections. |
| The actuarial present value of accrued pension benefits has been determined using the projected unit credit actuarial cost method and assumptions developed by reference to expected long-term market conditions. An actuarial valuation effective December 31, 1999 was completed in 2000 by Eckler Partners Ltd., a firm of consulting actuaries. The results of this valuation have been extrapolated by Eckler Partners Ltd. to December 31, 2002. As at December 31, 2002, the University of Manitoba Pension Plan (1970) and The University of Manitoba Pension Plan (1993) were in an actuarial surplus of $1 million (2001 — $1 million) and $4 million (2001 — $23 million), respectively. The University of Manitoba cannot access this surplus and as a result, no asset has been recorded in the Province’s Summary Financial Statements. |
| The University of Manitoba recognized expenses equal to its contributions of $11 million (2002 — $10 million) for the 1970 Plan and for the 1993 Plan for the fiscal year ended March 31, 2003. Employee contributions equalled the employer contributions. |
| The next full actuarial valuation of the Plans will be effective December 31, 2003 and will be completed in 2004. |
66
Table of Contents
SUMMARY FINANCIAL STATEMENTS
| The University of Manitoba GFT Pension Plan (1986) is a defined contribution pension plan, therefore there is no requirement for an actuarial valuation of this Plan. The University’s contributions to this Plan were $2 million in 2003 (2002 — $2 million). |
| E. | Brandon University |
| The Brandon University administers the Brandon University Pension Plan, which is a trusteed pension plan. The Trustees are responsible for the custody of the Plan’s assets and issuance of annual financial statements, which do not form part of the Province’s Summary Financial Statements. |
| The Brandon University Pension Plan is a final average contributory defined benefit pension plan established April 1, 1974 for the benefit of the employees of Brandon University. The funding for the plan requires a matching contribution from the University and the employees. The surplus from the Plan and the matching contribution is adequate to fund the Plan and the current level of funding satisfies the requirements of The Manitoba Pensions Benefit Act. |
| As at December 31, 2002, the Brandon University Pension Plan had 435 active members (2001 — 424), 177 pensioners (2001 — 173), and 37 deferred pensions (2001 — 32). |
| The actuarial present value of accrued pension benefits has been determined using the accrued benefit method prorated on service and using assumptions recommended by the actuary and approved by the Trustees. An actuarial valuation was made as at December 31, 2000 by Eckler Partners Ltd., a firm of consulting actuaries. The results of this valuation have been extrapolated by Eckler Partners Ltd. to December 31, 2002. As at December 31, 2002, the Brandon University Pension Plan was in an actuarial surplus of $2 million (2001 — $10 million). The Brandon University cannot access this surplus and as a result, no asset has been recorded in the Province’s Summary Financial Statements. |
| The Brandon University recognized expenses equal to its contributions of $1 million (2002 — $1 million). Employee contributions equalled the employer contributions. |
| The next full actuarial valuation of the Plan will be as at December 31, 2003 and will be completed in 2004. |
| F. | Healthcare Employees Pension Plan — Manitoba |
| The Healthcare Employees Pension Plan — Manitoba (HEPP) was established in 1997 to meet the retirement needs of Manitoba’s healthcare employees and their beneficiaries. Benefits accrued from January 1, 1997 are administered in accordance with the HEPP Plan Text and governing agreements. Benefits accrued up to and including December 31, 1996 are administered in accordance with previous Plans. HEPP is governed by an independent, 12 member board of Trustees representing both union and employer participants. The Trustees are responsible for the custody of the Plan’s assets and issuance of annual financial statements, which do not form part of the Province’s Summary Financial Statements. |
| HEPP is a defined benefit pension plan. The lifetime pension calculation is based on an amount equal to: |
| • | 1.5% of a member’s highest average earnings up to the Canada Pension Plan Yearly Maximum Pensionable Earnings (YMPE), and, |
| • | 2.0% of a member’s highest average earnings over the YMPE, |
| • | multiplied by a member’s years of contributory service. The highest average earnings are determined by averaging the best five years of annualized pensionable earnings in the past eleven years prior to termination, retirement or death. |
| Ad hoc cost of living adjustments (COLAs) to pension benefits are reviewed every year. Members who retired on or before July 1, 2000, disabled members and deferred vested members received a 2.34% ad hoc COLA effective January 1, 2002. |
| As at December 31, 2002, HEPP had 33,178 active and disabled members (2001 — 31,817), 4,961 deferred vested members (2001 — 4,265), and 8,524 retired members (2001 — 8,006). There are currently 187 participating employers (2001 — 175). |
67
Table of Contents
SUMMARY FINANCIAL STATEMENTS
| The Plan Text requires that an annual actuarial valuation be performed on both a going concern basis and a solvency basis by an independent actuary. Towers Perrin, a firm of consulting actuaries, prepared the most recent actuarial valuation as at December 31, 2002, using the unit credit actuarial cost method. As at December 31, 2002, HEPP had a going concern actuarial surplus of $67 million (January 1, 2002 — $87 million). The employers cannot access this surplus and as a result, no asset has been recorded in the Province’s Summary Financial Statements. |
| 13. | AMOUNTS HELD IN TRUST |
| The government held certain fiduciary trusts for investment or administration at March 31, 2003, totalling $455 million (2002 — $435 million). Such deposits are pooled with other available funds of the government for investment purposes and are accorded a market rate of interest. |
| The government also provides a safekeeping service for various departments, agencies, boards and commissions. In this capacity, it held custodial trust funds in the form of bonds and other securities at March 31, 2003 totalling $138 million (2002 — $135 million). |
| The Civil Service Superannuation Fund, University of Manitoba Pension Plans and Brandon University Retirement Plan have been established by legislation to administer various pension and insurance trust funds to which the government reporting entity contributes but over which the government reporting entity has no power of appropriation. The total assets as at December 31st are as follows: |
| ($ millions) | ||||||||
| 2002 | 2001 | |||||||
| Civil Service Superannuation Fund | 2,422 | 2,356 | ||||||
| University of Manitoba Pension Plans | 751 | 800 | ||||||
| Brandon University Retirement Plan | 70 | 76 | ||||||
| 3,243 | 3,232 | |||||||
| 14. | DEBT SERVICING |
| Debt servicing costs are net of cost recoveries and interest income of $955 million for the year ended March 31, 2003 (2002 — $1,241 million), which includes $582 million as at March 31, 2003 (2002 — $789 million) from government enterprises. |
| 15. | WATER POWER RENTALS |
| Water power rental revenue from the Manitoba Hydro-Electric Board (Hydro), in the amount of $97 million (2002 — $109 million), is included in the Summary Statement of Revenue and Expense under the Manitoba Collections category. These rentals are paid for the use of water resources in the operation of Hydro’s hydroelectric generating stations. Water rental rates during the year were $3.34 per megawatt hour (MW.h) (2002 — $3.34 per MW.h). |
| 16. | GUARANTEE FEES |
| Hydro remits guarantee fees to the government based on the Hydro debt that the Province guarantees on their behalf. The guarantee fees paid by Hydro for the year ended March 31, 2003 were $74 million (2002 — $72 million). |
68
Table of Contents
SUMMARY FINANCIAL STATEMENTS
| 17. | REVENUE FROM GOVERNMENT ENTERPRISES |
| Under the Workplace Safety and Health Act of Manitoba, The Workers’ Compensation Board supports the administrative expenses incurred by the Department of Labour and Immigration for The Workplace Safety and Health program and the Worker Advisor Office. The amount for the year ended March 31, 2003 was $6 million (2002 — $6 million). | |
| The Manitoba Lotteries Corporation provided $2 million in funding for the year ended March 31, 2003 (2002 — $2 million) to the Addictions Foundation of Manitoba for problem gambling services programming. Hydro paid Corporation Capital Tax of $33 million for the year ended March 31, 2003 (2002 — $29 million). |
| 18. | ADJUSTMENT TO ESTIMATE FOR FEDERAL ACCOUNTING ERROR |
| The 2001/02 fiscal year included the effects of the federal accounting error. Amounts totalling $287 million were identified as relating to prior years and recorded as an adjustment to the accumulated deficit. Included in that amount was the net impact of the federal settlement related to 1997 to 1999, which was a $91 million payable owing to the Federal Government over a ten-year period commencing in 2004/05. Also recorded at March 31, 2002 was a $112 million payable for the estimated 2001 tax year error. In 2002/03, the Federal Government finalized the amount for the 2001 tax year error at $61 million, resulting in a gain on settlement of $51 million. In 2002/03, the Federal Government also provided a transition payment of $140 million related to Equalization. |
| 19. | PURCHASE OF WINNIPEG HYDRO |
| The Purchase of Winnipeg Hydro Act received Royal Assent on August 9, 2002. The Manitoba Hydro-Electric Board has entered into an agreement with the City of Winnipeg to purchase all of the net assets of Winnipeg Hydro. The consideration principally consists of annual payments to the City of Winnipeg of $25 million per annum in years 2002 to 2006, $20 million per annum in years 2007 to 2010, and $16 million per annum in year 2011 and each year thereafter. Winnipeg Hydro was an electric utility with 94,000 customers and annual revenues of $125 million. |
| 20. | THE PROVINCIAL-MUNICIPAL TAX SHARING ACT |
| The municipal share of individual and corporation income taxes, which is collected through the Government of Canada and remitted by the Province of Manitoba to municipalities in accordance with The Provincial-Municipal Tax Sharing Act, is not recorded as revenue or expense. This amounted to $78 million for the year ended March 31, 2003 (2002 — $82 million). |
| 21. | COMPARATIVE FIGURES |
| Certain of the 2002 financial statement figures have been reclassified to be consistent with the 2003 presentation. |
69
Table of Contents
SUMMARY FINANCIAL STATEMENTS
SCHEDULE 1
SUMMARY STATEMENT OF AMOUNTS RECEIVABLE
As at March 31, 2003
| ($ millions) | ||||||||
| 2003 | 2002 | |||||||
TAXATION REVENUE: | ||||||||
| Corporation capital tax | 2 | 2 | ||||||
| Corporation income tax | 48 | 41 | ||||||
| Gasoline tax | 14 | 14 | ||||||
| Health and education levy | 23 | 25 | ||||||
| Individual income tax | 107 | 105 | ||||||
| Insurance corporation tax | 12 | 11 | ||||||
| Motive fuel tax | 7 | 7 | ||||||
| Retail sales tax | 104 | 96 | ||||||
| Revenue Act, 1964, part 1 | 8 | 7 | ||||||
| Tobacco tax | 15 | 11 | ||||||
| 340 | 319 | |||||||
GOVERNMENT OF CANADA AND OTHER GOVERNMENTS: | ||||||||
| Canada health and social transfer | 17 | 3 | ||||||
| Equalization | — | 138 | ||||||
| Municipal corporations | 58 | 62 | ||||||
| Provincial and territories | 10 | 13 | ||||||
| Shared cost programs/agreements | 124 | 153 | ||||||
| Other | 4 | 5 | ||||||
| 213 | 374 | |||||||
INTEREST: | ||||||||
| Province of Manitoba sinking fund | 59 | 73 | ||||||
| Other investments | 11 | 10 | ||||||
| 70 | 83 | |||||||
OTHER: | ||||||||
| Crop insurance | — | 2 | ||||||
| Health and social services | 44 | 35 | ||||||
| Liquor Control Commission | 12 | 18 | ||||||
| Manitoba Hydro-Electric Board | 12 | 11 | ||||||
| Manitoba Lotteries Corporation | 4 | 3 | ||||||
| Morris Macdonald School Division | 1 | 2 | ||||||
| Sundry departmental revenue | 47 | 47 | ||||||
| Other | 87 | 78 | ||||||
| 207 | 196 | |||||||
| 830 | 972 | |||||||
| Less: Allowances | 100 | 92 | ||||||
| 730 | 880 | |||||||
70
Table of Contents
SUMMARY FINANCIAL STATEMENTS
SCHEDULE 2
SUMMARY STATEMENT OF LOANS AND ADVANCES
As at March 31, 2003
| ($ millions) | ||||||||||
| 2003 | 2002 | |||||||||
GOVERNMENT ENTERPRISES: | ||||||||||
| Liquor Control Commission | 5 | 5 | ||||||||
| Manitoba Hydro-Electric Board | 6,375 | 7,221 | ||||||||
| Manitoba Lotteries Corporation | 174 | 170 | ||||||||
| 6,554 | 7,396 | |||||||||
OTHER: | ||||||||||
| Hudson Bay Mining and Smelting Co. Ltd. | 21 | 23 | ||||||||
| Loans and Mortgages * | 602 | 619 | ||||||||
| Manitoba Potash Corporation | 3 | 3 | ||||||||
| Manitoba student loans | 12 | 5 | ||||||||
| Regional family services agencies | 7 | 7 | ||||||||
| Rural economic development initiatives program | 3 | 3 | ||||||||
| Treaty Indian fuel tax | 1 | 1 | ||||||||
| Other | 4 | 5 | ||||||||
| 653 | 666 | |||||||||
| Less: Valuation allowance | 79 | 92 | ||||||||
| 574 | 574 | |||||||||
| 7,128 | 7,970 | |||||||||
| Less: Sinking funds provided for repayment of applicable debt | 976 | 1,520 | ||||||||
| 6,152 | 6,450 | |||||||||
| Less: Debt incurred for and repayable by the Manitoba-Hydro Electric Board and Manitoba Lotteries Corporation | 5,573 | 5,871 | ||||||||
NET LOANS AND ADVANCES | 579 | 579 | ||||||||
* Loans and Mortgages | ||||||||||
| Agricultural direct lending and special assistance program mortgages, due in varying annual amounts to the year 2032, bearing interest rates ranging from 4.5% to 14.5% | 304 | 316 | ||||||||
| Housing direct lending and special assistance program mortgages, due in varying annual amounts to the year 2024, bearing interest rates ranging from 2.0% to 13.5% | 176 | 185 | ||||||||
| Business development assistance loans, due in varying annual amounts to the year 2013, bearing interest rates ranging from nil to 8.625% | 97 | 95 | ||||||||
| Northern business development and fishing industry assistance loans, due in varying annual amounts to the year 2013, bearing interest rates ranging from 5.49% to 10.25% | 25 | 23 | ||||||||
| 602 | 619 | |||||||||
71
Table of Contents
SUMMARY FINANCIAL STATEMENTS
SCHEDULE 3
GOVERNMENT ENTERPRISES
SCHEDULE OF SUMMARY OPERATING RESULTS AND FINANCIAL POSITION
For the Year Ended March 31, 2003
($millions)
| RESOURCE | TOTAL | TOTAL | ||||||||||||||||||||||||||
| UTILITY | INSURANCE | FINANCE | DEVELOPMENT | 2003 | 2002 | |||||||||||||||||||||||
RESULTS OF OPERATIONS | ||||||||||||||||||||||||||||
| Revenues from operations | 1,869 | 868 | 1,065 | — | 3,802 | 3,727 | ||||||||||||||||||||||
| Expenses: From operations | 1,319 | 890 | 624 | 4 | 2,837 | 2,629 | ||||||||||||||||||||||
| Debt servicing | 479 | — | 10 | — | 489 | 493 | ||||||||||||||||||||||
| Total expenses | 1,798 | 890 | 634 | 4 | 3,326 | 3,122 | ||||||||||||||||||||||
| Net income before surplus distribution | 71 | (22 | ) | 431 | (4 | ) | 476 | 605 | ||||||||||||||||||||
| Surplus distribution — Insurance | — | — | — | — | — | (81 | ) | |||||||||||||||||||||
| Net income | 71 | (22 | ) | 431 | (4 | ) | 476 | 524 | ||||||||||||||||||||
| Transfers to the government | (203 | ) | — | (432 | ) | — | (635 | ) | (411 | ) | ||||||||||||||||||
| Net increase (decrease) in equity in government enterprises | (132 | ) | (22 | ) | (1 | ) | (4 | ) | (159 | ) | 113 | |||||||||||||||||
FINANCIAL POSITION | ||||||||||||||||||||||||||||
| Assets: | ||||||||||||||||||||||||||||
| Cash and temporary investments | 30 | 146 | 32 | 2 | 210 | 164 | ||||||||||||||||||||||
| Amounts receivable | 402 | 193 | 14 | — | 609 | 584 | ||||||||||||||||||||||
| Portfolio investments | — | 1,844 | — | 3 | 1,847 | 1,778 | ||||||||||||||||||||||
| Capital assets | 7,041 | 41 | 180 | — | 7,262 | 6,565 | ||||||||||||||||||||||
| Pension assets | 457 | — | — | — | 457 | 473 | ||||||||||||||||||||||
| Other assets | 1,092 | 103 | 30 | — | 1,225 | 1,511 | ||||||||||||||||||||||
| Total assets | 9,022 | 2,327 | 256 | 5 | 11,610 | 11,075 | ||||||||||||||||||||||
| Liabilities: | ||||||||||||||||||||||||||||
| Accounts payable, accrued liabilities and deferred revenue | 1,053 | 399 | 67 | — | 1,519 | 1,168 | ||||||||||||||||||||||
| Long-term debt: Owing to the government | 5,454 | — | 178 | 2 | 5,634 | 5,909 | ||||||||||||||||||||||
| Owing to others | 866 | — | 1 | — | 867 | 414 | ||||||||||||||||||||||
| Provision for future benefit Pension obligations | 479 | 81 | — | — | 560 | 497 | ||||||||||||||||||||||
| Future cost of existing claims | — | 1,661 | — | — | 1,661 | 1,558 | ||||||||||||||||||||||
| Total liabilities | 7,852 | 2,141 | 246 | 2 | 10,241 | 9,546 | ||||||||||||||||||||||
| Net assets | 1,170 | 186 | 10 | 3 | 1,369 | 1,529 | ||||||||||||||||||||||
| Adjustments required for consolidation ** | — | — | — | — | — | (1 | ) | |||||||||||||||||||||
| Equity in government enterprises | 1,170 | 186 | 10 | 3 | 1,369 | 1,528 | ||||||||||||||||||||||
| * | For enterprises whose fiscal year is prior to March 31, the amounts reflected are as at their fiscal year end | |
| ** | Adjustments required to reflect the effect of asset valuations and valuation allowances recorded in the Operating Fund |
72
Table of Contents
SUMMARY FINANCIAL STATEMENTS
SCHEDULE 4
SUMMARY STATEMENT OF LONG-TERM INVESTMENTS
As at March 31, 2003
| ($ millions) | ||||||||||
| 2003 | 2002 | |||||||||
OTHER INVESTMENTS, AT COST | ||||||||||
| Common shares — | ||||||||||
| Manitoba Potash Corporation — 490,000 shares | 5 | 5 | ||||||||
| Preferred shares — | ||||||||||
| 3863620 Canada Limited — 11,000,000 shares | 11 | 16 | ||||||||
| Special shares — | ||||||||||
| Crocus Investment Fund — 2,000,000 shares | 2 | 2 | ||||||||
| Debentures — | ||||||||||
| Municipalities | 2 | 2 | ||||||||
| Profit sharing agreement — | ||||||||||
| Hudson Bay Mining and Smelting re: Ruttan Mine | 11 | 11 | ||||||||
| Other — | ||||||||||
| Limited partnership investments | 9 | 9 | ||||||||
| 40 | 45 | |||||||||
| Less: Valuation allowance | 33 | 38 | ||||||||
| 7 | 7 | |||||||||
73
Table of Contents
SUMMARY FINANCIAL STATEMENTS
SCHEDULE 5
SUMMARY STATEMENT OF TANGIBLE CAPITAL ASSETS
For the Year Ended March 31, 2003
($ millions)
| Machinery | Construction | Computer | |||||||||||||||||||||||||||||||||||||||||||
| Aircraft | Equipment | and | Hardware | Assets | Totals | ||||||||||||||||||||||||||||||||||||||||
| and | and | Maintenance | and | Leasehold | Under | ||||||||||||||||||||||||||||||||||||||||
| Land | Buildings | Vehicles | Vessels | Furniture | Equipment | Software | Improvements | Construction | 2003 | 2002 | |||||||||||||||||||||||||||||||||||
| Opening Cost | 56 | 1,828 | 80 | 45 | 589 | 54 | 349 | 18 | 161 | 3,180 | 2,986 | ||||||||||||||||||||||||||||||||||
| Add: | |||||||||||||||||||||||||||||||||||||||||||||
| Additions during the year | 2 | 77 | 11 | 3 | 70 | 4 | 44 | 4 | 55 | 270 | 227 | ||||||||||||||||||||||||||||||||||
| Assets acquired in prior years(*) | — | — | 2 | — | 9 | — | 1 | — | — | 12 | 5 | ||||||||||||||||||||||||||||||||||
| Less: | |||||||||||||||||||||||||||||||||||||||||||||
| Disposals during the year | (2 | ) | (8 | ) | — | (3 | ) | — | (4 | ) | — | (5 | ) | (22 | ) | (38 | ) | ||||||||||||||||||||||||||||
| Land capitalization adjustment (Note | (6 | ) | — | — | — | — | — | — | — | — | (6 | ) | — | ||||||||||||||||||||||||||||||||
| Closing Cost | 52 | 1,903 | 85 | 48 | 665 | 58 | 390 | 22 | 211 | 3,434 | 3,180 | ||||||||||||||||||||||||||||||||||
| Accumulated Amortization | |||||||||||||||||||||||||||||||||||||||||||||
| Opening | — | 608 | 40 | 25 | 425 | 36 | 166 | 6 | — | 1,306 | 1,187 | ||||||||||||||||||||||||||||||||||
| Add: | |||||||||||||||||||||||||||||||||||||||||||||
| Amortization | — | 43 | 9 | 2 | 39 | 2 | 34 | 1 | — | 130 | 131 | ||||||||||||||||||||||||||||||||||
| Assets acquired in prior years(*) | — | 2 | — | 9 | — | 1 | — | — | 12 | 1 | |||||||||||||||||||||||||||||||||||
| Less: | |||||||||||||||||||||||||||||||||||||||||||||
| Accumulated amortization on disposals | — | (1 | ) | (7 | ) | — | (3 | ) | — | (4 | ) | — | — | (15 | ) | (13 | ) | ||||||||||||||||||||||||||||
| Closing Accumulated Amortization | — | 650 | 44 | 27 | 470 | 38 | 197 | 7 | — | 1,433 | 1,306 | ||||||||||||||||||||||||||||||||||
| Net Book Value of Tangible Capital | 52 | 1,253 | 41 | 21 | 195 | 20 | 193 | 15 | 211 | 2,001 | 1,874 | ||||||||||||||||||||||||||||||||||
| * | During the year assets acquired in prior fiscal years which are fully amortized were identified and recorded. (2002 — $4 million net book value). | |
| ** | During the year the Province capitalized $0.9 million of interest relating to assets under construction. |
74
Table of Contents
SUMMARY FINANCIAL STATEMENTS
SCHEDULE 6
SUMMARY STATEMENT OF BORROWINGS
As at March 31, 2003
($ millions)
| Fiscal | Canada | Promissory Notes | ||||||||||||||||||||||||||
| Year | Bonds and Debentures | Pension | Loans and | and | Totals | |||||||||||||||||||||||
| of | Plan | Mortgages | Treasury Bills | |||||||||||||||||||||||||
| Maturity | Cdn | US | Cdn | Cdn | Cdn | 2003 | 2002 | |||||||||||||||||||||
| 2003 | — | — | — | — | — | — | ||||||||||||||||||||||
| 2004 | 1,726 | 529 | 126 | — | 500 | 2,881 | 3,471 | |||||||||||||||||||||
| 2005 | 1,088 | 71 | 119 | — | — | 1,278 | 2,432 | |||||||||||||||||||||
| 2006 | 1,321 | 297 | 126 | — | — | 1,744 | 1,286 | |||||||||||||||||||||
| 2007 | 1,061 | 735 | 150 | — | — | 1,946 | 1,118 | |||||||||||||||||||||
| 2008 | 1,128 | — | 90 | — | — | 1,218 | 1,648 | |||||||||||||||||||||
| 2003-2008 | 6,324 | 1,632 | 611 | — | 500 | 9,067 | 9,955 | |||||||||||||||||||||
| 2009-2013 Operating Fund | 3,044 | 1,014 | 502 | — | — | 4,560 | 4,904 | |||||||||||||||||||||
| 2014-2023 Operating Fund | 2,249 | 1,599 | 15 | — | — | 3,863 | 3,874 | |||||||||||||||||||||
| 2024-2042 Operating Fund | 1,916 | — | — | — | — | 1,916 | 1,586 | |||||||||||||||||||||
| 2003-2042 Crown Organizations | 107 | — | — | 302 | — | 409 | 429 | |||||||||||||||||||||
| 2009-2042 | 7,316 | 2,613 | 517 | 302 | — | 10,748 | 10,793 | |||||||||||||||||||||
| Total borrowings | 13,640 | 4,245 | 1,128 | 302 | 500 | 19,815 | 20,748 | |||||||||||||||||||||
| Reduced by: | ||||||||||||||||||||||||||||
| Unamortized debt issue costs | 19 | 6 | — | — | — | 25 | 31 | |||||||||||||||||||||
| Debt of the Province of Manitoba held as government investments | 44 | — | — | — | — | 44 | 35 | |||||||||||||||||||||
| 13,577 | 4,239 | 1,128 | 302 | 500 | 19,746 | 20,682 | ||||||||||||||||||||||
| March 31/03 | March 31/02 | ||||||||
| Cdn $ Valuation | Cdn $ Valuation | ||||||||
| (See Note) | (See Note) | ||||||||
| Borrowings payable in: | |||||||||
| Canadian dollars | 12,222 | 12,237 | |||||||
| Foreign issues hedged to Canadian dollars | 3,349 | 3,222 | |||||||
| U.S. dollars | 3,305 | 3,734 | |||||||
| Foreign issues hedged to U.S. dollars | 939 | 1,555 | |||||||
| Total borrowings | 19,815 | 20,748 | |||||||
| Note 1: The hedges are derivative contracts which include swaps and forward foreign exchange contracts. |
| Note 2: The Canadian dollar valuation is calculated using the foreign currency exchange rates in effect at each March 31 adjusted for any forward foreign exchange contracts entered into for settlement after year-end. |
| Note 3: Interest rates on these borrowings fall into one of three categories: |
| ii) | Fixed with rates ranging from 2.5% to 14.06%. |
| ii) | Floating Canadian — Bankers Acceptance (BA) setting, established quarterly or monthly, with the lowest rate currently set at 2.86% and the highest set at 3.15% as at March 31, 2003. |
| iii) | Floating U.S. — U.S. Dollar LIBOR (London Interbank Offering Rate) setting, established quarterly, with the lowest rate currently set at 1.35% and the highest set at 2.22% as at March 31, 2003. |
75
Table of Contents
SUMMARY FINANCIAL STATEMENTS
SCHEDULE 7
SUMMARY STATEMENT OF ACCOUNTS PAYABLE,
ACCRUED CHARGES, PROVISIONS AND DEFERRALS
As at March 31, 2003
| ($ millions) | |||||||||
| 2003 | 2002 | ||||||||
| Accounts payable | 706 | 842 | |||||||
| Accrued charges: | |||||||||
| Interest accrued on borrowings and trust funds | 239 | 266 | |||||||
| Other accrued liabilities: | |||||||||
| Canadian Farm Income Program | 30 | 39 | |||||||
| Community Access Program | 2 | 3 | |||||||
| Compensation for Victims of Crime | 18 | 19 | |||||||
| Disaster assistance | 2 | 9 | |||||||
| Flood claims | 43 | 40 | |||||||
| Gross Revenue Insurance Plan | — | 3 | |||||||
| Hepatitis C assistance | 8 | 9 | |||||||
| Land acquisition claims | 2 | 2 | |||||||
| Manfor Ltd. divestiture | 2 | 2 | |||||||
| Net Income Stabilization Account Program (NISA) | 23 | 3 | |||||||
| Provision for housing renovations | 7 | 16 | |||||||
| Ruttan Mines clean-up | 5 | 5 | |||||||
| Salaries and benefits | 480 | 348 | |||||||
| Tripartite Land Assembly Program | 3 | 3 | |||||||
| Other | 9 | 12 | |||||||
| 634 | 513 | ||||||||
| Provision for future losses on guarantees | 17 | 16 | |||||||
| Deferrals | 317 | 317 | |||||||
| 1,913 | 1,954 | ||||||||
76
Table of Contents
SUMMARY FINANCIAL STATEMENTS
SCHEDULE 8
FUNDS, ORGANIZATIONS AND ENTERPRISES
COMPRISING THE GOVERNMENT REPORTING ENTITY
| CONSOLIDATED FUND: | ||
| OPERATING FUND AND SPECIAL FUNDS: | ||
| Abandonment Reserve Fund | ||
| Debt Retirement Fund | ||
| Elk Management Fund | ||
| Farm Machinery and Equipment Act Fund | ||
| Fiscal Stabilization Fund | ||
| Land Titles Assurance Fund | ||
| Manitoba Law Reform Commission | ||
| Mining Community Reserve | ||
| Mining Rehabilitation Reserve | ||
| Pension Assets Fund | ||
| Quarry Rehabilitation Reserve | ||
| Veterinary Science Scholarship Fund | ||
| Victims Assistance Fund | ||
| CROWN ORGANIZATIONS: | ||
| Addictions Foundation of Manitoba | ||
| Assiniboine Community College | ||
| Board of Administration under the Embalmers and Funeral | ||
| Directors Act | ||
| Brandon University | ||
| CancerCare Manitoba | ||
| Centre culturel franco-manitobain | ||
| Child and Family Services of Central Manitoba | ||
| Child and Family Services of Western Manitoba | ||
| Communities Economic Development Fund | ||
| Cooperative Loans and Loans Guarantee Board | ||
| Cooperative Promotion Board | ||
| Council on Post-Secondary Education | ||
| Crown Corporations Council | ||
| Economic Innovation and Technology | ||
| Council | ||
| Helen Betty Osborne Foundation | ||
| Horse Racing Commission | ||
| Insurance Council of Manitoba | ||
| Keewatin Community College | ||
| Legal Aid Services Society of Manitoba |
77
Table of Contents
SUMMARY FINANCIAL STATEMENTS
SCHEDULE 8
(cont’d) ��
| Manitoba Adolescent Treatment Centre Inc. | ||
| Manitoba Agricultural Credit Corporation | ||
| Manitoba Arts Council | ||
| Manitoba Boxing Commission | ||
| Manitoba Centennial Centre Corporation | ||
| Manitoba Community Services Council Inc. | ||
| Manitoba Crop Insurance Corporation | ||
| Manitoba Development Corporation | ||
| Manitoba Film and Sound Recording Development Corporation | ||
| Manitoba Foundation | ||
| Manitoba Gaming Control Commission | ||
| Manitoba Habitat Heritage Corporation | ||
| Manitoba Health Research Council | ||
| Manitoba Health Services Insurance Plan | ||
| Manitoba Hospital Capital Financing Authority | ||
| Manitoba Housing and Renewal Corporation | ||
| Manitoba Trade and Investment Corporation | ||
| Manitoba Water Services Board Public Schools Finance Board | ||
| Red River College | ||
| Regional Health Authorities (Devolved Facilities) | ||
| Assiniboine Regional Health Authority Inc. | ||
| Brandon Regional Health Authority Inc. | ||
| Burntwood Regional Health Authority Inc. | ||
| Churchill RHA Inc. | ||
| Interlake Regional Health Authority | ||
| NOR-MAN Regional Health Authority Inc. | ||
| North Eastman Health Association Inc. | ||
| Parkland Regional Health Authority Inc. | ||
| Regional Health Authority — Central Manitoba Inc. | ||
| South Eastman Health/Santé Sud-Est Inc. | ||
| Winnipeg Regional Health Authority | ||
| Rehabilitation Centre for Children Inc. | ||
| Special Operating Agencies Financing Authority | ||
| Civil Legal Services | ||
| Companies Office | ||
| Fleet Vehicles Agency | ||
| Food Development Centre | ||
| Industrial Technology Centre |
78
Table of Contents
SUMMARY FINANCIAL STATEMENTS
SCHEDULE 8
(cont’d)
| Land Management Services | ||
| Mail Management Agency | ||
| Manitoba Education, Research and Learning | ||
| Information Networks (Merlin) | ||
| Manitoba Securities Commission | ||
| Manitoba Text Book Bureau | ||
| Materials Distribution Agency | ||
| Office of the Fire Commissioner | ||
| Organization and Staff Development | ||
| Pineland Forest Nursery | ||
| The Property Registry | ||
| The Public Trustee | ||
| Vital Statistics Agency | ||
| University of Manitoba | ||
| Venture Manitoba Tours Ltd. | ||
| Winnipeg Child and Family Services | ||
| GOVERNMENT ENTERPRISES: (Schedule 3) (Note 6) | ||
| Utility: | ||
| Manitoba Hydro-Electric Board | ||
| Insurance: | ||
| Manitoba Public Insurance Corporation | ||
| Workers Compensation Board | ||
| Finance: | ||
| Liquor Control Commission | ||
| Manitoba Lotteries Corporation | ||
| Manitoba Product Stewardship Corporation | ||
| Resource Development: | ||
| Leaf Rapids Town Properties Ltd. | ||
| Manitoba Hazardous Waste Management Corporation | ||
79
Table of Contents
SUMMARY FINANCIAL STATEMENTS
SCHEDULE 9
RECONCILIATION OF OPERATING FUND BUDGETARY BALANCE
TO SUMMARY NET INCOME
As at March 31, 2003
| ($ millions) | ||||||||||||||||||||||
| 2002-03 | ||||||||||||||||||||||
| Operations | ||||||||||||||||||||||
| 2002-03 | per Entity | Adjustments | 2002-03 | 2001-02 | ||||||||||||||||||
| Summary | Financial | on | Summary | Summary | ||||||||||||||||||
| Budget | Statements | Consolidation | Net Income | Net Income | ||||||||||||||||||
OPERATING FUND AND SPECIAL FUNDS | ||||||||||||||||||||||
| Operating Fund and Special Funds | 33 | 82 | — | 82 | 28 | |||||||||||||||||
CROWN ORGANIZATIONS | ||||||||||||||||||||||
| Assiniboine Community College | — | — | 1 | 1 | — | |||||||||||||||||
| CancerCare Manitoba | — | 2 | 6 | 8 | — | |||||||||||||||||
| Deer Lodge Centre Inc. | — | — | — | — | 2 | |||||||||||||||||
| Keewatin Community College | — | — | — | — | 2 | |||||||||||||||||
| Manitoba Arts Council | — | — | (1 | ) | (1 | ) | — | |||||||||||||||
| Manitoba Crop Insurance Corporation | (28 | ) | 4 | — | 4 | (21 | ) | |||||||||||||||
| Manitoba Gaming Control Commission | — | — | — | — | 1 | |||||||||||||||||
| Manitoba Habitat Heritage Corporation | — | — | 1 | 1 | — | |||||||||||||||||
| Manitoba Water Services Board | — | (1 | ) | — | (1 | ) | (1 | ) | ||||||||||||||
| Public Schools Finance Board | — | 1 | — | 1 | 2 | |||||||||||||||||
| Red River College | — | — | 6 | 6 | 7 | |||||||||||||||||
| Regional Health Authorities | — | 3 | 3 | 6 | (10 | ) | ||||||||||||||||
| Special Operating Agencies Financing Authority | (4 | ) | 14 | (11 | ) | 3 | 3 | |||||||||||||||
| University of Manitoba | — | 68 | (16 | ) | 52 | 31 | ||||||||||||||||
| Venture Manitoba Tours | — | — | 2 | 2 | — | |||||||||||||||||
| TOTAL CROWN ORGANIZATIONS | (32 | ) | 91 | (9 | ) | 82 | 16 | |||||||||||||||
GOVERNMENT ENTERPRISES | ||||||||||||||||||||||
| Leaf Rapids Town Properties Ltd. | — | — | — | — | (1 | ) | ||||||||||||||||
| Manitoba Hazardous Waste Management Corporation | — | (4 | ) | — | (4 | ) | — | |||||||||||||||
| Manitoba Liquor Control Commission | 167 | — | 166 | 166 | 163 | |||||||||||||||||
| Manitoba Hydro — Electric Board | 106 | 71 | — | 71 | 214 | |||||||||||||||||
| Manitoba Lotteries Corporation | 252 | — | 266 | 266 | 248 | |||||||||||||||||
| Manitoba Product Stewardship Corporation | (1 | ) | (1 | ) | — | (1 | ) | (1 | ) | |||||||||||||
| Manitoba Public Insurance Corporation (MPIC) | 5 | (22 | ) | — | (22 | ) | (16 | ) | ||||||||||||||
| Workers Compensation Board | (2 | ) | — | — | — | (2 | ) | |||||||||||||||
| 527 | 44 | 432 | 476 | 605 | ||||||||||||||||||
| Surplus Distribution — MPIC | — | — | — | (81 | ) | |||||||||||||||||
| 527 | 44 | 432 | 476 | 524 | ||||||||||||||||||
| Less: Adjustments on Consolidation | (494 | ) | — | (635 | ) | (635 | ) | (411 | ) | |||||||||||||
| TOTAL GOVERNMENT ENTERPRISES (Schedule 3) | 33 | 44 | (203 | ) | (159 | ) | 113 | |||||||||||||||
NON-DEVOLVED HEALTH CARE FACILITIES | ||||||||||||||||||||||
EMPLOYEE FUTURE BENEFITS | — | — | (6 | ) | (6 | ) | — | |||||||||||||||
PENSION LIABILITY INCREASE | (167 | ) | (183 | ) | — | (183 | ) | (167 | ) | |||||||||||||
TOTAL SUMMARY NET LOSS | (133 | ) | 34 | (218 | ) | (184 | ) | (10 | ) | |||||||||||||
80
Table of Contents
SUMMARY FINANCIAL STATEMENTS
SCHEDULE 10
RECONCILIATION OF OPERATING FUND ACCUMULATED DEFICIT
TO SUMMARY ACCUMULATED DEFICIT*
As at March 31, 2003
| ($ millions) | |||||||||||||||||
| Accumulated | Adjustments to | Accumulated | |||||||||||||||
| Surplus | 2002-03 | Accumulated | Surplus | ||||||||||||||
| (Deficit) | Summary | Surplus | (Deficit) | ||||||||||||||
| March 31,2002 | Net Income | (Deficit) | March 31,2003 | ||||||||||||||
OPERATING FUND AND SPECIAL FUNDS | |||||||||||||||||
| Operating Fund and Special Funds | (6,510 | ) | 82 | (47 | ) | (6,475 | ) | ||||||||||
CROWN ORGANIZATIONS | |||||||||||||||||
| Addictions Foundation of Manitoba | 4 | — | — | 4 | |||||||||||||
| Assiniboine Community College | 8 | 1 | — | 9 | |||||||||||||
| Brandon University | 41 | — | — | 41 | |||||||||||||
| CancerCare Manitoba | 35 | 8 | — | 43 | |||||||||||||
| Child and Family Services of Western Manitoba | 1 | — | — | 1 | |||||||||||||
| Communities Economic Development Fund | 1 | — | — | 1 | |||||||||||||
| Deer Lodge Centre Inc. | 5 | — | (5 | ) | — | ||||||||||||
| Economic Innovation and Technology Council | 1 | — | — | 1 | |||||||||||||
| Keewatin Community College | 4 | — | — | 4 | |||||||||||||
| Manitoba Adolescent Treatment Centre | 2 | — | — | 2 | |||||||||||||
| Manitoba Agricultural Credit Corporation | 3 | — | — | 3 | |||||||||||||
| Manitoba Arts Council | — | (1 | ) | — | (1 | ) | |||||||||||
| Manitoba Crop Insurance Corporation | 287 | 4 | — | 291 | |||||||||||||
| Manitoba Development Corporation | 4 | — | — | 4 | |||||||||||||
| Manitoba Gaming Control Commission | 2 | — | — | 2 | |||||||||||||
| Manitoba Habitat Heritage Corporation | 1 | 1 | — | 2 | |||||||||||||
| Manitoba Health Services Insurance Plan | (1 | ) | — | — | (1 | ) | |||||||||||
| Manitoba Water Services Board | (1 | ) | (1 | ) | 1 | (1 | ) | ||||||||||
| Public Schools Finance Board | (5 | ) | 1 | — | (4 | ) | |||||||||||
| Red River College | 14 | 6 | — | 20 | |||||||||||||
| Regional Health Authorities | 206 | 6 | 2 | 214 | |||||||||||||
| Special Operating Agencies Financing Authority | 49 | 3 | (1 | ) | 51 | ||||||||||||
| University of Manitoba | 279 | 52 | — | 331 | |||||||||||||
| Venture Manitoba Tours | 3 | 2 | — | 5 | |||||||||||||
| Winnipeg Child and Family Services | (1 | ) | — | — | (1 | ) | |||||||||||
| 942 | 82 | (3 | ) | 1,021 | |||||||||||||
GOVERNMENT ENTERPRISES | |||||||||||||||||
| Leaf Rapids Town Properties Ltd. | 1 | — | 1 | 2 | |||||||||||||
| Liquor Control Commission | — | 166 | (166 | ) | — | ||||||||||||
| Manitoba Hazardous Waste Management Corporation | 6 | (4 | ) | (1 | ) | 1 | |||||||||||
| Manitoba Hydro — Electric Board | 1,302 | 71 | (203 | ) | 1,170 | ||||||||||||
| Manitoba Lotteries Corporation | 5 | 266 | (266 | ) | 5 | ||||||||||||
| Manitoba Product Stewardship Corporation | 6 | (1 | ) | — | 5 | ||||||||||||
| Manitoba Public Insurance Corporation | 133 | (22 | ) | — | 111 | ||||||||||||
| Workers Compensation Board | 75 | — | 75 | ||||||||||||||
| 1,528 | 476 | (635 | ) | 1,369 | |||||||||||||
| Adjustments on Consolidation | — | (635 | ) | 635 | — | ||||||||||||
| 1,528 | (159 | ) | — | 1,369 | |||||||||||||
NON-DEVOLVED HEALTH CARE FACILITIES | 77 | — | — | 77 | |||||||||||||
NON-DEVOLVED HEALTH CARE FACILITIES | |||||||||||||||||
EMPLOYEE FUTURE BENEFITS | — | (6 | ) | (69 | ) | (75 | ) | ||||||||||
PENSION LIABILITY | (3,217 | ) | (183 | ) | (11 | ) | (3,411 | ) | |||||||||
TOTAL SUMMARY BALANCES | (7,180 | ) | (184 | ) | (130 | ) | (7,494 | ) | |||||||||
| * | Differences may result from rounding. |
81
Table of Contents
SUMMARY FINANCIAL STATEMENTS
SCHEDULE 11
SUMMARY STATEMENT OF EXPENSE BY TYPE
For the Year Ended March 31, 2003
| ($ millions) | |||||||||
| 2003 | 2002 | ||||||||
| Personnel Services | 2,447 | 2,278 | |||||||
| Grants/Transfer Payments | 2,987 | 2,812 | |||||||
| Transportation | 96 | 94 | |||||||
| Communications | 45 | 46 | |||||||
| Supplies and Services | 748 | 701 | |||||||
| Social Assistance Related | 617 | 605 | |||||||
| Other Operating | 396 | 436 | |||||||
| Debt Servicing — Provincial Departments | 416 | 499 | |||||||
| — Crown Organizations | 78 | 78 | |||||||
| Minor Capital | 35 | 46 | |||||||
| Amortization of Tangible Capital Assets | 130 | 131 | |||||||
| 7,995 | 7,726 | ||||||||
SCHEDULE 12
SUMMARY STATEMENT OF NET DEBT
For the Year Ended March 31, 2003
| ($ millions) | ||||||||
| 2003 | 2002 | |||||||
| Accumulated deficit, end of year | 7,494 | 7,180 | ||||||
| Tangible capital assets | 2,001 | 1,874 | ||||||
| Deferred charges for non-devolved health care facilities | 133 | 137 | ||||||
| Assets of non-devolved health care facilities | 775 | 759 | ||||||
| 10,403 | 9,950 | |||||||
| Less: | ||||||||
| Liabilities of non-devolved health care facilities | 698 | 682 | ||||||
SUMMARY NET DEBT | 9,705 | 9,268 | ||||||
Note: Net debt is the excess of liabilities over financial assets. Tangible capital assets, deferred charges and net assets of non-devolved health care facilities are not considered to be financial assets since they cannot be immediately converted into cash to pay down liabilities. Net debt represents how much the government would have to borrow in total, after liquidating its financial assets, in order to pay all of its liabilities.
82
Table of Contents
PROVINCE OF MANITOBA
SPECIAL PURPOSE
STATEMENTS OF ACCOUNTABILITY
FOR
STEWARDSHIP OF CENTRAL GOVERNMENT OPERATIONS
AND
BALANCED BUDGET LEGISLATION
83
Table of Contents
SECTION 2
OPERATING FUND AND SPECIAL FUNDS — SPECIAL PURPOSE FINANCIAL STATEMENTS
| TABLE OF CONTENTS | PAGE | ||||
| Statement of Responsibility | 87 | ||||
| Auditor’s Report | 89 | ||||
| Special Purpose Statement of Financial Position | 91 | ||||
| Special Purpose Statement of Revenue and Expense | 92 | ||||
| Special Purpose Statement of Accumulated Deficits (Surpluses) | 93 | ||||
| Special Purpose Statement of Cash Flow | 94 | ||||
| Notes to the Financial Statements | 95 | ||||
| Schedules to the Financial Statements | |||||
| Schedule 1 - Amounts Receivable | 108 | ||||
| Schedule 2 - Loans and Advances | 109 | ||||
| Schedule 3 - Long-Term Investments | 109 | ||||
| Schedule 4 - Amounts Held in Trust for Investment or Administration and Trust Assets | 110 | ||||
| Schedule 5 - Tangible Capital Assets | 111 | ||||
| Schedule 6 - Schedule of Borrowings | 112 | ||||
| Schedule 7 - Accounts Payable, Accrued Charges, Provisions and Deferrals | 113 | ||||
| Schedule 8 - Operating Revenue and Expense | 114 | ||||
| Schedule 9 - Changes in Other Special Funds | 115 | ||||
| Schedule 10 - Expense by Type | 116 | ||||
| Schedule 11 - Net Debt | 116 | ||||
85
Table of Contents
STATEMENT OF RESPONSIBILITY
The Special Purpose Operating Fund and Special Funds financial statements are prepared under the direction of the Minister of Finance in accordance with the stated accounting policies of the government and include a special purpose statement of financial position, a special purpose statement of revenue and expense, a special purpose statement of accumulated deficit, a special purpose statement of cash flow, notes and schedules integral to the statements. Together, they present fairly, in all material respects, the financial condition of the Operating Fund and Special Funds at the fiscal year end and results of their operations for the year then ended.
The government is responsible for the integrity and objectivity of the Special Purpose Operating Fund and Special Funds financial statements. In the preparation of these statements, estimates are sometimes necessary because a precise determination of certain assets and liabilities is dependent on future events. The government believes such estimates have been based on careful judgements and have been properly reflected in the financial statements.
The government maintains a system of internal accounting and administrative controls in order to provide reasonable assurance that transactions are appropriately authorized, assets are safeguarded and financial records are properly maintained.
These financial statements are tabled in the Legislature. They are referred to the Standing Committee on Public Accounts, which reports to the Legislature on the results of its examination together with any recommendations it may have with respect to the financial statements and accompanying audit opinion.
More detailed information regarding the Operating Fund and Special Funds combined financial position and operating results can be found in Volumes 2 and 3 of the Public Accounts. In addition, explanatory comments with respect to changes in revenue and expense are provided in each government department’s annual report.
| On behalf of the Government | ||
| /s/ Greg Selinger | ||
| HONOURABLE GREG SELINGER Minister of Finance September 22, 2003 |
Table of Contents
Office of the Auditor General
500 - 330 Portage Avenue
Winnipeg, Manitoba
CANADA R3C 0C4
Winnipeg, Manitoba
CANADA R3C 0C4
AUDITOR’S REPORT
On the Special Purpose Operating Fund and Special Funds Financial Statements
Province of Manitoba
To the Legislative Assembly of the Province of Manitoba
In accordance with Section 9 of The Auditor General Act, I have audited the special purpose statement of financial position of the Operating Fund and Special Funds of the Province of Manitoba as at March 31, 2003 and the special purpose statements of revenue and expense, accumulated (deficits) surpluses and cash flow for the year then ended. These special purpose financial statements are the responsibility of the Government of Manitoba. My responsibility is to express an opinion on these special purpose financial statements based on my audit.
I conducted my audit in accordance with Canadian generally accepted auditing standards. Those standards require that I plan and perform an audit to obtain reasonable assurance whether the financial statements are free of material misstatement. An audit includes examining, on a test basis, evidence supporting the amounts and disclosures in the financial statements. An audit also includes assessing the accounting principles used and significant estimates made by management, as well as evaluating the overall financial statement presentation.
In my opinion, these Special Purpose Financial Statements present fairly, in all material respects, the financial position of the Operating Fund and Special Funds as at March 31, 2003 and the results of its operations and its cash flow for the year then ended in accordance with the accounting policies disclosed in Note 1 to the financial statements applied on a basis consistent with that of the preceding year.
| Winnipeg, Manitoba September 22, 2003 | /s/ Jon W. Singleton Jon W. Singleton, CA•CISA Auditor General |
Table of Contents
OPERATING FUND AND SPECIAL FUNDS — SPECIAL PURPOSE FINANCIAL STATEMENTS
OPERATING FUND AND SPECIAL FUNDS
SPECIAL PURPOSE STATEMENT OF FINANCIAL POSITION
As at March 31, 2003
| ($ millions) | ||||||||||||||
| SCHEDULE | 2003 | 2002 | ||||||||||||
ASSETS | ||||||||||||||
| Cash and Cash Equivalents (Note 2) | 167 | 127 | ||||||||||||
| 1 | Amounts Receivable | 563 | 712 | |||||||||||
| 2 | Loans and Advances | 785 | 778 | |||||||||||
| 3 | Long-Term Investments | — | 5 | |||||||||||
| Pension Assets (Note 19) | 151 | — | ||||||||||||
| Deferred Charge for Health Care Facilities (Note 1A7) | 446 | 392 | ||||||||||||
| 2,112 | 2,014 | |||||||||||||
| 4 | Trust Assets (Note 1F) | 2,063 | 2,062 | |||||||||||
| 5 | Tangible Capital Assets | 399 | 391 | |||||||||||
TOTAL ASSETS | 4,574 | 4,467 | ||||||||||||
LIABILITIES | ||||||||||||||
| 6 | Borrowings | 19,340 | 20,254 | |||||||||||
| Less: Sinking Funds (Note 3) | (5,805 | ) | (6,485 | ) | ||||||||||
| Less: Debt Incurred For and Repayable By The Manitoba Hydro-Electric Board and Manitoba Lotteries Corporation | (5,573 | ) | (5,871 | ) | ||||||||||
| 7,962 | 7,898 | |||||||||||||
| Less: Unamortized Foreign Currency Fluctuation | (81 | ) | (143 | ) | ||||||||||
| Net Borrowings | 7,881 | 7,755 | ||||||||||||
| 7 | Accounts Payable, Accrued Charges, Provisions and Deferrals | 1,105 | 1,267 | |||||||||||
| 8,986 | 9,022 | |||||||||||||
| 4 | Amounts Held in Trust for Investment or Administration (Note 1F) | 2,063 | 2,062 | |||||||||||
TOTAL LIABILITIES | 11,049 | 11,084 | ||||||||||||
ACCUMULATED (DEFICITS) SURPLUSES | ||||||||||||||
| Operating Fund | (7,037 | ) | (6,990 | ) | ||||||||||
| Fiscal Stabilization Fund | 235 | 247 | ||||||||||||
| Pension Assets Fund (Note 19) | 151 | — | ||||||||||||
| Debt Retirement Fund | 152 | 100 | ||||||||||||
| 9 | Other Special Funds | 24 | 26 | |||||||||||
| 11 | ACCUMULATED DEFICIT | (6,475 | ) | (6,617 | ) | |||||||||
| Information concerning the Government’s Guarantees, Financial Capital Commitments, Contingencies and Pension Liability can be found in Notes 5, 6, 7 and 9. |
91
Table of Contents
OPERATING FUND AND SPECIAL FUNDS — SPECIAL PURPOSE FINANCIAL STATEMENTS
OPERATING FUND AND SPECIAL FUNDS
SPECIAL PURPOSE STATEMENT OF REVENUE AND EXPENSE
For the Year Ended March 31, 2003
| ($ millions) | ($ millions) | |||||||||||||||||||||||||||||||||||||||
| Fiscal | Debt | Pension | Other | |||||||||||||||||||||||||||||||||||||
| Operating | Special | Total | Operating Fund | Stabilization | Retirement | Assets | Special | Total | ||||||||||||||||||||||||||||||||
| Fund | Funds | 2002 | Budget | Actual | Fund | Fund | Fund | Funds | 2003 | |||||||||||||||||||||||||||||||
OPERATING REVENUE (Schedule 8) | ||||||||||||||||||||||||||||||||||||||||
| 2,151 | 2 | 2,153 | Manitoba Collections | 2,244 | 2,297 | — | — | — | 4 | 2,301 | ||||||||||||||||||||||||||||||
| 1,965 | — | 1,965 | Income Taxes | 1,829 | 1,796 | — | — | — | — | 1,796 | ||||||||||||||||||||||||||||||
| 2,206 | — | 2,206 | Federal Transfers | 2,362 | 2,230 | — | — | — | — | 2,230 | ||||||||||||||||||||||||||||||
| 424 | — | 424 | Crown Corporations | 506 | 647 | — | — | 2 | — | 649 | ||||||||||||||||||||||||||||||
| — | 19 | 19 | Interest Earned | — | — | 7 | 4 | (6 | ) | 1 | 6 | |||||||||||||||||||||||||||||
| 6,746 | 21 | 6,767 | 6,941 | 6,970 | 7 | 4 | (4 | ) | 5 | 6,982 | ||||||||||||||||||||||||||||||
| 6,737 | 4 | 6,741 | OPERATING EXPENSES (Schedules 8 & 10) | 6,928 | 6,944 | — | — | — | 4 | 6,948 | ||||||||||||||||||||||||||||||
NET REVENUE (EXPENSES) | ||||||||||||||||||||||||||||||||||||||||
| 9 | 17 | 26 | BEFORE EXTRAORDINARY ITEM | 13 | 26 | 7 | 4 | (4 | ) | 1 | 34 | |||||||||||||||||||||||||||||
EXTRAORDINARY ITEM | ||||||||||||||||||||||||||||||||||||||||
| — | — | — | Adjustment to estimate for Federal accounting error (Note 18) | — | 51 | — | — | — | — | 51 | ||||||||||||||||||||||||||||||
| 9 | 17 | 26 | NET REVENUE (EXPENSES) | 13 | 77 | 7 | 4 | (4 | ) | 1 | 85 | |||||||||||||||||||||||||||||
INTERFUND TRANSFERS | ||||||||||||||||||||||||||||||||||||||||
| (96 | ) | 96 | — | Transfer to Debt Retirement Fund | (96 | ) | (96 | ) | — | 96 | — | — | ||||||||||||||||||||||||||||
| — | — | — | Transfer for Pensions | — | — | — | (48 | ) | 48 | — | — | |||||||||||||||||||||||||||||
| 150 | (150 | ) | — | Transfer from Fiscal Stabilization Fund | 93 | 23 | (23 | ) | — | — | — | — | ||||||||||||||||||||||||||||
| — | — | — | Transfer from Mining Community Reserve | — | — | — | — | — | (3 | ) | (3 | ) | ||||||||||||||||||||||||||||
| 54 | (54 | ) | — | (3 | ) | (73 | ) | (23 | ) | 48 | 48 | (3 | ) | (3 | ) | |||||||||||||||||||||||||
| 63 | (37 | ) | 26 | POSITIVE BALANCE FOR PURPOSES OF BALANCED BUDGET LEGISLATION | 10 | 4 | (16 | ) | 52 | 44 | (2 | ) | 82 | |||||||||||||||||||||||||||
INTERFUND TRANSFER | ||||||||||||||||||||||||||||||||||||||||
| Less: Transfer to | ||||||||||||||||||||||||||||||||||||||||
| (63 | ) | 63 | — | Fiscal Stabilization Fund | (10 | ) | (4 | ) | 4 | — | — | — | — | |||||||||||||||||||||||||||
| — | 26 | 26 | NET RESULT FOR THE YEAR | — | — | (12 | ) | 52 | 44 | (2 | ) | 82 | ||||||||||||||||||||||||||||
92
Table of Contents
OPERATING FUND AND SPECIAL FUNDS — SPECIAL PURPOSE FINANCIAL STATEMENTS
OPERATING FUND AND SPECIAL FUNDS
SPECIAL PURPOSE STATEMENT OF ACCUMULATED (DEFICITS) SURPLUSES
For the Year Ended March 31, 2003
| ($ millions) | ||||||||||||||||||||||||||||
| Fiscal | Debt | Pension | Other | |||||||||||||||||||||||||
| Operating | Stabilization | Retirement | Assets | Special | Total | Total | ||||||||||||||||||||||
| Fund | Fund | Fund | Fund | Funds | 2003 | 2002 | ||||||||||||||||||||||
| (Schedule 9) | ||||||||||||||||||||||||||||
| Balance, Beginning of Year | (6,990 | ) | 247 | 100 | — | 26 | (6,617 | ) | (6,288 | ) | ||||||||||||||||||
| Transfer from Trust Liabilities to create Pension Assets Fund (Note 12 and 19) | — | — | — | 107 | — | 107 | (75 | ) | ||||||||||||||||||||
| Tangible Capital Assets (Note 4A) | (6 | ) | — | — | — | — | (6 | ) | 4 | |||||||||||||||||||
| Net Income Stabilization Account (Note 4B) | (19 | ) | (19 | ) | — | |||||||||||||||||||||||
| Municipal Tax Sharing (Note 4C) | (23 | ) | — | — | — | — | (23 | ) | — | |||||||||||||||||||
| Federal Accounting Error (Note 18) | — | — | — | — | — | — | (287 | ) | ||||||||||||||||||||
| Repurchase of Serial Debentures (Note 1G) | 1 | — | — | — | — | 1 | 3 | |||||||||||||||||||||
| Net Result for the Year | — | (12 | ) | 52 | 44 | (2 | ) | 82 | 26 | |||||||||||||||||||
| Balance, End of Year (Schedule 11) | (7,037 | ) | 235 | 152 | 151 | 24 | (6,475 | ) | (6,617 | ) | ||||||||||||||||||
93
Table of Contents
OPERATING FUND AND SPECIAL FUNDS — SPECIAL PURPOSE FINANCIAL STATEMENTS
OPERATING FUND AND SPECIAL FUNDS
SPECIAL PURPOSE STATEMENT OF CASH FLOW
For the Year Ended March 31, 2003
| ($ millions) | |||||||||||
| 2003 | 2002 | ||||||||||
| Cash and Cash Equivalents Provided by (Used in) | |||||||||||
| Operating Activities: | |||||||||||
| Net Result for the year — Operating Fund | — | — | |||||||||
| — Special Funds | 82 | 26 | |||||||||
| Changes in non-cash items: | |||||||||||
| Amounts Receivable | 149 | (22 | ) | ||||||||
| Valuation Allowance | 25 | — | |||||||||
| Accounts Payable, Accrued Charges, Provisions and Deferrals | (162 | ) | 68 | ||||||||
| Amortization of Foreign Currency Fluctuation | 17 | 58 | |||||||||
| Amortization of Debt Discount | 10 | 14 | |||||||||
| Amortization of Investment Discounts and Premiums | (14 | ) | (4 | ) | |||||||
| Amortization of Tangible Capital Assets | 31 | 34 | |||||||||
| Land Capitalization Adjustment | 6 | — | |||||||||
| Adjustment to Accumulated Deficit — Federal Accounting Error | — | (287 | ) | ||||||||
| Adjustment to Accumulated Deficit — Other | (48 | ) | 4 | ||||||||
| 96 | (109 | ) | |||||||||
| Investing Activities: | |||||||||||
| Made | (651 | ) | (1,298 | ) | |||||||
| Realized | 986 | 744 | |||||||||
| Acquisition of Tangible Capital Assets | (45 | ) | (45 | ) | |||||||
| 290 | (599 | ) | |||||||||
| Financing Activities: | |||||||||||
| Debt Issued | 2,875 | 2,607 | |||||||||
| Debt Redeemed | (3,354 | ) | (2,051 | ) | |||||||
| Changes in Sinking Funds | 133 | (200 | ) | ||||||||
| (346 | ) | 356 | |||||||||
| Changes in Cash and Cash Equivalents | 40 | (352 | ) | ||||||||
| Cash and Cash Equivalents, beginning of year | 127 | 479 | |||||||||
| Cash and Cash Equivalents, end of year | 167 | 127 | |||||||||
94
Table of Contents
OPERATING FUND AND SPECIAL FUNDS — SPECIAL PURPOSE FINANCIAL STATEMENTS
NOTES TO THE SPECIAL PURPOSE FINANCIAL STATEMENTS
FOR THE YEAR ENDED MARCH 31, 2003
| 1. | SIGNIFICANT ACCOUNTING POLICIES |
| A. | General Basis of Accounting |
| The special purpose financial statements of the Operating Fund and Special Funds have been prepared in accordance with Canadian generally accepted accounting principles for senior governments as recommended by the Canadian Institute of Chartered Accountants (CICA), with the following exceptions: |
| 1) | Liabilities for unfunded pension benefits have not been recorded in the Operating Fund Financial Statements. |
| 2) | The liabilities for unfunded employee future benefits associated with health care facilities and family service agencies for which the government has funding responsibility are not recorded in the Operating Fund. |
| 3) | The financial statements do not reflect the financial results for all of the government enterprises and Crown organizations comprising the government reporting entity. The financial operations of the latter are reflected only to the extent that their operations were financed from or contributed to the Operating Fund. |
| 4) | Material adjustments may result from changes in accounting policy or from the correction of an error which are attributable to and identifiable with prior periods. It is the government’s practice to reflect the effects of such adjustments in the accumulated deficit. Prior year balances are not restated. |
| 5) | The process of establishing the completeness and reasonableness of the estimated historical cost of the tangible capital assets is ongoing. Reporting policies are currently being developed and information is being gathered for other expenditures which include infrastructure such as highways, bridges, and land acquired for public use. |
| 6) | The CICA recommends certain standards for reporting tangible capital assets and net debt. Although the government has adopted the standards related to tangible capital assets, it has not fully adopted the recommended presentation of net debt. Net Debt (Schedule 11) provides a reconciliation from accumulated deficit to net debt. |
| 7) | Prior to the 2000/01 fiscal year, individual health care facilities issued long-term debt in their own name to finance major capital acquisitions. In 2000/01, the Province began a program to finance such debt directly, taking advantage of its superior borrowing power and rates, and lowering the cost of health related borrowings for Manitoba. This debt is included as part of the Province’s general purpose borrowings. The related asset for devolved and non-devolved health care facilities is recorded as a deferred charge and amortized over the same period as the term of the debt issue. |
| 8) | Operating commitments are not disclosed in the Operating Fund Financial Statements. |
| These accounting policies have been developed and are applied in accordance with the provisions of The Financial Administration Act, which is Chapter F55 of the Continuing Consolidation of the Statutes of Manitoba. |
| B. | The Reporting Entity |
| These statements consist of the Operating Fund and Special Funds that on a combined basis reflect the transactions and balances of these funds. |
| The nature and purpose of the funds reflected in these financial statements is as follows: |
95
Table of Contents
OPERATING FUND AND SPECIAL FUNDS — SPECIAL PURPOSE FINANCIAL STATEMENTS
| Operating Fund - The Operating Fund is the vehicle through which the government manages and controls the operations of government departments and programs, and does not include the results of government enterprises and Crown Organizations except to the extent that they may have received funding from the Operating Fund. It is through the Operating Fund that the government reports on its stewardship of Central government operations, including measurement of its results as compared to voted appropriations, and its obligations with respect to The Balanced Budget, Debt Repayment and Taxpayer Accountability Act. |
| Debt Retirement Fund - This Fund was established on November 3, 1995 under the authority of The Balanced Budget, Debt Repayment and Taxpayer Accountability Act. The purpose of the Fund is to assist in the orderly repayment of debt pursuant with section 8(4) of the Act. After March 31, 2000, until the Fund is wound up, the Minister of Finance is required to deposit annually in the Fund a minimum of $96 million or such greater amount as determined by the Act. |
| Fiscal Stabilization Fund - This Fund was established at March 31, 1989 under the authority of The Fiscal Stabilization Fund Act. The purpose of the Fund is to assist in stabilizing the fiscal position of the government from year to year and to improve long-term fiscal planning. Under the provisions of the Act, the government may deposit in the Fund any part of the revenue or other financial assets received in the Operating Fund in any fiscal year and shall credit to the Fiscal Stabilization Fund any earnings from investment of the assets of the Fund. All or part of the Fund balance may be transferred to the Operating Fund in accordance with the provisions of the Act. |
| Section 9(a) of The Balanced Budget, Debt Repayment and Taxpayer Accountability Act requires that, if a surplus exists in a fiscal year in the Operating Fund, the Minister of Finance shall transfer an amount sufficient to bring the Fiscal Stabilization Fund to its target level as set out by The Fiscal Stabilization Fund Act or any greater amount that the Minister considers appropriate. The target level for the Fiscal Stabilization Fund is a minimum of 5% of the expense of the Operating Fund. |
| Pension Assets Fund - This Fund was established under the authority of The Balanced Budget, Debt Repayment and Taxpayer Accountability Act. The purpose of the Fund is to set aside designated assets, pursuant to section 8 of the Act, for the future retirement of the government’s pension liability. |
| Mining Community Reserve - This Fund was established to assist with the welfare and employment of people who are directly affected by mine closures in Manitoba. The Lieutenant Governor in Council may transfer to this Fund each year up to 3% of the taxes collected under The Mining Tax Act. |
| Quarry Rehabilitation Reserve Fund - This Fund was established to assist in the rehabilitation of quarries deemed to be depleted. A levy of 10 cents per metric ton of all aggregate quarry mineral production in Manitoba is paid into the Fund each year. |
| Other Funds - Other funds included reflect the transactions of the Abandonment Reserve Fund, the Farm Machinery and Equipment Act Fund, the Elk Management Fund, the Land Titles Assurance Fund, Manitoba Law Reform Commission, Veterinary Science Scholarship Fund, Mining Rehabilitation Reserve and Victims Assistance Fund. |
| The combined financial statements of the above funds are also included in the government’s Summary Financial Statements which are presented separately. |
| C. | Gross Accounting Concept |
| Revenues and expenses are recorded in gross amounts with the following exceptions: |
| 1) | The municipal share of individual and corporation income taxes, which is collected through the Government of Canada and remitted by the Province of Manitoba to municipalities in accordance with The Provincial-Municipal Tax Sharing Act, is not recorded as revenue or expense. It is reflected as a reduction in individual and corporation income tax revenues. |
96
Table of Contents
OPERATING FUND AND SPECIAL FUNDS — SPECIAL PURPOSE FINANCIAL STATEMENTS
| 2) | Refunds of revenue are treated as reductions of current year revenue. |
| 3) | Decreases in valuation allowances previously provided are treated as reductions to expense. |
| 4) | Recoveries of the debt servicing costs on self-supporting debt and revenue earned on investments and advances are recorded as a reduction of debt servicing expense. |
| D. | Modified Accrual Accounting |
| The revenues and expenses of the government are recorded on an accrual basis with the following exceptions. |
| 1) | Government of Canada Receipts - Generally, entitlements from the Government of Canada for transfer payments, the transfer having been authorized and any eligibility criteria met, as well as for the Province’s share of individual and corporation income tax pursuant to the Federal-Provincial Tax Collection Agreements are recorded on a cash basis for cash receipts received up to March 31 plus an accrual of prior period adjustments determined before June 30 each year. |
| 2) | Other Revenue — All other revenues are recorded on an accrual basis except when the accruals cannot be determined with a reasonable degree of certainty or when their estimation is impracticable. Recoveries of the debt servicing costs on self-supporting debt and revenue earned on investments and advances are recorded as a reduction of debt servicing expense. |
| 3) | Expenses — All expenses incurred for goods or services received are recorded on an accrual basis. Exceptions to this policy involve the acquisition of inventories acquired for the government’s use that are reflected as expenses when incurred as well as items 4) and 5) noted below. |
| Expenses include provisional amounts recorded in anticipation of future costs which are quantifiable and have been identified as obligations. Government transfers are recognized as expenses in the period during which the transaction is authorized and any eligibility criteria are met. |
| 4) | Pension Benefits — The annual cost recorded is based on the government’s share of pensions paid to retired employees, teachers and Members of the Legislative Assembly, as well as current contributions to Registered Retirement Savings Plan accounts and tax paid trusts on behalf of MLAs and employees who are pensionable outside of the Civil Service Superannuation Fund. The government does not record its liability for the unfunded cost of pension benefits earned by employees, teachers and Members of the Legislative Assembly. |
| 5) | Employee Future Benefits - The government does not record liabilities for the unfunded cost of employee future benefits earned by employees of health care facilities and family service agencies. |
| E. | Liabilities and Assets |
| 1) | All borrowings are expressed in Canadian dollars and are shown net of sinking funds, unamortized debt issue costs and debt of the Province of Manitoba held as provincial investments. Foreign borrowings are converted at the exchange rate in effect at March 31 adjusted for any forward foreign exchange contract entered into for settlement after the fiscal year end. Discounts or premiums, and commissions incurred at the time of the issue of debt are amortized monthly to debt servicing expense over the term of the debt. |
97
Table of Contents
OPERATING FUND AND SPECIAL FUNDS — SPECIAL PURPOSE FINANCIAL STATEMENTS
| 2) | The year end translation adjustments reflecting the foreign currency fluctuation from the value at the issue date are recorded through the unamortized foreign currency fluctuation account, and amortized monthly to debt servicing expense over the remaining term of the debt. The unamortized portion of foreign currency fluctuation also reflects the gains or losses on the conversion of foreign currency debt called prior to maturity using the rates in effect at the time of the call and these gains and losses are amortized over the original remaining term of the debt or over the term of the replacement issue, whichever is shorter. |
| 3) | Loans, advances and long-term investments are recorded at cost less valuation allowances. A valuation allowance is provided to reduce the value of the assets to their estimated realizable value or to reflect the impact of significant concessionary terms on outstanding loans. Premiums that may arise from the early repayment of loans or advances are reflected as deferred revenue and are amortized monthly to debt servicing expense over the term of the related debt issue. |
| 4) | Investments denominated in foreign currency are translated to the Canadian dollar equivalent at the exchange rate in effect at March 31, unless the rate of exchange or a forward foreign exchange contract fixing the value has been negotiated, in which case that rate or amount is used. The year end investment translation adjustments reflecting the foreign currency fluctuation between year ends are amortized monthly over the remaining life of the investment and included with debt servicing expense. Expenses and other transaction charges incurred on the purchase of investments during the year are charged to debt servicing expense. Those expenses incurred in foreign currency are translated at the exchange rate in effect on the transaction date. |
| 5) | Premiums paid on interest rate options are amortized monthly starting from the date the income is received over the period of the applicable agreement. If the option is exercised, the premium is amortized over the period from the date of receipt to the maturity date of the agreement. If the option is not exercised, any unamortized premium will be immediately taken into revenue. |
| 6) | Tangible capital assets are amortized on a straight-line basis over their estimated useful lives as follows: |
| Land | Indefinite | ||||
| Buildings — brick, mortar and steel | 40 years | ||||
| Buildings — wood frame | 25 years | ||||
| Vehicles | 5 years | ||||
| Aircraft and vessels | |||||
| - Aircraft frames | 24 years | ||||
| - Aircraft motors | 5 years | ||||
| - Vessels | 24 years | ||||
| Machinery, equipment and furniture | 10 years | ||||
| Maintenance and road construction equipment | 15 years | ||||
| Computer hardware and software | 4 to 15 years | ||||
| Leasehold improvements | Life of lease | ||||
| One-half of the annual amortization is charged in the year of acquisition and in the year of disposal. Certain assets which have historical or cultural value including works of art, historical documents as well as historical and cultural artifacts are not recognized as tangible capital assets because a reasonable estimate of the future benefits associated with such property cannot be made. |
| 7) | All intangibles and items inherited by right of the Crown, such as Crown lands, forests, water, and mineral resources are not recognized in government financial statements. A tangible capital asset received as a donation is recorded at its fair market value with the same amount being shown as a deferred contribution which is amortized to revenue on the same basis as the asset is amortized. Where the acquisition cost of a tangible capital asset is shared with other jurisdictions under a shared cost agreement, such contributions are deducted from the cost of the related asset with any amortization calculated on the net amount. |
98
Table of Contents
OPERATING FUND AND SPECIAL FUNDS — SPECIAL PURPOSE FINANCIAL STATEMENTS
| 8) | During the 2000/01 fiscal year, the Federal Government created a Health Equipment and Infrastructure Fund for investment in new medical equipment. The Province’s share of this fund was $37 million. Funding from the Health Equipment and Infrastructure Fund has been treated as deferred revenue and will be brought into revenue based on actual purchases of equipment according to a defined schedule. |
| 9) | Guarantees of the government are made through specific agreements or legislation to repay promissory notes, bank loans, lines of credit, mortgages and other securities. Provision for losses on guarantees are recorded when it is likely that a loss will occur. The amount of the loss provision represents the government’s best estimate of future payments less recoveries. |
| F. | Amounts Held in Trust for Investment or Administration |
| These amounts primarily represent sinking funds and surplus cash of government enterprises and Crown organizations on deposit with the Minister of Finance for investment. Deposits of surplus cash funds not required to be specifically invested are pooled with other available funds of the Operating Fund for investment purposes and are accorded a market rate of interest. Sinking fund contributions made by government enterprises, Crown organizations and others in respect of their direct debt are deposited with and specifically invested by the Minister of Finance. These investments are recorded at cost. |
| G. | Serial Debentures of School Divisions and Districts |
| The accumulated deficit of the Operating Fund includes amounts related to serial debentures of school divisions and districts, acquired by the government in prior years. The government is primarily responsible for funding the redemption of these debentures, accordingly these amounts are not reflected as assets. As the funding for annual redemptions flow from the appropriations of the government, to the school divisions and districts, and then back to the Province, the accumulated deficit of the operating fund is reduced by the amount of such redemptions. |
| H. | Use of Estimates |
| In the preparation of these financial statements, estimates are sometimes necessary because a precise determination of certain assets and liabilities is dependent on future events. These estimates have been based on management’s best judgements applied to available information. |
| 2. | CASH AND CASH EQUIVALENTS |
| Cash equivalents are recorded at cost. Market values approximate cost. Investment revenue earned on cash equivalents during the year was $4 million (2002 — $10 million). |
| 3. | SINKING FUNDS |
| Sinking funds are recorded at the lower of cost and market value. As at March 31, 2003, sinking funds had a cost of $5,805 million (2002 — $6,485 million) and a market value of $6,081 million (2002 — $6,881 million). Investment revenue earned on the sinking funds during the year was $253 million (2002 — $310 million). |
| Section 60 of The Financial Administration Act authorizes the Minister of Finance to provide for the creation and management of sinking funds for the orderly retirement of debt. The Minister of Finance may authorize, by directive, the amount, if any, to be allocated to the Province’s sinking fund. The Province’s sinking fund currently provides for the repurchase of foreign debt and the pre-funding of maturing debt issues. In addition, the Province’s sinking fund is invested principally in securities issued or guaranteed by Canadian provinces. |
99
Table of Contents
OPERATING FUND AND SPECIAL FUNDS — SPECIAL PURPOSE FINANCIAL STATEMENTS
| The sinking funds are allocated as follows: |
| ($ millions) | ||||||||
| 2003 | 2002 | |||||||
| Province of Manitoba | 4,827 | 4,961 | ||||||
| Manitoba Hydro-Electric Board | 976 | 1,520 | ||||||
| University of Manitoba | 2 | 4 | ||||||
| Total sinking funds | 5,805 | 6,485 | ||||||
| 4. | ADJUSTMENTS TO ACCUMULATED DEFICIT |
| A. | Tangible Capital Assets |
| In 2000/01, the capitalization of the government’s Tangible Capital Assets was expanded to include the capitalization of land. As a result, $19 million was recorded as land in the 2000/01 financial statements. Subsequently, it was determined that although the methodology or process used to determine the cost of the land was satisfactory, an error occurred in the selection of the correct costing amounts. As a result of this error, capitalized land was overstated by $6 million. Accordingly, the adjustment to the valuation of land results in a $6 million increase to the accumulated deficit. |
| B. | Net Income Stabilization Account |
| When the Net Income Stabilization Account (NISA) program was introduced in 1991, producers were only eligible to receive matching government funding, one-third of which is provided by the Province and two-thirds by the Government of Canada, if they made “matchable deposits.” On that basis, liabilities under the program were recorded in the accounts based on applicants meeting the two eligibility criteria, specifically having made a “matchable deposit” and being in a claim position (having incurred a qualifying loss). However, in 1997, the agreement was amended to incorporate “automatic” deeming, which effectively removed the requirement for the producer to make a “matching deposit”. This amendment was not brought to the attention of the government until this year and therefore the prior years’ financial statements did not reflect the additional liability incurred commencing in 1997 when the amendment was approved. The net effect is an increase in the Province’s liability at March 31, 2002 of $19 million, which is recorded as an increase to the accumulated deficit. |
| C. | Municipal Tax Sharing |
| In accordance with The Provincial-Municipal Tax Sharing Act, the Province remits to municipalities the municipal share of individual and corporation income taxes, which is initially collected through the Government of Canada and then forwarded to the Province. Amounts are advanced to municipalities based on the estimated tax collections for the calendar year. As more accurate data is received on actual tax revenues, these advances are adjusted in subsequent payments. In order to properly reflect this arrangement, entitlements related to tax collections for the first three months of the next calendar year should be accrued in the accounts of the government. This was not done previously. Furthermore, it has been determined that amounts advanced for years prior to 2002 exceeded actual entitlements. The net effect of these two items is the accrual of a net payable to municipalities and a corresponding increase to the accumulated deficit of $23 million. |
100
Table of Contents
OPERATING FUND AND SPECIAL FUNDS — SPECIAL PURPOSE FINANCIAL STATEMENTS
| 5. | GUARANTEES |
| The government has guaranteed the repayment of debt, promissory notes, bank loans, lines of credit, mortgages and other securities issued by government enterprises and Crown organizations. The outstanding guarantees are as follows: |
| ($ millions) | ||||||||
| 2003 | 2002 | |||||||
| Debt issued by government enterprises and Crown organizations | 971 | 587 | ||||||
| Promissory notes, bank loans, lines of credit and other | 17 | 16 | ||||||
| Manitoba Grow Bonds and other | 8 | 8 | ||||||
| 996 | 611 | |||||||
| Less: Sinking funds | 26 | 25 | ||||||
| Total guarantees outstanding | 970 | 586 | ||||||
| Provision for future losses on guarantees in the amount of $16 million (2002 - $14 million) has been recorded in the accounts. Debt guaranteed by the Province is guaranteed as to principal and interest until the debt is matured or redeemed. |
| 6. | FINANCIAL CAPITAL COMMITMENTS |
| The government has approved long-term financial arrangements of various entities wherein indebtedness has been issued that is not guaranteed by the government, but funding assistance is provided annually from appropriations of the Operating Fund. The government has also made future commitments against appropriations under long-term contracts that cover the rental of tangible capital assets. These financial commitments as at March 31 are as follows: |
| ($ millions) | |||||||||
| 2003 | 2002 | ||||||||
| Financial arrangements for completed projects: | |||||||||
| Hospitals and personal care homes | 640 | 615 | |||||||
| Public schools | 441 | 416 | |||||||
| Manitoba Housing and Renewal Corporation | 187 | 191 | |||||||
| Brandon University | 2 | 2 | |||||||
| 1,270 | 1,224 | ||||||||
| Future commitments: | |||||||||
| Infrastructure and capital grants | 76 | 86 | |||||||
| Rental of tangible capital assets | 107 | 103 | |||||||
| 183 | 189 | ||||||||
| 1,453 | 1,413 | ||||||||
| In addition to the approved outstanding debt for hospitals and personal care homes, lines of credit up to $68 million (2002 — $73 million) have been approved to finance capital projects for hospitals and personal care homes currently in process. On completion of these projects, the borrowings will be converted to other financing arrangements. |
101
Table of Contents
OPERATING FUND AND SPECIAL FUNDS — SPECIAL PURPOSE FINANCIAL STATEMENTS
| In December of 2001, the government entered into a funding agreement with the City of Winnipeg and the TN Arena Limited Partnership regarding the True North Entertainment Complex. The Province’s maximum commitment, after Federal Infrastructure contributions, is $14 million (2002 — $13 million). The Province has funded $3 million to March 31, 2003 (2002 — $1 million). |
| 7. | CONTINGENCIES |
| The government has been named in various legal actions, including treaty land entitlements. No provision has been made at March 31, 2003 in the accounts where the final results are uncertain. |
| A. | Disaster Financial Assistance |
| A provision has been made at March 31, 2003 for all flood claims and other disaster financial assistance. The final amount of the government’s share of these costs under shared cost agreements is uncertain at the date these financial statements were issued. |
| B. | Northern Development Projects |
| The Province is contingently liable for legal claims associated with past Manitoba Hydro-Electric Board related northern development projects. The outcome of these claims is not determinable at this time. |
| 8. | ENVIRONMENTAL ISSUES |
| There are currently no accounting standards for environmental liabilities recommended for senior governments by the CICA, other than those that apply to corporate entities related to environmental damage they have created. Because of its role, government will in all probability assume costs where those responsible cannot or will not accept liability for their actions. The Province is in the process of cataloguing suspected contaminated mine and petroleum sites. This catalogue will include a determination of the liable party, an assessment of the nature and level of contamination, the need for clean-up versus containment, and a quantification of the estimated cost for clean-up. Once standards are established by the CICA for senior governments for the recognition and disclosure of these liabilities, their application in the Manitoba setting will be reviewed to determine the appropriate accounting treatment. |
| 9. | PENSION LIABILITY |
| The government of the Province of Manitoba supports three separate pension plans. These include the Civil Service Plan (CSP), the Teachers’ Plan (TP) and the Members of the Legislative Assembly Plan (MLAP). |
| The government is required, under the amended provisions of The Balance Budget, Debt Repayment and Taxpayer Accountability Act, to set aside funds beginning in 2000/01, to address the government’s unfunded pension liability. The minimum annual contribution must be sufficient to equal the contributions made by employees and teachers hired on or after April 1, 2000. While the minimum contribution was $9 million (2002 -$6 million) for the year ended March 31, 2003, the government set aside $48 million (2002 — $75 million) in the pension assets fund (formerly trust account). These funds are separately invested and maintained in trust accounts for the government and are increased by interest earned. The pension assets fund’s balance as at March 31, 2003 was $151 million (2002 — $107 million). |
102
Table of Contents
OPERATING FUND AND SPECIAL FUNDS — SPECIAL PURPOSE FINANCIAL STATEMENTS
| The actuarial valuations were based on a number of assumptions about future events, such as interest rates, wage and salary increases, inflation rates and rates of employee turnover, disability and mortality. Information about the economic assumptions used in the most recent actuarial valuations is provided below. Demographic assumptions used in the valuations reflect the experience of the plans. |
| Real Rate | Inflation | Investment Rate | ||||||||||||||
| Plan | Latest Valuation | of Return | Rate | of Return | ||||||||||||
| Civil Service | December 31, 2001 | 4.0 | % | 2.75 | % | 6.75 | % | |||||||||
| Teachers’ | January 1, 2001 | 4.0 | % | 3.0 | % | 7.0 | % | |||||||||
| MLA | March 31, 2000 | 4.0 | % | 3.0 | % | 7.0 | % | |||||||||
| During the year, no amendments were made to any of the plans. |
| A. | Civil Service Plan |
| The Civil Service Superannuation Act (CSSA) established a defined benefit plan to provide benefits to employees of the Manitoba Civil Service and to participating agencies of the government through the Civil Service Superannuation Fund (CSSF). |
| As at March 31, 2003, the CSP had approximately 27,900 (2002 — 25,900) participants including active members, retired employees and former employees with entitlements. |
| Certain amendments to the CSSA were made in 1992 which required that the CSSF establish and fund a separate account in an amount sufficient to cover the government’s share of pension costs attributable to the 1992 amendments to the CSSA. The CSSF account maintained on behalf of the government at March 31, 2003, was $30 million (2002 — $29 million). |
| Effective December 15, 2000, the CSP was amended to include improved benefits. The cost of the plan amendments was fully funded from actuarially determined employee surpluses with no additional cost to the employer. The following describes the current terms of the CSP, with the previous terms indicated within brackets. |
| The lifetime pension calculation equals 2% of a member’s best five years average yearly pensionable earnings multiplied by pensionable service, minus 0.4% (previously 0.6%) of the average Canada Pension Plan (CPP) earnings for the same period multiplied by pensionable service since January 1, 1966. |
| The CSSA requires that employees contribute 6.0% (previously 5.1%) on pensionable earnings up to the CPP maximum earnings, and 7.0% of pensionable earnings above the maximum. 89.8% of contributions are used to fund basic benefits and 10.2% of contributions are allocated for indexing benefits. Contributions continue until the employee’s retirement or other termination from service. Employee contributions for the year ended March 31, 2003 amounted to $45 million (2002 — $39 million). |
| Indexing benefits are not guaranteed and are paid only to the extent that the indexing adjustment account in CSSF can finance one-half of cost-of-living increases granted. The maximum annual adjustment is limited by legislation to two-thirds of the increase in the consumer price index for Canada. |
| The government does not make contributions to the CSSF during employees’ service. By legislation, however, it is required to pay 50% of the pension disbursements made from the CSSF. For the year ended March 31, 2003, payments of $57 million (2002 — $53 million) were made to the CSSF. |
| An actuarial valuation report of the government’s liability to the employees included in the CSSF was completed as of December 31, 2001. The report provides a formula to update the liability on an annual basis. In accordance with the formula, the government’s liability has been calculated on an indexed basis to be $1,500 million as at March 31, 2003 (2002 — $1,414 million). |
103
Table of Contents
OPERATING FUND AND SPECIAL FUNDS — SPECIAL PURPOSE FINANCIAL STATEMENTS
| The disclosed pension liability has now been adjusted to include an amount of $18 million (2002 — $11 million) to reflect the correction of the prior year’s understatement of the liability for Regional Health Authorities. In addition, the disclosed pension liability has now also been adjusted in the amount of $13 million (2002 — $14 million) to reflect the inclusion of certain government organizations economically dependent on the Province, namely the Council on Post Secondary Education, Legal Aid and Manitoba Agricultural Credit Corporation. |
| B. | Teachers’ Plan |
| The Teachers’ Pensions Act (TPA) established a defined benefit plan to provide pension benefits to teachers who have taught in public schools in Manitoba. |
| As at March 31, 2003, the Teachers’ Retirement Allowances Fund (TRAF) had approximately 29,500 (2002 — 29,000) participants including active members, retired teachers and former teachers with entitlements. |
| The lifetime pension calculation is based upon the lesser of A or B: |
| A) | The years of service prior to July 1, 1980, multiplied by 2% and the average salary of the best 7 of the final 12 years of service and years of service after July 1, 1980, multiplied by 2% and the average salary of the best 5 of the final 12 years of service; |
| less |
| The years of service from January 1, 1966, to July 1, 1980, multiplied by .6% and the average annual salary up to the yearly maximum pensionable earnings for the same period and years of service after July 1, 1980, multiplied by .6% and the annual salary up to the yearly maximum pensionable earnings for the same period. |
| B) | 70% of the weighted average annual salary of the member in the 7 and 5 year periods used above. |
| The TPA requires that teachers contribute 5.7% on pensionable earnings up to the CPP maximum earnings, and 7.3% on pensionable earnings above the maximum. 83.6% of contributions are used to fund basic benefits and 16.4% of contributions are allocated for indexing benefits. Contributions continue until the teacher’s retirement or other termination from service. Teacher contributions for the year ended March 31, 2003, amounted to $53 million (2002 - - $47 million). |
| Indexing benefits are not guaranteed and are paid only to the extent that one half of the pension adjustment does not result in an unfunded pension liability in TRAF. |
| The government does not make contributions to TRAF during teachers’ service. By legislation, however, it is required to pay 50% of the pension disbursements and other disbursements made by TRAF as provided for in the TPA. For the year ended March 31, 2003, payments of $91 million (2002 — $84 million) were made to TRAF. |
| An actuarial report was completed for TRAF as of January 1, 2001, which determined the government’s pension liability on an indexed basis. The report provides a formula to update the liability on an annual basis. In accordance with the formula, the government’s liability has been calculated on an indexed basis to be $1,878 million at March 31, 2003 (2002 — $1,780 million). |
| C. | Members of the Legislative Assembly Plan |
| The pension plan for Members of the Legislative Assembly (MLAs) is established and governed by The Legislative Assembly Act (LAA). For MLAs elected prior to the dissolution of the Assembly of the 35th Legislature, the LAA provides for defined pension benefits based on years of service to April, 1995. For those elected after the 35th Legislature in April 1995, the LAA provides for matching contributions. As at March 31, 2003, there are 119 (2002 — 119) plan members who are entitled to receive future pension benefits in accordance with the LAA. |
104
Table of Contents
OPERATING FUND AND SPECIAL FUNDS — SPECIAL PURPOSE FINANCIAL STATEMENTS
| The calculation for defined pension benefits is equal to 3% of the average annual indemnities for the last five years served as a member or all the years served if less than five multiplied by the number of years of pensionable service up to April 1995. These entitlements are fully indexed to cost of living increases. |
| An actuarial valuation report of the government’s liability to the MLAs included in the pension plan was completed as of March 31, 2000. The report provides a formula to update the liability on an annual basis. In accordance with the formula, the government’s actuarial liability has been calculated on an indexed basis to be $29 million as at March 31, 2003 (2002- $28 million). |
| Under the matching contributions provisions, MLAs may contribute up to 7% of their remuneration toward a Registered Retirement Savings Plan (RRSP) of their choice. The government matches the member’s contributions on a current basis, consequently, there is no liability for past service benefits under this component of the plan. In the event that a member withdraws money from the RRSP while an active member of the Legislative Assembly, the government’s contribution would be refundable. |
| 10. | EMPLOYEE FUTURE BENEFITS LIABILITY- HEALTH CARE FACILITIES AND FAMILY SERVICES AGENCIES |
| Various funded organizations, primarily health care facilities and child and family service agencies have recorded liabilities for employee future benefits in their financial statements totalling $209 million (2002 — $182 million). |
| 11. | EXPENSES IN EXCESS OF LEGISLATIVE AUTHORITY |
| The following voted appropriations were over expended as a result of adjustments after March 31, 2003. |
| ($ millions) | |||||
| Finance | |||||
| Taxation | 5 | ||||
| Education and Youth | |||||
| Support to Schools | 2 | ||||
| Aboriginal and Northern Affairs | |||||
| Aboriginal and Northern Affairs Operation | 3 | ||||
| Other Appropriations | |||||
| Allowance for Losses and Expenditures Incurred by Crown Corporations and Other Provincial Entities | 6 | ||||
| 12. | TRANSFER FOR DEBT RETIREMENT AND PENSION OBLIGATIONS |
| The government transferred $96 million to the Debt Retirement Fund from the Operating Fund for the specific purpose of reducing general purpose debt and pension obligations with the Civil Service Superannuation Fund and the Teachers’ Retirement Allowances Fund. The transfer was made in accordance with subsection 8 (4) of The Balanced Budget, Debt Repayment and Taxpayer Accountability Act. The government transferred $48 million from the Debt Retirement Fund for the specific purpose of reducing pension obligations with the Civil Service Superannuation Fund and the Teachers’ Retirement Allowances Fund. This transfer was made in accordance with subsection 8 (6) of The Balanced Budget, Debt Repayment and Taxpayer Accountability Act. The balance in the pension assets fund (formerly trust account) as at March 31, 2003 was $151 million (2002 — $107 million). |
105
Table of Contents
OPERATING FUND AND SPECIAL FUNDS — SPECIAL PURPOSE FINANCIAL STATEMENTS
| 13. | BALANCED BUDGET LEGISLATION |
| Section 6 of The Balanced Budget, Debt Repayment and Taxpayer Accountability Act requires the Minister of Finance to report on compliance with the Act in the audited financial statements of the Operating Fund for each fiscal year. The Statement of Revenue and Expense shows a positive balance of $4 million in the Operating Fund. The government is therefore in compliance with the Act. |
| 14. | WATER POWER RENTALS |
| Water power rental revenue from the Manitoba Hydro-Electric Board (Hydro), in the amount of $97 million (2002 -$109 million), is included in the Special Purpose Statement of Revenue and Expense under the Manitoba Collections category. These rentals are paid for the use of water resources in the operation of Hydro’s hydroelectric generating stations. Water rental rates during the year were $3.34 per megawatt hour (MW.h) (2002 — $3.34 per MW.h). |
| 15. | GUARANTEE FEES |
| Hydro remits guarantee fees to the government based on the Hydro debt that the Province guarantees on their behalf. The guarantee fees paid by Hydro for the year ended March 31, 2003 were $74 million (2002 — $72 million). |
| 16. | REVENUE FROM WORKERS’ COMPENSATION BOARD |
| Under The Workplace Safety and Health Act of Manitoba, The Workers’ Compensation Board supports the administrative expenses incurred by the Department of Labour and Immigration for The Workplace Safety and Health program and the Worker Advisor Office. The amount for the year ended March 31, 2003 was $6 million (2002 — $6 million). |
| 17. | DISTRIBUTION FROM MANITOBA HYDRO-ELECTRIC BOARD |
| The Manitoba Hydro Amendment Act was proclaimed on August 9, 2002. This amendment requires the Manitoba Hydro-Electric Board to distribute up to $288 million of its retained earnings to the government by the end of its 2003/04 fiscal year. Operating revenue includes $203 million received from Hydro in the 2002/03 fiscal year. |
| 18. | ADJUSTMENT TO ESTIMATE FOR FEDERAL ACCOUNTING ERROR |
| The 2001/02 fiscal year included the effects of the federal accounting error. Amounts totalling $287 million were identified as relating to prior years and recorded as an adjustment to the accumulated deficit. Included in that amount was the net impact of the federal settlement related to 1997 to 1999, which was a $91 million payable owing to the Federal Government over a ten-year period commencing in 2004/05. Also recorded at March 31, 2002 was a $112 million payable for the estimated 2001 tax year error. In 2002/03, the Federal Government finalized the amount for the 2001 tax year error at $61 million, resulting in a gain on settlement of $51 million. In 2002/03, the Federal Government also provided a transition payment of $140 million related to Equalization. |
| 19. | CREATION OF THE PENSION ASSETS FUND |
| During the year, this Fund was established as described in note 1B. The Fund opening balance of $107 million has been reflected in the accounts as at April 1, 2002, resulting in a corresponding decrease to the accumulated deficit. |
106
Table of Contents
OPERATING FUND AND SPECIAL FUNDS — SPECIAL PURPOSE FINANCIAL STATEMENTS
| 20. | THE PROVINCIAL-MUNICIPAL TAX SHARING ACT |
| The municipal share of individual and corporation income taxes, which is collected through the Government of Canada and remitted by the Province of Manitoba to municipalities in accordance with The Provincial-Municipal Tax Sharing Act, is not recorded as revenue or expense. This amounted to $78 million for the year ended March 31, 2003 (2002 — $82 million). |
| 21. | COMPARATIVE FIGURES |
| Certain of the 2002 financial statement figures have been reclassified to be consistent with the 2003 presentation. |
107
Table of Contents
OPERATING FUND AND SPECIAL FUNDS — SPECIAL PURPOSE FINANCIAL STATEMENTS
SCHEDULE 1
AMOUNTS RECEIVABLE
As at March 31, 2003
| ($ millions) | |||||||||
| 2003 | 2002 | ||||||||
| Taxation Revenue: | |||||||||
| Corporation Capital Tax | 2 | 2 | |||||||
| Corporation Income Tax | 48 | 41 | |||||||
| Gasoline Tax | 14 | 14 | |||||||
| Health and Education Levy | 23 | 24 | |||||||
| Individual Income Tax | 107 | 105 | |||||||
| Insurance Corporation Tax | 12 | 11 | |||||||
| Motive Fuel Tax | 7 | 7 | |||||||
| Retail Sales Tax | 104 | 97 | |||||||
| Revenue Act, 1964, Part 1 | 8 | 7 | |||||||
| Tobacco Tax | 15 | 11 | |||||||
| 340 | 319 | ||||||||
| Government of Canada and Other Governments: | |||||||||
| Shared Cost Programs/Agreements | 123 | 150 | |||||||
| Canada Health and Social Transfer | 17 | 3 | |||||||
| Equalization | — | 138 | |||||||
| Municipal corporations | 3 | — | |||||||
| 143 | 291 | ||||||||
| Interest Income: | |||||||||
| Province of Manitoba Sinking Fund | 59 | 73 | |||||||
| Other Investments | 9 | 8 | |||||||
| 68 | 81 | ||||||||
| Other: | |||||||||
| Liquor Control Commission | 12 | 18 | |||||||
| Manitoba Hydro-Electric Board | 12 | 11 | |||||||
| Manitoba Lotteries Corporation | 4 | 3 | |||||||
| Morris Macdonald School Division | 1 | 2 | |||||||
| Regional Health Authorities | 8 | 10 | |||||||
| Social Allowance | 14 | 14 | |||||||
| Special Operating Agencies | 6 | — | |||||||
| Sundry Departmental Revenue | 47 | 47 | |||||||
| Sundry | 1 | 3 | |||||||
| 105 | 108 | ||||||||
| 656 | 799 | ||||||||
| Less: Valuation Allowance | 93 | 87 | |||||||
| 563 | 712 | ||||||||
108
Table of Contents
OPERATING FUND AND SPECIAL FUNDS — SPECIAL PURPOSE FINANCIAL STATEMENTS
SCHEDULE 2
LOANS AND ADVANCES
As at March 31, 2003
| ($ millions) | |||||||||||||||||
| Crown Organizations, | |||||||||||||||||
| and Government | 2003 | 2002 | |||||||||||||||
| Enterprises | Other | Total | Total | ||||||||||||||
| Due 1 Year or Less | 636 | 28 | 664 | 782 | |||||||||||||
| Due Over 1 Year | 6,754 | 23 | 6,777 | 7,529 | |||||||||||||
| Total | 7,390 | 51 | 7,441 | 8,311 | |||||||||||||
| Less: Sinking Funds | 978 | — | 978 | 1,525 | |||||||||||||
| 6,412 | 51 | 6,463 | 6,786 | ||||||||||||||
| Less: Valuation Allowance | 93 | 12 | 105 | 137 | |||||||||||||
| 6,319 | 39 | 6,358 | 6,649 | ||||||||||||||
| Less: Debt incurred for and repayable by the | |||||||||||||||||
| Manitoba Hydro-Electric Board and Manitoba Lotteries Corporation | 5,573 | — | 5,573 | 5,871 | |||||||||||||
| Net | 746 | 39 | 785 | 778 | |||||||||||||
Note: The loans and advances portfolio is due in varying annual amounts to the year 2042, bearing interest rates from nil to 13.375%.
SCHEDULE 3
LONG-TERM INVESTMENTS
As at March 31, 2003
| ($ millions) | |||||||||||||||||
| Crown | 2003 | 2002 | |||||||||||||||
| Corporations | Other | Total | Total | ||||||||||||||
| Shares: | |||||||||||||||||
| Common | 9 | 5 | 14 | 14 | |||||||||||||
| Preferred | 2 | — | 2 | 2 | |||||||||||||
| Special | — | 2 | 2 | 2 | |||||||||||||
| Debentures | 1 | — | 1 | 1 | |||||||||||||
| Profit Sharing Agreement | — | 11 | 11 | 11 | |||||||||||||
| 12 | 18 | 30 | 30 | ||||||||||||||
| Less: Valuation Allowance | 12 | 18 | 30 | 25 | |||||||||||||
| Net | — | — | — | 5 | |||||||||||||
109
Table of Contents
OPERATING FUND AND SPECIAL FUNDS — SPECIAL PURPOSE FINANCIAL STATEMENTS
SCHEDULE 4
AMOUNTS HELD IN TRUST
FOR INVESTMENT OR ADMINISTRATION
AND TRUST ASSETS
As at March 31, 2003
| ($ millions) | |||||||||
| 2003 | 2002 | ||||||||
AMOUNTS HELD IN TRUST | |||||||||
| Government Enterprises | 1,335 | 1,222 | |||||||
| Crown Organizations | 623 | 594 | |||||||
| Fiduciary and Other Government Related Trusts | 105 | 139 | |||||||
| Pension Assets | — | 107 | |||||||
| 2,063 | 2,062 | ||||||||
TRUST ASSETS | |||||||||
| Cash and Cash Equivalents | 851 | 838 | |||||||
| Sinking Funds | 28 | 27 | |||||||
| Funds on Deposit for Investment and Administration | 1,184 | 1,090 | |||||||
| Pension Assets | — | 107 | |||||||
| 2,063 | 2,062 | ||||||||
| Note: | The Department of Finance also provides a safekeeping service for various departments, agencies, boards and commissions. In this capacity, it holds custodial trust funds total $138 million (2002 — $135 million) in the form of bonds and other securities not reflected in the above numbers. |
110
Table of Contents
OPERATING FUND AND SPECIAL FUNDS — SPECIAL PURPOSE FINANCIAL STATEMENTS
SCHEDULE 5
TANGIBLE CAPITAL ASSETS
For the Year Ended March 31, 2003
($ millions)
| Buildings- | Road | ||||||||||||||||||||||||||||||||||||||||||||||||
| Brick | Build- | Mach. | Construction | Computer | Lease- | ||||||||||||||||||||||||||||||||||||||||||||
| Mortar | ings- | Aircraft | Equip’t | and | Hardware | Assets | hold | ||||||||||||||||||||||||||||||||||||||||||
| and | Wood | and | and | Maintenance | and | Under | Improve- | Totals | |||||||||||||||||||||||||||||||||||||||||
| Land | Steel | Frame | Vehicles | Vessels | Furn. | Equipment | Software | Construction | ments | 2003 | 2002 | ||||||||||||||||||||||||||||||||||||||
| Opening costs | 19 | 276 | 28 | 2 | 45 | 16 | 54 | 212 | 44 | 2 | 698 | 654 | |||||||||||||||||||||||||||||||||||||
| Add: | |||||||||||||||||||||||||||||||||||||||||||||||||
| Additions during the year | — | — | — | — | — | — | 4 | 3 | 38 | — | 45 | 41 | |||||||||||||||||||||||||||||||||||||
| Assets acquired in prior years (*) | — | — | — | — | — | — | — | — | — | — | — | 5 | |||||||||||||||||||||||||||||||||||||
| Less: | |||||||||||||||||||||||||||||||||||||||||||||||||
| Disposals during the year | — | — | — | — | — | — | — | — | — | — | — | (2 | ) | ||||||||||||||||||||||||||||||||||||
| Settlements of Assets under construction | — | 17 | — | — | 2 | — | — | 22 | (42 | ) | 1 | — | — | ||||||||||||||||||||||||||||||||||||
| Land capitalization adjustment (Note 4a) | (6 | ) | — | — | — | — | — | — | — | — | — | (6 | ) | — | |||||||||||||||||||||||||||||||||||
| Closing costs | 13 | 293 | 28 | 2 | 47 | 16 | 58 | 237 | 40 | 3 | 737 | 698 | |||||||||||||||||||||||||||||||||||||
| Accumulated Amortization | |||||||||||||||||||||||||||||||||||||||||||||||||
| Opening accum’d amortization | — | 144 | 24 | 2 | 25 | 10 | 36 | 66 | — | — | 307 | 274 | |||||||||||||||||||||||||||||||||||||
| Add: | |||||||||||||||||||||||||||||||||||||||||||||||||
| Amortization | — | 7 | — | — | 2 | — | 2 | 20 | — | — | 31 | 34 | |||||||||||||||||||||||||||||||||||||
| Assets acquired in prior years (*) | — | — | — | — | — | — | — | — | — | — | — | 1 | |||||||||||||||||||||||||||||||||||||
| Less: | |||||||||||||||||||||||||||||||||||||||||||||||||
| Disposals | — | — | — | — | — | — | — | — | — | — | — | (2 | ) | ||||||||||||||||||||||||||||||||||||
| Closing accum’d amortization | — | 151 | 24 | 2 | 27 | 10 | 38 | 86 | — | — | 338 | 307 | |||||||||||||||||||||||||||||||||||||
| Net Book Value of Tangible Capital Assets | 13 | 142 | 4 | — | 20 | 6 | 20 | 151 | 40 | 3 | 399 | 391 | |||||||||||||||||||||||||||||||||||||
| * | During the year no assets acquired in prior fiscal years were identified and recorded. (2002 — $4 million net book value) |
| ** | During the year the Province capitalized $0.9 million of interest relating to assets under construction. |
111
Table of Contents
OPERATING FUND AND SPECIAL FUNDS — SPECIAL PURPOSE FINANCIAL STATEMENTS
SCHEDULE 6
SCHEDULE OF BORROWINGS
As at March 31, 2003
($ millions)
| Fiscal | Canada | Promissory Notes | ||||||||||||||||||||||
| Year | Pension | and | ||||||||||||||||||||||
| of | Bonds and Debentures | Plan | Treasury Bills | Totals | ||||||||||||||||||||
| Maturity | Cdn | US | Cdn | Cdn | 2003 | 2002 | ||||||||||||||||||
| 2003 | — | — | — | — | — | 3,471 | ||||||||||||||||||
| 2004 | 1,726 | 529 | 126 | 500 | 2,881 | 2,432 | ||||||||||||||||||
| 2005 | 1,088 | 71 | 119 | — | 1,278 | 1,286 | ||||||||||||||||||
| 2006 | 1,321 | 297 | 126 | — | 1,744 | 1,118 | ||||||||||||||||||
| 2007 | 1,061 | 735 | 150 | — | 1,946 | 1,648 | ||||||||||||||||||
| 2008 | 1,128 | — | 90 | — | 1,218 | 561 | ||||||||||||||||||
| 2003-2008 | 6,324 | 1,632 | 611 | 500 | 9,067 | 10,516 | ||||||||||||||||||
| 2009-2013 | 3,044 | 1,014 | 502 | — | 4,560 | 4,466 | ||||||||||||||||||
| 2014-2023 | 2,249 | 1,599 | 15 | — | 3,863 | 3,751 | ||||||||||||||||||
| 2024-2042 | 1,916 | — | — | — | 1,916 | 1,586 | ||||||||||||||||||
| 2009-2042 | 7,209 | 2,613 | 517 | — | 10,339 | 9,803 | ||||||||||||||||||
| Total Borrowings | 13,533 | 4,245 | 1,128 | 500 | 19,406 | 20,319 | ||||||||||||||||||
| Reduced by: | ||||||||||||||||||||||||
| Unamortized Debt Issue Costs | 19 | 6 | — | — | 25 | 31 | ||||||||||||||||||
| Debt of the Province of Manitoba | ||||||||||||||||||||||||
| held as Provincial Investments | 41 | — | — | — | 41 | 34 | ||||||||||||||||||
| 13,473 | 4,239 | 1,128 | 500 | 19,340 | 20,254 | |||||||||||||||||||
| March 31/03 | March 31/02 | ||||||||
| Cdn $ Valuation | Cdn $ Valuation | ||||||||
| (See Note) | (See Note) | ||||||||
| Borrowings payable in: | |||||||||
| Canadian dollars | 11,813 | 11,808 | |||||||
| Foreign issues hedged to Canadian dollars | 3,349 | 3,222 | |||||||
| U.S. dollars | 3,305 | 3,734 | |||||||
| Foreign issues hedged to U.S. dollars | 939 | 1,555 | |||||||
| Total borrowings | 19,406 | 20,319 | |||||||
| Note 1: | The hedges are derivative contracts which include swaps and forward foreign exchange contracts. |
| Note 2: | The Canadian dollar valuation is calculated using the foreign currency exchange rates in effect at each March 31 adjusted for any forward foreign exchange contracts entered into for settlement after year-end. |
| Note 3: | Interest rates on these borrowings fall into one of three categories: |
| i) | Fixed with rates ranging from 2.5% to 14.06%. |
| ii) | Floating Canadian — Bankers Acceptance (BA) setting, established quarterly or monthly, with the lowest rate currently set at 2.86% and the highest set at 3.15% as at March 31, 2003. |
| iii) | Floating U.S. — U.S. Dollar LIBOR (London Interbank Offering Rate) setting, established quarterly, with the lowest rate currently set at 1.35% and the highest set at 2.22% as at March 31, 2003. |
112
Table of Contents
OPERATING FUND AND SPECIAL FUNDS — SPECIAL PURPOSE FINANCIAL STATEMENTS
SCHEDULE 7
ACCOUNTS PAYABLE, ACCRUED CHARGES,
PROVISIONS AND DEFERRALS
As at March 31, 2003
| ($ millions) | ||||||||||
| 2003 | 2002 | |||||||||
| Accounts Payable | 411 | 534 | ||||||||
| Accrued Charges: | ||||||||||
| Interest Accrued on Provincial Borrowings and Trust Funds | 239 | 265 | ||||||||
| Other Accrued Liabilities: | ||||||||||
| Canadian Farm Income Program | 30 | 39 | ||||||||
| Communities Economic Development Fund | 1 | 1 | ||||||||
| Community Access Program | 2 | 3 | ||||||||
| Compensation for Victims of Crime | 18 | 19 | ||||||||
| Crown Organizations — Vacation Liability | 13 | 12 | ||||||||
| Disaster Assistance | 2 | 9 | ||||||||
| Economic Development Partnership Agreement | — | 1 | ||||||||
| Fairford First Nation | 6 | 4 | ||||||||
| Flood Claims | 43 | 40 | ||||||||
| Hepatitis C Assistance | 8 | 9 | ||||||||
| Infrastructure Works Program | 1 | 3 | ||||||||
| Land Acquisition Claims | 2 | 2 | ||||||||
| Manfor Ltd. Divestiture | 3 | 2 | ||||||||
| Net Income Stabilization Account Program (NISA) | 23 | 3 | ||||||||
| Ruttan Mines Clean-up | 5 | 5 | ||||||||
| Salaries and Benefits | 80 | 79 | ||||||||
| Salaries and Benefits — Severance | 118 | 115 | ||||||||
| Tripartite Land Assembly Program | 3 | 3 | ||||||||
| VLT Grants Payable | — | 1 | ||||||||
| Other | 4 | 4 | ||||||||
| Provision for Future Losses on Guarantees | 16 | 14 | ||||||||
| Deferrals | 77 | 100 | ||||||||
| 1,105 | 1,267 | |||||||||
113
Table of Contents
OPERATING FUND AND SPECIAL FUNDS — SPECIAL PURPOSE FINANCIAL STATEMENTS
SCHEDULE 8
OPERATING REVENUE AND EXPENSE
For the Year Ended March 31, 2003
| ($ millions) | |||||||||||||
| 2003 | 2002 | ||||||||||||
| Budget | |||||||||||||
| Estimate | Actual | Actual | |||||||||||
OPERATING REVENUE | |||||||||||||
| Manitoba Collections: | |||||||||||||
| Retail Sales Tax | 1,033 | 1,007 | 966 | ||||||||||
| Fuel Taxes | 225 | 231 | 223 | ||||||||||
| Levy for Health and Education | 243 | 257 | 244 | ||||||||||
| Mining Tax | 17 | 18 | 9 | ||||||||||
| Other Taxes | 434 | 461 | 401 | ||||||||||
| Fees and Other Revenue | 292 | 323 | 308 | ||||||||||
| Income Taxes: | |||||||||||||
| Corporation Income Tax | 147 | 160 | 306 | ||||||||||
| Individual Income Tax | 1,682 | 1,636 | 1,659 | ||||||||||
| Federal Transfers: | |||||||||||||
| Equalization | 1,481 | 1,338 | 1,399 | ||||||||||
| Canada Health and Social Transfer | 729 | 756 | 685 | ||||||||||
| Medical Equipment Fund | 19 | 16 | 3 | ||||||||||
| Primary Health Care Transition Fund | 5 | 1 | — | ||||||||||
| Shared Cost and Other | 128 | 119 | 119 | ||||||||||
| Crown Corporations | 506 | 647 | 424 | ||||||||||
TOTAL OPERATING REVENUE | 6,941 | 6,970 | 6,746 | ||||||||||
OPERATING EXPENSES | |||||||||||||
| Health | 2,787 | 2,830 | 2,667 | ||||||||||
| Education | 1,519 | 1,513 | 1,468 | ||||||||||
| Family Services and Housing | 839 | 836 | 811 | ||||||||||
| Community, Economic and Resource Development | 900 | 871 | 821 | ||||||||||
| Justice and Other Government | 580 | 573 | 556 | ||||||||||
| Debt Servicing | 368 | 321 | 414 | ||||||||||
| 6,993 | 6,944 | 6,737 | |||||||||||
| Less: Budgeted Underexpenditure | 65 | — | — | ||||||||||
TOTAL OPERATING EXPENSES (Schedule 10) | 6,928 | 6,944 | 6,737 | ||||||||||
114
Table of Contents
OPERATING FUND AND SPECIAL FUNDS — SPECIAL PURPOSE FINANCIAL STATEMENTS
SCHEDULE 9
CHANGES IN OTHER SPECIAL FUNDS
For the Year Ended March 31, 2003
| ($ millions) | ||||||||||||||||||||
| Quarry | ||||||||||||||||||||
| Mining | Rehabilitation | |||||||||||||||||||
| Community | Reserve | Other | Total | Total | ||||||||||||||||
| Reserve | Fund | Funds | 2003 | 2002 | ||||||||||||||||
| Surplus, Beginning of Year | 18 | 5 | 3 | 26 | 27 | |||||||||||||||
| Revenue | 1 | 2 | 2 | 5 | 3 | |||||||||||||||
| Expenses | 1 | 1 | 2 | 4 | 2 | |||||||||||||||
| Net Revenue over Expenses | — | 1 | — | 1 | 1 | |||||||||||||||
| Transfers | 3 | — | — | 3 | 2 | |||||||||||||||
| Net Result for the Year | (3 | ) | 1 | — | (2 | ) | (1 | ) | ||||||||||||
| Surplus, End of Year | 15 | 6 | 3 | 24 | 26 | |||||||||||||||
115
Table of Contents
OPERATING FUND AND SPECIAL FUNDS — SPECIAL PURPOSE FINANCIAL STATEMENTS
SCHEDULE 10
EXPENSE BY TYPE
For the Year Ended March 31, 2003
| ($ millions) | ||||||||
| 2003 | 2002 | |||||||
| Personnel Services | 732 | 719 | ||||||
| Grants/Transfer Payments | 4,743 | 4,488 | ||||||
| Transportation | 49 | 48 | ||||||
| Communications | 21 | 31 | ||||||
| Supplies and Services | 336 | 311 | ||||||
| Social Assistance Related | 557 | 541 | ||||||
| Other Operating | 106 | 108 | ||||||
| Debt Servicing — General | 321 | 414 | ||||||
| — Departments | 26 | 13 | ||||||
| Minor Capital | 22 | 30 | ||||||
| Amortization of Tangible Capital Assets | 31 | 34 | ||||||
| 6,944 | 6,737 | |||||||
Note: Debt servicing costs shown above are net of cost recoveries and interest income of $968 million as at March 31, 2003 (2002 — $1,248 million), which includes $582 million as at March 31, 2003 (2002 — $789 million) from government enterprises.
SCHEDULE 11
NET DEBT
For the Year Ended March 31, 2003
| ($ millions) | ||||||||
| 2003 | 2002 | |||||||
| Accumulated deficit, end of year | 6,475 | 6,617 | ||||||
| Deferred charge for health care facilities | 446 | 392 | ||||||
| Tangible capital assets | 399 | 391 | ||||||
NET DEBT | 7,320 | 7,400 | ||||||
Note: Net debt is the excess of liabilities over financial assets. Neither tangible capital assets nor the deferred charge for health care facilities are considered to be financial assets since they cannot be immediately converted into cash to pay down liabilities. Net debt represents how much the government would have to borrow in total, after liquidating its financial assets, in order to pay all of its liabilities.
116