
Budget Paper B
FINANCIAL REVIEW AND STATISTICS
FINANCIAL REVIEW AND STATISTICS
Contents
| | | | | |
| | | 2 | |
| | | | | |
| | | 3 | |
| | | | | |
| | | | |
| | | | | |
| | | 5 | |
| | | | | |
| | | 5 | |
| | | | | |
| | | 6 | |
| | | | | |
| | | 7 | |
| | | | | |
| | | 8 | |
| | | | | |
| | | 8 | |
| | | | | |
| | | 8 | |
| | | | | |
| | | 9 | |
| | | | | |
| | | 9 | |
| | | | | |
| | | 9 | |
| | | | | |
| | | 10 | |
| | | | | |
| | | | |
| | | | | |
| | | 11 | |
| | | | | |
| | | 12 | |
| | | | | |
| | | 13 | |
| | | | | |
| | | 14 | |
| | | | | |
| | | 15 | |
| | | | | |
| | | 16 | |
| | | | | |
| | | 16 | |
| | | | | |
| | | 17 | |
| | | | | |
| | | 18 | |
| | | | | |
| | | 18 | |
| | | | | |
| | | 19 | |
| | | | | |
| | | 20 | |
| | | | | |
| | | 20 | |
| | | | | |
| | | 21 | |
| | | | | |
| | | 22 | |
| | | | | |
| | | 23 | |
| | | | | |
| | | 24 | |
| | | | | |
| | | 26 | |
| | | | | |
| | | 27 | |
| | | | | |
| | | 28 | |
| | | | | |
| | | 29 | |
| | | | | |
Section 3 | | | | |
| | | | | |
| | | 30 | |
| | | | | |
| | | 34 | |
| | | | | |
Section 4 | | | | |
| | | | | |
| | | 36 | |
| | | | | |
| | | 36 | |
| | | | | |
| | | 37 | |
| | | | | |
| | | 37 | |
| | | | | |
| | | 37 | |
B 2 / F i n a n c i a l R e v i e w a n d S t a t i s t i c s B U D G E T 2 0 0 5
n Introduction
In previous Budgets, the government has presented the projected transactions of the Operating Fund, that is, government departments and a limited number of Crown entities, as the primary measurement of the financial planning and management for the year to come, to demonstrate compliance with The Balanced Budget, Debt Repayment and Taxpayer Accountability Act, and to highlight the expenditures that require legislative approval.
The evolution of accounting standards in Canada has focused reporting on a broader definition of government. The Summary Budget consolidates the Operating Fund with the operations of all Crown enterprises and other organizations in the wider government entity, and includes changes in pension liabilities. The Manitoba government is committed to working with the Office of the Auditor General (OAG) on a plan that would see the budget and other financial reports presented on a summary basis for 2007/08. A steering group consisting of government officials and the OAG has identified several issues that need to be addressed in making the transition to summary budgets. Among the key challenges are:
| • | ensuring that the organizations in the wider government entity use Generally Accepted Accounting Principles (GAAP) for the preparation of their financial reports |
| |
| • | respecting the funding and governance relationships that have been established for organizations in the wider government entity, including universities and hospitals, as the government moves toward presenting its budgets on a summary basis |
| |
| • | developing an appropriate test that imposes the same level of fiscal responsibility and discipline as the present balanced budget legislation (BBL) |
Manitoba will review the experience of other jurisdictions that have implemented summary budgeting. The government will consult with Manitobans and the Auditor General to ensure that these challenges are met in a clear and appropriate manner.
B U D G E T 2 0 0 5 F i n a n c i a l R e v i e w a n d S t a t i s t i c s / B 3
The Summary Budget and the Operating Fund
The Summary Budget projects the financial results of the entire provincial government entity. It encompasses not only the core operations and activities of government, but also those of Crown enterprises like Manitoba Hydro and Manitoba Public Insurance, and other entities like the University of Manitoba.
The Government is directly accountable for the overall result of its operations and, ultimately, those of its various agencies and enterprises. Under the governance model currently in place for Crown entities, the purposes and, generally, the mandates of these agencies and enterprises are set by legislation and they are directed by boards. These purposes and mandates can be commercial, regulatory or insurance-oriented. It is extremely difficult or impossible for government to respond immediately to financial setbacks resulting from, for example, the effect of severe weather conditions on Manitoba Hydro or the Manitoba Crop Insurance Corporation. In some cases, revenue-related adjustments such as auto-insurance premium and hydro-electricity rate increases are subject to review by the Public Utilities Board. Even though the government maintains a balance between revenue and expenditure for its departmental and other core operations, should a Crown organization or enterprise realize abnormal adverse results, it could negatively affect the Summary Budget balance and perhaps create a summary deficit.
Current BBL addresses itself to the Operating Fund, which is under the direct control of the government through the budget process. Unfavourable results in revenue generation can be offset by expenditure reductions, revenue adjustments, interfund transfers and/or other temporary measures.
As the Manitoba government moves toward making the Summary Budget the principal basis of fiscal planning and reporting, it must develop a balanced budget test that credibly and appropriately reflects the goals of maintaining a balance of financial responsibility and discipline to protect essential services along with stable and competitive tax rates.
At present, the government is required by legislation to present a budget and report financial results for the Operating Fund. The 2005 Budget provides a forecast of the financial results of the entire government entity.
B 4 / F i n a n c i a l R e v i e w a n d S t a t i s t i c s B U D G E T 2 0 0 5
This Budget Paper is divided into four sections.
Section 1
This section provides Summary Budget statements that incorporate results and plans for the entire government entity, including changes in pension liabilities. It updates the 2004/05 results and provides an outlook of operating results for the years 2005/06 through 2008/09.
Section 2
This section provides information specifically required by the legislature. This includes estimates of operating expenditure, operating revenue and balances under BBL, as well as capital investment and loan authority. These budget plans provide information on the core functions of the government under rules set out in that legislation.
Section 3
This section provides additional financial information. The ten-year summary of financial results includes ratios with respect to Gross Domestic Product and per capita information. Inter-provincial comparisons are provided with respect to debt, health expenditure, total program expenditure and total expenditure.
Section 4
This section provides a summary of progress made by this government in its budgeting and reporting, in order to provide greater transparency and to meet the standards of reporting advanced by the Public Sector Accounting Board (PSAB).
| | | |
Note: | | The forecast results for 2004/05 presented in this budget paper are based on the province’s Third Quarter Financial Report. |
Interested parties are encouraged to access all the reports of the Government of Manitoba which are provided for the information of the legislature and the public. Links may be found on the Internet at http://www.gov.mb.ca/finance.
B U D G E T 2 0 0 5 F i n a n c i a l R e v i e w a n d S t a t i s t i c s / B 5
SECTION 1
| n Report on Consolidated Operations and Summary Budget Projection |
The Summary Budget reflects the financial activities of the government reporting entity. It includes the balance under BBL, the changes in the balances of Special Funds, net contributions of government enterprises and Crown organizations, and changes in pension liabilities.
The balance under BBL is comprised of the Operating Fund result as well as the transfers to or from the Debt Retirement Fund and the Fiscal Stabilization Fund. Positive balances must be transferred to the Fiscal Stabilization Fund.
For the purposes of calculating the Summary Budget Projection, the following adjustments must be made to determine Consolidated Net Income (Loss):
| • | total changes in special funds |
| |
| • | net results of government enterprises and Crown organizations |
| |
| • | consolidation adjustments |
| |
| • | pension items |
These adjustments are explained in the pages following the Medium-Term Summary Budget Projection table.
2004/05 Forecast Result
2004/05 Operating Fund forecast results indicate a large positive balance under BBL due mainly to increased federal transfer payments coming from the September 2004 First Ministers’ health care funding agreement, and a large increase in Equalization payments, substantial portions of which are non-recurring. The balance under BBL will be transferred to the Fiscal Stabilization Fund, and accounts for the largest portion of the increase in Consolidated Net Income.
In addition, Manitoba’s government enterprises and other Crown organizations, led by Manitoba Hydro, are forecast to generate net profits of $634 million. This is $172 million more than the amount budgeted and, once consolidation adjustments are factored in, their net contribution to Consolidated Net Income are forecast to be $134 million.
The Consolidated Net Income for 2004/05 is forecast at $417 million, an improvement of $475 million from budget.
B 6 / F i n a n c i a l R e v i e w a n d S t a t i s t i c s B U D G E T 2 0 0 5
Summary Comparative Statement, 2004/05
| | | | | | | | | | | | | |
| | | 2004/05 | | | 2004/05 | | | | |
| | | Budget | | | Forecast | | | Difference | |
| | | (Millions of Dollars) | |
| | | | | | | | | | | | | |
Operating Fund Result | | | 99 | | | | 413 | | | | 314 | |
| | | | | | | | | | | |
Interfund Transfers/Debt Retirement | | | | | | | | | | | | |
| Debt retirement payment | | | (96 | ) | | | (99 | ) | | | (3 | ) |
| Fiscal Stabilization Fund | | | 0 | | | | 0 | | | | | |
| | | | | | | | | | | |
Balance under BBL/Transfer to FSF | | | 3 | | | | 314 | | | | 311 | |
| | | | | | | | | | | |
| | | | | | | | | | | | | |
Special Funds (Changes in Balance) | | | | | | | | | | | | |
| Debt Retirement Fund | | | (180 | ) | | | (180 | ) | | | | |
| Fiscal Stabilization Fund | | | 5 | | | | 316 | | | | 311 | |
| Other | | | (2 | ) | | | (2 | ) | | | | |
| Consolidation Adjustment | | | 202 | | | | 202 | | | | | |
| | | | | | | | | | | |
Total Changes in Special Funds | | | 24 | | | | 336 | | | | 311 | |
| | | | | | | | | | | |
| | | | | | | | | | | | | |
Government Enterprises and Crown Organizations | | | | | | | | | | | | |
| Government Business Enterprises | | | | �� | | | | | | | | |
| Manitoba Hydro | | | 37 | | | | 142 | | | | 105 | |
| Manitoba Public Insurance | | | 12 | | | | 30 | | | | 18 | |
| Manitoba Lotteries Corporation | | | 232 | | | | 270 | | | | 38 | |
| Manitoba Liquor Control Commission | | | 187 | | | | 185 | | | | (2 | ) |
| Special Operating Agencies | | | 10 | | | | 14 | | | | 4 | |
| Manitoba Crop Insurance and Agricultural Credit Corporations | | | (29 | ) | | | (86 | ) | | | (56 | ) |
| Other Crown Org. and Enterprises | | | 13 | | | | 79 | | | | 66 | |
| Consolidation Adjustments | | | (435 | ) | | | (472 | ) | | | (37 | ) |
| | | | | | | | | | | |
Net Enterprises and Organizations | | | 27 | | | | 161 | | | | 134 | |
| | | | | | | | | | | |
Net Pension Items | | | (109 | ) | | | (80 | ) | | | 29 | |
| | | | | | | | | | | |
Consolidated Net Income (Loss) | | | (58 | ) | | | 417 | | | | 475 | |
| | | | | | | | | | | |
Totals may not add due to rounding.
This table summarizes the forecast results for 2004/05 as compared to the estimate printed in the 2004 Manitoba Budget.
B U D G E T 2 0 0 5 F i n a n c i a l R e v i e w a n d S t a t i s t i c s / B 7
SECTION 1
Medium-Term Summary Budget Projection
(Millions of Dollars)
| | | | | | | | | | | | | | | | | | | | | |
| | | | | | | | | | | | | | | FOR | |
| | | | | | | | | | | | | | | ILLUSTRATION | |
| | | 2004/ | | | 2005/ | | | 2006/ | | | 2007/ | | | 2008/ | |
| | | 2005f | | | 2006b | | | 2007p | | | 2008p | | | 2009p | |
Revenues | | | 8,204 | | | | 8,177 | | | | 8,427 | | | | 8,672 | | | | 8,967 | |
Expenditures | | | (7,791 | ) | | | (8,064 | ) | | | (8,343 | ) | | | (8,559 | ) | | | (8,854 | ) |
| | | | | | | | | | | | | | | | |
| | | | | | | | | | | | | | | | | | | | | |
| Operating Fund Result | | | 413 | | | | 113 | | | | 83 | | | | 113 | | | | 113 | |
| | | | | | | | | | | | | | | | |
| | | | | | | | | | | | | | | | | | | | | |
Interfund Transfers/Debt Retirement | | | | | | | | | | | | | | | | | | | | |
| Debt retirement payment | | | (99 | ) | | | (110 | ) | | | (110 | ) | | | (110 | ) | | | (110 | ) |
| Fiscal Stabilization Fund | | | 0 | | | | 0 | | | | 30 | | | | 0 | | | | 0 | |
| | | | | | | | | | | | | | | | |
| | | | | | | | | | | | | | | | | | | | | |
Balance under BBL/Transfer to FSF | | | 314 | | | | 3 | | | | 3 | | | | 3 | | | | 3 | |
| | | | | | | | | | | | | | | | |
| | | | | | | | | | | | | | | | | | | | | |
Special Funds (Changes in Balance) | | | | | | | | | | | | | | | | | | | | |
| Debt Retirement Fund | | | (180 | ) | | | 27 | | | | 28 | | | | 29 | | | | 30 | |
| Fiscal Stabilization Fund | | | 316 | | | | 14 | | | | (14 | ) | | | 17 | | | | 17 | |
| Other | | | (2 | ) | | | 0 | | | | (2 | ) | | | (2 | ) | | | (2 | ) |
| Consolidation Adjustment | | | 202 | | | | — | | | | — | | | | — | | | | — | |
| | | | | | | | | | | | | | | | |
| | | | | | | | | | | | | | | | | | | | | |
Total Changes in Special Funds | | | 336 | | | | 41 | | | | 12 | | | | 44 | | | | 46 | |
| | | | | | | | | | | | | | | | |
| | | | | | | | | | | | | | | | | | | | | |
Government Enterprises and Crown Organizations | | | | | | | | | | | | | | | | | | | | |
| Government Business Enterprises | | | | | | | | | | | | | | | | | | | | |
| Manitoba Hydro | | | 142 | | | | 210 | | | | 122 | | | | 109 | | | | 106 | |
| Manitoba Public Insurance | | | 30 | | | | 8 | | | | 9 | | | | 10 | | | | 11 | |
| Manitoba Lotteries Corporation | | | 270 | | | | 271 | | | | 271 | | | | 271 | | | | 271 | |
| Manitoba Liquor Control Commission | | | 185 | | | | 187 | | | | 192 | | | | 196 | | | | 201 | |
| Special Operating Agencies | | | 14 | | | | 12 | | | | 12 | | | | 12 | | | | 12 | |
| Manitoba Crop Insurance and Agricultural Credit Corporations | | | (86 | ) | | | (22 | ) | | | (19 | ) | | | (16 | ) | | | (14 | ) |
| Other Enterprises and Organizations | | | 79 | | | | 50 | | | | 50 | | | | 50 | | | | 50 | |
| Consolidation Adjustments | | | (472 | ) | | | (475 | ) | | | (479 | ) | | | (484 | ) | | | (489 | ) |
| | | | | | | | | | | | | | | | |
| | | | | | | | | | | | | | | | | | | | | |
Net Enterprises and Organizations | | | 161 | | | | 242 | | | | 157 | | | | 149 | | | | 149 | |
| | | | | | | | | | | | | | | | |
| | | | | | | | | | | | | | | | | | | | | |
| Pension Expense for Unfunded Liability | | | (196 | ) | | | (206 | ) | | | (214 | ) | | | (221 | ) | | | (223 | ) |
| Increase in Pension Assets Fund | | | 116 | | | | 119 | | | | 128 | | | | 139 | | | | 150 | |
| | | | | | | | | | | | | | | | |
| | | | | | | | | | | | | | | | | | | | | |
Net Pension Items | | | (80 | ) | | | (87 | ) | | | (86 | ) | | | (82 | ) | | | (73 | ) |
| | | | | | | | | | | | | | | | |
| | | | | | | | | | | | | | | | | | | | | |
Consolidated Net Income | | | 417 | | | | 196 | | | | 84 | | | | 111 | | | | 121 | |
| | | | | | | | | | | | | | | | |
| f - Forecast b - Budget p - Projection | | |
| |
| Totals may not add due to rounding. | | |
| |
| 2007/08 and 2008/09 are presented for illustration purposes only. This presentation will change when government fully implements Summary Budget reporting. Work has begun on this initiative as described on page B2. | | |
B 8 / F i n a n c i a l R e v i e w a n d S t a t i s t i c s B U D G E T 2 0 0 5
Summary Budget Projection to 2008/09
The medium-term fiscal prospects for Manitoba reflect steady economic growth and associated revenue out to 2008/09.
Operating Fund
Operating Fund revenue in respect of provincial taxation is expected to reflect solid economic growth, while other own-source revenue is expected to be relatively flat. The health funding agreement signed by First Ministers in September 2004 has resulted in increased financial resources for health care out into the future. Transfer payments under the Equalization Program are to be reviewed by a federal panel and, until such time as new estimates are announced, it is assumed that revenue will grow in line with current legislation.
Overall revenue growth takes place against the backdrop of a growing economy both in Manitoba and Canada as a whole. According to the February 2005 Conference Board Forecast, Manitoba’s nominal Gross Domestic Product is expected to increase by 4.1% in 2006 and average 4.2% over the medium term.
Operating Fund program expenditure is projected to increase by 3.2% over the medium term – a rate that would effectively sustain key public services and provide for modest improvements in areas of greatest priority, such as health care, education and infrastructure.
Unallocated debt servicing costs are expected to average about $294 million over the 2006/07 to 2008/09 period.
2007/08 and 2008/09 are presented for illustration purposes only. This presentation will change when government fully implements Summary Budget reporting. Work has begun on this initiative as described on page B2.
Total Changes in Special Funds
A number of special funds have been created by the legislature for defined purposes. The two principal ones are the Fiscal Stabilization Fund (FSF) and the Debt Retirement Fund (DRF). There are also a number of small, special-purpose funds – for example the Mining Community Reserve Fund and the Quarry Rehabilitation Reserve – that in total have little effect on the overall balance.
In 2004/05, $281 million held in the DRF was withdrawn and applied to reduce outstanding debt. This is in accordance with the provisions of debt repayment legislation, which mandates collapsing the fund at least once every five years. An amount of $79 million was allocated to the Pension Assets Fund (PAF) and $202 million was deposited to the Sinking Fund. Details of the DRF for 2004/05 are reported on page B21.
B U D G E T 2 0 0 5 F i n a n c i a l R e v i e w a n d S t a t i s t i c s / B 9
SECTION 1
The $202 million allocation to the Sinking Fund is not considered an expense for accounting purposes, and a consolidation adjustment is required. Before this transfer, Special Funds are expected to achieve a positive result of $134 million for 2004/05.
For 2005/06, the FSF and DRF balances will grow as deposits are made from the Operating Fund.
Contributions of Government Enterprises and Crown Organizations
This report records the net changes in operating balances (profits or losses) of Government enterprises, Crown corporations, entities and special operating agencies (SOAs) during the fiscal year. The Crown corporations having the greatest net impact on the consolidated financial results are listed. The contributions of other government entities and organizations are provided in aggregate.
An entry of note is the projected result of Manitoba Hydro for the 2004/05 fiscal year. After a loss on operations of $436 million in 2003/04 due to the effect on water flows of a widespread and prolonged drought, Manitoba Hydro is expected to record profits of $142 million in 2004/05. For fiscal year 2005/06, Manitoba Hydro’s profits are expected to increase to $210 million. Profits of between $106 and $122 million are projected over the medium term.
Consolidation Adjustments
Consolidation adjustments are made to prevent double counting of revenue or expense items between the government and its related entities. Specifically:
| • | The full amount of profits from Manitoba Lotteries Corporation and the Liquor Control Commission are included in Operating Fund Revenue, and so are fully offset in Consolidation Adjustments. |
| • | Revenue-sharing payments from SOAs are included in Operating Revenue and are deducted here. |
Pension Items
Upon coming into office, the government put into place a plan to retire the General Purpose Debt and to eliminate the government’s pension liability. If the pension liability would not have been addressed it was projected that it would grow to $8.4 billion by 2028, and would continue to grow after that.
The 2000 Manitoba Budget introduced a comprehensive approach to address both debt and pension obligations, and in the 2002 Budget the plan was enhanced to reduce the term over which the pension liability will be eliminated. The plan provides for debt and pension obligation funding of $110 million per year for 2005/06 and upcoming fiscal years.
This forecast projects an allocation from the DRF of $87 million per year over the medium term to the PAF. Interest earnings and net contributions from departments and Crowns produce the additional increases in the PAF.
| | | |
B 10 / F i n a n c i a l R e v i e w a n d S t a t i s t i c s B U D G E T 2 0 0 5
|
Consolidated Net Income
The Summary Budget represents the financial plan for the entire government entity as defined in Schedule 8 of the Summary Financial Statements of the Public Accounts.
Manitoba’s financial result is forecast to improve significantly in 2004/05. Increased federal health and Equalization transfers and a return to profitability for Manitoba Hydro’s operations, mean the 2004/05 Consolidated balance is forecast to be $417 million, an improvement of over $1 billion from the 2003/04 results. Of this total, $578 million is the result of the improvement in Manitoba Hydro’s balance.
For 2005/06, federal transfer payments are expected to be $122 million lower than in 2004/05. However, own-source revenue is expected to increase by $95 million, and Manitoba Hydro is expected to realize a higher level of profit. Consolidated Net Income for 2005/06 is projected to total $196 million. Over the period to 2008/09, the outlook remains positive.
| | | |
B U D G E T 2 0 0 5 F i n a n c i a l R e v i e w a n d S t a t i s t i c s / B 11
|
| | SECTION 2 |
n Operating Fund Overview
Budget 2005 sets out the government’s plans for the coming year – Balancing Priorities, Building Opportunities, Investing in Tomorrow. The budget is balanced under BBL and is also balanced for the wider, consolidated Summary Budget.
As a result of the agreement reached by first ministers in the fall of 2004, federal funding for health care has been increased. In addition, under the federal government’s transitional funding plan, Equalization payments for Manitoba have increased over the short term. This additional transfer support from the federal government is invested in health care and other priority programs of Manitobans.
Budget 2005 shows that:
| • | Medium-term projections indicate continued compliance with BBL for the Operating Fund and future surpluses for the Consolidated Summary Budget. |
| • | An additional $110 million will be provided to repay outstanding pension liability and General Purpose Debt. Since 1999/2000, including the current fiscal year, $594 million has been set aside for debt and pension payments. Debt to GDP ratios as measured by the Dominion Bond Rating Service (DBRS) continued to decline from 38.7% in 1999/2000 to 33.9% in 2004/05. |
| • | In 2004/05, additional Equalization transfers and the federal government’s prepayment of its commitments for reducing health care waiting lists, as well as stronger than anticipated performance in some own-source revenues, will result in an expected payment of $314 million into the FSF. No draw from the fund is projected in 2005/06. |
| • | In 2005, the Education Support Levy for homeowners will fall by a further $30 million and farmers will receive rebates offsetting 50% of their school taxes on farmland. In 2006, the middle income tax rate will fall to 13.5%, the basic personal amount will increase by $100, and the tax rates for corporations will fall to 14.5% and 4.5% for small business. Other measures to support Manitoba’s film industry and to encourage investment in equipment and property are also outlined. |
| • | Municipal governments can expect increased support through the new Building Manitoba Fund, and there are more resources for infrastructure and water protection programs. |
| • | The government is committed to working with the OAG to fully implement GAAP in its financial reporting, establishing the Consolidated Summary Budget as the primary reporting tool for the 2007/08 fiscal year. |
Budget 2005 meets the commitments government has made to Manitobans, meeting its obligations to debt and pension liabilities, investing in key programs and services, providing affordable tax reductions for individuals and business, and replenishing the FSF.
| | | |
B 12 / F i n a n c i a l R e v i e w a n d S t a t i s t i c s B U D G E T 2 0 0 5
| | |
n 2004/05 Forecast Result
| |
| Note: | The forecast results for 2004/05 presented in this budget paper are based on the province’s Third Quarter Financial Report. |
Results for 2004/05 reflect economic developments that have taken place over the course of the year along with the outcomes of two major First Ministers’ Meetings, all of which have had significant impacts on the province’s fiscal situation.
Revenue
Despite the sharp appreciation of the Canadian dollar relative to its U.S. counterpart and somewhat weaker than anticipated economic growth (see Budget Paper A: The Economy), revenue for 2004/05 is now expected to be $551 million above that projected in the 2004 Budget. Both provincial own-source revenue ($80 million) and federal transfer payments ($471 million) will be higher than previously projected. Equalization payments are forecast to be $184 million higher than budget as a result of changes in the legislation that is currently before the House of Commons, and $79 million higher due to changes in in-year entitlements. Health and social transfers will increase by $205 million, primarily as a result of the federal government pre-funding the first five years of its commitment to help provinces reduce waiting times ($155 million) as well as other health-related programs. Higher than anticipated Corporation Income Tax collections and Manitoba Lotteries Corporation revenue offset lower than expected collections in respect of Retail Sales Tax and Individual Income Tax.
Expenditure
Total expenditure in 2004/05 is expected to be $237 million above 2004 Budget projections. This reflects continuing cost pressures in Manitoba Health ($84 million) and Manitoba Family Services and Housing ($23 million), the impact of changes in accounting standards ($35 million), cost pressures associated with the BSE crisis ($19 million) and the Farmland School Tax Rebate ($13 million). Unallocated debt servicing costs will be $2 million below the budgeted amount.
Net Revenue
Net revenue, resulting from both higher than budgeted revenue and expenditure, will be $413 million in 2004/05, $314 million above the $99 million figure projected in the 2004 Budget.
Balance under Balanced Budget Legislation
The net result for the 2004/05 fiscal year will be a positive balance of $314 million under BBL. As well, $99 million will be utilized for the repayment of general purpose debt and retirement of pension liabilities. The balance under BBL will be deposited in the FSF.
| | | |
B U D G E T 2 0 0 5 F i n a n c i a l R e v i e w a n d S t a t i s t i c s / B 13
|
| | SECTION 2 |
| | | |
| |
Comparative Statement of Budgetary Revenue, Expenditure, Transfers and Balance
2004/05
| | | | | | | | | | | | | | | | | |
| | | | | | | | | | | Increase/(Decrease) | |
| | | 2004/05 | | | 2004/05 | | | From Budget | |
| | | Forecast | | | Budget | | | to Forecast | |
| | | (Millions of Dollars) | | | (Millions of Dollars) | | | % | |
Revenue | | | | | | | | | | | | | | | | |
| Own-Source | | | 5,204 | | | | 5,124 | | | | 80 | | | | 1.6 | |
| Federal Transfers | | | 2,918 | | | | 2,447 | | | | 471 | | | | 19.2 | |
| | | | | | | | | | | | | | |
Total Revenue | | | 8,122 | | | | 7,571 | | | | 551 | | | | 7.3 | |
| | | | | | | | | | | | | | |
| | | | | | | | | | | | | | | | | |
Expenditure | | | | | | | | | | | | | | | | |
| Program | | | 7,472 | | | | 7,233 | | | | 239 | | | | 3.3 | |
Unallocated Debt Servicing1 | | | 237 | | | | 239 | | | | (2 | ) | | | (0.8 | ) |
| | | | | | | | | | | | | | |
Total Expenditure | | | 7,709 | | | | 7,472 | | | | 237 | | | | 3.2 | |
| | | | | | | | | | | | | | |
| | | | | | | | | | | | | | | | | |
Net Revenue | | | 413 | | | | 99 | | | | 314 | | | | | |
| | | | | | | | | | | | | | | | | |
InterfundTransfers | | | | | | | | | | | | | | | | |
| Debt/Pension Repayment | | | (99 | ) | | | (96 | ) | | | (3 | ) | | | (3.1 | ) |
| Fiscal Stabilization Fund | | | 0 | | | | 0 | | | | 0 | | | | | |
| | | | | | | | | | | | | | |
| | | | | | | | | | | | | | | | | |
Balance under Balanced Budget Legislation | | | 314 | | | | 3 | | | | 311 | | | | | |
| | | | | | | | | | | | | | |
| Note 1: Excludes $85 million allocated to departments in respect of the carrying costs of their tangible capital assets. | | |
| | | |
B 14 / F i n a n c i a l R e v i e w a n d S t a t i s t i c s B U D G E T 2 0 0 5
|
| |
| | | |
| |
Comparative Statement of Budgetary Revenue, Expenditure, Transfers and Balance
2005/06 and 2004/05
| | | | | | | | | | | | | | | | | | | | | | | | | | | | | |
| | | | | | | | | | | | | | | Increase/ | | | Increase/ | |
| | | | | | | | | | | | | | | (Decrease) | | | (Decrease) | |
| | | | | | | | | | | | | | | from 2004/05 | | | from | |
| | | | | | | | | | | | | | | Forecast | | | 2004/05 Budget | |
| | | 2005/06 | | | 2004/051 | | | 2004/051 | | | to 2005/06 | | | to 2005/06 | |
| | | Budget | | | Forecast | | | Budget | | | Budget | | | Budget | |
| | | | | | | | | | | | | | | (Millions | | | | | | | (Millions | | | | |
| | | (Millions of Dollars) | | | of Dollars) | | | % | | | of Dollars) | | | % | |
Revenue | | | | | | | | | | | | | | | | | | | | | | | | | | | | |
| Own-Source | | | 5,381 | | | | 5,286 | | | | 5,206 | | | | 95 | | | | 1.8 | | | | 175 | | | | 3.4 | |
| Federal Transfers | | | 2,796 | | | | 2,918 | | | | 2,447 | | | | (122 | ) | | | (4.2 | ) | | | 349 | | | | 14.3 | |
| | | | | | | | | | | | | | | | | | | | | | | | |
Total Revenue | | | 8,177 | | | | 8,204 | | | | 7,653 | | | | (27 | ) | | | (0.3 | ) | | | 524 | | | | 6.8 | |
| | | | | | | | | | | | | | | | | | | | | | | | |
| | | | | | | | | | | | | | | | | | | | | | | | | | | | | |
Expenditure | | | | | | | | | | | | | | | | | | | | | | | | | | | | |
| Program | | | 7,795 | | | | 7,554 | | | | 7,315 | | | | 241 | | | | 3.2 | | | | 480 | | | | 6.6 | |
Unallocated Debt Servicing2 | | | 269 | | | | 237 | | | | 239 | | | | 32 | | | | 13.5 | | | | 30 | | | | 12.6 | |
| | | | | | | | | | | | | | | | | | | | | | | | |
Total Expenditure | | | 8,064 | | | | 7,791 | | | | 7,554 | | | | 273 | | | | 3.5 | | | | 510 | | | | 6.8 | |
| | | | | | | | | | | | | | | | | | | | | | | | |
| | | | | | | | | | | | | | | | | | | | | | | | | | | | | |
Net Revenue | | | 113 | | | | 413 | | | | 99 | | | | (300 | ) | | | | | | | 14 | | | | | |
| | | | | | | | | | | | | | | | | | | | | | | | | | | | | |
Interfund Transfers | | | | | | | | | | | | | | | | | | | | | | | | | | | | |
| Debt/Pension Repayment | | | (110 | ) | | | (99 | ) | | | (96 | ) | | | (11 | ) | | | | | | | (14 | ) | | | | |
| Fiscal Stabilization Fund | | | 0 | | | | 0 | | | | 0 | | | | 0 | | | | | | | | 0 | | | | | |
| | | | | | | | | | | | | | | | | | | | | | | | |
| | | | | | | | | | | | | | | | | | | | | | | | | | | | | |
Balance under Balanced Budget Legislation | | | 3 | | | | 314 | | | | 3 | | | | (311 | ) | | | | | | | 0 | | | | | |
| | | | | | | | | | | | | | | | | | | | | | | | |
| Note 1: The 2004/05 information has been adjusted to be consistent with the 2005/06 Estimates structure. | | |
| |
| Note 2: Excludes $84 million in 2005/06 ($85 million in 2004/05) allocated to departments in respect of the carrying costs of their tangible capital assets. | | |
| | | |
B U D G E T 2 0 0 5 F i n a n c i a l R e v i e w a n d S t a t i s t i c s / B 15
|
| | SECTION 2 |
n 2005/06 Budget
Revenue
When compared to the 2004/05 forecast, total revenue is projected to decline in 2005/06 by $27 million, or 0.3%. Own-source revenue is expected to grow by $95 million, as continued strong economic performance in Manitoba translates into more jobs, more investment and more output. Offsetting this underlying strength will be a $122 million decline in transfer revenue from the federal government. Equalization payments to Manitoba will decline by $98 million in 2005/06. There will also be an overall decline in respect of health care funding, which primarily reflects the fact that the federal government’s pre-funding the first five years of its commitment to help provinces reduce waiting times is being recorded as revenue in 2004/05.
Expenditure
When compared to the 2004/05 forecast, total expenditure is projected to increase by $273 million, or 3.5% in 2005/06. Budgetary program expenditure is projected to increase by $293 million, with health care expenditures accounting for 48% of the increase. Debt servicing costs are expected to increase by $32 million, reflecting higher average interest rates.
Net Revenue
The projected decline in revenue, coupled with slower expenditure growth, is expected to result in net revenue of $113 million in 2005/06.
Balance under Balanced Budget Legislation
In 2005/06, $110 million will be applied against general purpose debt and pension liabilities, $11 million more than forecast in 2004/05. No draw is anticipated from the FSF and the projected balance under BBL will be $3 million.
| | | |
B 16 / F i n a n c i a l R e v i e w a n d S t a t i s t i c s B U D G E T 2 0 0 5
|
| |
| | | |
| |
Provincial Revenue, 2005/06
Major Source
Per cent of Total

Revenue by Source
2005/06 and 2004/05
| | | | | | | | | | | | | |
| | | 2005/06 | | | 2004/05 | | | Change 2005/06 | |
| | | Budget | | | Forecast | | | from 2004/05 Forecast | |
| | | (Millions of Dollars) | | | (Millions of Dollars) | |
| Total Taxation | | | 4,538 | | | | 4,454 | | | | 84 | |
| Other Revenue | | | 843 | | | | 832 | | | | 11 | |
| | | | | | | | | | |
| |
| Own-Source Revenue | | | 5,381 | | | | 5,286 | | | | 95 | |
| Government of Canada | | | 2,796 | | | | 2,918 | | | | (122 | ) |
| | | | | | | | | | |
| | | | | | | | | | | | | |
Total Revenue | | | 8,177 | | | | 8,204 | | | | (27 | ) |
| | | | | | | | | | |
| | |
B U D G E T 2 0 0 5 F i n a n c i a l R e v i e w a n d S t a t i s t i c s / B 1 7
|
| | SECTION 2 |
| | | |
| |
Revenue Estimates
(Thousands of Dollars)
| | | | | | | | | | | | | | | | | | | | | |
| | | | | | | | | | | | | | | Per cent | |
| | | | | | | | | | | | | | | Change 2005/06 from | |
| | | 2005/06 | | | 2004/05 | | | 2004/05 | | | 2004/05 | | | 2004/05 | |
| | | Estimate | | | Forecast1 | | | Budget1 | | | Forecast | | | Budget | |
n Own-Source Revenue | | | | | | | | | | | | | | | | | | | | |
| |
IncomeTaxes | | | | | | | | | | | | | | | | | | | | |
| • Individual Income Tax | | | 1,876,900 | | | | 1,830,894 | | | | 1,844,244 | | | | | | | | | |
| • Corporation Income Tax | | | 365,600 | | | | 399,449 | | | | 339,349 | | | | | | | | | |
| | | | | | | | | | | | | | | | | | |
| Subtotal | | | 2,242,500 | | | | 2,230,343 | | | | 2,183,593 | | | | | | | | | |
| | | | | | | | | | | | | | | | | | |
Taxes, Levies and Collections | | | | | | | | | | | | | | | | | | | | |
| • Corporation Capital Tax | | | 167,500 | | | | 166,500 | | | | 153,500 | | | | | | | | | |
| • Gasoline Tax | | | 155,500 | | | | 154,700 | | | | 157,700 | | | | | | | | | |
| • Insurance Corporations Tax | | | 54,000 | | | | 52,800 | | | | 52,500 | | | | | | | | | |
| • Land Transfer Tax | | | 24,000 | | | | 22,127 | | | | 21,000 | | | | | | | | | |
| • Levy for Health and Education | | | 294,300 | | | | 284,000 | | | | 280,800 | | | | | | | | | |
| • Mining Tax | | | 57,200 | | | | 57,230 | | | | 57,230 | | | | | | | | | |
| • Motive Fuel Tax | | | 78,000 | | | | 77,600 | | | | 77,600 | | | | | | | | | |
| • Oil and Natural Gas Tax | | | 2,720 | | | | 3,015 | | | | 2,277 | | | | | | | | | |
| • Retail Sales Tax | | | 1,180,800 | | | | 1,125,000 | | | | 1,154,300 | | | | | | | | | |
| • Revenue Act, 1964, Part 1 | | | 73,800 | | | | 73,400 | | | | 73,400 | | | | | | | | | |
| • Tobacco Tax | | | 203,700 | | | | 203,700 | | | | 203,700 | | | | | | | | | |
| • Environmental Protection Tax | | | 3,200 | | | | 3,200 | | | | 3,200 | | | | | | | | | |
| • Other Taxes | | | 72 | | | | 72 | | | | 72 | | | | | | | | | |
| | | | | | | | | | | | | | | | | | |
| Subtotal | | | 2,294,792 | | | | 2,223,344 | | | | 2,237,279 | | | | | | | | | |
| | | | | | | | | | | | | | | | | | |
Total Taxation Revenue | | | 4,537,292 | | | | 4,453,687 | | | | 4,420,872 | | | | 1.9 | | | | 2.6 | |
| | | | | | | | | | | | | | | | | | |
Fees and Other Revenue | | | | | | | | | | | | | | | | | | | | |
| • Fines and Costs and Other Legal | | | 33,859 | | | | 31,620 | | | | 34,757 | | | | | | | | | |
| • Minerals and Petroleum | | | 6,495 | | | | 7,338 | | | | 5,431 | | | | | | | | | |
| • Automobile and Motor Carrier Licences and Fees | | | 97,998 | | | | 85,853 | | | | 85,853 | | | | | | | | | |
| • Drivers’ Licences | | | 17,916 | | | | 17,916 | | | | 17,916 | | | | | | | | | |
| • Water Power Rentals | | | 105,000 | | | | 105,100 | | | | 100,000 | | | | | | | | | |
| • Parks, Forestry, and Other Conservation | | | 38,801 | | | | 28,132 | | | | 26,563 | | | | | | | | | |
| • All Other Manitoba Collections | | | 67,910 | | | | 84,142 | | | | 78,816 | | | | | | | | | |
| | | | | | | | | | | | | | | | | | |
| Subtotal | | | 367,979 | | | | 360,101 | | | | 349,336 | | | | | | | | | |
| | | | | | | | | | | | | | | | | | |
Crown Corporations/Entities | | | | | | | | | | | | | | | | | | | | |
| • Manitoba Lotteries Corporation | | | 271,000 | | | | 270,000 | | | | 232,000 | | | | | | | | | |
| • Manitoba Liquor Control Commission | | | 187,000 | | | | 184,600 | | | | 187,000 | | | | | | | | | |
| • Other | | | 17,005 | | | | 17,975 | | | | 16,525 | | | | | | | | | |
| | | | | | | | | | | | | | | | | | |
| Subtotal | | | 475,005 | | | | 472,575 | | | | 435,525 | | | | | | | | | |
| | | | | | | | | | | | | | | | | | |
Total Other Revenue | | | 842,984 | | | | 832,676 | | | | 784,861 | | | | 1.2 | | | | 7.4 | |
| | | | | | | | | | | | | | | | | | |
n Federal Transfers | | | | | | | | | | | | | | | | | | | | |
| • Equalization | | | 1,601,000 | | | | 1,699,015 | | | | 1,435,800 | | | | | | | | | |
| • Canada Health Transfers (CHT) | | | 726,400 | | | | 705,700 | | | | 495,600 | | | | | | | | | |
| • Canada Social Transfer (CST) | | | 320,100 | | | | 304,200 | | | | 309,200 | | | | | | | | | |
| • Child Care | | | 5,000 | | | | 0 | | | | 0 | | | | | | | | | |
| • Health Reform Fund | | | 0 | | | | 55,000 | | | | 55,000 | | | | | | | | | |
| • Other Health Funds | | | 26,452 | | | | 40,018 | | | | 42,100 | | | | | | | | | |
| • Other Transfers | | | 117,370 | | | | 113,739 | | | | 109,483 | | | | | | | | | |
| | | | | | | | | | | | | | | | | | |
Total Federal Transfers | | | 2,796,322 | | | | 2,917,672 | | | | 2,447,183 | | | | (4.2 | ) | | | 14.3 | |
| | | | | | | | | | | | | | | | | | |
n Total Budgetary Revenue | | | 8,176,598 | | | | 8,204,035 | | | | 7,652,916 | | | | (0.3 | ) | | | 6.8 | |
| | | | | | | | | | | | | | | | | | |
Note 1: The 2004/05 information has been adjusted to be consistent with the 2005/06 Estimates structure.
| | |
B 1 8 / F i n a n c i a l R e v i e w a n d S t a t i s t i c s B U D G E T 2 0 0 5
|
| |
| | | |
| |
Provincial Operating Expenditure, 2005/06
Major Categories
Per cent of Total

Program Expenditure Estimates
2005/06 and 2004/05
| | | | | | | | | | | | | |
| | | 2005/06 | | | 2004/05 | | | Change 2005/06 | |
| | | Budget | | | Forecast1 | | | from 2004/05 Forecast | |
| | | (Millions of Dollars) | | | (Millions of Dollars) | |
| Health | | | 3,390 | | | | 3,273 | | | | 117 | |
| Advanced Education and Training | | | 556 | | | | 557 | | | | (1 | ) |
| Education, Citizenship and Youth | | | 1,189 | | | | 1,141 | | | | 48 | |
| Family Services and Housing | | | 969 | | | | 935 | | | | 34 | |
| Other Departments | | | 1,756 | | | | 1,661 | | | | 95 | |
| | | | | | | | | | |
Total Program Expenditure Estimates | | | 7,860 | | | | 7,567 | | | | 293 | |
| | | | | | | | | | |
Note 1: The 2004/05 information has been adjusted to be consistent with the 2005/06 Estimates structure.
| | | |
B U D G E T 2 0 0 5 F i n a n c i a l R e v i e w a n d S t a t i s t i c s / B 19
|
| | SECTION 2 |
| | | |
| |
Operating Expenditure Estimates
(Thousands of Dollars)
| | | | | | | | | | | | | | | | | | | | | |
| | | | | | | | | | | | | | | Per cent | |
| | | | | | | | | | | | | | | Change 2005/06 from | |
| | | 2005/06 | | | 2004/05 | | | 2004/05 | | | 2004/05 | | | 2004/05 | |
| | | Estimate | | | Forecast1 | | | Budget1 | | | Forecast | | | Budget | |
n Health | | | 3,389,760 | | | | 3,273,228 | | | | 3,188,872 | | | | 3.6 | | | | 6.3 | |
| | | | | | | | | | | | | | | | | | |
n Education | | | | | | | | | | | | | | | | | | | | |
| • Advanced Education and Training | | | 556,414 | | | | 557,001 | | | | 543,159 | | | | | | | | | |
| • Education, Citizenship and Youth | | | 1,189,335 | | | | 1,140,599 | | | | 1,105,912 | | | | | | | | | |
| | | | | | | | | | | | | | | | | | |
Total Education | | | 1,745,749 | | | | 1,697,600 | | | | 1,649,071 | | | | 2.8 | | | | 5.9 | |
| | | | | | | | | | | | | | | | | | |
| | | | | | | | | | | | | | | | | | | | | |
n Family Services and Housing | | | 969,278 | | | | 935,406 | | | | 912,698 | | | | 3.6 | | | | 6.2 | |
| | | | | | | | | | | | | | | | | | |
n Community, Economic and Resource Development | | | | | | | | | | | | | | | | | | | | |
| • Aboriginal and Northern Affairs | | | 30,420 | | | | 28,983 | | | | 29,189 | | | | | | | | | |
| • Agriculture, Food and Rural Initiatives | | | 174,364 | | | | 158,306 | | | | 146,079 | | | | | | | | | |
| • Conservation | | | 111,185 | | | | 105,871 | | | | 104,944 | | | | | | | | | |
| • Energy, Science and Technology | | | 56,790 | | | | 54,298 | | | | 54,154 | | | | | | | | | |
| • Industry, Economic Development and Mines | | | 29,134 | | | | 27,468 | | | | 28,476 | | | | | | | | | |
| • Intergovernmental Affairs and Trade | | | 222,097 | | | | 199,382 | | | | 196,750 | | | | | | | | | |
| • Transportation and Government Services | | | 388,913 | | | | 382,279 | | | | 383,473 | | | | | | | | | |
| • Water Stewardship | | | 48,370 | | | | 46,280 | | | | 45,255 | | | | | | | | | |
| • Enabling Appropriations | | | 19,530 | | | | 10,633 | | | | 20,332 | | | | | | | | | |
| • Other Appropriations | | | 25,805 | | | | 41,688 | | | | 25,810 | | | | | | | | | |
| | | | | | | | | | | | | | | | | | |
Total Community, Economic and Resource Development | | | 1,106,608 | | | | 1,055,188 | | | | 1,034,462 | | | | 4.9 | | | | 7.0 | |
| | | | | | | | | | | | | | | | | | |
n Justice and Other Government | | | | | | | | | | | | | | | | | | | | |
| • Legislative Assembly | | | 26,585 | | | | 25,009 | | | | 24,181 | | | | | | | | | |
| • Executive Council | | | 2,617 | | | | 2,563 | | | | 2,563 | | | | | | | | | |
| • Civil Service Commission | | | 4,659 | | | | 4,270 | | | | 4,276 | | | | | | | | | |
| • Culture, Heritage and Tourism | | | 69,994 | | | | 67,061 | | | | 67,723 | | | | | | | | | |
| • Employee Pensions and Other Costs | | | 74,255 | | | | 64,042 | | | | 67,737 | | | | | | | | | |
| • Finance | | | 102,129 | | | | 98,955 | | | | 98,919 | | | | | | | | | |
| • Healthy Child Manitoba | | | 24,775 | | | | 21,665 | | | | 22,315 | | | | | | | | | |
| • Justice | | | 284,184 | | | | 272,847 | | | | 268,186 | | | | | | | | | |
| • Labour and Immigration | | | 31,209 | | | | 29,761 | | | | 29,139 | | | | | | | | | |
| • Manitoba Seniors and Healthy Aging Secretariat | | | 921 | | | | 741 | | | | 741 | | | | | | | | | |
| • Sport | | | 11,155 | | | | 11,053 | | | | 10,644 | | | | | | | | | |
| • Enabling Appropriations | | | 16,050 | | | | 7,676 | | | | 3,089 | | | | | | | | | |
| | | | | | | | | | | | | | | | | | |
Total Justice and Other Government | | | 648,533 | | | | 605,643 | | | | 599,513 | | | | 7.1 | | | | 8.2 | |
| | | | | | | | | | | | | | | | | | |
| | | | | | | | | | | | | | | | | | | | | |
n Total Program Expenditures | | | 7,859,928 | | | | 7,567,065 | | | | 7,384,616 | | | | 3.9 | | | | 6.4 | |
n Unallocated Debt Servicing Costs | | | 268,984 | | | | 236,980 | | | | 238,682 | | | | 13.5 | | | | 12.7 | |
| | | | | | | | | | | | | | | | | | |
| | | | | | | | | | | | | | | | | | | | | |
n Total Expenditure Estimates | | | 8,128,912 | | | | 7,804,045 | | | | 7,623,298 | | | | 4.2 | | | | 6.6 | |
| | | | | | | | | | | | | | | | | | | | | |
n Less: Year-End Lapse | | | (65,000 | ) | | | (13,000 | ) | | | (70,000 | ) | | | | | | | | |
| | | | | | | | | | | | | | | | | | |
| | | | | | | | | | | | | | | | | | | | | |
n Total Budgetary Expenditure | | | 8,063,912 | | | | 7,791,045 | | | | 7,553,298 | | | | 3.5 | | | | 6.8 | |
| | | | | | | | | | | | | | | | | | |
Note 1: The 2004/05 information has been adjusted to be consistent with the 2005/06 Estimates structure.
| | |
B 2 0 / F i n a n c i a l R e v i e w a n d S t a t i s t i c s B U D G E T 2 0 0 5
|
n Special Funds Balances
Fiscal Stabilization Fund
In 2004/05, there will be no draw from the FSF. The positive balance in the operating fund, projected at $314 million, is deposited in the FSF. The budgeted draw for 2005/06 is nil. The closing balance of the fund is projected to be $409 million.
Fiscal Stabilization Fund
Revenue, Expenditure and Balance
Projection as at March 31, 2006 and March 31, 2005
| | | | | | | | | |
| | | 2005/06 | | | 2004/05 | |
| | | Budget | | | Forecast | |
| | | (Millions of Dollars) | |
Fund Balance, Beginning of Year | | | 395 | | | | 79 | |
| | | | | | | |
| | | | | | | | | |
Revenue | | | | | | | | |
| Balance Under Balanced Budget Legislation | | | 3 | | | | 314 | |
| Interest | | | 11 | | | | 2 | |
| | | | | | | |
| | | | 14 | | | | 316 | |
| | | | | | | |
Expenditure | | | | | | | | |
| Transfer to Operating Fund | | | 0 | | | | 0 | |
| | | | | | | |
Fund Balance, End of Year | | | 409 | | | | 395 | |
| | | | | | | |
| | |
B U D G E T 2 0 0 5 F i n a n c i a l R e v i e w a n d S t a t i s t i c s / B 2 1
|
| | SECTION 2 |
Debt Retirement Fund
In accordance with The Balanced Budget, Debt Repayment and Taxpayer Accountability Act, a $99 million deposit to the DRF is required in 2004/05. In 2005/06, a deposit of $110 million will be made to the fund.
For 2004/05, the Allocation Committee determined that the allocation is $22 million to General Purpose Debt and the balance to Pension Liability.
The debt repayment provisions of the Act require that at least once every five years, the fund be collapsed and all amounts be allocated to the Province of Manitoba Sinking Fund (debt) or to the PAF. In 2004/05, $202 million will be applied against General Purpose Debt. The transfer to the Sinking Fund occurred in April 2004.
For 2005/06, it is assumed that the allocation will be $87 million to Pension Liability.
Debt Retirement Fund
Revenue, Expenditure and Balance
Projection as at March 31, 2006 and March 31, 2005
| | | | | | | | | |
| | | 2005/06 | | | 2004/05 | |
| | | Budget | | | Forecast | |
| | | (Millions of Dollars) | |
Fund Balance, Beginning of Year | | | 0 | | | | 180 | |
| | | | | | | |
| | | | | | | | | |
Revenue | | | | | | | | |
| Transfer from Operating Fund | | | 110 | | | | 99 | |
| Interest | | | 3 | | | | 2 | |
| | | | | | | |
| | | | 113 | | | | 101 | |
| | | | | | | |
Expenditure | | | | | | | | |
| Transfer to Sinking Fund | | | 0 | | | | (202 | ) |
| Transfer to Pension Assets Fund | | | (87 | ) | | | (79 | ) |
| | | | | | | |
Fund Balance, End of Year | | | 26 | | | | 0 | |
| | | | | | | |
| | |
B 2 2 / F i n a n c i a l R e v i e w a n d S t a t i s t i c s B U D G E T 2 0 0 5
|
Pension Assets Fund
It is assumed that $87 million should be allocated to the PAF for 2005/06.
The fund had net investment earnings of $31 million in 2004/05. The budget projects a return of $26 million in 2005/06.
The fund is expected to have a balance of $502 million by the end of the 2005/06 fiscal year.
Pension Assets Fund
Receipts, Expenditure and Balance
Projection as at March 31, 2006 and March 31, 2005
| | | | | | | | | |
| | | 2005/06 | | | 2004/05 | |
| | | Budget | | | Forecast | |
| | | (Millions of Dollars) | |
Fund Balance, Beginning of Year | | | 383 | | | | 267 | |
| | | | | | | |
| | | | | | | | | |
Contributions | | | | | | | | |
| Debt Retirement Fund | | | 87 | | | | 79 | |
| Net Investment Earnings | | | 26 | | | | 31 | |
| Departments and Crown Organizations | | | 6 | | | | 6 | |
| | | | | | | |
| | | | 119 | | | | 116 | |
| | | | | | | |
Fund Balance, End of Year | | | 502 | | | | 383 | |
| | | | | | | |
| | |
B U D G E T 2 0 0 5 F i n a n c i a l R e v i e w a n d S t a t i s t i c s / B 2 3
|
| | SECTION 2 |
| | | |
n Capital Investment – Replacement Value of Public Assets
Over the years, Manitoba’s communities and the economy have benefited from many investments in general assets such as schools, health facilities and public service buildings as well as infrastructure assets such as roads, water control structures and parks. These assets have contributed to vital public services, including learning, health, physical and electronic access to other government programs as well as providing the infrastructure for economic and community development. The public good provided by these investments is immeasurable; however, it is estimated that the insured or replacement value of these investments is $23 billion.
Replacement Value of Public Assets1
Per cent of Total
| | |
B 2 4 / F i n a n c i a l R e v i e w a n d S t a t i s t i c s B U D G E T 2 0 0 5
|
n Capital Investment
Provincially owned capital assets such as highways, waterways, buildings, machinery and computer systems are amortized over their useful life based on established guidelines for amortization (see Appendix B of the 2005/06 Estimates of Expenditure). The amortization and interest costs are borne by departments that are responsible for each asset and are reflected as annual costs related to capital assets. Capital grants are also provided to third parties such as municipalities, schools and universities as contributions toward capital projects. In total, costs related to capital assets are estimated at $410 million in 2005/06, an increase of $5 million from 2004/05.
Authority for the annual cost to acquire provincially owned assets is reflected as Part B – Capital Investment which totals $226 million in 2005/06, an increase of $85 million from 2004/05, largely due to $56 million for floodway expansion and a $16 million increased investment in provincial roads and highways.
| | |
| | | |
| |
Capital Grants and Costs Related to Capital Assets, 2005/06
| | |
| (Thousands of Dollars) | | |
| | | | | | | | | |
| | | 2005/06 | | | 2004/05 | |
| | | Budget | | | Budget | |
| Capital Grants | | | 221,512 | | | | 219,001 | |
| Infrastructure Assets | | | 130,068 | | | | 130,512 | |
| General Assets | | | 57,941 | | | | 55,426 | |
| | | | | | | |
| | | | 409,521 | | | | 404,939 | |
| | | | | | | |
| | |
B U D G E T 2 0 0 5 F i n a n c i a l R e v i e w a n d S t a t i s t i c s / B 2 5
|
| | SECTION 2 |
| | | |
| |
Capital Investment, 2005/06
(Thousands of Dollars)
| | | | | | | | | |
| | | 2005/06 | | | 2004/05 | |
| | | Budget | | | Budget | |
General Assets | | | | | | | | |
| Government Services Capital Projects | | | 17,463 | | | | 14,600 | |
| Transportation Equipment and Other Capital | | | 16,820 | | | | 13,068 | |
| Information Technology Projects | | | | | | | | |
| Corporate Information Technology Projects | | | 10,500 | | | | 7,935 | |
| Advanced Education and Training | | | 3,538 | | | | 3,120 | |
| Family Services and Housing | | | 2,341 | | | | 2,300 | |
| Health | | | 3,583 | | | | 4,314 | |
| Justice | | | 1,038 | | | | 1,350 | |
| Other Projects | | | 891 | | | | 5,780 | |
| Other Equipment and Buildings | | | 2,590 | | | | 2,973 | |
| | | | | | | |
| | | | 58,764 | | | | 55,440 | |
| | | | | | | |
Infrastructure Assets | | | | | | | | |
| Manitoba Floodway Expansion | | | 56,100 | | | | — | |
| Provincial Roads and Highways | | | 94,918 | | | | 78,918 | |
| Water Stewardship Projects | | | 4,000 | | | | 4,016 | |
| Parks, Cottage and Camping Projects | | | 6,351 | | | | 2,658 | |
| Other Infrastructure Projects | | | 6,000 | | | | — | |
| | | | | | | |
| | | | 167,369 | | | | 85,592 | |
| | | | | | | |
Total Capital Investment | | | 226,133 | | | | 141,032 | |
| | | | | | | |
| | |
B 2 6 / F i n a n c i a l R e v i e w a n d S t a t i s t i c s B U D G E T 2 0 0 5
|
n Loan Act Requirements
The following table reflects expenditure authority to be included in The Loan Act, 2005.
| | |
| |
| |
Incremental Capital Authority Requirements for
Non-Budgetary Programs, 2005/06
| | |
| (Thousands of Dollars) |
| | | | | |
| The Loan Act, 2005 | | | | |
| | | | | |
| The Manitoba Hydro-Electric Board | | | 400,000 | |
| Health Capital Program | | | 132,597 | |
| Manitoba Opportunities Fund Ltd | | | 90,000 | |
| The University of Manitoba | | | 75,000 | |
| Manitoba Agricultural Credit Corporation | | | 65,221 | |
| Manitoba Student Financial Assistance Program | | | 16,490 | |
| Manitoba Housing and Renewal Corporation | | | 14,929 | |
| The Manitoba Water Services Board | | | 13,037 | |
| Special Operating Agencies Financing Authority - Fleet Vehicles Agency | | | 7,600 | |
| Communities Economic Development Fund | | | 6,910 | |
| Rural Economic Development Initiatives | | | 998 | |
| Manitoba Film Guarantee Program | | | 360 | |
| Manitoba Potash Corporation | | | 130 | |
| Diagnostic Services Manitoba | | | 61 | |
| International Education Program | | | 9 | |
| | | | |
| | | | 823,342 | |
| | | | |
| | |
| | | |
| |
Non-Budgetary Capital Program, 2005/06
| | |
| (Thousands of Dollars) |
| | | | | |
| The Manitoba Hydro-Electric Board | | | 645,000 | |
| Health Capital Program | | | 342,979 | |
| Manitoba Agricultural Credit Corporation | | | 119,350 | |
| Manitoba Opportunities Fund | | | 45,000 | |
| Manitoba Lotteries Corporation | | | 45,000 | |
| Manitoba Housing and Renewal Corporation | | | 40,365 | |
| Manitoba Student Financial Assistance Program | | | 39,177 | |
| Manitoba Industrial Opportunities Program | | | 35,500 | |
| The Manitoba Water Services Board | | | 26,477 | |
| Special Operating Agencies Financing Authority - Fleet Vehicles Agency | | | 11,795 | |
| Communities Economic Development Fund | | | 10,000 | |
| Diagnostic Services Manitoba | | | 7,701 | |
| Miscellaneous Corporations, Agencies and Other Programs | | | 12,084 | |
| | | | |
| | | | 1,380,428 | |
| | | | |
B U D G E T 2 0 0 5 F i n a n c i a l R e v i e w a n d S t a t i s t i c s / B 2 7
SECTION 2
Manitoba’s borrowing requirements for both general and self-sustaining purposes will total $2.5 billion in 2005/06, of which $2.1 billion is required for refunding. The remainder is required for capital investments including the Red River Floodway Expansion, and self-sustaining programs including Manitoba Hydro. Incremental capital authority requirements totaling $823 million are provided by The Loan Act, 2005.
Borrowing Requirements
(Thousands of Dollars)
| | | | | | | | | | | | | | | | | | | | | |
| | | Estimated | | | | | | | New Cash | | | Estimated | | | Borrowing | |
| | | Unfunded as at | | | Refunding | | | Requirements | | | Repayments | | | Requirements | |
| | | March 31, 2005 | | | 2005/06 | | | 2005/06 | | | 2005/06 | | | 2005/06 | |
| General Government Program Debt | | | — | | | | 1,553,228 | | | | — | | | | — | | | | 1,553,228 | |
| Capital Investments General Assets | | | — | | | | — | | | | 29,000 | | | | — | | | | 29,000 | |
| Capital Investments Infrastructure Assets | | | — | | | | — | | | | 97,800 | | | | — | | | | 97,800 | |
| Manitoba Hydro | | | 80,000 | | | | 243,127 | | | | 265,000 | | | | — | | | | 588,127 | |
| Manitoba Hospital Facilities | | | — | | | | 208,000 | | | | 27,000 | | | | 35,000 | | | | 200,000 | |
| Manitoba Lotteries Corporation | | | — | | | | — | | | | 30,000 | | | | 10,000 | | | | 20,000 | |
| Business Support Programs | | | — | | | | — | | | | 20,000 | | | | 10,000 | | | | 10,000 | |
| Manitoba Agricultural Credit Corporation | | | — | | | | — | | | | 75,000 | | | | 70,000 | | | | 5,000 | |
| Manitoba Student Financial Assistance | | | — | | | | — | | | | 39,177 | | | | 34,177 | | | | 5,000 | |
| Manitoba Housing and Renewal Corporation | | | — | | | | — | | | | 40,365 | | | | 35,365 | | | | 5,000 | |
| The Manitoba Water Services Board | | | — | | | | — | | | | 14,374 | | | | 9,374 | | | | 5,000 | |
| Communities Economic Development Fund | | | — | | | | — | | | | 10,000 | | | | 5,000 | | | | 5,000 | |
| Fleet Vehicles Agency | | | — | | | | — | | | | 8,076 | | | | 5,076 | | | | 3,000 | |
| Miscellaneous | | | — | | | | — | | | | 8,390 | | | | 8,390 | | | | — | |
| | | | | | | | | | | | | | | | |
| | | | 80,000 | | | | 2,004,355 | | | | 664,182 | | | | 222,382 | | | | 2,526,155 | |
| | | | | | | | | | | | | | | | |
B 2 8 / F i n a n c i a l R e v i e w a n d S t a t i s t i c s B U D G E T 2 0 0 5
Statement of Valuation and Purpose of Direct
and Guaranteed Debt Outstanding
(Thousands of Dollars) Unaudited
As at December 31, 2004 (with comparative figures for March 31, 2004)
| | | | | | | | | | | | | |
| | | Canadian Dollar | | | Canadian Dollar | | | Increase (Decrease) | |
| | | Valuation (Note 1) | | | Valuation (Note 1) | | | December 31/04 over | |
| | | December 31/04 | | | March 31/04 | | | March 31/04 | |
Direct Debt Payable in: | | | | | | | | | | | | |
| Canadian Dollars | | | 13,796,979 | | | | 13,120,739 | | | | 676,240 | |
| Issues Hedged to Canadian Dollars | | | 2,982,191 | | | | 3,210,936 | | | | (228,745 | ) |
| U.S. Dollars | | | 2,046,120 | | | | 2,227,850 | | | | (181,730 | ) |
| Issues Hedged to U.S. Dollars | | | 879,774 | | | | 957,913 | | | | (78,139 | ) |
| | | | | | | | | | |
| Total Direct Debt | | | 19,705,064 | | | | 19,517,438 | | | | 187,626 | |
| | | | | | | | | | |
| | | | | | | | | | | | | |
Guaranteed Debt Payable in: | | | | | | | | | | | | |
| Canadian Dollars | | | 713,589 | | | | 910,083 | | | | (196,494 | ) |
| U.S. Dollars | | | 0 | | | | 12,450 | | | | (12,450 | ) |
| | | | | | | | | | |
| Total Guaranteed Debt | | | 713,589 | | | | 922,533 | | | | (208,944 | ) |
| | | | | | | | | | |
| | | | | | | | | | | | | |
Total Direct and Guaranteed Debt (Note 2) | | | 20,418,653 | | | | 20,439,971 | | | | (21,318 | ) |
| Less: Sinking Fund Investments | | | 4,511,308 | | | | 4,580,312 | | | | (69,004 | ) |
| Less: Debt Retirement Fund | | | 0 | | | | 180,325 | | | | (180,325 | ) |
| | | | | | | | | | |
| | | | | | | | | | | | | |
Net Direct and Guaranteed Debt (Note 3) | | | 15,907,345 | | | | 15,679,334 | | | | 228,011 | |
| | | | | | | | | | |
| Note 1: | | The Canadian Dollar Valuation is calculated using the foreign currency exchange rates in effect at December 31, 2004 and at March 31, 2004. As at December 31, 2004, the U.S. dollar exchange rate was $1.2036 ($1.3105 at March 31, 2004) |
| |
| Note 2: | | Direct and Guaranteed Debt are payable in Canadian and U.S. dollars. As at December 31, 2004, total Gross Debt was payable 86% in Canadian dollars and 14% in U.S. dollars. Of this total, General Government Program Debt and Other Debt was 100% payable in Canadian dollars. Manitoba Hydro Debt was payable 60% in Canadian dollars (57% at March 31, 2004) and 40% in U.S. dollars (43% at March 31, 2004). |
| |
| Note 3: | | The above debt was issued for the following purposes: |
| | | | | | | | | | | | | | | | | | | | | | | | | |
| | | December 31, 2004 | | | | | March 31, 2004 | | | | |
| | | ($ Thousands) | | | ($ Per Capita) | | (Note 4) | | | ($ Thousands) | | ($ Per Capita) | | (Note 4) | | |
| General Government Programs | | | 6,574,499 | | | | 5,604 | | | | | | | | 6,545,810 | | | | 5,607 | | | | | |
| The Manitoba Hydro-Electric Board | | | 6,678,631 | | | | 5,693 | | | | | | | | 6,648,603 | | | | 5,695 | | | | | |
| Capital Investments | | | 351,667 | | | | 300 | | | | | | | | 321,284 | | | | 275 | | | | | |
| Manitoba Hospital Facilities | | | 522,000 | | | | 445 | | | | | | | | 499,000 | | | | 427 | | | | | |
| Government Enterprises and Other (5) | | | 484,359 | | | | 413 | | | | | | | | 477,642 | | | | 409 | | | | | |
| Other | | | 1,296,189 | | | | 1,105 | | | | | | | | 1,186,995 | | | | 1,017 | | | | | |
| | | | | | | | | | | | | | | | | | | | | |
| | | 15,907,345 | (Note 6) | | | 13,560 | | | | | | | | 15,679,334 | | | | 13,430 | | | | | |
| | | | | | | | | | | | | | | | | | | | | |
| Note 4: | | Per Capita data is based upon population figures at October 1, 2004 and April 1, 2004 as reported by Statistics Canada. |
| |
| Note 5: | | In 2003/04, the province, in accordance with Canadian GAAP, changed its accounting treatment for certain amounts owed to the federal government and for debentures issued by certain school boards and hospitals, the debt service of which is paid with future grants from the government. Amounts owed to the federal government over time, which were previously treated as accounts payable are now accounted for as loans payable. Debentures issued by school boards and hospitals, were previously recognized as an expense over the life of the debentures as grants for debt service were made and were held by the Provincial Sinking Fund and Manitoba Public Insurance (MPI), (a Crown corporation). Now the obligation to fund debt principal repayments is expensed in full at the time the debenture is issued. Any of these debentures held by MPI are recorded as “Loans Payable to Government Enterprises.” The government also recognized a loan payable in respect of the pension liability of the Manitoba Liquor Control Commission. |
| |
| Note 6: | | General Government Program Debt increased by $28.7 million due to the funding of disaster-related items offset by the annual contribution to the Debt Retirement Fund and matured debt not yet funded. All other debt increased $199.3 million due to the continued consolidation of hospital facilities debt on to the province’s records, Provincial Part B Capital requirements, an increase in loans payable to MPI for School Division debentures purchased and Manitoba Hydro’s new capital requirements offset by a net increase in Manitoba Hydro’s sinking fund together with the impact of a stronger Canadian dollar. Manitoba Hydro’s U.S. dollar revenues are sufficient to pay the interest and principal on all outstanding U.S. dollar debt. |
B U D G E T 2 0 0 5 F i n a n c i a l R e v i e w a n d S t a t i s t i c s / B 2 9
SECTION 2
Direct and Guaranteed Debt
Net Maturities to March 31, 2044
| | | | | | | | | | | | | | | | | |
| | | Canadian Valuation Payable In | | |
| | | Canadian | | | U.S. | | | Net | |
| | | Dollars | | | Dollars | | | Maturities | |
| | | (Millions of Dollars) | |
| 2004/05 | | | 84 | | | | | | | | — | | | | 84 | |
| 2005/06 | | | 1,711 | | | | | | | | 243 | | | | 1,954 | |
| 2006/07 | | | 1,131 | | | | | | | | 602 | | | | 1,733 | |
| 2007/08 | | | 1,718 | | | | | | | | — | | | | 1,718 | |
| 2008/09 | | | 1,774 | | | | | | | | — | | | | 1,774 | |
| 2009/10 | | | 378 | | | | | | | | 317 | | | | 695 | |
| 2010/11 | | | 641 | | | | | | | | 57 | | | | 698 | |
| 2011/12 | | | 405 | | | | | | | | — | | | | 405 | |
| 2013 - 17 | | | 2,062 | | | | | | | | 407 | | | | 2,469 | |
| 2018 - 22 | | | 1,095 | | | | | | | | 843 | | | | 1,938 | |
| 2023 - 27 | | | 300 | | | | | | | | — | | | | 300 | |
| 2028 - 44 | | | 1,704 | | | | | | | | — | | | | 1,704 | |
| Treasury Bills and Promissory Notes | | | 435 | | | | | | | | — | | | | 435 | |
| | | | | | | | | | | | | | |
| | | | 13,438 | | | | | | | | 2,469 | | | | 15,907 | |
| | | | | | | | | | | | | | |
The above table is based on foreign exchange rates at December 31, 2004.
B 3 0 / F i n a n c i a l R e v i e w a n d S t a t i s t i c s B U D G E T 2 0 0 5
Manitoba Financial Statistics, Ten-Year Summary
| | | | | | | | | | | | | | | | | | | | | |
| | | 2005/06 | | | 2004/054 | | | 2003/04 | | | 2002/034 | | | 2001/02 | |
| | | Budget | | | Forecast | | | Actual | | | Actual | | | Actual | |
| | | |
| | | (Millions of Dollars) | |
FINANCIAL STATEMENTS | | | | | | | | | | | | | | | | | | | | |
Revenue | | | | | | | | | | | | | | | | | | | | |
Own-Source Revenue1 | | | 5,381 | | | | 5,286 | | | | 4,874 | | | | 4,874 | 2 | | | 4,623 | |
| Federal Transfers | | | 2,796 | | | | 2,918 | | | | 2,515 | | | | 2,230 | | | | 2,207 | |
| | | | | | | | | | | | | | | | |
| Total | | | 8,177 | | | | 8,204 | | | | 7,389 | | | | 7,104 | | | | 6,829 | |
| | | | | | | | | | | | | | | | |
Expenditure | | | | | | | | | | | | | | | | | | | | |
Program Expenditure1 | | | 7,795 | | | | 7,554 | | | | 7,212 | | | | 6,705 | | | | 6,407 | |
Public Debt Costs4 | | | 269 | | | | 237 | | | | 311 | | | | 321 | | | | 414 | |
| | | | | | | | | | | | | | | | |
| Total | | | 8,064 | | | | 7,791 | | | | 7,522 | | | | 7,026 | | | | 6,820 | |
| | | | | | | | | | | | | | | | |
| | | | | | | | | | | | | | | | | | | | | |
Net Revenue/(Expenditure) | | | 113 | | | | 413 | | | | (133 | ) | | | 78 | | | | 9 | |
| | | | | | | | | | | | | | | | | | | | | |
Emergency/Extraordinary Items | | | | | | | | | | | 71 | 5 | | | | | | | | |
| | | | | | | | | | | | | | | | | | | | | |
Debt/Pension Repayment | | | (110 | ) | | | (99 | ) | | | (96 | ) | | | (96 | ) | | | (96 | ) |
| | | | | | | | | | | | | | | | | | | | | |
Transfers from/(to) Fiscal Stabilization Fund | | | 0 | | | | 0 | | | | 171 | | | | 22 | | | | 150 | |
| | | | | | | | | | | | | | | | |
| | | | | | | | | | | | | | | | | | | | | |
Balance under Balanced Budget Legislation | | | 3 | | | | 314 | | | | 13 | | | | 4 | | | | 63 | |
| | | | | | | | | | | | | | | | |
| | | | | | | | | | | | | | | | | | | | | |
Net Direct and Guaranteed Debt | | | | | | | | | | | | | | | | | | | | |
General Purpose6 | | | 6,591 | | | | 6,594 | | | | 6,546 | | | | 6,355 | | | | 6,406 | |
| Manitoba Hydro | | | 6,892 | | | | 6,726 | | | | 6,649 | | | | 6,344 | | | | 6,263 | |
| Other | | | 1,401 | | | | 1,343 | | | | 1,187 | | | | 1,116 | | | | 1,099 | |
| Health Facilities | | | 584 | | | | 542 | | | | 499 | | | | 445 | | | | 390 | |
Government Enterprises and Other6 | | | 468 | | | | 498 | | | | 478 | | | | 0 | | | | 0 | |
| Capital Investments | | | 490 | | | | 363 | | | | 321 | | | | 295 | | | | 245 | |
| | | | | | | | | | | | | | | | |
| Total | | | 16,425 | | | | 16,066 | | | | 15,679 | | | | 14,554 | | | | 14,403 | |
| | | | | | | | | | | | | | | | |
| | | | | | | | | | | | | | | | | | | | | |
Other Obligations | | | | | | | | | | | | | | | | | | | | |
| Pension Liability | | | 3,973 | | | | 3,787 | | | | 3,571 | | | | 3,411 | | | | 3,217 | |
| Pension Assets | | | (502 | ) | | | (383 | ) | | | (267 | ) | | | (151 | ) | | | (107 | ) |
| | | | | | | | | | | | | | | | |
| Net Pension Liability | | | 3,471 | | | | 3,404 | | | | 3,304 | | | | 3,260 | | | | 3,110 | |
| | | | | | | | | | | | | | | | |
| Health Debt | | | 180 | | | | 100 | | | | 116 | | | | 195 | | | | 225 | |
| | | | | | | | | | | | | | | | |
| Total | | | 3,651 | | | | 3,504 | | | | 3,420 | | | | 3,455 | | | | 3,335 | |
| | | | | | | | | | | | | | | | |
Total Obligations | | | 20,076 | | | | 19,550 | | | | 19,099 | | | | 18,009 | | | | 17,738 | |
| | | | | | | | | | | | | | | | |
| | | | | | | | | | | | | | | | | | | | | |
Fiscal Stabilization Fund End-of-Year Balance | | | 409 | | | | 395 | | | | 79 | | | | 236 | | | | 247 | |
| Note 1: | | Own-Source Revenue and Program Expenditure have been restated by equal amounts to reflect reconfiguration of Provincial- Municipal Tax Sharing. |
| |
| Note 2: | | Includes $150 million Manitoba Hydro Special Payment profits on export sales 2001/02, and $51.1 million adjustment for federal accounting error. |
| |
| Note 3: | | Net gain from divestiture of Manitoba Telephone System – $264.6 million. |
B U D G E T 2 0 0 5 F i n a n c i a l R e v i e w a n d S t a t i s t i c s / B 3 1
SECTION 3
| | | | | | | | | | | | | | | | | | | |
| 2000/01 | | 1999/00 | | | 1998/99 | | | 1997/98 | | | 1996/97 | | | |
| Actual | | Actual | | | Actual | | | Actual | | | Actual | | | |
| (Millions of Dollars) | | | |
| | | | | | | | | | | | | | | | | | | FINANCIAL STATEMENTS |
| | | | | | | | | | | | | | | | | | | Revenue |
| 4,739 | | | 4,334 | | | | 4,393 | | | | 3,920 | | | | 4,107 | 3 | | Own-Source Revenue1 |
| 2,091 | | | 2,073 | | | | 1,560 | | | | 1,884 | | | | 1,716 | | | Federal Transfers |
| | | | | | | | | | | | | |
| 6,830 | | | 6,408 | | | | 5,953 | | | | 5,804 | | | | 5,823 | | | Total |
| | | | | | | | | | | | | |
| | | | | | | | | | | | | | | | | | | Expenditure |
| 6,181 | | | 6,042 | | | | 5,443 | | | | 5,232 | | | | 4,929 | | | Program Expenditure1 |
| 511 | | | 465 | | | | 515 | | | | 520 | | | | 539 | | | Public Debt Costs4 |
| | | | | | | | | | | | | |
| 6,693 | | | 6,506 | | | | 5,957 | | | | 5,752 | | | | 5,468 | | | Total |
| | | | | | | | | | | | | |
| | | | | | | | | | | | | | | | | | | |
| 137 | | | (99 | ) | | | (5 | ) | | | 51 | | | | 355 | | | Net Revenue/(Expenditure) |
| | | | | | | | | | | | | | | | | | | |
| | | | | | | | | | | | | | | | | | | Emergency/Extraordinary Items |
| | | | | | | | | | | | | | | | | | | |
| (96 | ) | | (75 | ) | | | (150 | ) | | | (75 | ) | | | 0 | | | Debt/Pension Repayment |
| | | | | | | | | | | | | | | | | | | |
| 0 | | | 185 | | | | 186 | | | | 100 | | | | (264 | ) | | Transfers from/(to) Fiscal Stabilization Fund |
| | | | | | | | | | | | | |
| | | | | | | | | | | | | | | | | | | |
| 41 | | | 11 | | | | 31 | | | | 76 | | | | 91 | | | Balance under Balanced Budget Legislation |
| | | | | | | | | | | | | |
| | | | | | | | | | | | | | | | | | | |
| | | | | | | | | | | | | | | | | | | Net Direct and Guaranteed Debt |
| 6,537 | | | 6,473 | | | | 6,632 | | | | 6,773 | | | | 6,808 | | | General Purpose6 |
| 6,053 | | | 5,798 | | | | 5,677 | | | | 5,569 | | | | 4,893 | | | Manitoba Hydro |
| 1,086 | | | 943 | | | | 948 | | | | 976 | | | | 1,212 | | | Other |
| 220 | | | 0 | | | | 0 | | | | 0 | | | | 0 | | | Health Facilities |
| 0 | | | 0 | | | | 0 | | | | 0 | | | | 0 | | | Government Enterprises and Other6 |
| 260 | | | 245 | | | | 142 | | | | 0 | | | | 0 | | | Capital Investments |
| | | | | | | | | | | | | |
| 14,156 | | | 13,459 | | | | 13,398 | | | | 13,318 | | | | 12,913 | | | Total |
| | | | | | | | | | | | | |
| | | | | | | | | | | | | | | | | | | |
| | | | | | | | | | | | | | | | | | | Other Obligations |
| 3,050 | | | 2,906 | | | | 2,766 | | | | 2,572 | | | | 2,182 | | | Pension Liability |
| (21 | ) | | 0 | | | | 0 | | | | 0 | | | | 0 | | | Pension Assets |
| | | | | | | | | | | | | |
| 3,029 | | | 2,906 | | | | 2,766 | | | | 2,572 | | | | 2,182 | | | Net Pension Liability |
| | | | | | | | | | | | | |
| 359 | | | 501 | | | | 450 | | | | 461 | | | | 438 | | | Health Debt |
| | | | | | | | | | | | | |
| 3,387 | | | 3,407 | | | | 3,216 | | | | 3,033 | | | | 2,620 | | | Total |
| | | | | | | | | | | | | |
| 17,543 | | | 16,866 | | | | 16,614 | | | | 16,351 | | | | 15,533 | | | Total Obligations |
| | | | | | | | | | | | | |
| | | | | | | | | | | | | | | | | | | |
| 320 | | | 264 | | | | 427 | | | | 565 | | | | 578 | | | Fiscal Stabilization Fund End-of-Year Balance |
| Note 4: | | Effective from fiscal year 2002/03 interest carrying-costs of capital assets (then worth $20 million) are included in departmental expenditures, and from fiscal year 2004/05 interest carrying-costs of infrastructure assets (additional $60 million) are included in departmental expenditures. |
| |
| Note 5: | | Under BBL, disaster-related expenditures may be written directly to accumulated deficit. In 2003/04, the effect of the BSE crisis, drought and forest fires required extraordinary emergency expenditures to which this provision applies. |
| |
| Note 6: | | See note and table on page B37. |
B 3 2 / F i n a n c i a l R e v i e w a n d S t a t i s t i c s B U D G E T 2 0 0 5
Manitoba Financial Statistics, Ten-Year Summary
| | | | | | | | | | | | | | | | | | | | | |
| | | 2005/06 | | | 2004/05 | | | 2003/04 | | | 2002/03 | | | 2001/02 | |
| | | Budget | | | Forecast | | | Actual | | | Actual | | | Actual | |
| | | |
| Annual Change | | (Percentage Change)
|
| Own-Source Revenue | | | 1.8 | | | | 8.5 | | | | 0.0 | | | | 5.4 | | | | (2.4 | ) |
| Federal Transfers | | | (4.2 | ) | | | 16.0 | | | | 12.8 | | | | 1.0 | | | | 5.5 | |
| Total Revenue | | | (0.3 | ) | | | 11.0 | | | | 4.0 | | | | 4.0 | | | | (0.0 | ) |
| Program Expenditure | | | 3.2 | | | | 4.7 | | | | 7.6 | | | | 4.7 | | | | 3.7 | |
| Public Debt Costs | | | 13.5 | | | | (23.8 | ) | | | (3.1 | ) | | | (22.5 | ) | | | (19.0 | ) |
| Total Expenditure | | | 3.5 | | | | 3.6 | | | | 7.1 | | | | 3.0 | | | | 1.9 | |
| Net General Purpose Debt | | | (0.0 | ) | | | 0.7 | | | | 3.0 | | | | (0.8 | ) | | | (2.0 | ) |
| Total Net Debt | | | 2.2 | | | | 2.5 | | | | 7.7 | | | | 1.0 | | | | 1.7 | |
| Net Pension Liability | | | 2.6 | | | | 2.4 | | | | 1.3 | | | | 4.8 | | | | 2.7 | |
| | | | | | | | | | | | | | | | | | | | | |
| Per cent of GDP | | (Per cent)
|
| Own-Source Revenue | | | 12.9 | | | | 13.2 | | | | 12.8 | | | | 13.2 | | | | 13.2 | |
| Total Revenue | | | 19.6 | | | | 20.4 | | | | 19.4 | | | | 19.3 | | | | 19.4 | |
| Program Expenditure | | | 18.7 | | | | 18.8 | | | | 18.9 | | | | 18.2 | | | | 18.2 | |
| Public Debt Costs | | | 0.6 | | | | 0.6 | | | | 0.8 | | | | 0.9 | | | | 1.2 | |
| Total Expenditure | | | 19.3 | | | | 19.4 | | | | 19.8 | | | | 19.1 | | | | 19.4 | |
| Balance under Balanced Budget Legislation | | | 0.0 | | | | 0.8 | | | | 0.0 | | | | 0.0 | | | | 0.2 | |
| Net General Purpose Debt | | | 15.8 | | | | 16.4 | | | | 17.2 | | | | 17.2 | | | | 18.2 | |
| | | | | | | | | | | | | | | | | | | | | |
Per cent of Revenue | | | | | | | | | | | | | | | | | | | | |
| Own-Source Revenue | | | 65.8 | | | | 64.4 | | | | 66.0 | | | | 68.6 | | | | 67.7 | |
| Federal Transfers | | | 34.2 | | | | 35.6 | | | | 34.0 | | | | 31.4 | | | | 32.3 | |
| Public Debt Costs | | | 3.3 | | | | 2.9 | | | | 4.2 | | | | 4.5 | | | | 6.1 | |
| Net General Purpose Debt | | | 80.6 | | | | 80.4 | | | | 88.6 | | | | 89.5 | | | | 93.8 | |
| | | | | | | | | | | | | | | | | | | | | |
Per cent of Expenditure | | | | | | | | | | | | | | | | | | | | |
| Program Expenditure | | | 96.7 | | | | 97.0 | | | | 95.9 | | | | 95.4 | | | | 93.9 | |
| Public Debt Costs | | | 3.3 | | | | 3.0 | | | | 4.1 | | | | 4.6 | | | | 6.1 | |
| Balance under Balanced Budget Legislation | | | 0.0 | | | | 4.0 | | | | 0.2 | | | | 0.1 | | | | 0.9 | |
| | | | | | | | | | | | | | | | | | | | | |
| Dollars Per Capita | | (Dollars)
|
| Total Expenditure | | | 6,863 | | | | 6,659 | | | | 6,473 | | | | 6,078 | | | | 5,925 | |
| Public Debt Costs | | | 229 | | | | 203 | | | | 268 | | | | 278 | | | | 360 | |
| Balance under Balanced Budget Legislation | | | 3 | | | | 268 | | | | 11 | | | | 3 | | | | 55 | |
| Net General Purpose Debt | | | 5,609 | | | | 5,636 | | | | 5,633 | | | | 5,497 | | | | 5,566 | |
| | | | | | | | | | | | | | | | | | | | | |
Memorandum Items | | | | | | | | | | | | | | | | | | | | |
| Population (000’s) | | | 1,175 | | | | 1,170 | | | | 1,162 | | | | 1,156 | | | | 1,151 | |
| GDP at Market Prices | | | 41,750 | | | | 40,181 | | | | 38,074 | | | | 36,859 | | | | 35,149 | |
Source: Manitoba Department of Finance
B U D G E T 2 0 0 5 F i n a n c i a l R e v i e w a n d S t a t i s t i c s / B 3 3
SECTION 3
| | | | | | | | | | | | | | | | | | | |
| 2000/01 | | 1999/00 | | | 1998/99 | | | 1997/98 | | | 1996/97 | | | |
| Actual | | Actual | | | Actual | | | Actual | | | Actual | | | |
| | | | | |
(Percentage Change)
| | Annual Change |
| 9.3 | | | (1.3 | ) | | | 12.1 | | | | (4.6 | ) | | | 7.0 | | | Own-Source Revenue |
| 0.9 | | | 32.9 | | | | (17.2 | ) | | | 9.8 | | | | (8.4 | ) | | Federal Transfers |
| 6.6 | | | 7.6 | | | | 2.6 | | | | (0.3 | ) | | | 1.9 | | | Total Revenue |
| 2.3 | | | 11.0 | | | | 4.0 | | | | 6.1 | | | | (0.7 | ) | | Program Expenditure |
| 9.9 | | | (9.7 | ) | | | (1.0 | ) | | | (3.5 | ) | | | (9.0 | ) | | Public Debt Costs |
| 2.9 | | | 9.2 | | | | 3.6 | | | | 5.2 | | | | (1.6 | ) | | Total Expenditure |
| 1.0 | | | (2.4 | ) | | | (2.1 | ) | | | (0.5 | ) | | | (0.1 | ) | | Net General Purpose Debt |
| 5.2 | | | 0.5 | | | | 0.6 | | | | 3.1 | | | | (5.6 | ) | | Total Net Debt |
| 4.2 | | | 5.1 | | | | 7.5 | | | | 17.9 | | | | 7.0 | | | Net Pension Liability |
| | | | | | | | | | | | | | | | | | | |
(Per cent)
| | Per cent of GDP |
| 13.9 | | | 13.6 | | | | 14.2 | | | | 13.2 | | | | 14.5 | | | Own-Source Revenue |
| 20.1 | | | 20.1 | | | | 19.2 | | | | 19.5 | | | | 20.5 | | | Total Revenue |
| 18.2 | | | 18.9 | | | | 17.6 | | | | 17.6 | | | | 17.4 | | | Program Expenditure |
| 1.5 | | | 1.5 | | | | 1.7 | | | | 1.7 | | | | 1.9 | | | Public Debt Costs |
| 19.7 | | | 20.4 | | | | 19.2 | | | | 19.4 | | | | 19.2 | | | Total Expenditure |
| 0.1 | | | 0.0 | | | | 0.1 | | | | 0.3 | | | | 0.3 | | | Balance under Balanced Budget Legislation |
| 19.2 | | | 20.3 | | | | 21.4 | | | | 22.8 | | | | 24.0 | | | Net General Purpose Debt |
| | | | | | | | | | | | | | | | | | | |
| | | | | | | | | | | | | | | | | | | Per cent of Revenue |
| 69.4 | | | 67.6 | | | | 73.8 | | | | 67.5 | | | | 70.5 | | | Own-Source Revenue |
| 30.6 | | | 32.4 | | | | 26.2 | | | | 32.5 | | | | 29.5 | | | Federal Transfers |
| 7.5 | | | 7.3 | | | | 8.7 | | | | 9.0 | | | | 9.3 | | | Public Debt Costs |
| 95.7 | | | 101.0 | | | | 111.4 | | | | 116.7 | | | | 116.9 | | | Net General Purpose Debt |
| | | | | | | | | | | | | | | | | | | |
| | | | | | | | | | | | | | | | | | | Per cent of Expenditure |
| 92.4 | | | 92.9 | | | | 91.4 | | | | 91.0 | | | | 90.1 | | | Program Expenditure |
| 7.6 | | | 7.1 | | | | 8.6 | | | | 9.0 | | | | 9.9 | | | Public Debt Costs |
| 0.6 | | | 0.2 | | | | 0.5 | | | | 1.3 | | | | 1.7 | | | Balance under Balanced Budget Legislation |
| | | | | | | | | | | | | | | | | | | |
(Dollars)
| | Dollars Per Capita |
| 5,835 | | | 5,692 | | | | 5,235 | | | | 5,063 | | | | 4,822 | | | Total Expenditure |
| 446 | | | 407 | | | | 453 | | | | 458 | | | | 475 | | | Public Debt Costs |
| 36 | | | 10 | | | | 27 | | | | 67 | | | | 80 | | | Balance under Balanced Budget Legislation |
| 5,699 | | | 5,663 | | | | 5,828 | | | | 5,962 | | | | 6,004 | | | Net General Purpose Debt |
| | | | | | | | | | | | | | | | | | | |
| | | | | | | | | | | | | | | | | | | Memorandum Items |
| 1,147 | | | 1,143 | | | | 1,138 | | | | 1,136 | | | | 1,134 | | | Population (000’s) |
| 34,042 | | | 31,940 | | | | 30,946 | | | | 29,725 | | | | 28,408 | | | GDP at Market Prices |
B 3 4 / F i n a n c i a l R e v i e w a n d S t a t i s t i c s B U D G E T 2 0 0 5
Total Expenditure by Province, 2004/05
Sources: Statistics Canada and provincial
mid-year financial statements
Program Expenditure by Province, 2004/05
Sources: Statistics Canada and provincial
mid-year financial statements
| n | Manitoba’s Relative Position Among Provinces |
Manitoba continues to maintain its reputation for fiscal responsibility. The province’s measured approach to balancing the budget (under both BBL and the summary financial statement), managing its debt and pension liabilities, and dealing with cost pressures in health and other key program areas has been acknowledged by the financial industry and credit rating agencies. Since 1999, Manitoba has received upgrades in its credit ratings from Moody’s Investors Service and DBRS.
Manitoba has one of the most efficient and cost effective governments in Canada. As the adjoining charts indicate, per capita total expenditure was second-lowest and per capita program expenditure was fifth-lowest among provinces in 2004/05.
Since 1999, Manitoba has made a conscious effort to reduce its debt. In 1999/2000, the debt payment made by the province was $75 million. This year, the province will once again increase its annual payments from $96 million to $110 million.
Comparing debt levels among provinces is difficult because provinces report debt differently. An independent measure of provincial tax-supported debt is provided by DBRS. DBRS attempts to measure debt on a standardized basis, with debt defined broadly as tax-supported debt plus unfunded pension liabilities, less sinking funds
B U D G E T 2 0 0 5 F i n a n c i a l R e v i e w a n d S t a t i s t i c s / B 3 5
SECTION 3
and internal holdings. For 2004/05, DBRS measured Manitoba’s debt to GDP ratio at 33.9%, fifth among provinces and down from 38.7% in 1999/2000. Manitoba has one of the lowest debt servicing costs among provinces.
Despite fiscal pressures, Manitoba is committed to providing necessary funding to priority expenditure areas. The strength in Manitoba’s fiscal performance provides needed fiscal room for the province to be better able to maintain its commitments to major health and social programs than would otherwise be the case. In fact, in 2004/05, Manitoba’s per capita health expenditures were 5.2% above the provincial average and fourth-highest among provinces.
NOTE: Interprovincial comparisons of expenditure are based on provincial mid-year financial statements. Since not all provincial governments will have tabled their budgets prior to publication, the pre-budget estimates were used for all provinces to ensure comparability.
Health Expenditure by Province, 2004/05
Sources: Statistics Canada and provincial
mid-year financial statements
Debt to GDP Ratio by Province 2004/05
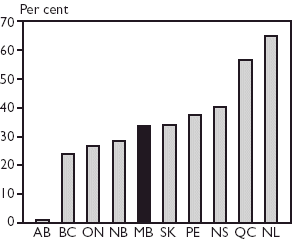
Sources: Dominion Bond Rating Service and Statistics Canada
B 3 6 / F i n a n c i a l R e v i e w a n d S t a t i s t i c s B U D G E T 2 0 0 5
| n | Improving Transparency and Accountability |
The government continues to adhere to and respect the provincial legislature and the legislation it has passed, while making strides to improve transparency concerning its operations. With respect to the latter, the summary financial statements have kept pace with GAAP as outlined by the Public Sector Accounting Standards Board (PSAB) of the Canadian Institute of Chartered Accountants.
The government has been assisted by the recommendations of the Auditor General. His recommendation to combine the summary financial statements into one volume so that their interrelationships would be more transparent was adopted in the current Administration’s first set of Public Accounts for 1999/2000. Following on the Auditor General’s further recommendations, the government began issuing comprehensive annual reports in 2000/01, and fulfilled the commitment to provide more comprehensive reporting on the government’s fiscal results. These reports include not only financial statements, but also discussion and analysis. Further, they include financial and economic indicators for the government’s central operations, as well as for the entire government reporting entity.
Over the past several years, improvements in financial reporting include:
| • | the recognition of unfunded liability for future benefits for employees of non-devolved health care facilities |
| • | the introduction of commentary on environmental issues, improved notes and schedules |
| • | revised treatment of capital funding to schools and hospitals |
| • | quantification of GAAP exceptions |
| • | revised treatment of the Liquor Control Commission’s net profits (now determined in accordance with GAAP for the first time) |
| • | improved disclosure in a large number of technical areas, bringing government’s accounting practices closer to full compliance with GAAP for public sector |
These improved reporting practices results in significant impacts on reported government results.
The following chart shows the effect of the changes on debt if restated retroactively to the affected years.
BUDGET 2005 F i n a n c i a l R e v i e w a n d S t a t i s t i c s / B 3 7
SECTION 4
Impact of Accounting Policy Changes on
General Purpose Government Enterprises and Other Debt
| | | | | | | | | | | | | | | | | | | | | | | | | | | | | |
| | | 2005/ | | | 2004/ | | | 2003/ | | | 2002/ | | | 2001/ | | | 2000/ | | | 1999/ | |
| | | 2006b | | | 2005f | | | 2004a | | | 2003a | | | 2002a | | | 2001a | | | 2000a | |
| | | (Millions of Dollars) | |
| General Purpose (page B30) | | | 6,591 | | | | 6,594 | | | | 6,546 | | | | 6,355 | | | | 6,406 | | | | 6,537 | | | | 6,473 | |
| School Facilities | | | — | | | | — | | | | — | | | | 181 | | | | 162 | | | | 154 | | | | 146 | |
| Health Facilities | | | — | | | | — | | | | — | | | | 45 | | | | 44 | | | | 47 | | | | 47 | |
| | | | | | | | | | | | | | | | | | | | | | |
| Restated General Purpose | | | 6,591 | | | | 6,594 | | | | 6,546 | | | | 6,580 | | | | 6,612 | | | | 6,739 | | | | 6,666 | |
| |
| Restated General Purpose Debt/GDP | | | 15.8 | % | | | 16.4 | % | | | 17.2 | % | | | 17.9 | % | | | 18.8 | % | | | 19.8 | % | | | 20.9 | % |
| |
| Government Enterprises and Other (page B30) | | | 468 | | | | 498 | | | | 478 | | | | — | | | | — | | | | — | | | | — | |
| School Facilities | | | — | | | | — | | | | — | | | | 253 | | | | 247 | | | | 234 | | | | 222 | |
| Hospital Facilities | | | — | | | | — | | | | — | | | | 25 | | | | 26 | | | | 28 | | | | 29 | |
| Federal Government | | | — | | | | — | | | | — | | | | 91 | | | | 91 | | | | 287 | | | | 133 | |
| MLCC | | | — | | | | — | | | | — | | | | 44 | | | | 42 | | | | 39 | | | | 37 | |
| | | | | | | | | | | | | | | | | | | | | | |
| Restated Government Enterprises and Other | | | 468 | | | | 498 | | | | 478 | | | | 414 | | | | 406 | | | | 587 | | | | 421 | |
| | | | | | | | | | | | | | | | | | | | | | |
b - Budget f - Forcast a - - Actual
On a restated basis, General Purpose Debt has declined by $75 million since 1999/2000.
Debt in relation to Government Enterprises and Other has increased by $46 million.
n Capital Acquisitions and Infrastructure Capitalization
The government introduced budgetary measures for considering the full cost of capital assets in program costs, and is now in full compliance with the capital asset accounting practices prescribed by the PSAB. The budget for the acquisition cost of general assets has been reflected in Part B of the Estimates since 1999/2000, and the related annual amortization costs have been voted as part of departmental appropriations. In 2002/03, the interest cost relating to small capital acquisitions was also included in department program costs. In 2004/05, Manitoba introduced a capitalization policy for its infrastructure assets. This has resulted in the full cost of capital acquisitions being included in overall departmental program costs, providing for greater departmental accountability for capital expenditures. By way of explanation, general tangible capital assets are consumed by government in providing government services, and use is usually restricted to government purposes, for example, buildings and computer equipment. Infrastructure assets are assets which are consumed by the general public and whose access is generally not restricted such as roads and parks.
n Pension Accounting
Departments began funding the cost of matching pension contributions for employees hired on or after October 1, 2002 from their appropriations. This funding is being directed to the PAF, in addition to other contributions being made through the DRF. The cost of the pension benefits thus begins to be reflected in the various programs across government. It also accelerates the government’s plan to address the outstanding pension liability.