Exhibit 99.1
BUDGET 2011 / 1
SUMMARY BUDGET 2011/12
2 / BUDGET 2011
SUMMARY BUDGET
For the Fiscal Year Ending March 31, 2012
With Comparative Data for the year ending March 31, 2011
| | | | | | | | | | | | | | | | | | | | | |
| | | | | | | | | | | | | | | Per cent Change |
| | | | | | | | | | | | | | | 2011/12 Budget from |
| | | 2011/12 | | 2010/11 | | 2010/11 | | 2010/11 | | 2010/11 |
| | | Budget | | Forecast | | Budget | | Forecast | | Budget |
| | | (Millions of Dollars) | | | | | | | | |
REVENUE SOURCE | | | | | | | | | | | | | | | | | | | | |
| Income Taxes | | | 3,148 | | | | 2,916 | | | | 2,667 | | | | 8.0 | % | | | 18.0 | % |
| Other Taxes | | | 3,510 | | | | 3,404 | | | | 3,385 | | | | 3.1 | % | | | 3.7 | % |
| Fees and Other Revenue | | | 1,771 | | | | 1,745 | | | | 1,765 | | | | 1.5 | % | | | 0.3 | % |
| Federal Transfers | | | 3,945 | | | | 4,086 | | | | 4,064 | | | | (3.5 | %) | | | (2.9 | %) |
| Net Income of Government Business Enterprises | | | 781 | | | | 752 | | | | 699 | | | | 3.9 | % | | | 11.7 | % |
| Sinking Funds and Other Earnings | | | 239 | | | | 227 | | | | 217 | | | | 5.3 | % | | | 10.1 | % |
| | | | | | | | | | | | | | | | | | | | | |
TOTAL REVENUE | | | 13,394 | | | | 13,130 | | | | 12,797 | | | | 2.0 | % | | | 4.7 | % |
| | | | | | | | | | | | | | | | | | | | | |
EXPENDITURE SECTORS | | | | | | | | | | | | | | | | | | | | |
| Health and Healthy Living | | | 5,387 | | | | 5,125 | | | | 5,100 | | | | 5.1 | % | | | 5.6 | % |
| Education | | | 3,560 | | | | 3,406 | | | | 3,447 | | | | 4.5 | % | | | 3.3 | % |
| Family Services and Consumer Affairs | | | 1,402 | | | | 1,392 | | | | 1,323 | | | | 0.7 | % | | | 6.0 | % |
| Community, Economic and Resource Development | | | 1,908 | | | | 1,944 | | | | 1,821 | | | | (1.9 | %) | | | 4.8 | % |
| Justice and Other Expenditures | | | 910 | | | | 1,027 | | | | 940 | | | | (11.4 | %) | | | (3.2 | %) |
| Debt Servicing Costs | | | 807 | | | | 762 | | | | 776 | | | | 5.9 | % | | | 4.0 | % |
| | | | | | | | | | | | | | | | | | | | | |
TOTAL EXPENDITURE | | | 13,974 | | | | 13,656 | | | | 13,407 | | | | 2.3 | % | | | 4.2 | % |
| In-Year Adjustments/Lapse | | | (145 | ) | | | (70 | ) | | | (65 | ) | | | | | | | | |
| | | | | | | | | | | | | | | | | | | | | |
Net Result for the Year | | | (435 | ) | | | (456 | ) | | | (545 | ) | | | | | | | | |
2011 Spring Flood Contingency | | | | | | | | | | | | | | | | | | | | |
| Expenditures | | | (30 | ) | | | (11 | ) | | | — | | | | | | | | | |
| Recovery from Disaster Financial Assistance | | | 27 | | | | — | | | | — | | | | | | | | | |
| | | | | | | | | | | | | | | | | | | | | |
Total 2011 Spring Flood Contingency | | | (3 | ) | | | (11 | ) | | | — | | | | | | | | | |
| | | | | | | | | | | | | | | | | | | | | |
NET INCOME (LOSS) | | | (438 | ) | | | (467 | ) | | | (545 | ) | | | | | | | | |
| | | | | | | | | | | | | | | | | | | | | |
| • | | The 2010/11 Budget numbers originally presented in the 2010 Budget Address and the 2010/11 forecast from the Third Quarter Financial Report have been restated to be consistent with the current presentation for the GRE. |
| |
| • | | Details of Expenditure and Revenue for Fiscal Year 2011/12, and a reconciliation to the amounts reported for core government are found in Schedules 1 and 2. |
| |
| • | | In-Year Adjustments/Lapse could be an increase in revenue and/or decrease in expenditures. |
| |
| • | | Numbers may not add due to rounding. |
BUDGET 2011 / 3
n SUMMARY BUDGET 2011/12
Revenue
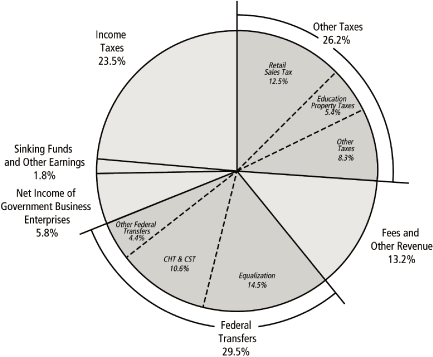
Revenue in 2011/12 is projected to increase $264 million or 2.0% from the 2010/11 Forecast.
Income Taxes are projected to increase by $232 million, with a $139 million increase in Individual Income Tax due to growth in personal income and a $93 million increase in Corporation Income Tax due to higher estimates of corporate income. Budget 2011 projects a $106 million, or 3.1%, increase in Other Taxes reflecting growth in retail sales taxes, a $20 million increase in tobacco tax as well as a $5 million increase in fuel taxes. Corporations Taxes are forecast to decrease by $34 million due largely to the elimination of the general corporate capital tax. Fees and Other Revenue is projected to increase $26 million, or 1.5%. Net Income of Government Business Enterprises (GBEs) is projected to increase $29 million, or 3.9%. Federal Transfers are projected to decrease $141 million, or 3.5%, primarily due to completion of economic stimulus funding.
Expenditure
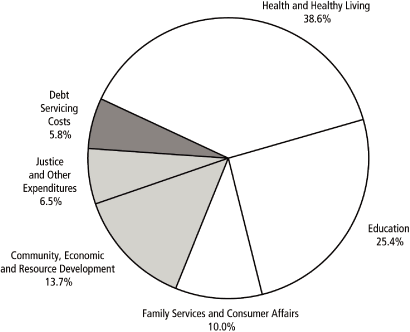
Total expenditure is budgeted to increase $318 million or 2.3% from the 2010/11 Forecast.
The growth in Health and Healthy Living expenditure is $262 million or 5.1%. Education-related expenditure is increasing by $154 million or 4.5%. Family Services and Consumer Affairs is up $10 million, 0.7%. Community, Economic and Resource Development expenditure will decline by $36 million or 1.9%. Manitoba Justice is increasing by $2 million, 0.5%. Overall, the Justice and Other Expenditures sector will decrease by $117 million, reflecting lower economic stimulus funding. Debt Servicing Costs are expected to increase by $45 million.1
In Budget 2011, services to people represent 78.7% of spending.
| • | | Health and Healthy Living expenditure makes up 38.6% of total expenditure. |
| • | | Education accounts for 25.4% of all expenditure; it includes public schools and post-secondary institutions. |
| • | | Family Services and Consumer Affairs, Justice, and Housing and Community Development represent 14.7% of total expenditure. |
2011 Spring Flood Contingency
The 2011 Spring Flood Contingency is comprised of $30 million for potential expenditures, offset by a recovery from Canada for disaster financial assistance of $27 million for a net expenditure of $3 million.
The $11 million expenditure in 2010/11 is the forecast of costs incurred for planning and preparation. These expenditures are intended to mitigate the 2011/12 impact of spring flooding.
| | |
| 1 | | Debt Servicing Costs are forecast to equal 6.0¢ of every dollar of revenue in 2011/12, down 54.5% from 13.2¢ per dollar in 1999/2000. |
4 / BUDGET 2011
Schedule 1
Summary Revenue Estimate: Details and Reconciliation to Core Government Estimates
Fiscal Year ending March 31, 2012 (in Thousands of Dollars)
| | | | | | | | | | | | | |
| | | CORE GOVERNMENT | | CONSOLIDATION IMPACTS | | SUMMARY |
| | | Revenue | | and Revenue of | | | | |
| Source of Revenue | | Estimate | | Other Reporting Entities | | | | |
Income Taxes | | | | | | | | | | | | |
| Individual Income Tax | | | 2,724,800 | | | | — | | | | 2,724,800 | |
| Corporation Income Tax | | | 423,400 | | | | — | | | | 423,400 | |
| | | | | | | | | | | | | |
Subtotal: Income Taxes | | | 3,148,200 | | | | — | | | | 3,148,200 | |
| | | | | | | | | | | | | |
Other Taxes | | | | | | | | | | | | |
| Corporations Taxes | | | 188,000 | | | | — | | | | 188,000 | |
| Fuel Taxes | | | 247,200 | | | | 19,600 | | | | 266,800 | |
| Land Transfer Tax | | | 62,500 | | | | — | | | | 62,500 | |
| Levy for Health and Education | | | 395,400 | | | | (101,356 | ) | | | 294,044 | |
| Mining Tax | | | 35,000 | | | | — | | | | 35,000 | |
| Retail Sales Tax | | | 1,671,100 | | | | — | | | | 1,671,100 | |
| Tobacco Tax | | | 253,400 | | | | — | | | | 253,400 | |
| Other Taxes | | | 11,490 | | | | — | | | | 11,490 | |
| Education Property Taxes | | | — | | | | 727,509 | | | | 727,509 | |
| | | | | | | | | | | | | |
Subtotal: Other Taxes | | | 2,864,090 | | | | 645,753 | | | | 3,509,843 | |
| | | | | | | | | | | | | |
Fees and Other Revenue | | | | | | | | | | | | |
| Fines and Costs and Other Legal | | | 50,582 | | | | — | | | | 50,582 | |
| Minerals and Petroleum | | | 22,314 | | | | — | | | | 22,314 | |
| Automobile and Motor Carrier Licences and Fees | | | 130,026 | | | | — | | | | 130,026 | |
| Parks: Forestry and Other Conservation | | | 29,379 | | | | — | | | | 29,379 | |
| Water Power Rentals | | | 115,000 | | | | — | | | | 115,000 | |
| Service Fees and Other Miscellaneous Charges | | | 135,842 | | | | 1,085,860 | | | | 1,221,702 | |
| Revenue Sharing from SOAs | | | 26,180 | | | | (26,180 | ) | | | — | |
| Tuition Fees | | | — | | | | 202,453 | | | | 202,453 | |
| | | | | | | | | | | | | |
Subtotal: Fees and Other Revenue | | | 509,323 | | | | 1,262,133 | | | | 1,771,456 | |
| | | | | | | | | | | | | |
Federal Transfers | | | | | | | | | | | | |
| Equalization | | | 1,941,700 | | | | — | | | | 1,941,700 | |
| Canada Health Transfer (CHT) | | | 1,002,200 | | | | — | | | | 1,002,200 | |
| Canada Social Transfer (CST) | | | 416,000 | | | | — | | | | 416,000 | |
| Health Funds | | | 9,000 | | | | — | | | | 9,000 | |
| Infrastructure Renewal | | | 66,500 | | | | — | | | | 66,500 | |
| Economic Stimulus | | | 17,903 | | | | — | | | | 17,903 | |
| Manitoba Floodway Expansion | | | 22,491 | | | | — | | | | 22,491 | |
| Shared-Cost and Other Transfers | | | 172,022 | | | | 296,834 | | | | 468,856 | |
| | | | | | | | | | | | | |
Subtotal: Federal Transfers | | | 3,647,816 | | | | 296,834 | | | | 3,944,650 | |
| | | | | | | | | | | | | |
Net Income of Government Business Enterprises (GBEs) | | | | | | | | | | | | |
| Manitoba Liquor Control Commission | | | 254,800 | | | | — | | | | 254,800 | |
| Manitoba Lotteries Corporation | | | 348,300 | | | | — | | | | 348,300 | |
| Manitoba Hydro | | | — | | | | 134,000 | | | | 134,000 | |
| Workers Compensation Board | | | — | | | | 13,696 | | | | 13,696 | |
| Manitoba Public Insurance | | | — | | | | 30,000 | | | | 30,000 | |
| | | | | | | | | | | | | |
Subtotal: Net Income of GBEs | | | 603,100 | | | | 177,696 | | | | 780,796 | |
| | | | | | | | | | | | | |
Sinking Funds and Other Earnings | | | — | | | | 239,483 | | | | 239,483 | |
| | | | | | | | | | | | | |
Total Revenue Estimate | | | 10,772,529 | | | | 2,621,899 | | | | 13,394,428 | |
| | | | | | | | | | | | | |
BUDGET 2011 / 5
Schedule 2
Summary Expenditure Estimate: Details, Reconciliation to Core Government Estimates and Summary Budget Result
Fiscal Year ending March 31, 2012 (in Thousands of Dollars)
| | | | | | | | | | | | | |
| | | CORE GOVERNMENT | | CONSOLIDATION IMPACTS | | SUMMARY |
| | | Expenditure | | and Expenditures of Other | | | | |
| Sector/Department | | Estimate | | Reporting Entities | | | | |
Health and Healthy Living | | | | | | | | | | | | |
| Health | | | 4,925,016 | | | | 378,496 | | | | 5,303,512 | |
| Healthy Living, Youth and Seniors | | | 77,897 | | | | 5,263 | | | | 83,160 | |
| | | | | | | | | | | | | |
Total Health and Healthy Living | | | 5,002,913 | | | | 383,759 | | | | 5,386,672 | |
| | | | | | | | | | | | | |
Education | | | | | | | | | | | | |
| Advanced Education and Literacy | | | 661,237 | | | | 468,564 | | | | 1,129,801 | |
| Education | | | 1,586,218 | | | | 844,599 | | | | 2,430,817 | |
| | | | | | | | | | | | | |
Total Education | | | 2,247,455 | | | | 1,313,163 | | | | 3,560,618 | |
| | | | | | | | | | | | | |
Family Services and Consumer Affairs | | | 1,388,417 | | | | 14,111 | | | | 1,402,528 | |
Community, Economic and Resource Development | | | | | | | | | | | | |
| Aboriginal and Northern Affairs | | | 38,051 | | | | (263 | ) | | | 37,788 | |
| Agriculture, Food and Rural Initiatives | | | 228,299 | | | | 200,883 | | | | 429,182 | |
| Conservation | | | 126,582 | | | | 1,904 | | | | 128,486 | |
| Entrepreneurship, Training and Trade | | | 134,567 | | | | 3,702 | | | | 138,269 | |
| Housing and Community Development | | | 82,326 | | | | 128,608 | | | | 210,934 | |
| Infrastructure and Transportation | | | 594,299 | | | | (88,015 | ) | | | 506,284 | |
| Innovation, Energy and Mines | | | 87,658 | | | | 29,936 | | | | 117,594 | |
| Local Government | | | 307,552 | | | | (1,558 | ) | | | 305,994 | |
| Water Stewardship | | | 35,250 | | | | (1,903 | ) | | | 33,347 | |
| | | | | | | | | | | | | |
Total Community, Economic and Resource Development | | | 1,634,584 | | | | 273,294 | | | | 1,907,878 | |
| | | | | | | | | | | | | |
Justice and Other Expenditures | | | | | | | | | | | | |
| Legislative Assembly | | | 55,284 | | | | (1,175 | ) | | | 54,109 | |
| Executive Council | | | 2,827 | | | | (87 | ) | | | 2,740 | |
| Civil Service Commission | | | 21,656 | | | | 910 | | | | 22,566 | |
| Culture, Heritage and Tourism | | | 64,100 | | | | 5,458 | | | | 69,558 | |
| Employee Pensions and Other Costs | | | 15,817 | | | | 61,999 | | | | 77,816 | |
| Finance | | | 86,593 | | | | 3,259 | | | | 89,852 | |
| Justice | | | 427,743 | | | | 14,777 | | | | 442,520 | |
| Labour and Immigration | | | 58,761 | | | | 7,268 | | | | 66,029 | |
| Sport | | | 11,959 | | | | 215 | | | | 12,174 | |
| Enabling Appropriations | | | 42,305 | | | | — | | | | 42,305 | |
| Other Appropriations | | | 30,151 | | | | — | | | | 30,151 | |
| | | | | | | | | | | | | |
Total Justice and Other Expenditures | | | 817,196 | | | | 92,624 | | | | 909,820 | |
| | | | | | | | | | | | | |
Debt Servicing Costs | | | 257,785 | | | | 548,827 | | | | 806,612 | |
| | | | | | | | | | | | | |
Total Expenditure Estimate | | | 11,348,350 | | | | 2,625,778 | | | | 13,974,128 | |
Subtract: Total Revenue Estimate (Schedule 1) | | | 10,772,529 | | | | 2,621,899 | | | | 13,394,428 | |
| In-Year Adjustments/Lapse | | | (65,000 | ) | | | (80,000 | ) | | | (145,000 | ) |
| | | | | | | | | | | | | |
Net Result for the Year | | | (510,821 | ) | | | 76,121 | | | | (434,700 | ) |
| | | | | | | | | | | | | |
2011 Spring Flood Contingency | | | | | | | | | | | | |
| Expenditures | | | (30,000 | ) | | | — | | | | (30,000 | ) |
| Recovery from Disaster Financial Assistance | | | 27,000 | | | | — | | | | 27,000 | |
| | | | | | | | | | | | | |
Total 2011 Spring Flood Contingency | | | (3,000 | ) | | | — | | | | (3,000 | ) |
Transfer from Fiscal Stabilization Account | | | 49,500 | | | | (49,500 | ) | | | — | |
| | | | | | | | | | | | | |
NET INCOME (LOSS) | | | (464,321 | ) | | | 26,621 | | | | (437,700 | ) |
| | | | | | | | | | | | | |
NOTE: In-Year Adjustments/Lapse could be an increase in revenue and/or decrease in expenditure.
6 / BUDGET 2011
Revenue, 2011/12
Major Sources
Per cent of Total
Does not include the 2011 Spring Flood Contingency
Expenditure, 2011/12
Major Sectors
Per cent of Total
Does not include the 2011 Spring Flood Contingency
BUDGET 2011 / 7
FINANCIAL MANAGEMENT STRATEGY
8 / BUDGET 2011
n FINANCIAL MANAGEMENT PRIORITIES
The Financial Management Strategy (FMS) sets out the government’s priorities for financial management. It includes five main priority areas with one or more measurable outcomes. Each measurable outcome includes objectives for the current year and for future years.
For 2011/12, the FMS continues to focus on the priority areas identified in prior years and reflects the implementation of Manitoba’s Five-Year Economic Plan.
| | | | | |
| FINANCIAL MANAGEMENT PRIORITY | | MEASURABLE OUTCOMES |
| Transparency, Accountability and Fiscal Discipline | | •
• | | Summary Net Income
Maintaining Accountability for core government Expenditure and Revenue |
| |
| Stable and Affordable Government | | • | | Credit Ratings |
| |
| | | • | | Expenditures as a Percentage of Gross Domestic Product (GDP) |
| |
| | | • | | Strengthening the Management of Public Resources |
| |
| Managing Debt | | • | | Debt Retirement |
| |
| | | • | | Net Debt-to-GDP Ratio |
| |
| Infrastructure and Capital Asset Renewal | | • | | Capital Investments |
| |
| Performance Management | | • | | Continued Development of Performance Management Capacity |
BUDGET 2011 / 9
n PRIORITY AREA — TRANSPARENCY, ACCOUNTABILITY AND FISCAL DISCIPLINE
Government has implemented a number of measures to ensure financial accountability and maintain fiscal discipline, including:
| • | | implementing GAAP compliant summary financial statements as of March 31, 2005; |
| |
| • | | implementing summary budgeting and reporting in 2007/08 to present comprehensive information on the total cost of providing programs and services to Manitobans and how the GRE operates as a whole; |
| |
| • | | publishing a FMS as part of the annual budget and a report on outcomes within six months of the end of the fiscal year; |
| |
| • | | implementing summary quarterly financial reporting consistent with GAAP as of 2009/10; |
| |
| • | | establishing and implementing plans to address general purpose debt and pension liabilities; |
| |
| • | | funding the employer’s share of current service pension contributions for all employees; and |
| |
| • | | introducing a multi-year plan in Budget 2010 to address the impact of the global economic downturn. |
| The commitment to transparency, accountability and fiscal discipline continues in Budget 2011 with an update on the multiyear plan for 2011/12 and future years. |
Measurable Outcome — Summary Net Income
Governments around the world were affected by the economic downturn, the worst global recession since the end of the Second World War. Like Manitoba, many governments were faced with budget deficits as they worked to stimulate the economy and manage expenditures.
While Manitoba’s economy continues to be one of the most stable in Canada, there was no quick solution to the financial pressures that the province was facing. In response to the uncertainty, Manitoba introduced a five-year economic plan in Budget 2010 that focused on:
| • | | investing in vital front-line services by continuing to improve health care, education and training, policing and supports for families; |
| |
| • | | stimulating economic growth by upgrading needed infrastructure to create jobs, and investing in innovation to secure a prosperous future; |
| |
| • | | managing government spending strategically to ensure Manitobans’ priorities come first; |
| |
| • | | restoring balance and returning to surplus by Budget 2014; and |
| |
| • | | maintaining affordability to keep Manitoba one of the best places to live, work and raise a family. |
Considerable challenges remain for the Manitoba and Canadian economies in 2011 and 2012 in terms of both domestic economic conditions and the global economic environment. With 2011 economic growth proceeding largely in line with Budget 2010 forecasts, Manitoba will continue with the five-year strategy of restoring balance and returning to surplus in Budget 2014.
10 / BUDGET 2011
Manitoba’s Five-Year Economic Plan
| | | | | | | | | | | | | | | | | | | | | |
| | | Year 1 | | Year 2 | | Year 3 | | Year 4 | | Year 5 |
| | | 2010/11 | | 2011/12 | | 2012/13 | | 2013/14 | | 2014/15 |
| | | Forecast | | Budget | | Projection | | Projection | | Projection |
| | | (Millions of Dollars) |
REVENUE | | | | | | | | | | | | | | | | | | | | |
Core Government1 | | | 10,496 | | | | 10,799 | | | | 11,096 | | | | 11,563 | | | | 12,151 | |
| Other Reporting Entities* | | | 2,634 | | | | 2,622 | | | | 2,620 | | | | 2,696 | | | | 2,740 | |
| | | | | | | | | | | | | | | | | | | | | |
| TOTAL REVENUE | | | 13,130 | | | | 13,421 | | | | 13,716 | | | | 14,259 | | | | 14,891 | |
| | | | | | | | | | | | | | | | | | | | | |
| | | | | | | | | | | | | | | | | | | | | |
EXPENDITURE | | | | | | | | | | | | | | | | | | | | |
Core Government Programs and Services1 | | | 11,030 | | | | 11,378 | | | | 11,581 | | | | 11,849 | | | | 12,106 | |
| Other Reporting Entities* | | | 2,637 | | | | 2,626 | | | | 2,625 | | | | 2,701 | | | | 2,745 | |
| | | | | | | | | | | | | | | | | | | | | |
TOTAL EXPENDITURE | | | 13,667 | | | | 14,004 | | | | 14,206 | | | | 14,550 | | | | 14,851 | |
| | | | | | | | | | | | | | | | | | | | | |
| In-Year Adjustments/Lapse ** | | | (70 | ) | | | (145 | ) | | | (145 | ) | | | (145 | ) | | | (145 | ) |
| | | | | | | | | | | | | | | | | | | | | |
SUMMARY NET INCOME (LOSS) | | | (467 | ) | | | (438 | ) | | | (345 | ) | | | (146 | ) | | | 185 | |
| | | | | | | | | | | | | | | | | | | | | |
| | |
| 1 | | includes 2011 Spring Flood Contingency of $30 million in expenditures offset by $27 million in revenue |
| |
| * | | includes consolidation adjustments |
| |
| ** | | In-Year Adjustments/Lapse could be an increase in revenue and/or decrease in expenditures |
The plan assumes GRE revenue will rise by an average of 3.5% annually from 2011/12 to 2014/15, while GRE expenditures are forecast to increase by an annual average of 2.0% during the same period.
Core government revenue is forecast to rise by an average of 4.0% annually and core government expenditure will grow by an annual average of 2.1% from 2011/12 to 2014/15.
Core government projections reflect the commitment to return to surplus without negatively impacting the front-line services Manitoba families need. With the strengthening recovery in late 2010, revenue projections for Budget 2011 have improved and these funds are being directed to key investments that support economic growth in our province. As considerable challenges remain, this is not the time to scale back, but to respond confidently in support of growing the economy and protecting frontline services.
The Manitoba government is committed to balancing summary net income over the medium term, as reflected in the five-year plan, by:
| • | | strategically managing and prioritizing expenditures; |
| |
| • | | negotiating zero per cent increase for the general civil service in 2011/12; |
| |
| • | | continuing to manage discretionary salary and operating costs on a government-wide basis; |
| |
| • | | reducing ministerial salary levels; |
| |
| • | | continuing the second year of a freeze on salaries for members of the Legislative Assembly, their staff and senior government officials; |
BUDGET 2011 / 11
| • | | continuing to find new ways to foster innovative, cost-effective services; and |
| |
| • | | using funds set aside in the Fiscal Stabilization Account (FSA) to retire a portion of the debt and interest expense associated with the core government operating shortfalls during the economic recovery period. |
The responsible plan to restore balance over five years is reflected in legislation that:
| • | | requires the budget shortfall to be eliminated over four years and a return to surplus in 2014/15; |
| |
| • | | keeps the legal requirement to have balanced budgets into the future; |
| |
| • | | exceeds debt payment requirements under the previous legislation; and |
| |
| • | | retains the restrictions that prohibit increases to major taxes without a referendum. |
An annual financial management strategy and a report on outcomes will continue to be published. In addition, in-year financial reporting will provide updates on the progress made in achieving our economic recovery plan.
12 / BUDGET 2011
Measurable Outcome — Maintaining Accountability for Core Government Program Expenditure and Revenue
Legislation requires government to include a summary of core government expenditure and projected revenue as part of the FMS. This is consistent with the main estimates of expenditure and revenue for the fiscal year.
While core government expenditure will exceed revenue in Budget 2011, the five-year economic recovery plan shows this reversing by Budget 2014. The projection includes allocations from the FSA for funding from the federal government for health-related programming and ecoTrust funding, a contingency for a potential 2011 spring flood, as well as for debt servicing costs resulting from core government deficits during the economic recovery period.
Core Government Expenditure and Revenue, 2011/12
| | | | | |
| | | $ Millions |
| Revenue | | | 10,772 | |
| Expenditure | | | 11,348 | |
| In-Year Adjustments/Lapse | | | (65 | ) |
| | | | | |
| | | | (511 | ) |
| 2011 Spring Flood Contingency | | | | |
| Flood fighting expenditures | | | (30 | ) |
| Recovery from federal Disaster Financial Assistance program | | | 27 | |
| | | | | |
| | | | (3 | ) |
| Transfer from Fiscal Stabilization Account | | | | |
| Health-related programming | | | 25 | |
| ecoTrust | | | 8 | |
| Debt Servicing Costs | | | 14 | |
| 2011 Spring Flood Contingency | | | 3 | |
| | | | | |
| Net Result | | | (464 | ) |
| | | | | |
Year-end information on core government expenditure and revenue for 2011/12 will be provided as part of the FMS report on outcomes, scheduled to be released in the fall of 2012.
BUDGET 2011 / 13
n PRIORITY AREA — STABLE AND AFFORDABLE GOVERNMENT
Manitoba’s government continues to be one of the most cost-effective governments in Canada. Keeping programs affordable is done by continuing to improve the way government operates and delivers services.
Manitoba uses public revenues effectively and efficiently to deliver affordable government programs and services. Manitoba’s per capita spending growth over the past five years has been the fourth lowest of all provincial governments.
In this challenging economic climate, the government will continue to carefully manage expenditures without negatively impacting front-line services.
Measurable Outcome — Credit Ratings
Manitoba continues to maintain its reputation for fiscal responsibility. The province’s measured approach to paying down debt and the pension liability while dealing with the needs in health care and other program areas has been positively acknowledged by credit rating agencies.
This is reflected in the credit rating upgrades Manitoba received from Moody’s Investors Service and by Standard & Poor’s through 2007, and through the reaffirmation of Manitoba’s credit quality by rating agencies in the last three years.
During this period of economic and financial recovery, Manitoba’s stable and diversified economy, strong financial position and commitment to responsible financial management will help ensure a steady credit outlook in 2011. The credit rating agencies are aware of the challenging economic conditions facing all Canadian provinces. Our five-year plan includes a strategy to repay debt while restoring balance. Coupled with Manitoba’s existing credit rating, the initial success of the economic recovery plan and the commitment to return to surplus, credit ratings are expected to remain unchanged in the coming year.
The Manitoba government remains committed to maintaining fiscal responsibility to achieve stable or improving credit ratings into the future.
| | | | | | | | | | | | | | | |
| Credit Rating | | 2005 | | 2006 | | 2007 | | 2008 | | 2009 | | 2010 | | 2011 |
| Agency | | Actual | | Actual | | Actual | | Actual | | Actual | | Actual | | Actual |
| DBRS | | A(high) | | A(high) | | A(high) | | A(high) | | A(high) | | A(high) | | A(high) |
| Moody’s | | Aa2 | | Aa2 | | Aa1 | | Aa1 | | Aa1 | | Aa1 | | Aa1 |
| Standard & Poor’s | | AA- | | AA- | | AA-(positive) | | AA | | AA | | AA | | AA |
NOTE: As at March 31 (end of fiscal year)
14 / BUDGET 2011
Measurable Outcome — Expenditures as a Percentage of Gross Domestic Product (GDP)
Maintaining stable and affordable government means managing the growth in spending to meet increasing demands for quality services. An effective measure of appropriate spending is the ratio of total expenditure as a percentage of GDP. This ratio has remained relatively stable over the last four years and is budgeted to return to a decline in the ratio for Budget 2011.
Expenditure to GDP ratios are reflected in the following table and as part of Appendix 1, Summary Financial Statistics.
| | | | | | | | | | | | | | | | | | | | | | | | | | | | | |
| | | 2006/07 | | 2007/08 | | 2008/09 | | 2009/10 | | 2010/11 | | 2011/12 | | 2012/13 |
| | | Actual | | Actual | | Actual | | Actual | | Forecast | | Budget | | Projection |
| Core Program Expenditure | | | 18.8 | % | | | 18.7 | % | | | 19.1 | % | | | 20.3 | % | | | 20.2 | % | | | 19.7 | % | | | 19.0 | % |
| Other Reporting Entities Expenditure | | | 3.7 | % | | | 4.0 | % | | | 3.3 | % | | | 3.5 | % | | | 4.0 | % | | | 3.7 | % | | | 3.7 | % |
| Debt Servicing Costs | | | 1.8 | % | | | 1.8 | % | | | 1.6 | % | | | 1.5 | % | | | 1.4 | % | | | 1.4 | % | | | 1.4 | % |
| Total Expenditure | | | 24.2 | % | | | 24.4 | % | | | 24.1 | % | | | 25.2 | % | | | 25.5 | % | | | 24.8 | % | | | 24.1 | % |
The Manitoba government’s objective is to maintain a stable or declining ratio over the longer term.
Measurable Outcome — Strengthening the Management of Public Resources
Sound management and use of public resources are key to making government more effective. Government has made sure that public spending remains under control and that tax dollars are used effectively and efficiently.
Overall, discretionary salary and operating expenditures for existing services have been frozen government-wide in 2011/12. To streamline services, the Mechanical and Engineering Branch of Manitoba Labour and Immigration was integrated with the Office of the Fire Commissioner. As well, online services for families and businesses and red tape reduction measures are being introduced.
The government has also implemented reforms with other reporting entities to better manage public resources, capitalize on synergies and enhance regional capabilities, expertise and talent.
The government supports continuous internal review and reform to provide Manitobans with affordable, innovative and effective public service operations, programs and services. The government will continue to emphasize reforms that improve accountability and transparency, two important goals of modern government.
BUDGET 2011 / 15
n PRIORITY AREA — MANAGING DEBT
Each year since 1999, government has continued to implement specific initiatives to ensure sound fiscal management. These include:
| • | | addressing the unfunded pension liability; |
| • | | funding the employer’s share of current service pension entitlements for all employees in 2008/09, the first time since April 1, 1961; |
| • | | ensuring all capital investments are amortized and all related costs are fully reflected in annual appropriations for core government; and |
| • | | establishing a plan to address core government deficits during the economic recovery period. |
Solid debt management consists of a plan to repay general purpose debt and reduce the pension liability, while making needed investments in Manitoba. The net debt-to-GDP ratio is one of the key indicators used by credit rating agencies in their analysis of provincial governments because it measures the level of debt relative to a province’s financial capacity. Like all other Canadian jurisdictions, Manitoba’s net debt-to-GDP ratio has increased as a result of the economic downturn, but the five-year plan indicates this ratio stabilizing in 2012/13 and returning to a downward trend by 2014/15.
Measurable Outcome — Debt Retirement
The government has contributed almost $1 billion to the debt retirement account since 1999 for general purpose debt and pension obligations. Direct action to address the unfunded pension liabilities for Civil Service Superannuation Fund (CSSF) and Teachers’ Retirement Allowances Fund (TRAF) began in 2007/08 with the province borrowing funds that would be invested by these two pension plans on behalf of the province. Budget 2011 includes a further addition of $240 million for the CSSF.
Borrowing funds to pay down the previously unfunded pension liability is a sound fiscal decision, as over the longer term, the cost of borrowing is less than the actuarially determined expected rate of return on the plan assets and the rate of growth in the pension liability.
Since 2000, over $600 million from the annual debt retirement payment has been directed to pension obligations, and net investment earnings in the Pension Asset Fund are projected to be $727 million by March 31, 2012. Combined with the $2.6 billion in new investment provided by the government since 2007, a total of $3.9 billion will have been directed to address the unfunded pension liability by March 31, 2012. In addition, Budget 2011 includes $145 million in core government expenditures for the employer’s share of current service pension obligations.
Capital investment continues to be a priority for government in order to support continued economic growth, reduce the maintenance burden and provide for the services Manitobans need in the future. The cost of these assets is amortized over a set period that represents the useful life of the asset as required by GAAP. The end result is increased infrastructure investment for Manitobans accompanied by a fixed discipline for paying down the associated debt.
16 / BUDGET 2011
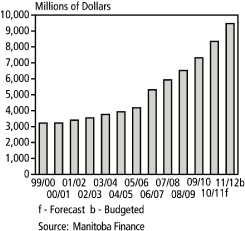
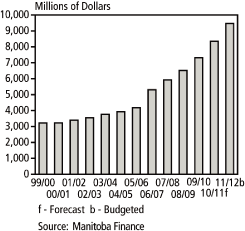
Tangible Capital Assets — Net Book Value
The investment in tangible capital assets has increased steadily over the last decade and with the $1.6 billion investment in Budget 2011, is projected to total $15.9 billion as of March 31, 2012, with $6.4 billion of related debt retired through accumulated amortization. The net book value of these assets (cost less accumulated amortization) almost tripled since 1999/2000 to $9.5 billion.
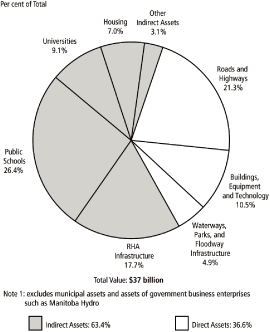
Manitoba’s communities and the economy have benefited over the years from the significant investment in public capital assets such as health facilities, universities, colleges and schools as well as infrastructure assets such as roads, water-control structures and parks. To meet the needs of today’s and future generations, it is necessary to continue to invest in renewal of these assets. The public good provided by these investments is immeasurable. It is estimated that the insured or replacement value of these investments exceeds $37 billion.
Based on projections, core government will have a total of $6.5 billion in capital asset investments as of March 31, 2012, and $2.1 billion of related debt will have been retired through accumulated amortization.
A total of $328 million has been included in core government appropriations to retire debt associated with capital investments — $171 million for amortization of department-owned assets and $157 million for principal payments for education and health-related assets.
Replacement Value of Public Assets1
Totals may not add due to rounding.
After years of surplus, the global economic downturn has had a negative impact on Manitoba’s core government operations. Budget 2010 introduced a five-year plan to stimulate the economy and create jobs, while protecting key services and a return to surplus by 2014/15. However, Manitoba’s responsible management of public funds in previous years meant that the FSA had a healthy balance that would be available to mitigate the impact of the short-term deficits that would occur in core government operations. As a result, the deficit in Budget 2011 is 0.8% of GDP, third lowest among provincial budgets released.
Manitoba’s five-year plan incorporates a legislated requirement to dedicate at least $600 million of the balance in the FSA to the amortization of increases in the general purpose debt, including related interest expenses, that are attributable to negative net results incurred during the period of economic recovery. In 2010/11, existing funds in the Debt Retirement Account (DRA) were withdrawn to repay $145 million of debt, and $90 million of debt was repaid with a withdrawal from the FSA. Budget 2011 includes a further debt repayment from the FSA of $110 million, for a total payment of $345 million. With a return to surplus position in Budget 2014, scheduled debt payments for general purpose debt from current resources will resume.
BUDGET 2011 / 17
Prudent management of public funds since 2000 is reflected in the cumulative total of core government revenue exceeding core government expenditure by almost $300 million, prior to any transfers to or from the FSA or DRA. Combined with the decisions Manitoba has taken to address the previously unfunded pension liability — budgeting for the employer’s share of current service entitlements for all employees, ensuring all capital investments are amortized and all related costs are fully reflected in annual appropriations, and continuing to make debt repayments to mitigate core government operating deficits — Manitoba has a solid debt management plan. In Budget 2011, $438 million will be directed to debt-related payments.
The government continues to streamline debt management. This is reflected not only in the debt retirement plan, but also in the fact that debt servicing costs as a percentage of revenue remain constant. Since 1999/2000, the debt servicing cost rate has dropped by 54.5%, from 13.2¢ of every dollar of summary revenue collected to a forecasted level of 6.0¢ in Budget 2011.
Although the global economic downturn has recently slowed progress, the government remains committed to reducing debt over time with an ultimate goal of eliminating the general purpose debt and the remaining unfunded pension liabilities.
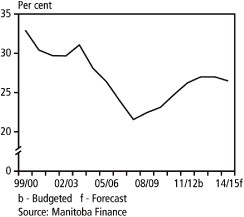
Measurable Outcome — Net Debt-to-GDP Ratio
Net debt is an important indicator of a government’s financial position as this highlights how government services will remain affordable in the future.
Summary net debt is financial assets (such as cash or investments) minus total liabilities (such as loans or financing). It is the remaining liability that must be financed by future revenues.
Net debt may grow from time to time, as needed investments in capital assets — like the Red River Floodway, highway infrastructure and economic stimulus investments — are made. These forward-looking investments help support Manitoba’s economy.
Therefore, it is important to measure changes in net debt against the growth of the economy, as measured by the nominal GDP.
Over the last several years, the Manitoba government has seen a substantial downward trend in the debt-to-GDP ratio, lowering the ratio to a projected level of 24.7% in 2010/11 from 32.9% in 1999/2000, an improvement of 25%.
Net Debt-to-GDP Ratio
In December 2010, DBRS noted in their 2010 Canadian Federal and Provincial Governments Overview, that all provinces showed an increase in debt-to-GDP ratios in 2009/10 and that in 2010/11 the ratio was expected to rise again, although at a slower pace. The report also noted that the ratios are expected to peak in the next two to three years, if economic recovery continues and fiscal discipline is not relaxed.
Manitoba has acknowledged that the debt-to-GDP ratio will rise in the short term as the government makes needed investments in infrastructure projects to create jobs and stimulate the economy. In Budget 2011, the debt-to-GDP ratio is forecast to increase to 26.2%, fourth lowest among provinces. The five-year plan projects the return to a downward trend as the government remains committed to reducing the debt-to-GDP ratio over the longer term.
18 / BUDGET 2011
n PRIORITY AREA — INFRASTRUCTURE AND CAPITAL ASSET RENEWAL
Building and upgrading Manitoba’s infrastructure has been a priority for the government since 1999. The government reinforced this priority by announcing a four-year, $4.7-billion economic stimulus investment plan in November 2008 to fund key infrastructure projects that create jobs and training opportunities across the province.
Measurable Outcome — Capital Investments
Based on principles of sound financial management, Manitoba has been able to increase the assets of the province while maintaining a sustainable level of debt. Since 2000, the government will have invested $8.7 billion in public capital assets, including $3.0 billion for new or renewed hospitals, universities, colleges and public schools; $3.2 billion to upgrade Manitoba’s roads and highways; and $2.5 billion for the Manitoba Floodway, the modernization and improvement of social housing, improving public service buildings, parks and camping infrastructure.
It is estimated that the insured or replacement value of these investments is more than $37 billion (see chart page 16).
Budget 2011 provides the resources to continue upgrading Manitoba’s roads and highways, wastewater treatment plants, health facilities across the province, building and restoring much needed social housing and modernizing our schools and post-secondary institutions.
Budget 2011 includes capital investment of $1.8 billion to support continued economic growth, reduce the maintenance burden and provide for the services Manitobans need in the future as outlined in the table below.
| | | | | |
| | | $ Millions |
| Roads and Highways (including preservation) | | | 589 | |
| Universities, Colleges and Public Schools | | | 258 | |
| Health Facilities | | | 260 | |
| Manitoba Floodway Expansion and Water-Related Infrastructure | | | 93 | |
| Housing (including third-party contributions) | | | 329 | |
| Assistance to Third Parties | | | 116 | |
| Public Service Buildings | | | 114 | |
| Parks and Camping Infrastructure | | | 35 | |
| | | | | |
| | | | 1,794 | |
| | | | | |
Manitoba’s commitment to infrastructure investments and renewal of existing assets, while maintaining a fiscally responsible approach to budgeting and debt management, will continue to deliver benefits to Manitobans.
BUDGET 2011 / 19
n PRIORITY AREA — PERFORMANCE MANAGEMENT
Improving the way government measures both financial and non-financial performance outcomes enhances both transparency and accountability. Outcomes-based reporting provides information on the actual impacts, benefits or changes experienced as a result of a program or government service.
The 2010 FMS confirmed the eight principles which guide measurement and reporting for government departments and major Crown corporations.
| 1. | | The organization’s public purpose is explained. |
| |
| 2. | | The organization’s priorities relate to overall government priorities. |
| |
| 3. | | Each organizational priority has objectives and actions to achieve them. |
| |
| 4. | | Measures are developed with outcomes in mind, focusing on a few critical aspects of performance. |
| |
| 5. | | Financial and non-financial information is linked. |
| |
| 6. | | The strategic context for the plan and reported results are discussed. |
| |
| 7. | | Performance information looks forward and backward in time. |
| |
| 8. | | Information is clear, relevant, credible and balanced. |
Measurable Outcome — Continued Development of Performance Management Capacity
Manitoba is committed to continuing progress on the measurement of performance outcomes with a focus on SMART (specific, measureable, achievable, reliable, time-bound) objectives.
Performance management continues to be refined to support management decision-making in the effective use of public funds with planning, measuring and reporting activities that integrate financial and non-financial information.
In 2011/12, the Performance Management Community of Practice established in 2010 will continue to provide opportunities for collaboration and building capacity in all areas of performance, including measuring and reporting. Key performance measures and performance information for government departments and other entities in the GRE will continue to be included in annual reports and other specialized reports.
BUDGET 2011 / 21
APPENDIX 1
MANITOBA SUMMARY FINANCIAL STATISTICS
22 / BUDGET 2011
Manitoba Summary Financial Statistics
| | | | | | | | | | | | | | | | | | | | | | | | | |
| | | 2011/12 | | | 2010/11 | | | 2009/10 | | | 2008/09 | | | 2007/08 | | | 2006/07 | |
| | | Budget | | | Forecast | | | Actual | | | Actual | | | Actual | | | Actual | |
| | | (Millions of Dollars) | |
SUMMARY FINANCIAL STATEMENTS | | | | | | | | | | | | | | | | | | | | | | | | |
Revenue | | | | | | | | | | | | | | | | | | | | | | | | |
| Income Taxes | | | 3,148 | | | | 2,916 | | | | 2,659 | | | | 2,841 | | | | 2,652 | | | | 2,441 | |
| Other Taxes | | | 3,510 | | | | 3,404 | | | | 3,281 | | | | 3,276 | | | | 3,288 | | | | 3,129 | |
| Fees and Other Revenue | | | 1,771 | | | | 1,745 | | | | 1,791 | | | | 1,720 | | | | 1,628 | | | | 1,493 | |
| Federal Transfers | | | 3,945 | | | | 4,086 | | | | 3,924 | | | | 3,866 | | | | 3,597 | | | | 3,320 | |
| Net Income of Government Business Enterprises | | | 781 | | | | 752 | | | | 772 | | | | 764 | | | | 947 | | | | 627 | |
| Sinking Funds and Other Earnings | | | 239 | | | | 227 | | | | 220 | | | | 296 | | | | 384 | | | | 423 | |
| | | | | | | | | | | | | | | | | | | |
Total Revenue | | | 13,394 | | | | 13,130 | | | | 12,647 | | | | 12,763 | | | | 12,496 | | | | 11,433 | |
| | | | | | | | | | | | | | | | | | | |
Expenditure | | | | | | | | | | | | | | | | | | | | | �� | | | |
| Health and Healthy Living | | | 5,387 | | | | 5,125 | | | | 4,830 | | | | 4,588 | | | | 4,232 | | | | 3,956 | |
| Education | | | 3,560 | | | | 3,406 | | | | 3,227 | | | | 3,091 | | | | 3,224 | | | | 2,948 | |
| Family Services and Consumer Affairs | | | 1,402 | | | | 1,392 | | | | 1,295 | | | | 1,192 | | | | 1,224 | | | | 1,142 | |
| Community, Economic and Resource Development | | | 1,908 | | | | 1,944 | | | | 1,814 | | | | 1,729 | | | | 1,420 | | | | 1,280 | |
| Justice and Other General Expenditures | | | 910 | | | | 1,027 | | | | 926 | | | | 882 | | | | 974 | | | | 829 | |
| Debt Servicing Costs | | | 807 | | | | 762 | | | | 756 | | | | 830 | | | | 864 | | | | 793 | |
| | | | | | | | | | | | | | | | | | | |
Total Expenditure | | | 13,974 | | | | 13,656 | | | | 12,848 | | | | 12,312 | | | | 11,938 | | | | 10,948 | |
In-Year Adjustments/Lapse | | | (145 | ) | | | (70 | ) | | | — | | | | — | | | | — | | | | — | |
| | | | | | | | | | | | | | | | | | | |
Net Result for the Year | | | (435 | ) | | | (456 | ) | | | (201 | ) | | | 451 | | | | 558 | | | | 485 | |
2011 Spring Flood Contingency | | | | | | | | | | | | | | | | | | | | | | | | |
| Expenditures | | | (30 | ) | | | (11 | ) | | | — | | | | — | | | | — | | | | — | |
| Recovery from Disaster Financial Assistance | | | 27 | | | | — | | | | — | | | | — | | | | — | | | | — | |
| | | | | | | | | | | | | | | | | | | |
Total 2011 Spring Flood Contingency | | | (3 | ) | | | (11 | ) | | | — | | | | — | | | | — | | | | — | |
| | | | | | | | | | | | | | | | | | | |
Net Income (Loss) | | | (438 | ) | | | (467 | ) | | | (201 | ) | | | 451 | | | | 558 | | | | 485 | |
| | | | | | | | | | | | | | | | | | | |
Provincial Borrowings, Guarantees and Obligations | | | | | | | | | | | | | | | | | | | | | | | | |
| General Government Programs | | | 7,309 | | | | 6,955 | | | | 6,833 | | | | 6,400 | | | | 6,532 | | | | 6,566 | |
| General Government Programs - Pension Liability | | | 2,595 | | | | 2,355 | | | | 2,175 | | | | 1,850 | | | | 1,500 | | | | — | |
| Manitoba Hydro | | | 8,901 | | | | 8,361 | | | | 7,730 | | | | 7,499 | | | | 6,794 | | | | 6,636 | |
| Other Crown Organizations | | | 1,868 | | | | 1,643 | | | | 1,478 | | | | 1,341 | | | | 1,269 | | | | 1,279 | |
| Health Facilities | | | 1,264 | | | | 1,065 | | | | 949 | | | | 831 | | | | 833 | | | | 790 | |
| Government Enterprises and Other | | | 41 | | | | 51 | | | | 65 | | | | 78 | | | | 92 | | | | 106 | |
| Capital Investments | | | 3,183 | | | | 2,546 | | | | 1,846 | | | | 1,411 | | | | 1,084 | | | | 749 | |
| | | | | | | | | | | | | | | | | | | |
Subtotal | | | 25,161 | | | | 22,976 | | | | 21,076 | | | | 19,410 | | | | 18,104 | | | | 16,126 | |
Other Obligations | | | | | | | | | | | | | | | | | | | | | | | | |
| Pension Liability | | | 6,901 | | | | 6,637 | | | | 6,392 | | | | 6,152 | | | | 6,008 | | | | 5,650 | |
| Pension Asset | | | (5,185 | ) | | | (4,859 | ) | | | (4,592 | ) | | | (4,161 | ) | | | (3,780 | ) | | | (2,157 | ) |
| | | | | | | | | | | | | | | | | | | |
| Net Pension Liability | | | 1,716 | | | | 1,778 | | | | 1,800 | | | | 1,991 | | | | 2,228 | | | | 3,493 | |
| Debt incurred for and repayable by the Manitoba Hydro-Electric Board | | | (8,663 | ) | | | (8,198 | ) | | | (7,479 | ) | | | (7,177 | ) | | | (6,449 | ) | | | (5,966 | ) |
| Education and Health Debt held by Government Enterprises | | | 496 | | | | 466 | | | | 443 | | | | 406 | | | | 416 | | | | 431 | |
| Other Debt of Crown Organizations | | | 255 | | | | 255 | | | | 255 | | | | 262 | | | | 252 | | | | 219 | |
| | | | | | | | | | | | | | | | | | | |
Subtotal | | | (6,196 | ) | | | (5,699 | ) | | | (4,981 | ) | | | (4,518 | ) | | | (3,553 | ) | | | (1,823 | ) |
| | | | | | | | | | | | | | | | | | | |
Total Summary Borrowings, Guarantees and Obligations | | | 18,965 | | | | 17,277 | | | | 16,095 | | | | 14,892 | | | | 14,551 | | | | 14,303 | |
| | | | | | | | | | | | | | | | | | | |
Adjustments to arrive at Summary Net Debt | | | | | | | | | | | | | | | | | | | | | | | | |
| Guarantees | | | (241 | ) | | | (166 | ) | | | (255 | ) | | | (326 | ) | | | (350 | ) | | | (675 | ) |
| Net Financial Assets | | | (3,920 | ) | | | (3,867 | ) | | | (4,046 | ) | | | (3,098 | ) | | | (3,651 | ) | | | (2,828 | ) |
| | | | | | | | | | | | | | | | | | | |
Summary Net Debt | | | 14,804 | | | | 13,244 | | | | 11,794 | | | | 11,468 | | | | 10,550 | | | | 10,800 | |
| | | | | | | | | | | | | | | | | | | |
Summary Net Debt as percentage of GDP | | | 26.2 | | | | 24.7 | | | | 23.1 | | | | 22.5 | | | | 21.6 | | | | 23.9 | |
Numbers may not add due to rounding.
NOTES
| • | | The 2010/11 Forecast has been re-stated from the Third Quarter Financial Report, to be consistent with Budget 2011 presentation. |
| |
| • | | Guarantees reflect only guaranteed balances for Manitoba Hydro Bonds and Manitoba Grow Bonds. |
| |
| • | | Borrowings, guarantees and obligations are net of sinking funds. |
| |
| • | | Historical information has been re-stated to be consistent with changes in accounting policies. |
BUDGET 2011 / 23
| | | Manitoba Summary Financial Statistics |
| | | | | | | | | | | | | | | | | | | | | | | | | |
| | | 2011/12 | | 2010/11 | | 2009/10 | | 2008/09 | | 2007/08 | | 2006/07 |
| | | Budget | | Forecast | | Actual | | Actual | | Actual | | Actual |
| | | (Percentage Change) |
Annual Change | | | | | | | | | | | | | | | | | | | | | | | | |
| Income Taxes | | | 8.0 | | | | 9.7 | | | | (6.4 | ) | | | 7.1 | | | | 8.6 | | | | 5.1 | |
| Other Taxes | | | 3.1 | | | | 3.7 | | | | 0.2 | | | | (0.4 | ) | | | 5.1 | | | | 36.9 | |
| Fees and Other Revenue | | | 1.5 | | | | (2.6 | ) | | | 4.1 | | | | 5.7 | | | | 9.0 | | | | (12.2 | ) |
| Federal Transfers | | | (3.5 | ) | | | 4.1 | | | | 1.5 | | | | 7.5 | | | | 8.3 | | | | 7.0 | |
| Total Revenue | | | 2.0 | | | | 3.8 | | | | (0.9 | ) | | | 2.1 | | | | 9.3 | | | | 6.1 | |
| Health and Healthy Living | | | 5.1 | | | | 6.1 | | | | 5.3 | | | | 8.4 | | | | 7.0 | | | | 3.9 | |
| Education | | | 4.5 | | | | 5.5 | | | | 4.4 | | | | (4.1 | ) | | | 9.4 | | | | 28.7 | |
| Debt Servicing Costs | | | 5.9 | | | | 0.8 | | | | (8.9 | ) | | | (3.9 | ) | | | 9.0 | | | | (7.8 | ) |
| Total Expenditure | | | 2.3 | | | | 6.3 | | | | 4.4 | | | | 3.1 | | | | 9.0 | | | | 5.5 | |
| Summary Net Debt | | | 11.8 | | | | 12.3 | | | | 2.8 | | | | 8.7 | | | | (2.3 | ) | | | (1.4 | ) |
| | | | | | | | | | | | | | | (Per cent) | | | | | | | | | | |
Per cent of GDP | | | | | | | | | | | | | | | | | | | | | | | | |
| Income Taxes | | | 5.6 | | | | 5.4 | | | | 5.2 | | | | 5.6 | | | | 5.4 | | | | 5.4 | |
| Other Taxes | | | 6.2 | | | | 6.4 | | | | 6.4 | | | | 6.4 | | | | 6.7 | | | | 6.9 | |
| Fees and Other Revenue | | | 3.1 | | | | 3.3 | | | | 3.5 | | | | 3.4 | | | | 3.3 | | | | 3.3 | |
| Federal Transfers | | | 7.0 | | | | 7.6 | | | | 7.7 | | | | 7.6 | | | | 7.4 | | | | 7.4 | |
| Total Revenue | | | 23.7 | | | | 24.5 | | | | 24.8 | | | | 25.0 | | | | 25.6 | | | | 25.3 | |
| Health and Healthy Living | | | 9.5 | | | | 9.6 | | | | 9.5 | | | | 9.0 | | | | 8.7 | | | | 8.8 | |
| Education | | | 6.3 | | | | 6.4 | | | | 6.3 | | | | 6.1 | | | | 6.6 | | | | 6.5 | |
| Debt Servicing Costs | | | 1.4 | | | | 1.4 | | | | 1.5 | | | | 1.6 | | | | 1.8 | | | | 1.8 | |
| Total Expenditure | | | 24.8 | | | | 25.5 | | | | 25.2 | | | | 24.1 | | | | 24.4 | | | | 24.2 | |
| Summary Net Debt | | | 26.2 | | | | 24.7 | | | | 23.1 | | | | 22.5 | | | | 21.6 | | | | 23.9 | |
Per cent of Revenue | | | | | | | | | | | | | | | | | | | | | | | | |
| Income Taxes | | | 23.5 | | | | 22.2 | | | | 21.0 | | | | 22.3 | | | | 21.2 | | | | 21.4 | |
| Other Taxes | | | 26.2 | | | | 25.9 | | | | 25.9 | | | | 25.7 | | | | 26.3 | | | | 27.4 | |
| Fees and Other Revenue | | | 13.2 | | | | 13.3 | | | | 14.2 | | | | 13.5 | | | | 13.0 | | | | 13.1 | |
| Federal Transfers | | | 29.5 | | | | 31.1 | | | | 31.0 | | | | 30.3 | | | | 28.8 | | | | 29.0 | |
| Net Income of Government | | | | | | | | | | | | | | | | | | | | | | | | |
| Business Enterprises | | | 5.8 | | | | 5.7 | | | | 6.1 | | | | 6.0 | | | | 7.6 | | | | 5.5 | |
| Sinking Funds and Other Earnings | | | 1.8 | | | | 1.7 | | | | 1.7 | | | | 2.3 | | | | 3.1 | | | | 3.7 | |
| | | | | | | | | | | | | | | (Dollars) | | | | | | | | | | |
Dollars Per Capita | | | | | | | | | | | | | | | | | | | | | | | | |
| Total Revenue | | | 10,706 | | | | 10,628 | | | | 10,370 | | | | 10,587 | | | | 10,469 | | | | 9,656 | |
| Total Expenditure | | | 11,169 | | | | 11,054 | | | | 10,535 | | | | 10,213 | | | | 10,002 | | | | 9,247 | |
| Debt Servicing Costs | | | 645 | | | | 617 | | | | 620 | | | | 689 | | | | 724 | | | | 670 | |
| Summary Net Debt | | | 11,833 | | | | 10,720 | | | | 9,670 | | | | 9,513 | | | | 8,839 | | | | 9,122 | |
| |
Memorandum Items | | | | | | | | | | | | | | | | | | | | | | | | |
| Population (000’s) * | | | 1,251.1 | | | | 1,235.4 | | | | 1,219.6 | | | | 1,205.5 | | | | 1,193.6 | | | | 1,184.0 | |
| GDP at Market Prices ($M) | | | 56,419 | | | | 53,528 | | | | 50,990 | | | | 51,065 | | | | 48,903 | | | | 45,150 | |
Source: Manitoba Finance
* official population July 1
Budget Paper B
SUPPLEMENTARY
FINANCIAL INFORMATION
SUPPLEMENTARY FINANCIAL INFORMATION
CONTENTS
| | | | | |
|
SPECIAL ACCOUNTS | | | 1 | |
| Fiscal Stabilization Account | | | 1 | |
| Debt Retirement Account | | | 2 | |
| Pension Assets Fund | | | 2 | |
CAPITAL INVESTMENT | | | 4 | |
CAPITAL INVESTMENT — CORE GOVERNMENT | | | 5 | |
LOAN REQUIREMENTS | | | 6 | |
BORROWING REQUIREMENTS | | | 8 | |
SUMMARY NET DEBT | | | 9 | |
BUDGET 2011 Supplementary Financial Information / B1
n SPECIAL ACCOUNTS
Fiscal Stabilization Account
The Fiscal Stabilization Account (FSA) is projected to have a balance of $667 million as at March 31, 2011, after a draw of $25 million for wait-time reduction programming and other health-related programming, a draw of $8 million related to ecoTrust and $11 million related to 2011 spring flood planning and preparation activities. As budgeted in 2010/11, $96 million will be utilized to retire a portion of the borrowings and incremental interest costs incurred during the period of recovery to support core government programs.
The budgeted draw in 2011/12 includes $25 million for health-related programming and $8 million for ecoTrust projects, funds prepaid by Canada in previous years and $124 million to retire a portion of the borrowings ($110 million) and incremental interest costs ($14 million) for Core Government in 2011/12. Also included is a net expenditure of $3 million for the 2011 spring flood contingency. The amount is made up of $30 million in expenditures offset by $27 million in recoveries from Canada for disaster financial assistance.
Fiscal Stabilization Account
Revenue, Expenditure and Balance
Projection as at March 31, 2012 and March 31, 2011
(Millions of Dollars)
| | | | | | | | | |
| | | 2011/12 | | 2010/11 |
| | | Budget | | Forecast |
Total Account Balance, Beginning of Year | | | 667 | | | | 807 | |
| | | | | | | | | |
Health Programs | | | | | | | | |
| Balance, Beginning of Year | | | 33 | | | | 58 | |
| Core Government Transfers | | | | | | | | |
| Health-related Programming | | | (25 | ) | | | (25 | ) |
| | | | | | | | | |
| Balance, End of Year | | | 8 | | | | 33 | |
| | | | | | | | | |
General Programs | | | | | | | | |
| Balance, Beginning of Year | | | 634 | | | | 749 | |
| Core Government Transfers | | | | | | | | |
| 2011 Spring Flood | | | (3 | ) | | | (11 | ) |
| Debt Repayment and Incremental Debt Servicing Costs | | | (124 | ) | | | (96 | ) |
| ecoTrust | | | (8 | ) | | | (8 | ) |
| | | | | | | | | |
| Balance, End of Year | | | 499 | | | | 634 | |
| | | | | | | | | |
Total Account Balance, End of Year | | | 507 | | | | 667 | |
| | | | | | | | | |
B2 / Supplementary Financial Information BUDGET 2011
Debt Retirement Account
In 2010/11 the entire balance of $145 million of the debt retirement account was utilized to repay general purpose debt as part of Manitoba’s five-year plan.
Pension Assets Fund
The government continues its commitment to fund the province’s unfunded pension liabilities. As part of this commitment, the province has changed the trust conditions of the funds held in the Pension Asset Fund to clarify that these funds are irrevocably restricted for pension purposes only. Net investment earnings of pension assets include the expected rate of return during the year as well as adjustments to market related value. Market fluctuations of pension assets are not recorded in the year in which they occur, but are recognized over the employee average remaining service life.
The fund is expected to increase as a result of the government’s plan to set aside $240 million in 2011/12 as we continue addressing the province’s unfunded liability for the Civil Service Superannuation Fund. This amount is in addition to the amount funded in 2009/10 and 2010/11, of $330 million and $180 million respectively.
The fund is expected to have a balance of $3,539 million by the end of the 2011/12 fiscal year.
Pension Assets Fund
Projection as at March 31, 2012 and March 31, 2011
(Millions of Dollars)
| | | | | | | | | |
| | | 2011/12 | | 2010/11 |
| | | Budget | | Forecast |
Balance, Beginning of Year | | | 3,236 | | | | 3,008 | |
| | | | | | | | | |
| | | | | | | | | |
Contributions and Revenue | | | | | | | | |
| New Investment | | | 240 | | | | 180 | |
| Net Investment Earnings | | | 164 | | | | 153 | |
| Departments and Crown Corporations | | | 145 | | | | 139 | |
| | | | | | | | | |
| | | | 549 | | | | 472 | |
| | | | | | | | | |
| | | | | | | | | |
Transfers | | | | | | | | |
| TRAF and CSSF Payments | | | (246 | ) | | | (244 | ) |
| | | | | | | | | |
| | | | | | | | | |
Balance, End of Year | | | 3,539 | | | | 3,236 | |
| | | | | | | | | |
BUDGET 2011 Supplementary Financial Information / B3
SUMMARY OF ACCOUNT/FUND ACTIVITY
| | | | | | | | | | | | | | | | | | | | | | | | | | | | | | | | | | | | | | | | | | | | | | | | | | | | | |
| | | 11/12 | | 10/11 | | 09/10 | | 08/09 | | 07/08 | | 06/07 | | 05/06 | | 04/05 | | 03/04 | | 02/03 | | 01/02 | | 00/01 | | 99/00 |
| | | Budget | | Forecast | | Actual | | Actual | | Actual | | Actual | | Actual | | Actual | | Actual | | Actual | | Actual | | Actual | | Actual |
| | | (Millions of Dollars) |
Fiscal Stabilization Account | | | | | | | | | | | | | | | | | | | | | | | | | | | | | | | | | | | | | | | | | | | | | | | | | | | | |
| Transfers to Account | | | — | | | | — | | | | — | | | | 30 | | | | 128 | | | | 110 | | | | 31 | | | | 405 | | | | 13 | | | | 4 | | | | 63 | | | | 40 | | | | 11 | |
| Transfers from Account | | | (160 | ) | | | (140 | ) | | | (57 | ) | | | — | | | | — | | | | — | | | | — | | | | — | | | | (171 | ) | | | (22 | ) | | | (150 | ) | | | — | | | | (185 | ) |
| Investment Revenue | | | — | | | | — | | | | — | | | | 16 | | | | 27 | | | | 21 | | | | 15 | | | | 2 | | | | 1 | | | | 7 | | | | 14 | | | | 15 | | | | 12 | |
| Balance, End of Year | | | 507 | | | | 667 | | | | 807 | | | | 864 | | | | 818 | | | | 663 | | | | 532 | | | | 486 | | | | 79 | | | | 236 | | | | 247 | | | | 320 | | | | 265 | |
| | | | | | | | | | | | | | | | | | | | | | | | | | | | | | | | | | | | | | | | | | | | | | | | | | | | | |
Debt Retirement Account | | | | | | | | | | | | | | | | | | | | | | | | | | | | | | | | | | | | | | | | | | | | | | | | | | | | |
| Contribution | | | — | | | | — | | | | 20 | | | | 110 | | | | 110 | | | | 110 | | | | 110 | | | | 99 | | | | 96 | | | | 96 | | | | 96 | | | | 96 | | | | 75 | |
| Interest Earnings | | | — | | | | — | | | | 1 | | | | 1 | | | | 2 | | | | 1 | | | | — | | | | 2 | | | | 7 | | | | 3 | | | | 5 | | | | — | | | | — | |
| Transfers to Pension Assets Fund | | | — | | | | — | | | | (10 | ) | | | (55 | ) | | | (85 | ) | | | (85 | ) | | | (85 | ) | | | (79 | ) | | | (75 | ) | | | (48 | ) | | | (75 | ) | | | (21 | ) | | | — | |
| Transfers for General Purpose Debt Reduction | | | — | | | | (145 | ) | | | — | | | | — | | | | — | | | | — | | | | — | | | | (202 | ) | | | — | | | | — | | | | — | | | | — | | | | (305 | ) |
| Balance, End of Year | | | — | | | | — | | | | 145 | | | | 134 | | | | 78 | | | | 51 | | | | 25 | | | | — | | | | 180 | | | | 152 | | | | 101 | | | | 75 | | | | — | |
| | | | | | | | | | | | | | | | | | | | | | | | | | | | | | | | | | | | | | | | | | | | | | | | | | | | | |
Pension Assets Fund | | | | | | | | | | | | | | | | | | | | | | | | | | | | | | | | | | | | | | | | | | | | | | | | | | | | |
| Transfers from Debt Retirement Account | | | — | | | | — | | | | 10 | | | | 55 | | | | 85 | | | | 85 | | | | 85 | | | | 79 | | | | 75 | | | | 48 | | | | 75 | | | | 21 | | | | | |
| Net Investment Earnings | | | 164 | | | | 153 | | | | 160 | | | | 41 | | | | 16 | | | | 67 | | | | 61 | | | | 31 | | | | 38 | | | | (6 | ) | | | 2 | | | | — | | | | | |
| Net Current Service Contributions | | | (101 | ) | | | (105 | ) | | | (100 | ) | | | (80 | ) | | | (60 | ) | | | 10 | | | | 8 | | | | 6 | | | | 3 | | | | 2 | | | | 9 | | | | — | | | | | |
| TRAF/CSSF Funding | | | 240 | | | | 180 | | | | 330 | | | | 350 | | | | 1,502 | | | | | | | | | | | | | | | | | | | | | | | | | | | | | | | | | |
| Balance, End of Year | | | 3,539 | | | | 3,236 | | | | 3,008 | | | | 2,608 | | | | 2,242 | | | | 699 | | | | 537 | | | | 383 | | | | 267 | | | | 151 | | | | 107 | | | | 21 | | | | | |
B4 / Supplementary Financial Information BUDGET 2011
n CAPITAL INVESTMENT
Capital investment continues to be a priority for government, with the cost of these assets amortized over a set period that represents the useful life of the asset as required by GAAP. These set periods result in regular repayment of debt. The end result is increased infrastructure investment for Manitobans while spreading the cost of those assets over their useful life, a strategy which includes a plan to pay the debt. The net book value of these assets (cost less accumulated amortization) has almost tripled since 1999/2000 and is a major asset of the province in providing services to Manitobans into the future.
The investment in tangible capital assets is projected to be $15.9 billion as of March 31, 2012 and with $6.4 billion of related debt having been retired through accumulated amortization. Core government will have a total of $6.5 billion in capital asset investments as of March 31, 2012 and $2.1 billion of related debt will have been retired through accumulated amortization.
Tangible Capital Assets —
Net Book Value
BUDGET 2011 Supplementary Financial Information / B5
n CAPITAL INVESTMENT — CORE GOVERNMENT
Provincially owned capital assets such as highways, waterways, buildings, machinery and computer systems are amortized over their useful life based on established guidelines for amortization (see Appendix B of the 2011/12 Estimates of Expenditure). The amortization and interest costs are borne by departments that are responsible for each asset and are reflected as annual costs related to capital assets. In total, costs related to capital assets are estimated at $319 million in 2011/12, an increase of $39 million from 2010/11. In 2011/12, departmental appropriations include $171 million for amortization and $148 million for allocation of interest.
Authority for the annual cost to acquire provincially owned assets is reflected as Part B — Capital Investment which totals $808 million in 2011/12, an increase of $11 million from 2010/11.
Capital Investment, 2011/12
(Thousands of Dollars)
| | | | | | | | | |
| | | 2011/12 | | 2010/11 |
| | | Budget | | Budget* |
General Assets | | | | | | | | |
| Government Services Capital Projects | | | 147,336 | | | | 160,482 | |
| Transportation Equipment and Aircraft | | | 76,403 | | | | 58,814 | |
| Information Technology Projects | | | | | | | | |
| Corporate Information Technology Projects | | | 23,297 | | | | 10,638 | |
| Advanced Education and Literacy | | | 1,132 | | | | 6,162 | |
| Entrepreneurship, Training and Trade | | | 2,829 | | | | 3,146 | |
| Family Services and Consumer Affairs | | | 360 | | | | 613 | |
| Health | | | 175 | | | | 1,200 | |
| Justice | | | 300 | | | | 1,422 | |
| Other Equipment and Buildings | | | 14,178 | | | | 6,722 | |
| | | | | | | | | |
| | | | 266,010 | | | | 249,199 | |
| | | | | | | | | |
Infrastructure Assets | | | | | | | | |
| Provincial Roads, Highways and Airport Infrastructure | | | 368,000 | | | | 367,075 | |
| Floodway Expansion and East Side Road Authority | | | 133,133 | | | | 153,565 | |
| Water Control Infrastructure | | | 24,150 | | | | 10,600 | |
| Parks, Cottage and Camping Projects | | | 16,757 | | | | 16,757 | |
| | | | | | | | | |
| | | | 542,040 | | | | 547,997 | |
| | | | | | | | | |
Total Capital Investment | | | 808,050 | | | | 797,196 | |
| | | | | | | | | |
| | |
| * | | The 2010/11 Budget has been restated to be consistent with the 2011/12 Budget presentation. |
B6 / Supplementary Financial Information BUDGET 2011
n LOAN REQUIREMENTS
The Loan Act, 2011 provides borrowing and expenditure authority and, in some cases, guarantee authority for the government and its agencies to undertake self-sustaining programs, where self-sustaining means having the ability for repayment. This authority is in addition to that voted in the printed estimates review.
Incremental Capital Authority Requirements for Non-Budgetary Programs, 2011/12
(Thousands of Dollars)
| | | | | |
|
The Loan Act, 2011 | | | | |
| The Manitoba Hydro-Electric Board | | $ | 595,000 | |
| Health Capital Program | | | 212,161 | |
| Manitoba Housing and Renewal Corporation | | | 140,000 | |
| Post-secondary Institutions | | | 121,017 | |
| Manitoba Opportunities Fund Ltd. | | | 111,656 | |
| Manitoba Agricultural Services Corporation | | | 95,539 | |
| The Manitoba Lotteries Corporation | | | 70,700 | |
| Manitoba Student Aid Program | | | 23,356 | |
| The Manitoba Water Services Board | | | 12,335 | |
| Special Operating Agencies Financing Authority — Vehicles and Equipment Management Agency | | | 11,000 | |
| Diagnostic Services Manitoba | | | 10,380 | |
| Northern Affairs Communities | | | 8,784 | |
| Communities Economic Development Fund | | | 6,800 | |
| Manitoba Film Guarantee Program | | | 300 | |
| | | | |
| | | $ | 1,419,028 | |
| | | | |
BUDGET 2011 Supplementary Financial Information / B7
Non-Budgetary Capital Programs, 2011/12
(Thousands of Dollars)
| | | | | |
|
| The Manitoba Hydro-Electric Board | | $ | 1,168,000 | |
| Manitoba Housing and Renewal Corporation | | | 403,190 | |
| Health Capital Program | | | 335,446 | |
| Post-secondary Institutions | | | 184,088 | |
| Manitoba Agricultural Services Corporation | | | 116,225 | |
| The Manitoba Lotteries Corporation | | | 84,100 | |
| Manitoba Opportunities Fund | | | 84,480 | |
| Business Support (including Manitoba Industrial Opportunities Program) | | | 61,745 | |
| The Manitoba Water Services Board | | | 45,992 | |
| Special Operating Agencies Financing Authority — Vehicles and Equipment Management Agency | | | 34,104 | |
| Manitoba Student Aid Program | | | 32,370 | |
| Diagnostic Services Manitoba | | | 16,130 | |
| Northern Affairs Communities | | | 13,706 | |
| Communities Economic Development Fund | | | 9,000 | |
| Miscellaneous Corporations, Agencies and Other Programs | | | 12,515 | |
| | | | |
| | | $ | 2,601,091 | |
| | | | |
B8 / Supplementary Financial Information BUDGET 2011
BORROWING REQUIREMENTS
Manitoba’s borrowing requirements in respect of both general and self-sustaining borrowings is estimated to total $3.8 billion in 2011/12, of which $2 billion is required for refinancing purposes. New cash requirements of $2.7 billion are required for general government purposes, capital investments by departments, Manitoba Hydro and for the funding of the unfunded pension liability for the Civil Service Superannuation Plan. Estimated repayments are for general purpose borrowings, capital investment assets and health facilities. The Loan Act, 2011, provides incremental capital authority of $1.4 billion.
Borrowing Requirements 2011/12
(Thousands of Dollars)
| | | | | | | | | | | | | | | | | | | | | |
| | | New Cash | | | | | | | | | | Estimated | | Borrowing |
| | | Requirements | | Refinancing | | Prefunding | | Repayments | | Requirements |
Government Business Enterprises | | | | | | | | | | | | | | | | | | | | |
| Manitoba Hydro | | | 683,000 | | | | 485,000 | | | | 100,000 | | | | — | | | | 1,068,000 | |
| Manitoba Lotteries | | | 50,000 | | | | — | | | | — | | | | — | | | | 50,000 | |
| | | | | | | | | | | | | | | | | | | | | |
| Subtotal | | | 733,000 | | | | 485,000 | | | | 100,000 | | | | — | | | | 1,118,000 | |
| | | | | | | | | | | | | | | | | | | | | |
Other Borrowings | | | | | | | | | | | | | | | — | | | | — | |
| General Purpose Borrowings | | | 514,000 | | | | 1,142,547 | | | | 288,812 | | | | 160,000 | | | | 1,207,735 | |
| Capital Investment Assets | | | 808,050 | | | | 330,753 | | | | 100,000 | | | | 171,376 | | | | 867,427 | |
| Civil Service Superannuation Plan | | | 240,000 | | | | — | | | | — | | | | — | | | | 240,000 | |
| Health Facilities | | | 240,000 | | | | — | | | | — | | | | 80,662 | | | | 159,338 | |
| Post-Secondary Institutions | | | 125,000 | | | | — | | | | — | | | | — | | | | 125,000 | |
| Other Crowns and Organizations | | | 50,000 | | | | — | | | | — | | | | — | | | | 50,000 | |
| | | | | | | | | | | | | | | | | | | | | |
| Subtotal | | | 1,977,050 | | | | 1,473,300 | | | | 388,812 | | | | 412,038 | | | | 2,649,500 | |
| | | | | | | | | | | | | | | | | | | | | |
Total Borrowing Requirements | | | 2,710,050 | | | | 1,958,300 | | | | 488,812 | | | | 412,038 | | | | 3,767,500 | |
| | | | | | | | | | | | | | | | | | | | | |
BUDGET 2011 Supplementary Financial Information / B9
n SUMMARY NET DEBT
Changes in Summary Net Debt
(Millions of Dollars)
| | | | | |
|
2010/11 Summary Net Debt (Forecast) | | | 13,244 | |
| | | | | |
Net Investment in Tangible Capital Assets | | | | |
| Core Government | | | 637 | |
| Other Reporting Entities | | | 485 | |
| | | | | |
| | | | 1,122 | |
| | | | | |
Plus: Projected (Income) Loss for the Year | | | | |
| Core Government | | | 464 | |
| Other Reporting Entities | | | (26 | ) |
| | | | | |
| | | | 438 | |
| | | | | |
Change in Net Debt | | | 1,560 | |
| | | | | |
2011/12 Summary Net Debt (Budget) | | | 14,804 | |
| | | | | |
In Budget 2011, the net debt-to-GDP ratio is forecast to be 26.2%, fourth lowest among provinces. Net debt is an important indicator of a government’s financial position as this highlights the affordability of future government service. Summary net debt represents the difference between the Government Reporting Entities’ total liabilities, such as borrowing and financing, less its financial assets* — it reflects the residual liability that must be financed by future revenues. Net debt may grow in absolute terms from time to time, as needed investments in capital assets — like the Red River Floodway, highway infrastructure and economic stimulus investments — are made. These investments underpin and support Manitoba’s economic performance. It is important to measure changes in net debt against the growth of the economy, as measured by the nominal GDP.
| | |
| * | | Financial assets are liquid assets such as cash, investments, loans and accounts receivable that could be readily converted to cash. |
B10 / Supplementary Financial Information BUDGET 2011
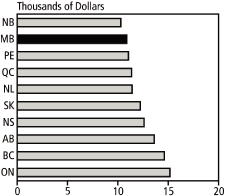
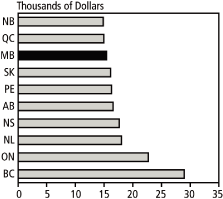
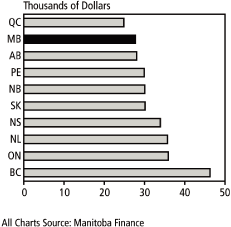
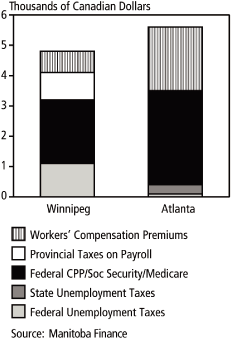
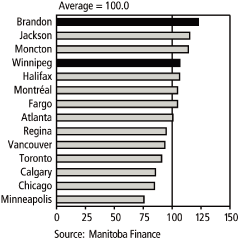
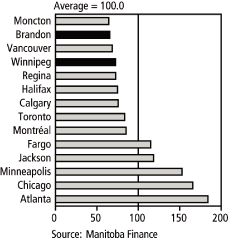
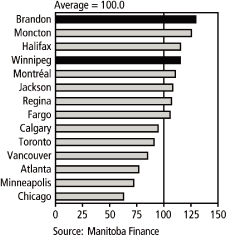
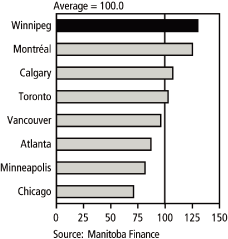
n INTERPROVINCIAL COMPARISONS
Budget Paper C
TAXATION ADJUSTMENTS
INCLUDES
THE MANITOBA ADVANTAGE
AGE-FRIENDLY MANITOBA: THE GOLDEN YEARS
TAXATION ADJUSTMENTS
CONTENTS
| | | | | |
|
SUMMARY OF 2011 TAX MEASURES | | | 1 | |
| | | | | |
PERSONAL MEASURES | | | 2 | |
| | | | | |
| Basic Personal Amount, Spousal Amount and Eligible Dependent Amount | | | 2 | |
| Basic Education Property Tax Credit | | | 2 | |
| Seniors’ Education Property Tax Credit | | | 3 | |
| Children’s Arts and Cultural Activity Tax Credit | | | 3 | |
| Primary Caregiver Tax Credit | | | 3 | |
| Mineral Exploration Tax Credit | | | 4 | |
| Community Enterprise Development Tax Credit | | | 4 | |
| | | | | |
HEALTH AND GREEN MEASURES | | | 4 | |
| | | | | |
| Tobacco Tax | | | 4 | |
| Emissions Tax on Coal | | | 5 | |
| Sales Tax Exemption on Biomass Materials | | | 5 | |
| Green Energy Equipment Tax Credit | | | 5 | |
| | | | | |
BUSINESS AND FARM MEASURES | | | 5 | |
| | | | | |
| Manufacturing Investment Tax Credit | | | 5 | |
| Farmland School Tax Rebate | | | 6 | |
| Capital Tax Exemption for Small Banks | | | 6 | |
| Cultural Industries Printing Tax Credit | | | 6 | |
| Book Publishing Tax Credit | | | 7 | |
| Neighbourhoods Alive! Tax Credit | | | 7 | |
| Co-op Education and Apprenticeship Tax Credits | | | 8 | |
| Sales Tax Exemption for Municipal Flood Protection | | | 8 | |
| Odour Control Tax Credit | | | 8 | |
| | | | | |
TECHNICAL AND ADMINISTRATIVE MEASURES | | | 9 | |
| | | | | |
CONTACTS FOR FURTHER INFORMATION | | | 10 | |
| | | | | |
PERSONAL TAX SAVINGS SINCE 1999 | | | 12 | |
| | | | | |
MANITOBA INCOME TAX SAVINGS FOR TYPICAL TAXPAYERS | | | 14 | |
| | | | | |
MANITOBA INCOME TAX SINCE 1999 | | | 15 | |
| | | | | |
2011 INTERPROVINCIAL COMPARISON OF TAX RATES | | | 16 | |
| | | | | |
FEDERAL AND MANITOBA INCOME TAX RATES, 2011 | | | 16 | |
| | | | | |
Appendix 1: MANITOBA TAX EXPENDITURES, 2010/11 | | | 18 | |
| | | | | |
Appendix 2: THE MANITOBA ADVANTAGE | | | 23 | |
| | | | | |
Appendix 3: AGE-FRIENDLY MANITOBA: THE GOLDEN YEARS | | | 37 | |
| | | | | |
Appendix 4: MANITOBA’S COMPETITIVE ENVIRONMENT FOR MANUFACTURING | | | 41 | |
BUDGET 2011 Taxation Adjustments / C1
n SUMMARY OF 2011 TAX MEASURES
A negative number represents a tax reduction.
| | | | | | | | | |
| | | 2011/12 | | Full Year |
| | | (Millions of Dollars) |
Ongoing Reductions 1 | | | | | | | | |
| Personal Tax reductions | | | -8.2 | | | | -26.2 | |
| Business Tax reductions | | | -64.8 | | | | -71.4 | |
| | | | | | | | | |
| | | | -73.0 | | | | -97.6 | |
| | | | | | | | | |
Personal Measures | | | | | | | | |
| Basic Personal Amount, Spousal Amount and Eligible Dependent Amount increased | | | -28.6 | | | | -76.7 | |
Basic Education Property Tax Credit increased 2 | | | -16.0 | | | | -16.0 | |
Seniors’ Education Property Tax Credit increased 2 | | | -2.0 | | | | -4.8 | |
| Children’s Arts and Cultural Activity Tax Credit introduced | | | -3.8 | | | | -3.0 | |
| Primary Caregiver Tax Credit increased | | | -2.0 | | | | -1.6 | |
| Mineral Exploration Tax Credit extended | | | -0.4 | | | | -1.5 | |
| Community Enterprise Development Tax Credit extended | | | — | | | | -0.1 | |
| | | | | | | | | |
| | | | -52.8 | | | | -103.7 | |
| | | | | | | | | |
Health and Green Measures | | | | | | | | |
| Tobacco Tax increased | | | 17.4 | | | | 18.0 | |
| Emissions Tax on coal introduced | | | 0.4 | | | | 1.6 | |
| Sales Tax Exemption on Biomass Materials | | | — | | | | -0.1 | |
| Green Energy Equipment Tax Credit increased | | | -0.3 | | | | -0.3 | |
| | | | | | | | | |
| | | | 17.6 | | | | 19.2 | |
| | | | | | | | | |
Business and Farm Measures | | | | | | | | |
| Manufacturing Investment Tax Credit extended | | | -8.4 | | | | -34.3 | |
Farmland School Tax Rebate increased 2 | | | -2.5 | | | | -2.0 | |
| Capital Tax exemption for small banks introduced | | | -0.8 | | | | -0.7 | |
| Cultural Industries Printing Tax Credit introduced | | | -0.1 | | | | -0.5 | |
| Book Publishing Tax Credit extended and expanded | | | -0.1 | | | | -0.5 | |
| Neighbourhoods Alive! Tax Credit introduced | | | — | | | | -0.4 | |
| Co-op Education and Apprenticeship Tax Credits extended | | | -0.1 | | | | -0.2 | |
| Sales Tax exemption for municipal flood protection introduced | | | -0.1 | | | | -0.1 | |
| Odour Control Tax Credit extended | | | — | | | | -0.1 | |
| | | | | | | | | |
| | | | -12.1 | | | | -38.8 | |
| | | | | | | | | |
Total Changes, 2011 Budget | | | -47.3 | | | | -123.3 | |
| | | | | | | | | |
Total Changes Including Ongoing Tax Reductions | | | -120.3 | | | | -220.9 | |
| | |
| 1 | | Tax measures previously announced that take effect after 2010: |
| | - | | Fitness Tax Credit for young adults |
| |
| | - | | increased take-up in Tuition Fee Income Tax Rebate |
| |
| | - | | elimination of the general Capital Tax and small business corporation income tax rate |
| |
| | - | | enhanced R&D Tax Credit refundability |
| |
| | - | | expanded Co-op Education and Apprenticeship Tax Credits |
2011/12 savings for new measures that begin January 1, 2011 include January to March 2011 savings.
C2 / Taxation Adjustments BUDGET 2011
n PERSONAL MEASURES
Basic Personal Amount, Spousal Amount and Eligible Dependent Amount
(2011/12 revenue impact: -$28.6 million)
The values for all three amounts are increased by $1,000. The increases will be made incrementally over four years with the amounts going from $8,134 to $8,384 in 2011, $8,634 in 2012, $8,884 in 2013 and $9,134 in 2014.
The basic personal amount benefits all Manitoba taxpayers. The spousal amount benefits married couples and common-law partners, and the eligible dependent amount benefits single parents with a minor child.
The following table summarizes the tax savings for an individual Manitoban, a couple (married or common-law partners), and a single parent.
| | | | | | | | | | | | | |
| | | Tax Savings |
| | | Individual | | Couple | | Single Parent |
| 2011 | | $ | 27 | | | $ | 54 | | | $ | 54 | |
| 2012 | | $ | 54 | | | $ | 108 | | | $ | 108 | |
| 2013 | | $ | 81 | | | $ | 162 | | | $ | 162 | |
| 2014 | | $ | 108 | | | $ | 216 | | | $ | 216 | |
| | | | | | | | | | | | | |
| Cumulative Savings | | $ | 270 | | | $ | 540 | | | $ | 540 | |
The increased amounts will benefit over 648,000 individual Manitobans, over 36,000 couples and common-law partnerships, and nearly 18,000 single parents. By 2014, almost 22,000 Manitobans will no longer pay Manitoba income tax because of the increased amounts.
The full-year revenue impact of these increased credits is -$76.7 million.
For more information, contact Location B, page C10
Basic Education Property Tax Credit
(2011/12 expenditure impact: $16.0 million)
The basic Education Property Tax Credit is increased from $650 to $700 commencing in 2011.
The basic tax credit is a refundable tax credit that reduces property taxes payable by homeowners and provides residential tenants with an annual income tax benefit. The basic credit is not income-tested and benefits low-income Manitobans who do not pay income tax.
Homeowners with sufficient property taxes will have the basic tax credit subtracted from their property tax bill, starting in 2011. Residential tenants who pay at least $4,750 in annual rent ($395 monthly on average) will benefit from the increased basic credit when they file their income tax return, beginning with their 2011 returns filed in early 2012.
The province reimburses school divisions and municipal governments for the basic credits claimed by homeowners in their jurisdiction.
The increased basic credit will save 293,000 homeowners and 128,000 tenants an estimated $16.0 million annually.
For more information, contact Location B, page C10
BUDGET 2011 Taxation Adjustments / C3
Seniors’ Education Property Tax Credit
(2011/12 expenditure impact: $2.0 million)
The maximum tax credit for seniors is increased from $800 to:
| • | | $950 in 2011, providing an average benefit of $62 to about 21,000 senior households with family income of less than $25,000; |
| |
| • | | $1,025 in 2012, providing an average benefit of $107 to over 27,000 senior households with family income of less than $32,500; and |
| |
| • | | $1,100 starting in 2013, providing an average benefit of $151 to over 31,000 senior households with family income of less than $40,000. |
These increased benefits are in addition to the $50 increase in the basic tax credit.
The full-year increase in total benefits when the maximum $1,100 seniors’ credit is reached in 2013 is $4.8 million.
For more information, contact Location B, page C10
Children’s Arts and Cultural Activity Tax Credit
(2011/12 revenue impact: -$3.8 million)
In order to foster enriching extra-curricular activities for children, a new Children’s Arts and Cultural Activity Tax Credit is introduced in 2011 to recognize organized and supervised arts and cultural activities taking place in Manitoba and outside a school’s regular program, including: supervised lessons in music, dramatic arts, dance and visual arts; language instruction; natural environment and wilderness activities; private tutoring in school subjects; and the development of interpersonal skills. Children’s organizations, including Girl Guides, Scouts, 4-H and Cadets, will also qualify.
The Children’s Arts and Cultural Activity Tax Credit is a 10.8% non-refundable income tax credit. Eligible activities costs of up to $500 can be claimed annually for a child under the age of 16, providing a family up to $54 in income tax savings for each child. For a child with a disability under the age of 18 on whom at least $100 is spent on eligible activities, the family qualifies for an additional $54 in income tax savings.
It is estimated that families representing up to 186,000 children will benefit from an additional $3.0 million in annual Manitoba income tax savings from the new credit.
The Manitoba Fitness Tax Credit, which is currently available for children and young adults under age 25, is not affected by this change.
For more information, contact Location A, page C10
Primary Caregiver Tax Credit
(2011/12 revenue impact: -$2.0 million)
The Primary Caregiver Tax Credit is increased by 25% from a maximum annual amount of $1,020 to $1,275 beginning in 2011.
The tax credit was introduced in 2009 to provide recognition and financial supports to Manitobans who serve as volunteer primary caregivers to assist care recipients to live independently in their own homes. The credit builds upon the Manitoba Home Care Program, the Community Living Disability Services (formerly Supported Living) and the Children’s disABILITY Services (formerly Children’s Special Services). One volunteer caregiver can claim up to three care recipients at one time, for a
C4 / Taxation Adjustments BUDGET 2011
potential maximum annual tax credit of $3,825. The credit is claimed on the volunteer primary caregiver’s income tax return and is not income tested.
The increase provides an estimated $1.6 million annually in additional credits to over 5,000 volunteer primary caregivers.
For more information, contact Location B, page C10
Mineral Exploration Tax Credit
(2011/12 revenue impact: -$0.4 million)
The Mineral Exploration Tax Credit, scheduled to expire with respect to flow-through share agreements entered into after March 2012, will be extended to cover flow-through share agreements entered into before April 1, 2015.
The tax credit is a 30% non-refundable personal income tax credit for Manitoba residents who invest in eligible flow-through shares of qualifying mineral exploration companies. There is no cap on the maximum eligible investment by an individual investor, and no limit on the maximum amount of tax credits claimable in a given year.
The full-year revenue impact is estimated at -$1.5 million.
For more information, contact Location D, page C10
Community Enterprise Development Tax Credit
(2011/12 revenue impact: less than -$0.1 million)
The Community Enterprise Development Tax Credit, scheduled to expire on December 31, 2011, will be extended to December 31, 2014.
The tax credit is a non-refundable personal income tax credit that encourages Manitobans to invest in enterprises in their communities. Eligible enterprises can apply to issue up to $1,000,000 in tax creditable shares to Manitoba investors. Investors receive a 30% tax credit on a maximum annual investment of $30,000 (up to $9,000 in tax credits). Shares acquired through an individual investor’s registered retirement savings plan or tax free savings account are also eligible for the tax credit.
The full-year revenue impact is estimated at -$0.1 million.
For more information, contact Location G, page C10
n HEALTH AND GREEN MEASURES
Tobacco Tax
(2011/12 revenue impact: $17.4 million)
The Tobacco Tax rate is increased effective midnight, April 12, 2011. The rate per cigarette will increase from 20.5¢ to 22.5¢; the rate on fine-cut tobacco will increase from 19.5¢ to 21.5¢ per gram; and the rate on raw leaf tobacco will increase from 18¢ to 20¢ per gram.
The estimated additional full-year revenue is $18.0 million.
For more information, contact Location C, page C10
BUDGET 2011 Taxation Adjustments / C5
Emissions Tax on Coal
(2011/12 revenue impact: $0.4 million)
Commencing January 1, 2012, coal used in Manitoba will be subject to a new Emissions Tax equal to $10 per tonne of carbon-dioxide-equivalent emissions.
Burning coal generates the highest level of greenhouse gas emissions compared to other fossil fuels. Beginning on January 1, 2014, coal used for space and water heating will be banned in Manitoba. Coal used for generating electricity or for industrial purposes will continue to be subject to the Emissions Tax in 2014.
The estimated additional full-year revenue is $1.6 million.
For more information, contact Location A, page C10
Sales Tax Exemption on Biomass Materials
(2011/12 revenue impact: less than -$0.1 million)
The sales tax exemption on straw pellets used for heating or cooking is expanded to include biomass materials, commencing May 1, 2011.
The full-year revenue impact is -$0.1 million.
For more information, contact Location C, page C10
Green Energy Equipment Tax Credit
(2011/12 revenue impact: -$0.3 million)
The total Green Energy Equipment Tax Credit on geothermal heating systems is increased from 10% to 15%, effective for installations after April 12, 2011.
The tax credit for Manitoba manufacturers of qualifying geothermal heat pumps will increase from 5% to 7.5%. The tax credit for purchasers of qualifying made-in-Manitoba geothermal heat pumps installed in Manitoba will also increase from 5% to 7.5%. The tax credit applicable to other eligible installation costs for geothermal heating systems installed in Manitoba will increase from 10% to 15%.
The tax credit for purchasers of solar heating systems will remain at 10%. The province is also examining broadening the 10% tax credit to made-in-Manitoba transformers and converters which are sold for use in Manitoba.
The tax credit is a refundable income tax credit that is available to individuals, institutions and businesses.
The estimated increase in full-year tax credits is $0.3 million.
For more information, contact Location A, page C10
n BUSINESS AND FARM MEASURES
Manufacturing Investment Tax Credit
(2011/12 revenue impact: -$8.4 million)
The Manufacturing Investment Tax Credit, scheduled to expire on December 31, 2011, will be extended to December 31, 2014.
The tax credit provides Manitoba companies with a 10% corporation income tax credit based on the capital cost of new and used manufacturing buildings, machinery and equipment acquired for use in manufacturing or processing in Manitoba.
C6 / Taxation Adjustments BUDGET 2011
Seven-tenths of the 10% tax credit is refundable and the remaining three-tenths can be applied against Manitoba corporate income tax payable in the year earned, or carried back to recover Manitoba income tax paid in the previous three years, or carried forward up to 10 years to reduce future Manitoba income taxes.
The full-year revenue impact is estimated at -$34.3 million.
For more information, contact Location A, page C10
Farmland School Tax Rebate
(2011/12 expenditure impact: $2.5 million)
The Farmland School Tax Rebate is increased from 75% to 80% starting in 2011.
The rebate offsets school taxes paid on farmland. It was introduced in 2004 at 33% and increased progressively to 75% in 2009.
The increased rebate reduces school taxes on farmland for over 10,000 farm families by an additional $2.0 million annually.
For more information, contact Location E, page C10
Capital Tax Exemption for Small Banks
(2011/12 revenue impact: -$0.8 million)
In order to attract and encourage the expansion of small, innovative financial institutions in Manitoba, banks with taxable paid-up capital under $4 billion are exempted from the 3% capital tax, commencing with taxation years ending after April 12, 2011. This provides Manitoba companies with access to more diverse sources of capital for growing their businesses.
The estimated reduction in full-year revenue from the exemption for small banks is $0.7 million.
For more information, contact Location C, page C10
Cultural Industries Printing Tax Credit
(2011/12 revenue impact: -$0.1 million)
The Cultural Industries Printing Tax Credit is a new 15% refundable credit for Manitoba printers based on eligible printing costs incurred and paid after April 12, 2011 and before 2015 in the production of eligible books. The new credit provides needed support to Manitoba’s cultural industries, while promoting the maintenance and creation of printing jobs in Manitoba.
Qualifying costs are amounts invoiced by the Manitoba printer to the publisher of a book for printing, assembly and binding services performed in Manitoba.
The criteria for eligible books will include hardcover or paperback format Canadian-authored non-periodical publications categorized as fiction, non-fiction, poetry, drama, biography, or children’s books. An eligible book is not limited to first editions. Excluded books include corporate and vanity publications, directories, agendas, catalogues, calendars, looseleaf publications, colouring, sticker, and activity books, and those containing advertising other than the publisher’s own promotional material.
A qualifying publisher must not be related to the Manitoba printer and must be carrying on business anywhere in Canada.
The full-year benefit to Manitoba printers is estimated at $0.5 million.
For more information, contact Location A, page C10
BUDGET 2011 Taxation Adjustments / C7
Book Publishing Tax Credit
(2011/12 revenue impact: -$0.1 million)
The Book Publishing Tax Credit, scheduled to expire on December 31, 2011, will be extended to December 31, 2014.
The tax credit is also expanded to include non-refundable monetary advances and labour costs related to publishing an electronic or digital version of an eligible literary work, for eligible expenses incurred and paid after April 12, 2011.
In addition, the bonus applied to Manitoba printing costs when an eligible book is printed on paper with a minimum of 30% recycled content is increased from 10% to 15%, for printing expenses incurred and paid by a publisher after April 12, 2011.
The tax credit was introduced in 2008 to assist the development of the book publishing industry in Manitoba. This fully refundable income tax credit is equal to 40% of eligible Manitoba labour costs plus non-refundable author advances. The maximum tax credit claimable by a publisher is $100,000 per year.
The estimated full-year revenue impact of these measures is -$0.5 million.
For more information, contact Location F, page C10
Neighbourhoods Alive! Tax Credit
(2011/12 revenue impact: less than -$0.1 million)
To promote community economic development and to assist Manitobans facing barriers to employment, the 30% Neighbourhoods Alive! Tax Credit is introduced. This unique and innovative tax credit encourages corporations with a permanent establishment in Manitoba to support and work with charitable organizations to establish new social enterprises in Manitoba.
The newly created social enterprise must be fully owned and controlled by a charitable organization in Manitoba, with a charitable purpose that matches the charity, and a mandate that includes hiring hard-to-employ Manitobans facing multiple barriers to employment.
Corporate donations provided in the year prior to the establishment of the social enterprise and during the first three years of the social enterprise are eligible for the tax credit. Eligible donations must be made after April 12, 2011 and before 2020 to qualify for the tax credit.
The maximum tax credit a corporation can earn in a given year is $15,000, based on a minimum $50,000 donation made to a qualifying registered charity in the previous year. The corporation must provide in-kind services to the charity during the year to support developing, managing and operating a new social enterprise. The tax credit offsets Manitoba corporation income tax otherwise payable. Tax credits earned but unused by a contributor in a given year can be carried back up to three years, but no earlier than a tax year ending after April 12, 2011, and any remaining credits can be carried forward up to 10 years.
The full-year revenue impact is estimated at -$0.4 million.
For more information, contact Location A, page C10
C8 / Taxation Adjustments BUDGET 2011
Co-op Education and Apprenticeship Tax Credits
(2011/12 revenue impact: -$0.1 million)
Components of the Co-op Education and Apprenticeship Tax Credits, scheduled to expire on December 31, 2011, will be extended to December 31, 2014. In addition, the province is examining ways to simplify the application process.
The tax credits are a family of income tax credit programs that provide incentives to employers who offer work experience to young Manitobans. The Co-op Students Hiring Incentive was first introduced as the Co-operative Education Tax Credit in the 2003 Manitoba Budget for placement of students in post-secondary co-operative education programs. In 2006, the Co-op Graduates Hiring Incentive extended the credit to cover hiring graduates of co-op programs. In 2008, the Journeypersons Hiring Incentive extended the credit to cover hiring recent graduates of apprenticeship programs. In 2009 and 2010, two more components were introduced to include apprentices: the Advanced-Level Apprentices Hiring Incentive and the Early-Level Apprentices Hiring Incentive.
All components of the tax credit are fully refundable. Eligible employers include taxable corporations or exempt corporate entities (including not-for-profit agencies, Manitoba Crown entities, municipalities, universities, schools and hospitals). Unincorporated employers may claim the refundable credit on their individual income tax return.
The full-year revenue impact is estimated at -$0.2 million.
For more information, contact Location B, page C10
Sales Tax Exemption for Municipal Flood Protection
(2011/12 revenue impact: -$0.1 million)
The sales tax exemption for municipalities is expanded commencing March 1, 2011 to include sandbag-filling services and the following flood protection materials: flood tubes, sand/salt mixtures for sandbags, and sandbag ties.
The full-year revenue impact is -$0.1 million.
For more information, contact Location C, page C10
Odour Control Tax Credit
(2011/12 revenue impact: less than -$0.1 million)
The Odour Control Tax Credit, scheduled to expire on December 31, 2011, will be extended to December 31, 2014.
The tax credit was established in 2004 to provide a 10% non-refundable corporate income tax credit for businesses that invest in capital property for the purpose of preventing, eliminating or significantly reducing nuisance odours arising from the use or production of organic waste. Budget 2006 expanded the credit making it refundable to agricultural producers, including individual farmers. The maximum refundable credit is equal to the total of Manitoba income tax payable and the amount of property taxes paid on Manitoba farmland by the agricultural producer in the year in which eligible capital property was acquired.
The full-year revenue impact is estimated at -$0.1 million.
For more information, contact Location A, page C10
BUDGET 2011 Taxation Adjustments / C9
n TECHNICAL AND ADMINISTRATIVE MEASURES
The Land Transfer Tax exemption on transfers of title between common-law partners will be amended to include partners registered under The Vital Statistics Act, retroactive to 2004. Eligible transferees can apply for a refund of tax paid.
For more information, contact Location A, page C10
The taxpayer’s ability to elect to renounce, in whole or in part, the Manitoba R&D Tax Credit will be extended to the Manufacturing Investment Tax Credit and the Odour Control Tax Credit.
For more information, contact Location A, page C10
As announced last year, the refundable Fertility Treatment Tax Credit will be amended, retroactive to October 1, 2010 when the credit began, as follows:
| • | | allowing the tax credit to be claimed by either spouse or partner, but not split between spouses or partners; |
| |
| • | | recognizing fertility treatments provided by Manitoba physicians and clinics; |
| |
| • | | covering medications prescribed by a licensed physician in Manitoba for fertility treatments even if the medications are tied to fertility treatments received outside of Manitoba; and |
| |
| • | | clarifying that fertility treatments to reverse elective sterilization procedures such as vasectomies or tubal ligations do not qualify for the tax credit. |
For more information, contact Location A, page C10
Enhanced enforcement measures will be implemented under The Tax Administration and Miscellaneous Taxes Act.
For more information, contact Location C, page C10
C10 / Taxation Adjustments BUDGET 2011
n CONTACTS FOR FURTHER INFORMATION
| | | | | | | |
|
A | | Taxation, Economic and
Intergovernmental Fiscal Research
Division, Manitoba Finance | | Telephone:
Fax:
e-mail: | | 204-945-3757
204-945-5051
feedbackfin@gov.mb.ca |
| | | | | | | |
B | | Manitoba Tax Assistance Office,
Manitoba Finance | | Telephone:
Toll-free:
Fax:
e-mail: | | 204-948-2115 in Winnipeg
1-800-782-0771
204-948-2263
tao@gov.mb.ca |
| | | | | | | |
C | | Taxation Division,
Manitoba Finance | | Telephone:
Toll-free:
Fax:
e-mail: | | 204-945-5603 in Winnipeg
1-800-782-0318
204-945-0896
mbtax@gov.mb.ca |
| | | | | | | |
D | | Minerals Policy and Business
Development Unit,
Manitoba Innovation,
Energy and Mines | | Telephone:
Fax:
e-mail: | | 204-945-6566
204-945-8427
minesinfo@gov.mb.ca |
| | | | | | | |
E | | Manitoba Agricultural Services Corporation | | Telephone:
Fax:
e-mail: | | 204-726-7068
204-726-6849
fstr@masc.mb.ca |
| | | | | | | |
F | | Arts Branch,
Culture, Heritage and
Recreation Programs,
Manitoba Culture, Heritage
and Tourism | | Telephone:
Fax:
e-mail: | | 204-945-7581
204-948-1684
artsbranch@gov.mb.ca |
| | | | | | | |
G | | Ecnomic Development Initiatives,
Manitoba Agriculture,
Food and Rural Initiatives | | Toll-free:
Web: | | 1-800-567-7334
www.gov.mb.ca/agriculture/ri |
C12 / Taxation Adjustments BUDGET 2011
n PERSONAL TAX SAVINGS SINCE 1999
Personal Income Taxes, Education Property Tax Credits, Residential Education Support Levy and Farmland School Tax Rebate
| | | | | | | | | | | | | | | | | | | | | | | | | | | | | | | | | |
| | | 2000 | | 2001 | | 2002 | | 2003 | | 2004 | | 2005 | | 2006 | | 2007 |
| | | (Millions of Dollars) |
Income Tax Reductions | | | | | | | | | | | | | | | | | | | | | | | | | | | | | | | |
| BUDGET | | | | | | | | | | | | | | | | | | | | | | | | | | | | | | | | |
| 2000 | | | 9 | | | | 68 | | | | 34 | | | | | | | | | | | | | | | | | | | | | |
| 2001 | | | | | | | 29 | | | | 7 | | | | 18 | | | | | | | | | | | | | | | | | |
| 2002 | | | | | | | | | | | 15 | | | | | | | | | | | | | | | | | | | | | |
| 2003 | | | | | | | | | | | | | | | | | | | 39 | | | | | | | | | | | | | |
| 2005 | | | | | | | | | | | | | | | | | | | | | | | | | | | 30 | | | | | |
| 2006 | | | | | | | | | | | | | | | | | | | | | | | | | | | 8 | | | | 34 | |
| 2007 | | | | | | | | | | | | | | | | | | | | | | | | | | | | | | | 25 | |
| 2008 | | | | | | | | | | | | | | | | | | | | | | | | | | | | | | | | |
| 2010 | | | | | | | | | | | | | | | | | | | | | | | | | | | | | | | | |
| 2011 | | | | | | | | | | | | | | | | | | | | | | | | | | | | | | | | |
| SUBTOTAL | | | 9 | | | | 97 | | | | 56 | | | | 18 | | | | 39 | | | | — | | | | 38 | | | | 59 | |
| | | | | | | | | | | | | | | | | | | | | | | | | | | | | | | | | |
Property Tax Reductions1 | | | | | | | | | | | | | | | | | | | | | | | | | | | | | | | |
| BUDGET | | | | | | | | | | | | | | | | | | | | | | | | | | | | | | | | |
| 2000 | | | 26 | | | | | | | | | | | | | | | | | | | | | | | | | | | | | |
| 2001 | | | | | | | 27 | | | | | | | | | | | | | | | | | | | | | | | | | |
| 2002 | | | | | | | | | | | 10 | | | | | | | | | | | | | | | | | | | | | |
| 2003 | | | | | | | | | | | | | | | 19 | | | | | | | | | | | | | | | | | |
| 2004 | | | | | | | | | | | | | | | | | | | 23 | | | | | | | | | | | | | |
| 2005 | | | | | | | | | | | | | | | | | | | | | | | 37 | | | | | | | | | |
| 2006 | | | | | | | | | | | | | | | | | | | | | | | | | | | 39 | | | | | |
| 2007 | | | | | | | | | | | | | | | | | | | | | | | | | | | | | | | 42 | |
| 2008 | | | | | | | | | | | | | | | | | | | | | | | | | | | | | | | | |
| 2009 | | | | | | | | | | | | | | | | | | | | | | | | | | | | | | | | |
| 2011 | | | | | | | | | | | | | | | | | | | | | | | | | | | | | | | | |
| SUBTOTAL | | | 26 | | | | 27 | | | | 10 | | | | 19 | | | | 23 | | | | 37 | | | | 39 | | | | 42 | |
| | | | | | | | | | | | | | | | | | | | | | | | | | | | | | | | | |
| Annual Totals | | | 35 | | | | 124 | | | | 67 | | | | 37 | | | | 62 | | | | 37 | | | | 77 | | | | 101 | |
| Cumulative Annual Totals | | | 35 | | | | 159 | | | | 226 | | | | 262 | | | | 324 | | | | 361 | | | | 438 | | | | 539 | |
Totals may not add due to rounding.
| | |
| 1 | | Reductions include increases to the Education Property Tax Credit of $156 million; the introduction of and increases to the Farmland School Tax Rebate of $35 million; and reductions to the Education Support Levy which was eliminated in 2006 (the elimination of ESL now provides annual tax savings of $145 million compared to $100 million in 2006). |
BUDGET 2011 Taxation Adjustments / C13
| | | | | | | | | | | | | | | | | | | | | | | | | | | | | | | | | |
| | | | | | | | | | | | | | | | | | | | | | | | | | | | | Cumulative |
| | | | | | | | | | | | | | | | | | | | | | | | | | | | | Annual |
| 2008 | | 2009 | | 2010 | | 2011 | | 2012 | | 2013 | | 2014 | | Totals |
| (Millions of Dollars) | | | | |
| | | | | | | | | | | | | | | | | | | | | | | | | | | | | | Income Tax Reductions |
| | | | | | | | | | | | | | | | | | | | | | | | | | | | | | | | | BUDGET |
| | | | | | | | | | | | | | | | | | | | | | | | | | | | | | 111 | | | 2000 |
| | | | | | | | | | | | | | | | | | | | | | | | | | | | | | 54 | | | 2001 |
| | | | | | | | | | | | | | | | | | | | | | | | | | | | | | 15 | | | 2002 |
| | | | | | | | | | | | | | | | | | | | | | | | | | | | | | 39 | | | 2003 |
| | | | | | | | | | | | | | | | | | | | | | | | | | | | | | 30 | | | 2005 |
| | | | | | | | | | | | | | | | | | | | | | | | | | | | | | 42 | | | 2006 |
| | 51 | | | | 28 | | | | 16 | | | | | | | | | | | | | | | | | | | | 120 | | | 2007 |
| | 1 | | | | 24 | | | | 11 | | | | | | | | | | | | | | | | | | | | 36 | | | 2008 |
| | | | | | | | | | 3 | | | | 8 | | | | | | | | | | | | | | | | 11 | | | 2010 |
| | | | | | | | | | | | | | 24 | | | | 20 | | | | 19 | | | | 19 | | | | 81 | | | 2011 |
| | 52 | | | | 52 | | | | 30 | | | | 32 | | | | 20 | | | | 19 | | | | 19 | | | | 539 | | | SUBTOTAL |
| | | | | |
| | | | | | | | | | | | | | | | | | | | | | | | | | | | | | Property Tax Reductions1 |
| | | | | | | | | | | | | | | | | | | | | | | | | | | | | | | | | BUDGET |
| | | | | | | | | | | | | | | | | | | | | | | | | | | | | | 26 | | | 2000 |
| | | | | | | | | | | | | | | | | | | | | | | | | | | | | | 27 | | | 2001 |
| | | | | | | | | | | | | | | | | | | | | | | | | | | | | | 10 | | | 2002 |
| | | | | | | | | | | | | | | | | | | | | | | | | | | | | | 19 | | | 2003 |
| | | | | | | | | | | | | | | | | | | | | | | | | | | | | | 23 | | | 2004 |
| | | | | | | | | | | | | | | | | | | | | | | | | | | | | | 37 | | | 2005 |
| | | | | | | | | | | | | | | | | | | | | | | | | | | | | | 39 | | | 2006 |
| | 2 | | | | 2 | | | | | | | | | | | | | | | | | | | | | | | | 46 | | | 2007 |
| | 25 | | | | | | | | | | | | | | | | | | | | | | | | | | | | 25 | | | 2008 |
| | | | | | 16 | | | | | | | | | | | | | | | | | | | | | | | | 16 | | | 2009 |
| | | | | | | | | | | | | | 19 | | | | 2 | | | | 2 | | | | | | | | 23 | | | 2011 |
| | 27 | | | | 18 | | | | — | | | | 19 | | | | 2 | | | | 2 | | | | — | | | | 291 | | | SUBTOTAL |
| | | | | |
| | 79 | | | | 70 | | | | 30 | | | | 51 | | | | 21 | | | | 21 | | | | 19 | | | | 830 | | | Annual Totals |
| | 618 | | | | 688 | | | | 718 | | | | 769 | | | | 790 | | | | 811 | | | | 830 | | | | | | Cumulative
Annual Totals |
C14 / Taxation Adjustments BUDGET 2011
n MANITOBA INCOME TAX SAVINGS FOR TYPICAL TAXPAYERS
| | | | | | | | | | | | | | | | | | | | | | | | | |
| | | | | | | | | | | | | | | | | | | | | | | Cumulative |
| | | | | | | Tax Payable/(Refunds) | | Tax Savings | | 2011 Savings | | Savings |
| Income | | 1999 | | 2011 | | in 2011 | | over 1999 | | over 12 Years |
| | | | | | | | | |
| | | (Dollars) | | | | (Percentage) | | (Dollars) |
| SINGLE PERSON1 | | | | | | | | | | | | |
| | | | | |
| | | | 10,000 | | | | 88 | | | | (95 | ) | | | 183 | | | | 207.0 | % | | | 1,397 | |
| | | | 20,000 | | | | 1,369 | | | | 1,099 | | | | 270 | | | | 19.7 | % | | | 2,290 | |
| | | | 40,000 | | | | 4,012 | | | | 3,318 | | | | 694 | | | | 17.3 | % | | | 5,780 | |
| | | | 70,000 | | | | 9,153 | | | | 7,230 | | | | 1,923 | | | | 21.0 | % | | | 15,360 | |
| | | | 100,000 | | | | 14,572 | | | | 12,450 | | | | 2,122 | | | | 14.6 | % | | | 17,684 | |
| | | | | | | | | | | | | | | | | | | | | | | | | |
| FAMILY OF FOUR — ONE EARNER1 | | | | | | | | | | | | |
|
| | | | | |
| | | 25,000 | | | | 411 | | | | (192 | ) | | | 603 | | | | 146.7 | % | | | 4,865 | | | | | | 40,000 | | | | 2,861 | | | | 1,740 | | | | 1,120 | | | | 39.1 | % | | | 8,871 | |
| | | | 60,000 | | | | 6,625 | | | | 4,474 | | | | 2,150 | | | | 32.5 | % | | | 17,611 | |
| | | | 75,000 | | | | 9,435 | | | | 6,905 | | | | 2,530 | | | | 26.8 | % | | | 20,488 | |
| | | | 100,000 | | | | 13,951 | | | | 11,498 | | | | 2,453 | | | | 17.6 | % | | | 19,701 | |
| | | | | | | | | | | | | | | | | | | | | | | | | |
| FAMILY OF FOUR — TWO EARNERS1 | | | | | | | | | | | | |
| | | | | |
| | | | 30,000 | | | | 533 | | | | 24 | | | | 509 | | | | 95.6 | % | | | 3,972 | |
| | | | 40,000 | | | | 1,360 | | | | 793 | | | | 567 | | | | 41.7 | % | | | 4,754 | |
| | | | 60,000 | | | | 4,107 | | | | 3,150 | | | | 957 | | | | 23.3 | % | | | 8,388 | |
| | | | 80,000 | | | | 7,169 | | | | 5,566 | | | | 1,603 | | | | 22.4 | % | | | 13,648 | |
| | | | 100,000 | | | | 10,188 | | | | 8,084 | | | | 2,104 | | | | 20.7 | % | | | 17,459 | |
| | | | | | | | | | | | | | | | | | | | | | | | | |
| SENIOR COUPLE2 | | | | | | | | | | | | |
| | | | | |
| | | | 30,000 | | | | 39 | | | | (316 | ) | | | 355 | | | | 910.4 | % | | | 3,335 | |
| | | | 40,000 | | | | 1,667 | | | | 769 | | | | 898 | | | | 53.9 | % | | | 6,424 | |
| | | | 60,000 | | | | 5,635 | | | | 3,396 | | | | 2,239 | | | | 39.7 | % | | | 15,132 | |
| | | | 80,000 | | | | 8,893 | | | | 6,441 | | | | 2,452 | | | | 27.6 | % | | | 17,937 | |
| | |
| Note: | | Some values may differ from previous years’ tables due to changed assumptions regarding pension income splitting and the Personal Tax Credit. |
| | | |
| 1 | | Taxfilers in the single and family examples have earned income and pay Canada Pension Plan and Employment Insurance premiums. In the two-earner family, one taxfiler earns 60% of the income and the other earns 40% and pays child-care fees. The Fitness Tax Credit and the Children’s Arts and Cultural Activity Tax Credit is claimed for one child in both family examples. Where applicable, tax payable has been reduced by the Personal Tax Credit. |
| |
| 2 | | For the senior couple, both receive the Old Age Security Pension and each spouse splits private pension income in applicable tax years. |
| | |
| Note: | | Income does not reflect Universal Child Care Benefit entitlements but entitlements have been used to determine year-over-year savings. |
BUDGET 2011 Taxation Adjustments / C15
n MANITOBA INCOME TAX SINCE 1999
C16 / Taxation Adjustments BUDGET 2011
n 2011 INTERPROVINCIAL COMPARISON OF TAX RATES
Shows rates applicable on December 31, 2011. Data as of April 1, 2011
| | | | | | | | | | | | | | | | | | | | | |
| | | BC | | AB | | SK | | MB | | ON |
Personal Income Tax | | | | | | | | | | | | | | | | | | | | |
Top Marginal Rate (%) 1 | | | 14.7 | | | | 10.00 | | | | 15.00 | | | | 17.40 | | | | 17.41 | |
Health Care Premiums ($) 2 | | | 1,452 | | | | | | | | | | | | | | | | 0 to 900 | |
Health and Education Levy (%) 3 | | | | | | | | | | | | | | | 2.15 | | | | 1.95 | |
Corporation Income Tax (%) | | | | | | | | | | | | | | | | | | | | |
Small4 | | | 2.50 | | | | 3.00 | | | | 2.00 | | | | 0.00 | | | | 4.50 | |
Large 5 | | | 10.00 | | | | 10.00 | | | | 12.00 | | | | 12.00 | | | | 11.50 | |
| Manufacturing | | | 10.00 | | | | 10.00 | | | | 10.00 | | | | 12.00 | | | | 10.00 | |
| Small business threshold ($000) | | | 500 | | | | 500 | | | | 500 | | | | 400 | | | | 500 | |
Capital Tax (%) | | | | | | | | | | | | | | | | | | | | |
| Banks | | | | | | | | | | | 3.25 | | | | 3.00 | | | | | |
Small Financial Institutions 6 | | | | | | | | | | | 0.70 | | | | | | | | | |
Sales Tax (%) | | | 7.0 | | | | | | | | 5.0 | | | | 7.0 | | | | 8.0 | |
Gasoline Tax (¢/l) 7 | | | 18.95 | | | | 9.0 | | | | 15.0 | | | | 11.5 | | | | 14.7 | |
Diesel Fuel Tax (¢/l) 8 | | | 20.11 | | | | 9.0 | | | | 15.0 | | | | 11.5 | | | | 14.3 | |
Tobacco Tax (¢/cigarette) 9 | | | 18.50 | | | | 20.00 | | | | 21.00 | | | | 22.50 | | | | 12.35 | |
Corporation Income Tax Credits | | | | | | | | | | | | | | | | | | | | |
| Manufacturing (%) | | | | | | | | | | | 5.00 | | | | 10.00 | | | | | |
| Research and Development (%) | | | 10.00 | | | | 10.00 | | | | 15.00 | | | | 20.00 | | | | 15.00 | |
| | |
| 1 | | Top marginal provincial rates include surtaxes. |
| |
| 2 | | The premium for BC is the maximum family rate. ON calculates premiums based on taxable income: for incomes of $20,000 or less the premium is zero and the maximum premium of $900 is reached at an income of $200,600. QC calculates premiums for the Prescription Drug Plan on net income: maximum $600 for a single person and $1,200 for a family. The QC health contribution is income tested and the 2011 maximum per adult is $100. |
| |
| 3 | | MB exempts firms with payrolls of less than $1.25 million. ON exempts firms with payrolls of less than $400,000. QC has graduated rates for firms with payrolls under $5 million. NL exempts firms with payrolls of less than $1 million. |
| |
| 4 | | SK rate is reduced to 2.0% effective July 1, 2011 and NB rate will be reduce to 4.5% on January 1, 2012. |
| |
| 5 | | NB large rate is reduced to 10% on July 1, 2011 and the ON large rate is reduced to 11.5% on July 1, 2011. |
| |
| 6 | | SK has a reduced tax rate for small financial institutions with less than $1.5 billion in taxable paid-up capital. MB exempts small financial institutions with less than $4 billion in taxable paid-up capital. |
n FEDERAL AND MANITOBA INCOME TAX RATES, 2011
Personal Income Tax Rates
| | | | | |
| Federal | | |
| Rate | | Taxable Income Range |
| |
| 15.0% | | $0 - $41,544 |
| 22.0% | | $41,545 - $83,088 |
| 26.0% | | | $83,088 - $128,800 |
| 29.0% | | over $128,800 |
| | | | | |
| Manitoba | | |
| Rate | | Taxable Income Range |
| |
| 10.8% | | $0 - $31,000 |
| 12.75% | | | $31,001 - $67,000 |
| 17.4% | | over $67,000 |
BUDGET 2011 Taxation Adjustments / C17
| | | | | | | | | | | | | | | | | | | | | |
| QC | | NB | | NS | | PE | | NL |
| | | | | | | | | | | | | | | | | | | | | Personal Income Tax |
| | 19.22 | | | | 14.30 | | | | 19.25 | | | | 18.37 | | | | 14.50 | | | Top Marginal Rate (%) 1 |
| | 0 to 1,400 | | | | | | | | | | | | | | | | | | | Health Care Premiums ($) 2 |
| | 4.26 | | | | | | | | | | | | | | | | 2.00 | | | Health and Education Levy (%) 3 |
| | | | | | | | | | | | | | | | | | | | | Corporation Income Tax (%) |
| | 8.00 | | | | 5.00 | | | | 4.50 | | | | 1.00 | | | | 4.00 | | | Small4 |
| | 11.90 | | | | 10.00 | | | | 16.00 | | | | 16.00 | | | | 14.00 | | | Large5 |
| | 11.90 | | | | 11.00 | | | | 16.00 | | | | 16.00 | | | | 5.00 | | | Manufacturing |
| | 500 | | | | 500 | | | | 400 | | | | 500 | | | | 500 | | | Small business threshold ($000) |
| | | | | | | | | | 0.05 | | | | | | | | | | | Capital Tax (%) |
| | | | | | 3.00 | | | | 4.00 | | | | 5.00 | | | | 4.00 | | | Banks |
| | | | | | | | | | | | | | | | | | | | | Small Financial Institutions6 |
| | 8.5 | | | | 8.0 | | | | 10.0 | | | | 10.0 | | | | 8.0 | | | Sales Tax (%) |
| | 17.2 | | | | 13.6 | | | | 15.5 | | | | 15.8 | | | | 16.5 | | | Gasoline Tax (¢/l) 7 |
| | 17.2 | | | | 19.2 | | | | 15.4 | | | | 20.2 | | | | 16.5 | | | Diesel Fuel Tax (¢/l) 8 |
| | 10.60 | | | | 17.00 | | | | 21.52 | | | | 22.45 | | | | 19.00 | | | Tobacco Tax (¢/cigarette) 9 |
| | | | | | | | | | | | | | | | | | | | | Corporation Income Tax Credits |
| | 5.00 | | | | | | | | | | | | 10.00 | | | | | | | Manufacturing (%) |
| | | | | | 15.00 | | | | 15.00 | | | | | | | | 15.00 | | | Research and Development (%) |
| | |
| 7 | | Provincial gasoline taxes are fixed rates per litre. PE includes both a variable (maximum of 8.7¢/l) and a fixed (7.1¢/l) tax. BC’s fuel tax on gasoline is 14.5¢/l and a 4.45¢/l carbon tax also applies for a total tax of 18.95¢/l. In Vancouver and Victoria, a local levy is also imposed. The total tax rate is 27.95¢/l in Vancouver and the total tax rate is 22.45¢/l in Victoria. QC imposes a carbon tax of 0.8¢/l on petroleum companies (it is assumed the tax is passed on to consumers). ON, QC, NB, NS and NL levy provincial sales tax on the pump price. |
| |
| 8 | | Provincial diesel fuel taxes are fixed rates per litre. PE includes both a variable (maximum of 8.7¢/l) and a fixed (11.5¢/l) tax. BC’s fuel tax on diesel is 15¢/l but a 5.11¢/l carbon tax also applies for a total tax of 20.11¢/l. In Vancouver and Victoria, a local levy is also imposed. The total tax rate is 29.11¢/l in Vancouver and the total tax rate is 23.61¢/l in Victoria. Montréal has an additional levy of 3.0¢/l for a total tax of 20.2¢/l. QC imposes a carbon tax of 0.8¢/l on petroleum companies (it is assumed the tax is passed on to consumers). ON, QC, NB, NS and NL levy provincial sales tax on the pump price. |
| |
| 9 | | Provincial sales tax applies to tobacco products in all provinces except AB, PE, and QC. |
Corporation Income Tax Rates
| | | | | | | | | |
| | | Federal | | Manitoba |
| |
| Basic Rate | | | 16.5 | % | | | 12.0 | % |
| Small Business Rate | | | 11.0 | % | | | 0.0 | % |
| Small Business Threshold | | $ | 500,000 | | | $ | 400,000 | |
C18 / Taxation Adjustments BUDGET 2011
n Appendix 1:
MANITOBA TAX EXPENDITURES, 2010/11
Introduction
Governments use the tax system to pursue social, cultural and economic objectives in two ways: by direct spending of the revenue raised, and by providing targeted tax preferences to promote specific types of activity or behaviour. The targeted tax preferences can be thought of as tax expenditures since they have much the same effect as direct government spending. For example, direct grants for small businesses, and tax credits for people who invest in small businesses, could have quite similar costs and results. A tax expenditure is measured as a deviation from a benchmark tax base. The expenditure can be in the form of a deduction, credit, preferential rate, deferral or exemption. Tax expenditures may target taxpayers (ex: individuals, corporations); activities (ex: farming, film production, manufacturing); property (ex: machinery, equipment); sources of income (ex: pensions); transactions (ex: RRSP contributions); or events (ex: involuntary dispositions).
Accounting for Tax Expenditures
Tax expenditure accounts promote accountability and transparency in government programming. Direct expenditure programs are subject to review and approval by the Legislature, and are published annually in the public accounts. Tax expenditures, on the other hand, are not recorded as individual line items but are absorbed into revenue estimates. Tax expenditures reduce government revenues that would otherwise have been available for various direct expenditures. Therefore, tax expenditure accounts not only help to enhance the visibility of programs, but promote public accountability as well. It is generally understood that tax expenditure accounting in no way evaluates tax policy, nor does it address the desirability of the tax provisions, or their usefulness in achieving tax policy objectives.
BUDGET 2011 Taxation Adjustments / C19
Limitations of Tax Expenditure Accounting
Tax expenditure accounting has important limitations that must be kept in mind when interpreting results. There are no formal accounting guidelines for tax expenditures. The value of each tax expenditure is estimated individually. Interactions between provisions are not taken into account. This has two effects. First, estimates for two or more tax expenditures cannot be added together to arrive at a combined value. Second, changing any one tax expenditure might affect the value of other tax expenditures. For example, changing something that is a deduction from income, such as RRSP contributions, would change reported net income. This in turn would change the value of tax credits, such as Manitoba’s Personal Tax Credit, that depend on net income. The combined value of the tax expenditures listed in the account is substantially less than the sum of the individual items.
Reporting Tax Expenditures
Manitoba’s tax expenditure accounts are separated into six sections: personal income tax, corporation income tax, payroll tax, retail sales tax, fuel taxes and corporation capital tax. The estimates are calculated from tax collection and departmental data. The estimates provided are for the 2010/11 fiscal year. They include measures announced in the 2011 Budget. Certain Manitoba personal income tax credits have the characteristics of tax expenditures but are, in fact, accounted for in Manitoba’s Estimates of Expenditure. Examples include the Education Property Tax Credit and the Personal Tax Credit. These credits are not included in the tax expenditure table. For the sake of comparison, these credits are listed below.
CREDITS ACCOUNTED FOR AS EXPENDITURE ITEMS
| | | | | |
| | | 2010/11 |
| | | (millions of dollars) |
| Education Property Tax Credit (including the Advance) | | | 272.8 | |
| Personal Tax Credit | | | 41.8 | |
| Farmland School Tax Rebate | | | 34.0 | |
| School Tax Credit for Tenants and Homeowners (55+) | | | 1.7 | |
| Political Contribution Tax Credit (for individuals only) | | | 1.0 | |
| Community Enterprise Development Tax Credit | | | 0.1 | |
| Riparian Tax Credit | | | 0.1 | |
| | | | | |
TOTAL | | | 351.5 | |
C20 / Taxation Adjustments BUDGET 2011
MANITOBA TAX EXPENDITURES, 2010/11
| | | | | |
| | | (Millions of Dollars) |
PERSONAL INCOME TAX | | | | |
(a) Adjustments to Income (in accordance with tax collection agreements) | | | | |
| Contributions to RRSPs | | | 144.0 | |
| Contributions to RPPs | | | 80.1 | |
| Capital gains inclusion rate | | | 63.6 | |
| Lifetime capital gains exemption | | | 34.4 | |
| Social assistance, WCB, and OAS/GIS (non-taxable income) | | | 22.7 | |
| Union dues and professional fees | | | 17.8 | |
| Child-care expenses | | | 12.3 | |
| Northern residents deduction | | | 6.5 | |
| Pension Income Splitting | | | 15.0 | |
| Moving expenses | | | 2.0 | |
| Scholarship and bursary income exemption | | | 1.4 | |
| Tradespeople’s tool expense | | | 0.4 | |
| Tax-Free Savings Account | | | 5.9 | |
| | | | | |
(b) Non-refundable tax credits (basic credits provided federally and by all provinces) | | | | |
| Basic personal | | | 629.4 | |
| CPP/EI | | | 109.5 | |
| Charitable donations | | | 63.8 | |
| Age | | | 33.4 | |
| Tuition fees and education amount ($400/month) | | | 28.0 | |
| Medical expenses | | | 32.3 | |
| Spousal | | | 22.8 | |
| Eligible dependant | | | 16.3 | |
| Private pension | | | 14.6 | |
| Disability | | | 16.6 | |
| Caregiver | | | 1.4 | |
| Student loan interest | | | 1.1 | |
| Fitness Tax Credit | | | 4.2 | |
| Children’s Arts and Cultural Activity Tax Credit | | | 0.8 | |
| Infirm dependants | | | 0.2 | |
| Adoption Expenses Tax Credit | | | 0.1 | |
| Family Tax Benefit | | | 58.8 | |
| | | | | |
(c) Other Manitoba Tax Measures | | | | |
| Tuition Fee Income Tax Rebate | | | 21.1 | |
| Tuition Fee Income Tax Rebate (Advance) | | | 7.6 | |
| Labour-sponsored Venture Capital Corporations Tax Credit | | | 0.5 | |
| Mineral Exploration Tax Credit | | | 1.5 | |
| Overseas Employment Tax Credit | | | 0.5 | |
| Foreign Tax Credit | | | 2.9 | |
| Primary Caregiver Tax Credit | | | 6.8 | |
BUDGET 2011 Taxation Adjustments / C21
| | | | | |
| | | (Millions of Dollars) |
CORPORATION INCOME TAX | | | | |
| Low rate for small business | | | 177.1 | |
| Manufacturing Investment Tax Credit | | | 29.5 | |
| Film and Video Production Tax Credit | | | 15.0 | |
| Research and Development Tax Credit | | | 21.9 | |
| Green Energy Equipment Tax Credit | | | 0.1 | |
| Book Publishing Tax Credit | | | 0.4 | |
| Co-op Education and Apprenticeship Tax Credits | | | 0.2 | |
| Interactive Digital Media Tax Credit | | | 0.1 | |
| Odour Control Tax Credit | | | 0.1 | |
| | | | | |
HEALTH AND EDUCATION LEVY | | | | |
| $1.25 million exemption | | | 132.5 | |
| Exemption for interjurisdictional common carriers | | | 13.4 | |
| | | | | |
RETAIL SALES TAX | | | | |
| | | | | |
Exemptions | | | | |
| Groceries | | | 161.0 | |
| Farm machinery and repairs | | | 43.4 | |
| Farm and organic fertilizer | | | 22.2 | |
| Prescription drugs and medicine | | | 21.9 | |
| Books, free magazines and newspapers and school yearbooks | | | 18.0 | |
| Farm pesticides and herbicides | | | 17.6 | |
| Medical supplies, appliances and equipment | | | 14.4 | |
| Water supplied by a municipality | | | 12.4 | |
| Natural gas for residential heating | | | 11.4 | |
| Children’s clothing and footwear | | | 11.3 | |
| Electricity used for manufacturing or mining | | | 11.2 | |
| Custom software and computer programming | | | 7.5 | |
| Electricity for residential heating | | | 7.0 | |
| Vehicle trade-ins | | | 6.0 | |
| Toll-free calls | | | 5.9 | |
| Vehicle private buy/sell refunds | | | 3.3 | �� |
| Direct agents and qualifying items used in manufacturing a product for sale and in mining or processing minerals | | | 3.1 | |
| Municipal exemptions (including the purchase of ambulances, fire trucks and related equipment, and gravel or sand purchased by a municipality for its own use) | | | 1.6 | |
| Qualifying geophysical survey and explorations equipment, drill rigs and well-servicing equipment used in oil and gas exploration and development | | | 1.5 | |
| Feminine hygiene products | | | 1.2 | |
C22 / Taxation Adjustments BUDGET 2011
| | | | | |
| | | (Millions of Dollars) |
| Mobile, ready-to-move and modular homes (point of sale reduction) | | | 0.9 | |
| Films for public broadcast | | | 0.4 | |
| Non-prescription smoking cessation products | | | 0.4 | |
| Farm manure slurry tanks and lagoon liners | | | 0.1 | |
| Qualifying geophysical survey and exploration equipment, and prototype mining equipment | | | 0.1 | |
| | | | | |
FUEL TAX | | | | |
| Marked gasoline and diesel | | | 44.1 | |
| Ethanol grant | | | 19.2 | |
| International cargo flight refunds | | | 0.1 | |
| | | | | |
CORPORATE CAPITAL TAX | | | | |
| Elimination of General Corporation Capital Tax | | | 125.0 | |
| Capital deduction | | | 18.3 | |
| Credit unions and caisses populaires exemption | | | 12.3 | |
| Co-operatives exemption | | | 0.7 | |
All estimates are based on the most complete information available at the time of publication.
In some cases, new information may significantly revise earlier estimates.
Source: Manitoba Finance, April 1, 2011
BUDGET 2011 Taxation Adjustments / C23
| | | |
|
| n | | Appendix 2:
THE MANITOBA ADVANTAGE |
Economic diversity with a broad industrial base is a key attribute of the Manitoba economy. Diversity has provided Manitoba with stable and consistent economic growth. Over the last five years and through the global recession, Manitoba posted the strongest annual average real GDP growth among provinces. Manitoba has also managed to diversify its export markets by expanding shipment of value-added goods and services to Asia, Middle East and Africa.
Among 180 places in Canada, “MoneySense,” Canada’s Personal Finance Website ranked both Brandon and Winnipeg among the top 10 in “Canada’s Best Places to Live 2011.” Among other quality of life characteristics, their ranking included accessibility to front-line health and education services, the level of employment and air quality.
Manitoba provides businesses and residents with a unique set of benefits that we call “The Manitoba Advantage:”
| • | | a productive, well-educated and multilingual labour force; |
| |
| • | | a favourable business cost environment, including competitive office and land costs, reasonable construction costs and affordable taxes; |
| |
| • | | a supportive capital investment information network for new and expanding business includes Manitoba Business Gateways, Yes! Winnipeg and CentrePort Canada among others; |
| |
| • | | an extensive network of R&D facilities and communication infrastructure supporting innovation and productivity; |
| |
| • | | a convenient mid-continent location with cost-effective transportation links and intermodal facilities providing shipping by road, rail, air and sea, enhanced by CentrePort Canada, the country’s first foreign trade zone and inland port; |
| |
| • | | a favourable cost of living, including among the lowest electricity costs in North America; |
| |
| • | | reliable and accessible public services, including quality universal public health care and education; |
| |
| • | | a dynamic cultural and artistic community with a strong background of caring, high level of charitable giving and volunteering; and |
| |
| • | | an attractive natural environment with plenty of opportunities for recreation and relaxation which further enhance Manitobans’ quality of life. |
To show Manitoba’s cost competitiveness in more detail, several analyses are provided. The interprovincial comparison of annual personal costs and taxes, net of credits and rebates, compares provinces’ living costs and tax levels for a variety of family types (see p. C24) including seniors (see p. C30) and graduate students (see p. C32).
Manitoba’s Competitive Environment for Manufacturing, provides a detailed comparison of the taxes and costs faced by representative manufacturers in various Canadian and U.S. cities (see p. C41).
Since 1999, Manitoba’s overall provincial rankings for personal costs and taxes have been among the best in Canada. For 2011, Manitoba’s performance remains favourable. Interprovincial comparison of provincial taxes, utilities and housing costs for nine representative family types continues to leave Manitoba ranking in the top three most affordable provinces in which to live and work.
Competitive operating costs and taxes have made Manitoba one of the least expensive provinces in Canada to do business. Among representative North American cities, both smaller and larger manufacturers in Brandon and Winnipeg rank at or near the best on start-up costs, net income, overall taxes and return on investment.
C24 / Taxation Adjustments BUDGET 2011
2011 Comparison of
Personal Costs and Taxes
| | | | | | | | | | | | | | | | | | | | | |
| Single Person: $30,000 | | BC | | AB | | SK | | MB | | ON |
| Provincial Income Tax | | | 864 | | | | 1,118 | | | | 1,296 | | | | 1,435 | | | | 756 | |
| Health Premiums | | | 726 | | | | 0 | | | | 0 | | | | 0 | | | | 300 | |
| | | | | | | | | | | | | | | | | | | | | |
| Subtotal PIT and Premiums | | | 1,590 | | | | 1,118 | | | | 1,296 | | | | 1,435 | | | | 1,056 | |
| | | | | | | | | | | | | | | | | | | | | |
| | | | | | | | | | | | | | | | | | | | | |
| Family/Employment Tax Credits | | | 0 | | | | 0 | | | | 0 | | | | 0 | | | | 0 | |
| Provincial Sales Tax | | | 318 | | | | 0 | | | | 135 | | | | 242 | | | | 476 | |
| Carbon Tax Credit | | | (116 | ) | | | 0 | | | | 0 | | | | 0 | | | | 0 | |
| | | | | | | | | | | | | | | | | | | | | |
| Total Provincial Taxes, Credits and Premiums | | | 1,792 | | | | 1,118 | | | | 1,431 | | | | 1,677 | | | | 1,533 | |
| | | | | | | | | | | | | | | | | | | | | |
| | | | | | | | | | | | | | | | | | | | | |
| Rent | | | 11,280 | | | | 10,728 | | | | 9,180 | | | | 7,788 | | | | 11,388 | |
| Utilities | | | 618 | | | | 797 | | | | 846 | | | | 617 | | | | 857 | |
| Public Transit | | | 923 | | | | 972 | | | | 758 | | | | 807 | | | | 1,379 | |
| | | | | | | | | | | | | | | | | | | | | |
| Total Living Costs | | | 12,821 | | | | 12,497 | | | | 10,785 | | | | 9,212 | | | | 13,624 | |
| | | | | | | | | | | | | | | | | | | | | |
| Total Personal Costs and Taxes | | | 14,613 | | | | 13,614 | | | | 12,216 | | | | 10,889 | | | | 15,156 | |
| | | | | | | | | | | | | | | | | | | | | |
| | | | | | | | | | | | | | | | | | | | | |
| Single Parent, One Child: $30,000 | | BC | | AB | | SK | | MB | | ON |
| Provincial Income Tax | | | (55 | ) | | | 0 | | | | (442 | ) | | | (14 | ) | | | (698 | ) |
| Health Premiums | | | 785 | | | | 0 | | | | 0 | | | | 0 | | | | 300 | |
| | | | | | | | | | | | | | | | | | | | | |
| Subtotal PIT and Premiums | | | 730 | | | | 0 | | | | (442 | ) | | | (14 | ) | | | (398 | ) |
| | | | | | | | | | | | | | | | | | | | | |
| | | | | | | | | | | | | | | | | | | | | |
| Family/Employment Tax Credits | | | 0 | | | | (696 | ) | | | 0 | | | | 0 | | | | 0 | |
| Child Benefits | | | 0 | | | | 0 | | | | 0 | | | | 0 | | | | (590 | ) |
| Provincial Sales Tax | | | 414 | | | | 0 | | | | 176 | | | | 315 | | | | 619 | |
| Carbon Tax Credit | | | (231 | ) | | | 0 | | | | 0 | | | | 0 | | | | 0 | |
| | | | | | | | | | | | | | | | | | | | | |
| Total Provincial Taxes, Credits and Premiums | | | 912 | | | | (696 | ) | | | (267 | ) | | | 301 | | | | (369 | ) |
| | | | | | | | | | | | | | | | | | | | | |
| | | | | | | | | | | | | | | | | | | | | |
| Rent | | | 11,280 | | | | 10,728 | | | | 9,180 | | | | 7,788 | | | | 11,388 | |
| Child Care | | | 1,200 | | | | 1,524 | | | | 3,396 | | | | 3,358 | | | | 1,000 | |
| Utilities | | | 618 | | | | 797 | | | | 846 | | | | 617 | | | | 857 | |
| Public Transit | | | 923 | | | | 972 | | | | 758 | | | | 807 | | | | 1,379 | |
| | | | | | | | | | | | | | | | | | | | | |
| Total Living Costs | | | 14,021 | | | | 14,021 | | | | 14,181 | | | | 12,570 | | | | 14,624 | |
| | | | | | | | | | | | | | | | | | | | | |
| Total Personal Costs and Taxes | | | 14,933 | | | | 13,325 | | | | 13,914 | | | | 12,870 | | | | 14,255 | |
| | | | | | | | | | | | | | | | | | | | | |
Sums may not add due to rounding.
BUDGET 2011 Taxation Adjustments / C25
| | | | | | | | | | | | | | | | | | | | | |
| QC | | NB | | NS | | PE | | NL | | Single Person: $30,000 |
| | 1,413 | | | | 1,642 | | | | 1,537 | | | | 2,004 | | | | 1,553 | | | Provincial Income Tax |
| | 693 | | | | 0 | | | | 0 | | | | 0 | | | | 0 | | | Health Premiums |
| | | | | | | | | | | | | | | | | | | | | |
| | 2,105 | | | | 1,642 | | | | 1,537 | | | | 2,004 | | | | 1,553 | | | Subtotal PIT and Premiums |
| | | | | | | | | | | | | | | | | | | | | |
| | | | | | | | | | | | | | | | | | | | | |
| | 0 | | | | 0 | | | | 0 | | | | 0 | | | | 0 | | | Family/Employment Tax Credits |
| | 444 | | | | 456 | | | | 608 | | | | 367 | | | | 502 | | | Provincial Sales Tax |
| | 0 | | | | 0 | | | | 0 | | | | 0 | | | | 0 | | | Carbon Tax Credit |
| | | | | | | | | | | | | | | | | | | | | |
| | 2,549 | | | | 2,098 | | | | 2,144 | | | | 2,371 | | | | 2,054 | | | Total Provincial Taxes, Credits and Premiums |
| | | | | | | | | | | | | | | | | | | | | |
| | | | | | | | | | | | | | | | | | | | | |
| | 7,524 | | | | 6,660 | | | | 8,784 | | | | 6,924 | | | | 7,788 | | | Rent |
| | 588 | | | | 773 | | | | 906 | | | | 1,099 | | | | 794 | | | Utilities |
| | 698 | | | | 764 | | | | 766 | | | | 649 | | | | 775 | | | Public Transit |
| | | | | | | | | | | | | | | | | | | | | |
| | 8,811 | | | | 8,197 | | | | 10,456 | | | | 8,673 | | | | 9,357 | | | Total Living Costs |
| | | | | | | | | | | | | | | | | | | | | |
| | 11,359 | | | | 10,295 | | | | 12,600 | | | | 11,044 | | | | 11,412 | | | Total Personal Costs and Taxes |
| | | | | | | | | | | | | | | | | | | | | |
| | | | | | | | | | | | | | | | | | | | | |
| QC | | NB | | NS | | PE | | NL | | Single Parent, One Child: $30,000 |
| | 1,239 | | | | 178 | | | | 665 | | | | 1,102 | | | | 0 | | | Provincial Income Tax |
| | 511 | | | | 0 | | | | 0 | | | | 0 | | | | 0 | | | Health Premiums |
| | | | | | | | | | | | | | | | | | | | | |
| | 1,750 | | | | 178 | | | | 665 | | | | 1,102 | | | | 0 | | | Subtotal PIT and Premiums |
| | | | | | | | | | | | | | | | | | | | | |
| | | | | | | | | | | | | | | | | | | | | |
| | 0 | | | | 0 | | | | 0 | | | | 0 | | | | 0 | | | Family/Employment Tax Credits |
| | (2,924 | ) | | | (317 | ) | | | 0 | | | | 0 | | | | 0 | | | Child Benefits |
| | 577 | | | | 592 | | | | 790 | | | | 477 | | | | 652 | | | Provincial Sales Tax |
| | 0 | | | | 0 | | | | 0 | | | | 0 | | | | 0 | | | Carbon Tax Credit |
| | | | | | | | | | | | | | | | | | | | | |
| | (597 | ) | | | 453 | | | | 1,456 | | | | 1,580 | | | | 652 | | | Total Provincial Taxes, Credits and Premiums |
| | | | | | | | | | | | | | | | | | | | | |
| | | | | | | | | | | | | | | | | | | | | |
| | 7,524 | | | | 6,660 | | | | 8,784 | | | | 6,924 | | | | 7,788 | | | Rent |
| | 1,820 | | | | 2,686 | | | | 3,531 | | | | 4,104 | | | | 4,860 | | | Child Care |
| | 588 | | | | 773 | | | | 906 | | | | 1,099 | | | | 794 | | | Utilities |
| | 698 | | | | 764 | | | | 766 | | | | 649 | | | | 775 | | | Public Transit |
| | | | | | | | | | | | | | | | | | | | | |
| | 10,631 | | | | 10,883 | | | | 13,987 | | | | 12,777 | | | | 14,217 | | | Total Living Costs |
| | | | | | | | | | | | | | | | | | | | | |
| | 10,033 | | | | 11,336 | | | | 15,443 | | | | 14,356 | | | | 14,869 | | | Total Personal Costs and Taxes |
| | | | | | | | | | | | | | | | | | | | | |
Sums may not add due to rounding.
C26 / Taxation Adjustments BUDGET 2011
2011 Comparison of
Personal Costs and Taxes
| | | | | | | | | | | | | | | | | | | | | |
| One-Earner Family of 4: $40,000 | | BC | | AB | | SK | | MB | | ON |
| Provincial Income Tax | | | 793 | | | | 593 | | | | (355 | ) | | | 1,978 | | | | 18 | |
| Health Premiums | | | 1,452 | | | | 0 | | | | 0 | | | | 0 | | | | 450 | |
| | | | | | | | | | | | | | | | | | | | | |
| Subtotal PIT and Premiums | | | 2,245 | | | | 593 | | | | (355 | ) | | | 1,978 | | | | 468 | |
| | | | | | | | | | | | | | | | | | | | | |
| | | | | | | | | | | | | | | | | | | | | |
| Family/Employment Tax Credits | | | 0 | | | | (1,329 | ) | | | 0 | | | | 0 | | | | 0 | |
| Child Benefits | | | 0 | | | | 0 | | | | 0 | | | | 0 | | | | (408 | ) |
| Property Taxes | | | 3,309 | | | | 1,873 | | | | 2,791 | | | | 2,558 | | | | 2,950 | |
| Property Tax Credits | | | (570 | ) | | | 0 | | | | 0 | | | | (700 | ) | | | (206 | ) |
| Provincial Sales Tax | | | 794 | | | | 0 | | | | 335 | | | | 646 | | | | 1,245 | |
| Gasoline Tax | | | 560 | | | | 180 | | | | 300 | | | | 230 | | | | 446 | |
| Carbon Tax Credit | | | (175 | ) | | | 0 | | | | 0 | | | | 0 | | | | 0 | |
| | | | | | | | | | | | | | | | | | | | | |
| Total Provincial Taxes, Credits and Premiums | | | 6,164 | | | | 1,317 | | | | 3,071 | | | | 4,712 | | | | 4,495 | |
| | | | | | | | | | | | | | | | | | | | | |
| | | | | | | | | | | | | | | | | | | | | |
| Mortgage Costs | | | 19,432 | | | | 11,865 | | | | 9,950 | | | | 7,809 | | | | 12,289 | |
| Utilities | | | 2,047 | | | | 2,138 | | | | 2,246 | | | | 1,958 | | | | 2,317 | |
| Auto Insurance | | | 1,302 | | | | 1,251 | | | | 877 | | | | 948 | | | | 3,608 | |
| | | | | | | | | | | | | | | | | | | | | |
| Total Living Costs | | | 22,781 | | | | 15,254 | | | | 13,073 | | | | 10,715 | | | | 18,214 | |
| | | | | | | | | | | | | | | | | | | | | |
| Total Personal Costs and Taxes | | | 28,945 | | | | 16,570 | | | | 16,144 | | | | 15,427 | | | | 22,709 | |
| | | | | | | | | | | | | | | | | | | | | |
| | | | | | | | | | | | | | | | | | | | | |
| One-Earner Family of 4: $60,000 | | BC | | AB | | SK | | MB | | ON |
| Provincial Income Tax | | | 2,533 | | | | 2,544 | | | | 2,504 | | | | 4,712 | | | | 3,022 | |
| Health Premiums | | | 1,452 | | | | 0 | | | | 0 | | | | 0 | | | | 600 | |
| | | | | | | | | | | | | | | | | | | | | |
| Subtotal PIT and Premiums | | | 3,985 | | | | 2,544 | | | | 2,504 | | | | 4,712 | | | | 3,622 | |
| | | | | | | | | | | | | | | | | | | | | |
| | | | | | | | | | | | | | | | | | | | | |
| Family/Employment Tax Credits | | | 0 | | | | (1,329 | ) | | | 0 | | | | 0 | | | | 0 | |
| Child Benefits | | | 0 | | | | 0 | | | | 0 | | | | 0 | | | | 0 | |
| Property Taxes | | | 3,309 | | | | 1,873 | | | | 2,791 | | | | 2,558 | | | | 2,950 | |
| Property Tax Credits | | | (570 | ) | | | 0 | | | | 0 | | | | (700 | ) | | | 0 | |
| Provincial Sales Tax | | | 1,077 | | | | 0 | | | | 676 | | | | 924 | | | | 1,769 | |
| Gasoline Tax | | | 560 | | | | 180 | | | | 300 | | | | 230 | | | | 446 | |
| | | | | | | | | | | | | | | | | | | | | |
| Total Provincial Taxes, Credits and Premiums | | | 8,361 | | | | 3,268 | | | | 6,271 | | | | 7,724 | | | | 8,787 | |
| | | | | | | | | | | | | | | | | | | | | |
| | | | | | | | | | | | | | | | | | | | | |
| Mortgage Costs | | | 19,432 | | | | 11,865 | | | | 9,950 | | | | 7,809 | | | | 12,289 | |
| Utilities | | | 2,047 | | | | 2,138 | | | | 2,246 | | | | 1,958 | | | | 2,317 | |
| Auto Insurance | | | 1,302 | | | | 1,251 | | | | 877 | | | | 948 | | | | 3,608 | |
| | | | | | | | | | | | | | | | | | | | | |
| Total Living Costs | | | 22,781 | | | | 15,254 | | | | 13,073 | | | | 10,715 | | | | 18,214 | |
| | | | | | | | | | | | | | | | | | | | | |
| Total Personal Costs and Taxes | | | 31,142 | | | | 18,522 | | | | 19,345 | | | | 18,439 | | | | 27,001 | |
| | | | | | | | | | | | | | | | | | | | | |
Sums may not add due to rounding.
BUDGET 2011 Taxation Adjustments / C27
| | | | | | | | | | | | | | | | | | | | | |
| QC | | NB | | NS | | PE | | NL | | One-Earner Family of 4: $40,000 |
| | 1,797 | | | | 1,777 | | | | 2,748 | | | | 2,768 | | | | 2,291 | | | Provincial Income Tax |
| | 996 | | | | 0 | | | | 0 | | | | 0 | | | | 0 | | | Health Premiums |
| | | | | | | | | | | | | | | | | | | | | |
| | 2,793 | | | | 1,777 | | | | 2,748 | | | | 2,768 | | | | 2,291 | | | Subtotal PIT and Premiums |
| | | | | | | | | | | | | | | | | | | | | |
| | | | | | | | | | | | | | | | | | | | | |
| | (652 | ) | | | 0 | | | | 0 | | | | 0 | | | | 0 | | | Family/Employment Tax Credits |
| | (3,249 | ) | | | (250 | ) | | | 0 | | | | 0 | | | | 0 | | | Child Benefits |
| | 2,938 | | | | 2,462 | | | | 2,272 | | | | 2,600 | | | | 2,640 | | | Property Taxes |
| | 0 | | | | 0 | | | | 0 | | | | 0 | | | | 0 | | | Property Tax Credits |
| | 1,242 | | | | 1,173 | | | | 1,578 | | | | 941 | | | | 1,304 | | | Provincial Sales Tax |
| | 518 | | | | 358 | | | | 500 | | | | 316 | | | | 484 | | | Gasoline Tax |
| | 0 | | | | 0 | | | | 0 | | | | 0 | | | | 0 | | | Carbon Tax Credit |
| | | | | | | | | | | | | | | | | | | | | |
| | 3,590 | | | | 5,520 | | | | 7,098 | | | | 6,625 | | | | 6,719 | | | Total Provincial Taxes, Credits and Premiums |
| | | | | | | | | | | | | | | | | | | | | |
| | | | | | | | | | | | | | | | | | | | | |
| | 8,081 | | | | 5,387 | | | | 6,840 | | | | 4,903 | | | | 6,626 | | | Mortgage Costs |
| | 2,451 | | | | 2,974 | | | | 2,659 | | | | 3,923 | | | | 3,254 | | | Utilities |
| | 816 | | | | 970 | | | | 1,034 | | | | 842 | | | | 1,425 | | | Auto Insurance |
| | | | | | | | | | | | | | | | | | | | | |
| | 11,348 | | | | 9,331 | | | | 10,533 | | | | 9,668 | | | | 11,305 | | | Total Living Costs |
| | | | | | | | | | | | | | | | | | | | | |
| | 14,939 | | | | 14,851 | | | | 17,631 | | | | 16,293 | | | | 18,024 | | | Total Personal Costs and Taxes |
| | | | | | | | | | | | | | | | | | | | | |
| | | | | | | | | | | | | | | | | | | | | |
| QC | | NB | | NS | | PE | | NL | | One-Earner Family of 4: $60,000 |
| | 5,733 | | | | 4,515 | | | | 5,709 | | | | 5,480 | | | | 4,754 | | | Provincial Income Tax |
| | 1,385 | | | | 0 | | | | 0 | | | | 0 | | | | 0 | | | Health Premiums |
| | | | | | | | | | | | | | | | | | | | | |
| | 7,118 | | | | 4,515 | | | | 5,709 | | | | 5,480 | | | | 4,754 | | | Subtotal PIT and Premiums |
| | | | | | | | | | | | | | | | | | | | | |
| | | | | | | | | | | | | | | | | | | | | |
| | 0 | | | | 0 | | | | 0 | | | | 0 | | | | 0 | | | Family/Employment Tax Credits |
| | (2,633 | ) | | | (250 | ) | | | 0 | | | | 0 | | | | 0 | | | Child Benefits |
| | 2,938 | | | | 2,462 | | | | 2,272 | | | | 2,600 | | | | 2,640 | | | Property Taxes |
| | 0 | | | | 0 | | | | 0 | | | | 0 | | | | 0 | | | Property Tax Credits |
| | 1,720 | | | | 1,692 | | | | 2,190 | | | | 1,227 | | | | 1,861 | | | Provincial Sales Tax |
| | 518 | | | | 358 | | | | 500 | | | | 316 | | | | 484 | | | Gasoline Tax |
| | | | | | | | | | | | | | | | | | | | | |
| | 9,661 | | | | 8,777 | | | | 10,671 | | | | 9,623 | | | | 9,739 | | | Total Provincial Taxes, Credits and Premiums |
| | | | | | | | | | | | | | | | | | | | | |
| | | | | | | | | | | | | | | | | | | | | |
| | 8,081 | | | | 5,387 | | | | 6,840 | | | | 4,903 | | | | 6,626 | | | Mortgage Costs |
| | 2,451 | | | | 2,974 | | | | 2,810 | | | | 3,923 | | | | 3,354 | | | Utilities |
| | 816 | | | | 970 | | | | 1,034 | | | | 842 | | | | 1,425 | | | Auto Insurance |
| | | | | | | | | | | | | | | | | | | | | |
| | 11,348 | | | | 9,331 | | | | 10,684 | | | | 9,668 | | | | 11,405 | | | Total Living Costs |
| | | | | | | | | | | | | | | | | | | | | |
| | 21,010 | | | | 18,108 | | | | 21,355 | | | | 19,291 | | | | 21,144 | | | Total Personal Costs and Taxes |
| | | | | | | | | | | | | | | | | | | | | |
Sums may not add due to rounding.
C28 / Taxation Adjustments BUDGET 2011
2011 Comparison of
Personal Costs and Taxes
| | | | | | | | | | | | | | | | | | | | | |
| Two-Earner Family of 4: $60,000 | | BC | | AB | | SK | | MB | | ON |
| Provincial Income Tax | | | 1,147 | | | | 1,677 | | | | 725 | | | | 3,042 | | | | 315 | |
| Health Premiums | | | 1,452 | | | | 0 | | | | 0 | | | | 0 | | | | 300 | |
| | | | | | | | | | | | | | | | | | | | | |
| Subtotal PIT and Premiums | | | 2,599 | | | | 1,677 | | | | 725 | | | | 3,042 | | | | 615 | |
| | | | | | | | | | | | | | | | | | | | | |
| | | | | | | | | | | | | | | | | | | | | |
| Family/Employment Tax Credits | | | 0 | | | | (1,329 | ) | | | 0 | | | | 0 | | | | 0 | |
| Child Benefits | | | 0 | | | | 0 | | | | 0 | | | | 0 | | | | 0 | |
| Property Taxes | | | 3,309 | | | | 1,873 | | | | 2,791 | | | | 2,558 | | | | 2,950 | |
| Property Tax Credits | | | (570 | ) | | | 0 | | | | 0 | | | | (700 | ) | | | (86 | ) |
| Provincial Sales Tax | | | 1,077 | | | | 0 | | | | 676 | | | | 924 | | | | 1,769 | |
| Gasoline Tax | | | 840 | | | | 270 | | | | 450 | | | | 345 | | | | 669 | |
| Carbon Tax Credit | | | (55 | ) | | | 0 | | | | 0 | | | | 0 | | | | 0 | |
| | | | | | | | | | | | | | | | | | | | | |
| Total Provincial Taxes, Credits and Premiums | | | 7,200 | | | | 2,491 | | | | 4,642 | | | | 6,169 | | | | 5,917 | |
| | | | | | | | | | | | | | | | | | | | | |
| | | | | | | | | | | | | | | | | | | | | |
| Mortgage Costs | | | 19,432 | | | | 11,865 | | | | 9,950 | | | | 7,809 | | | | 12,289 | |
| Child Care | | | 14,880 | | | | 8,868 | | | | 11,352 | | | | 9,776 | | | | 7,999 | |
| Utilities | | | 2,047 | | | | 2,138 | | | | 2,246 | | | | 1,958 | | | | 2,317 | |
| Auto Insurance | | | 2,724 | | | | 2,668 | | | | 1,950 | | | | 2,004 | | | | 7,371 | |
| | | | | | | | | | | | | | | | | | | | | |
| Total Living Costs | | | 39,083 | | | | 25,539 | | | | 25,498 | | | | 21,547 | | | | 29,976 | |
| | | | | | | | | | | | | | | | | | | | | |
| Total Personal Costs and Taxes | | | 46,283 | | | | 28,030 | | | | 30,141 | | | | 27,716 | | | | 35,893 | |
| | | | | | | | | | | | | | | | | | | | | |
| | | | | | | | | | | | | | | | | | | | | |
| Two-Earner Family of 5: $75,000 | | BC | | AB | | SK | | MB | | ON |
| Provincial Income Tax | | | 1,806 | | | | 2,518 | | | | 1,470 | | | | 4,165 | | | | 1,079 | |
| Health Premiums | | | 1,452 | | | | 0 | | | | 0 | | | | 0 | | | | 516 | |
| | | | | | | | | | | | | | | | | | | | | |
| Subtotal PIT and Premiums | | | 3,258 | | | | 2,518 | | | | 1,470 | | | | 4,165 | | | | 1,595 | |
| | | | | | | | | | | | | | | | | | | | | |
| | | | | | | | | | | | | | | | | | | | | |
| Family/Employment Tax Credits | | | 0 | | | | (1,709 | ) | | | 0 | | | | 0 | | | | 0 | |
| Child Benefits | | | 0 | | | | 0 | | | | 0 | | | | 0 | | | | 0 | |
| Property Taxes | | | 3,898 | | | | 2,488 | | | | 3,891 | | | | 3,366 | | | | 4,463 | |
| Property Tax Credits | | | (570 | ) | | | 0 | | | | 0 | | | | (700 | ) | | | 0 | |
| Provincial Sales Tax | | | 1,355 | | | | 0 | | | | 550 | | | | 1,105 | | | | 2,238 | |
| Gasoline Tax | | | 840 | | | | 270 | | | | 450 | | | | 345 | | | | 669 | |
| | | | | | | | | | | | | | | | | | | | | |
| Total Provincial Taxes, Credits and Premiums | | | 8,781 | | | | 3,567 | | | | 6,361 | | | | 8,280 | | | | 8,965 | |
| | | | | | | | | | | | | | | | | | | | | |
| | | | | | | | | | | | | | | | | | | | | |
| Mortgage Costs | | | 23,609 | | | | 15,760 | | | | 13,873 | | | | 11,206 | | | | 18,592 | |
| Child Care | | | 23,400 | | | | 14,940 | | | | 15,678 | | | | 14,495 | | | | 12,500 | |
| Utilities | | | 3,202 | | | | 3,376 | | | | 3,571 | | | | 3,072 | | | | 3,689 | |
| Auto Insurance | | | 2,724 | | | | 2,668 | | | | 1,950 | | | | 2,004 | | | | 7,371 | |
| | | | | | | | | | | | | | | | | | | | | |
| Total Living Costs | | | 52,935 | | | | 36,744 | | | | 35,072 | | | | 30,777 | | | | 42,152 | |
| | | | | | | | | | | | | | | | | | | | | |
| Total Personal Costs and Taxes | | | 61,716 | | | | 40,311 | | | | 41,434 | | | | 39,058 | | | | 51,117 | |
| | | | | | | | | | | | | | | | | | | | | |
Sums may not add due to rounding.
BUDGET 2011 Taxation Adjustments / C29
| | | | | | | | | | | | | | | | | | | | | |
| QC | | NB | | NS | | PE | | NL | | Two-Earner Family of 4: $60,000 |
| | 4,548 | | | | 2,402 | | | | 2,667 | | | | 2,992 | | | | 2,460 | | | Provincial Income Tax |
| | 1,385 | | | | 0 | | | | 0 | | | | 0 | | | | 0 | | | Health Premiums |
| | | | | | | | | | | | | | | | | | | | | |
| | 5,933 | | | | 2,402 | | | | 2,667 | | | | 2,992 | | | | 2,460 | | | Subtotal PIT and Premiums |
| | | | | | | | | | | | | | | | | | | | | |
| | | | | | | | | | | | | | | | | | | | | |
| | 0 | | | | 0 | | | | 0 | | | | 0 | | | | 0 | | | Family/Employment Tax Credits |
| | (2,633 | ) | | | (250 | ) | | | 0 | | | | 0 | | | | 0 | | | Child Benefits |
| | 2,938 | | | | 2,462 | | | | 2,272 | | | | 2,600 | | | | 2,640 | | | Property Taxes |
| | 0 | | | | 0 | | | | 0 | | | | 0 | | | | 0 | | | Property Tax Credits |
| | 1,720 | | | | 1,692 | | | | 2,190 | | | | 1,227 | | | | 1,861 | | | Provincial Sales Tax |
| | 777 | | | | 537 | | | | 750 | | | | 474 | | | | 726 | | | Gasoline Tax |
| | 0 | | | | 0 | | | | 0 | | | | 0 | | | | 0 | | | Carbon Tax Credit |
| | | | | | | | | | | | | | | | | | | | | |
| | 8,735 | | | | 6,843 | | | | 7,879 | | | | 7,293 | | | | 7,687 | | | Total Provincial Taxes, Credits and Premiums |
| | | | | | | | | | | | | | | | | | | | | |
| | | | | | | | | | | | | | | | | | | | | |
| | 8,081 | | | | 5,387 | | | | 6,840 | | | | 4,903 | | | | 6,626 | | | Mortgage Costs |
| | 3,640 | | | | 12,802 | | | | 14,217 | | | | 12,000 | | | | 15,120 | | | Child Care |
| | 2,451 | | | | 2,974 | | | | 2,810 | | | | 3,923 | | | | 3,354 | | | Utilities |
| | 1,953 | | | | 2,077 | | | | 2,180 | | | | 1,789 | | | | 2,938 | | | Auto Insurance |
| | | | | | | | | | | | | | | | | | | | | |
| | 16,125 | | | | 23,240 | | | | 26,047 | | | | 22,615 | | | | 28,038 | | | Total Living Costs |
| | | | | | | | | | | | | | | | | | | | | |
| | 24,860 | | | | 30,083 | | | | 33,926 | | | | 29,908 | | | | 35,724 | | | Total Personal Costs and Taxes |
| | | | | | | | | | | | | | | | | | | | | |
| | | | | | | | | | | | | | | | | | | | | |
| QC | | NB | | NS | | PE | | NL | | Two-Earner Family of 5: $75,000 |
| | 7,135 | | | | 3,585 | | | | 3,932 | | | | 4,137 | | | | 3,499 | | | Provincial Income Tax |
| | 1,385 | | | | 0 | | | | 0 | | | | 0 | | | | 0 | | | Health Premiums |
| | | | | | | | | | | | | | | | | | | | | |
| | 8,520 | | | | 3,585 | | | | 3,932 | | | | 4,137 | | | | 3,499 | | | Subtotal PIT and Premiums |
| | | | | | | | | | | | | | | | | | | | | |
| | | | | | | | | | | | | | | | | | | | | |
| | 0 | | | | 0 | | | | 0 | | | | 0 | | | | 0 | | | Family/Employment Tax Credits |
| | (3,116 | ) | | | (182 | ) | | | 0 | | | | 0 | | | | 0 | | | Child Benefits |
| | 5,163 | | | | 4,842 | | | | 2,890 | | | | 4,012 | | | | 4,210 | | | Property Taxes |
| | 0 | | | | 0 | | | | 0 | | | | 0 | | | | 0 | | | Property Tax Credits |
| | 2,082 | | | | 2,130 | | | | 2,678 | | | | 1,328 | | | | 2,160 | | | Provincial Sales Tax |
| | 777 | | | | 537 | | | | 750 | | | | 474 | | | | 726 | | | Gasoline Tax |
| | | | | | | | | | | | | | | | | | | | | |
| | 13,426 | | | | 10,912 | | | | 10,250 | | | | 9,951 | | | | 10,595 | | | Total Provincial Taxes, Credits and Premiums |
| | | | | | | | | | | | | | | | | | | | | |
| | | | | | | | | | | | | | | | | | | | | |
| | 14,202 | | | | 10,594 | | | | 8,702 | | | | 7,567 | | | | 10,567 | | | Mortgage Costs |
| | 5,460 | | | | 19,203 | | | | 21,793 | | | | 18,000 | | | | 22,680 | | | Child Care |
| | 3,911 | | | | 4,779 | | | | 4,481 | | | | 6,341 | | | | 5,412 | | | Utilities |
| | 1,953 | | | | 2,077 | | | | 2,180 | | | | 1,789 | | | | 2,938 | | | Auto Insurance |
| | | | | | | | | | | | | | | | | | | | | |
| | 25,526 | | | | 36,653 | | | | 37,156 | | | | 33,697 | | | | 41,597 | | | Total Living Costs |
| | | | | | | | | | | | | | | | | | | | | |
| | 38,953 | | | | 47,565 | | | | 47,406 | | | | 43,648 | | | | 52,192 | | | Total Personal Costs and Taxes |
| | | | | | | | | | | | | | | | | | | | | |
Sums may not add due to rounding.
C30 / Taxation Adjustments BUDGET 2011
2011 Comparison of
Personal Costs and Taxes
| | | | | | | | | | | | | | | | | | | | | |
| Single Senior: $30,000 | | BC | | | AB | | | SK | | | MB | | | ON | |
| | | | | | | | | | | | | | | | | | | | | |
| Provincial Income Tax | | | 691 | | | | 698 | | | | 773 | | | | 998 | | | | 86 | |
| Health Premiums | | | 436 | | | | 0 | | | | 0 | | | | 0 | | | | 300 | |
| | | | | | | | | | | | | | | | |
| Subtotal PIT and Premiums | | | 1,127 | | | | 698 | | | | 773 | | | | 998 | | | | 386 | |
| | | | | | | | | | | | | | | | |
| | | | | | | | | | | | | | | | | | | | | |
| Provincial Sales Tax | | | 318 | | | | 0 | | | | 135 | | | | 242 | | | | 476 | |
| Gasoline Tax | | | 560 | | | | 180 | | | | 300 | | | | 230 | | | | 446 | |
| Carbon Tax Credit | | | (116 | ) | | | 0 | | | | 0 | | | | 0 | | | | 0 | |
| | | | | | | | | | | | | | | | |
| Total Provincial Taxes, Credits and Premiums | | | 1,889 | | | | 878 | | | | 1,208 | | | | 1,470 | | | | 1,309 | |
| | | | | | | | | | | | | | | | |
| | | | | | | | | | | | | | | | | | | | | |
| Rent | | | 11,280 | | | | 10,728 | | | | 9,180 | | | | 7,788 | | | | 11,388 | |
| Utilities | | | 618 | | | | 797 | | | | 846 | | | | 617 | | | | 857 | |
| Auto Insurance | | | 1,420 | | | | 2,501 | | | | 1,056 | | | | 1,152 | | | | 8,728 | |
| | | | | | | | | | | | | | | | |
| Total Living Costs | | | 13,318 | | | | 14,026 | | | | 11,082 | | | | 9,557 | | | | 20,973 | |
| | | | | | | | | | | | | | | | |
| Total Personal Costs and Taxes | | | 15,208 | | | | 14,904 | | | | 12,291 | | | | 11,027 | | | | 22,282 | |
| | | | | | | | | | | | | | | | |
| | | | | �� | | | | | | | | | | | | | | | | |
| Senior Couple: $60,000 | | BC | | | AB | | | SK | | | MB | | | ON | |
| | | | | | | | | | | | | | | | | | | | | |
| Provincial Income Tax | | | 1,382 | | | | 1,397 | | | | 1,951 | | | | 3,396 | | | | 1,534 | |
| Health Premiums | | | 1,308 | | | | 0 | | | | 0 | | | | 0 | | | | 600 | |
| | | | | | | | | | | | | | | | |
| Subtotal PIT and Premiums | | | 2,690 | | | | 1,397 | | | | 1,951 | | | | 3,396 | | | | 2,134 | |
| | | | | | | | | | | | | | | | |
| | | | | | | | | | | | | | | | | | | | | |
| Provincial Sales Tax | | | 1,077 | | | | 0 | | | | 676 | | | | 924 | | | | 1,769 | |
| Property Taxes | | | 3,309 | | | | 1,873 | | | | 2,791 | | | | 2,558 | | | | 2,950 | |
| Property Tax Credits | | | (845 | ) | | | 0 | | | | 0 | | | | (700 | ) | | | (281 | ) |
| Gasoline Tax | | | 560 | | | | 180 | | | | 300 | | | | 230 | | | | 446 | |
| | | | | | | | | | | | | | | | |
| Total Provincial Taxes, Credits and Premiums | | | 6,791 | | | | 3,450 | | | | 5,718 | | | | 6,408 | | | | 7,019 | |
| | | | | | | | | | | | | | | | |
| | | | | | | | | | | | | | | | | | | | | |
| Utilities | | | 2,047 | | | | 2,138 | | | | 2,246 | | | | 1,958 | | | | 2,317 | |
| Auto Insurance | | | 1,420 | | | | 2,501 | | | | 1,056 | | | | 1,152 | | | | 8,728 | |
| | | | | | | | | | | | | | | | |
| Total Living Costs | | | 3,467 | | | | 4,639 | | | | 3,302 | | | | 3,110 | | | | 11,045 | |
| | | | | | | | | | | | | | | | |
| Total Personal Costs and Taxes | | | 10,258 | | | | 8,089 | | | | 9,020 | | | | 9,518 | | | | 18,064 | |
| | | | | | | | | | | | | | | | |
Sums may not add due to rounding.
| | | |
|
Personal Living Costs and Taxes | | Personal Living Costs and Taxes |
Single Senior — $30,000 | | Senior Couple — $60,000 |
| | | |
| | 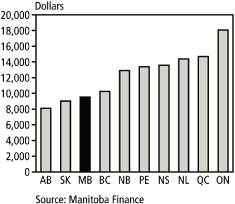 |
BUDGET 2011 Taxation Adjustments / C31
| | | | | | | | | | | | | | | | | | | | | |
| Single Senior: $30,000 | | QC | | | NB | | | NS | | | PE | | | NL | |
| | | | | | | | | | | | | | | | | | | | | |
| Provincial Income Tax | | | 1,138 | | | | 1,321 | | | | 1,247 | | | | 1,747 | | | | 796 | |
| Health Premiums | | | 693 | | | | 0 | | | | 0 | | | | 0 | | | | 0 | |
| | | | | | | | | | | | | | | | |
| Subtotal PIT and Premiums | | | 1,831 | | | | 1,321 | | | | 1,247 | | | | 1,747 | | | | 796 | |
| | | | | | | | | | | | | | | | |
| | | | | | | | | | | | | | | | | | | | | |
| Provincial Sales Tax | | | 444 | | | | 456 | | | | 608 | | | | 367 | | | | 502 | |
| Gasoline Tax | | | 518 | | | | 358 | | | | 500 | | | | 316 | | | | 484 | |
| Carbon Tax Credit | | | 0 | | | | 0 | | | | 0 | | | | 0 | | | | 0 | |
| | | | | | | | | | | | | | | | |
| Total Provincial Taxes, Credits and Premiums | | | 2,792 | | | | 2,135 | | | | 2,354 | | | | 2,430 | | | | 1,782 | |
| | | | | | | | | | | | | | | | |
| | | | | | | | | | | | | | | | | | | | | |
| Rent | | | 7,524 | | | | 6,660 | | | | 8,784 | | | | 6,924 | | | | 7,788 | |
| Utilities | | | 588 | | | | 773 | | | | 906 | | | | 1,099 | | | | 794 | |
| Auto Insurance | | | 1,182 | | | | 2,556 | | | | 2,791 | | | | 1,811 | | | | 3,050 | |
| | | | | | | | | | | | | | | | |
| Total Living Costs | | | 9,294 | | | | 9,989 | | | | 12,481 | | | | 9,834 | | | | 11,632 | |
| | | | | | | | | | | | | | | | |
| Total Personal Costs and Taxes | | | 12,086 | | | | 12,124 | | | | 14,835 | | | | 12,264 | | | | 13,414 | |
| | | | | | | | | | | | | | | | |
| | | | | | | | | | | | | | | | | | | | | |
| Senior Couple: $60,000 | | QC | | | NB | | | NS | | | PE | | | NL | |
| | | | | | | | | | | | | | | | | | | | | |
| Provincial Income Tax | | | 4,488 | | | | 2,853 | | | | 2,973 | | | | 3,494 | | | | 2,996 | |
| Health Premiums | | | 1,385 | | | | 0 | | | | 0 | | | | 0 | | | | 0 | |
| | | | | | | | | | | | | | | | |
| Subtotal PIT and Premiums | | | 5,873 | | | | 2,853 | | | | 2,973 | | | | 3,494 | | | | 2,996 | |
| | | | | | | | | | | | | | | | |
| | | | | | | | | | | | | | | | | | | | | |
| Provincial Sales Tax | | | 1,720 | | | | 1,692 | | | | 2,190 | | | | 1,227 | | | | 1,861 | |
| Property Taxes | | | 2,938 | | | | 2,462 | | | | 2,272 | | | | 2,600 | | | | 2,640 | |
| Property Tax Credits | | | 0 | | | | 0 | | | | 0 | | | | 0 | | | | 0 | |
| Gasoline Tax | | | 518 | | | | 358 | | | | 500 | | | | 316 | | | | 484 | |
| | | | | | | | | | | | | | | | |
| Total Provincial Taxes, Credits and Premiums | | | 11,049 | | | | 7,365 | | | | 7,935 | | | | 7,637 | | | | 7,981 | |
| | | | | | | | | | | | | | | | |
| | | | | | | | | | | | | | | | | | | | | |
| Utilities | | | 2,451 | | | | 2,974 | | | | 2,810 | | | | 3,923 | | | | 3,354 | |
| Auto Insurance | | | 1,182 | | | | 2,556 | | | | 2,791 | | | | 1,811 | | | | 3,050 | |
| | | | | | | | | | | | | | | | |
| Total Living Costs | | | 3,633 | | | | 5,530 | | | | 5,601 | | | | 5,734 | | | | 6,404 | |
| | | | | | | | | | | | | | | | |
| Total Personal Costs and Taxes | | | 14,682 | | | | 12,895 | | | | 13,536 | | | | 13,371 | | | | 14,385 | |
| | | | | | | | | | | | | | | | |
Sums may not add due to rounding.
C32 / Taxation Adjustments BUDGET 2011
2011 Comparison of Personal Costs and Taxes
Net of Graduate Credits and Tuition Rebates
| | | | | | | | | | | | | | | | | | | | | |
| Single Person: $50,000 | | BC | | | AB | | | SK | | | MB | | | ON | |
| | | | | | | | | | | | | | | | | | | | | |
| Provincial Income Tax | | | 2,183 | | | | 3,002 | | | | 3,752 | | | | 4,541 | | | | 2,415 | |
| Graduate Tuition Credits/Rebates | | | 0 | | | | 0 | | | | (2,000 | ) | | | (2,500 | ) | | | 0 | |
| Health Premiums | | | 726 | | | | 0 | | | | 0 | | | | 0 | | | | 600 | |
| | | | | | | | | | | | | | | | |
| Subtotal PIT, Credit and Premiums | | | 2,909 | | | | 3,002 | | | | 1,752 | | | | 2,041 | | | | 3,015 | |
| | | | | | | | | | | | | | | | |
| Property Taxes | | | 3,309 | | | | 1,873 | | | | 2,791 | | | | 2,558 | | | | 2,950 | |
| Property Tax Credits | | | (570 | ) | | | 0 | | | | 0 | | | | (700 | ) | | | 0 | |
| Provincial Sales Tax | | | 468 | | | | 0 | | | | 253 | | | | 393 | | | | 754 | |
| Gasoline Tax | | | 560 | | | | 180 | | | | 300 | | | | 230 | | | | 446 | |
| | | | | | | | | | | | | | | | |
| Total Provincial Taxes, Credits and Premiums | | | 6,675 | | | | 5,055 | | | | 5,096 | | | | 4,521 | | | | 7,164 | |
| | | | | | | | | | | | | | | | |
| Mortgage Costs | | | 19,432 | | | | 11,865 | | | | 9,950 | | | | 7,809 | | | | 12,289 | |
| Utilities | | | 2,047 | | | | 2,138 | | | | 2,246 | | | | 1,958 | | | | 2,317 | |
| Auto Insurance | | | 1,302 | | | | 1,251 | | | | 877 | | | | 948 | | | | 3,608 | |
| | | | | | | | | | | | | | | | |
| Total Living Costs | | | 22,781 | | | | 15,254 | | | | 13,073 | | | | 10,715 | | | | 18,214 | |
| | | | | | | | | | | | | | | | |
| Total Personal Costs and Taxes | | | 29,457 | | | | 20,309 | | | | 18,170 | | | | 15,236 | | | | 25,379 | |
| | | | | | | | | | | | | | | | |
Sums may not add due to rounding.
| | | |
|
Income Tax and Health Premiums, | | |
Net of Graduate Credits and | | Personal Costs and Taxes — |
Tuition Rebates | | Graduate Earning $50,000 |
| | | |
| | 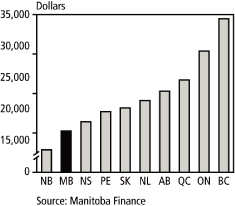 |
BUDGET 2011 Taxation Adjustments / C33
| | | | | | | | | | | | | | | | | | | | | |
| Single Person: $50,000 | | QC | | | NB | | | NS | | | PE | | | NL | |
| | | | | | | | | | | | | | | | | | | | | |
| Provincial Income Tax | | | 5,477 | | | | 3,847 | | | | 4,665 | | | | 4,571 | | | | 3,872 | |
| Graduate Tuition Credits/Rebates | | | 0 | | | | (3,847 | ) | | | (2,500 | ) | | | 0 | | | | 0 | |
| Health Premiums | | | 693 | | | | 0 | | | | 0 | | | | 0 | | | | 0 | |
| | | | | | | | | | | | | | | | |
| Subtotal PIT, Credit and Premiums | | | 6,170 | | | | 0 | | | | 2,165 | | | | 4,571 | | | | 3,872 | |
| | | | | | | | | | | | | | | | |
| | | | | | | | | | | | | | | | | | | | | |
| Property Taxes | | | 2,938 | | | | 2,462 | | | | 2,272 | | | | 2,600 | | | | 2,640 | |
| Property Tax Credits | | | 0 | | | | 0 | | | | 0 | | | | 0 | | | | 0 | |
| Provincial Sales Tax | | | 741 | | | | 716 | | | | 942 | | | | 542 | | | | 791 | |
| Gasoline Tax | | | 518 | | | | 358 | | | | 500 | | | | 316 | | | | 484 | |
| | | | | | | | | | | | | | | | |
| Total Provincial Taxes, Credits and Premiums | | | 10,366 | | | | 3,536 | | | | 5,879 | | | | 8,029 | | | | 7,787 | |
| | | | | | | | | | | | | | | | |
| | | | | | | | | | | | | | | | | | | | | |
| Mortgage Costs | | | 8,081 | | | | 5,387 | | | | 6,840 | | | | 4,903 | | | | 6,626 | |
| Utilities | | | 2,451 | | | | 2,974 | | | | 2,659 | | | | 3,923 | | | | 3,254 | |
| Auto Insurance | | | 816 | | | | 970 | | | | 1,034 | | | | 842 | | | | 1,425 | |
| | | | | | | | | | | | | | | | |
| Total Living Costs | | | 11,348 | | | | 9,331 | | | | 10,533 | | | | 9,668 | | | | 11,305 | |
| | | | | | | | | | | | | | | | |
| Total Personal Costs and Taxes | | | 21,715 | | | | 12,868 | | | | 16,412 | | | | 17,697 | | | | 19,092 | |
| | | | | | | | | | | | | | | | |
Sums may not add due to rounding.
C34 / Taxation Adjustments BUDGET 2011
2011 Comparison of Personal Costs and Taxes
| | | |
|
Single Person Earning $30,000 | | Single Parent Earning $30,000 |
| | | |
| | 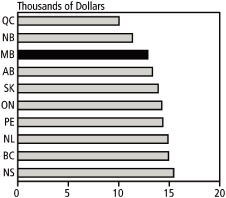 |
| | | |
Single-Earner Family of Four
Earning $40,000 | | Single-Earner Family of Four
Earning $60,000 |
| | | |
| | 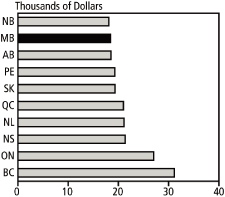 |
| | | |
Two-Earner Family of Four
Earning $60,000 | | Two-Earner Family of Five
Earning $75,000 |
| | | |
| | 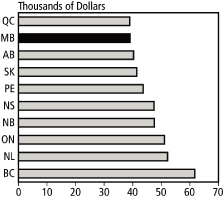 |
All Charts Source: Manitoba Finance
BUDGET 2011 Taxation Adjustments / C35
NOTES
Provincial taxes,1 credits and premiums are based on information available prior to April 1, 2011, for the following major urban centres in each province: Vancouver, Calgary, Saskatoon, Winnipeg, Toronto, Montréal, Saint John, Halifax, Charlottetown and St. John’s.
Auto insurance coverage includes $2 million Third Party Liability, a $500 All Perils Deductible, accident benefits and $2 million Standard Policy Form #44 family protection coverage for those jurisdictions wit hout no-fault injury coverage, and La Societé de l’Assurance Automobile du Québec injury protection in Montréal. A 65-year-old male driver with one at-fault accident in the last year, but has been both accident- and conviction-free for 14 prior years; and the auto is driven for personal use including pleasure, commuting to and from work or school. Rates were provided by the Insurance Corporation of British Columbia for British Columbia, SGI Canada for Saskatchewan, and Manitoba Public Insurance for Manitoba. Rates for other cities are the average of the quotes from 10 private insurers providing coverage in those provinces. Discounts for second or multiple vehicles, where available, are not included in the auto insurance calculations. Rebates issued by MPI or other insurers are also excluded. Auto insurance for the 2010 Dodge Caravan, the 2005 Honda Civic and the 2003 Chevrolet Malibu are used in these examples, three of the more common vehicles driven in Manitoba.
Child-care costs are based on annual parent fees paid, less subsidies, for preschool aged children, typically over two years of age and under six years of age, for 260 days or 12 months per year. Manitoba and Quebec are the only provinces with regulated maximum parent fees. Fees for other provinces are those obtained from provincial offices, online and/or in a survey conducted in the first quarter of 2011.
Gasoline Tax is based on the annual consumption of 2,000 litres for the single-vehicle families and 3,000 litres for the two-vehicle families. The Gasoline Tax includes all provincial levies on gas, including carbon tax and sales tax where applicable. Sales tax is based on pump prices as of December 15, 2010.
Health premiums are annual premiums for hospital insurance and medical services in provinces which levy them. Quebec’s Prescription Drug Plan and health contribution are included.
Mortgage costs are based on average home prices for a detached bungalow for families with $40,000 and $60,000 of income, and for the graduate with $50,000 of income, and on an executive detached two storey for a family with $75,000 of income, from the “Royal LePage Third Quarter 2010 Survey of Canadian House Prices,” with one-half of the home price being financed over 25 years at a one-year closed mortgage rate of 3.6%.
Net child benefits represent provincial programs comparable to the Canada Child Tax Benefit for families with children. Provincial child benefit measures are available in British Columbia (BC Family Bonus and the BC Earned Income Benefit), Alberta (Alberta Family Employment Tax Credit), Manitoba (Manitoba Child Benefit), Ontario (Ontario Child Care Supplement for Working Families and the Ontario Child Benefit), Quebec (Child Assistance Payments), New Brunswick (New Brunswick Child Tax Benefit and the New Brunswick Working Income Supplement), Nova Scotia (Nova Scotia Child Benefit), and Newfoundland and Labrador (Newfoundland and Labrador Child Benefit).
Property taxes for families with $40,000 and $60,000 of income are based on the estimated taxes for a sample detached bungalow from the City of Edmonton “2009 Residential Property Taxes and Utility Charges Survey” with the exception of Charlottetown whose property taxes have been based on the Saskatchewan 2011 Budget Paper “2011 Intercity Comparison of Taxes, Utilities and Housing.” Property taxes for the detached bungalow have been proportionally adjusted for a family with $75,000 of income to reflect the taxes paid for an executive detached two storey.
| | |
| 1 | | Tables reflect 2011 Budget changes for BC, QC, NB, SK, AB and ON. |
C36 / Taxation Adjustments BUDGET 2011
Provincial income tax is calculated for a single renter with $30,000 earned income, a single parent with one preschool child who rents and has $30,000 in earned income, and three family profiles with $40,000, $60,000 and $75,000 of earned income, respectively. These incomes are before receipt of the Universal Child Care Benefit (UCCB) but the UCCB is used in the calculation of income tax. For the single parent, UCCB is treated as taxable income of the dependant child. Families include one income earner, a spouse and two preschool dependant children; two income earners and two preschool children; or two income earners and three preschool children. For two-earner families, one spouse earns 60% of the family income while the other spouse earns 40%. Personal non-refundable credits include the CPP/QPP and EI contribution credits. For the single parent, child-care costs less subsidies for each province have been deducted from income. For two-earner families, eligible child-care costs have been deducted from the income of the spouse with the lower income. Gross Quebec personal income tax has been reduced by the 16.5% abatement for federal income tax. Refundable sales tax credits and provincial tax reductions and rebates have been deducted from income tax payable. Property tax credits for renters are included in income tax, but property tax credits for homeowners are shown separately.
Rent is from Canada Mortgage and Housing Corporation’s Rental Market Survey, October 2010, and is based on the average one-bedroom apartment rent for each urban centre.
Provincial sales tax is based upon an average expenditure basket at the selected gross income levels from the “2009 Survey of Household Spending” (Statistics Canada), inflated to 2010 values using each province’s Consumer Price Index.
Transit fares are based on adult monthly pass rates in effect in January 2011. The impact of the federal non-refundable public transit tax credit has reduced the cost of transit fees shown for the single individual and single parent with one child examples.
Utilities are based on the Saskatchewan 2011 Budget Paper “2011 Intercity Comparison of Taxes, Utilities and Housing.”
| • | | Home heating charges are based on an annual consumption level of 2,800 cubic metres of natural gas for a detached bungalow for families with $40,000 and $60,000 of income. Annual consumption for the detached bungalow has been proportionally adjusted for the executive detached two storey. For the Atlantic Provinces, the figures represent the BTU equivalent consumption of fuel oil. |
| |
| • | | Electricity charges are based on the annual consumption of 8,100 kWh for a detached bungalow for families with $40,000 and $60,000 of income and 13,500 kWh for the family at $75,000. Annual consumption of 4,500 kWh is used for the single person and single parent renters. Rates do not include municipal taxes or charges. |
| |
| • | | Telephone charges are the basic service rates for individual residences. |
BUDGET 2011 Taxation Adjustments / C37
| n | | APPENDIX 3:
Age-Friendly Manitoba: the golden years |
Manitoba honours its seniors and recognizes that they have made a lifetime of contributions to every community — in workplaces, schools, hospitals and other institutions, with families, and to arts, culture, and sporting life. Increasingly, seniors continue to contribute to society well after retirement in their role as family elders and through a combination of paid and volunteer activities.
Manitobans are all supportive of the seniors in their own lives and enjoy their company and benefit through learning from their past experiences. In the same way, the Manitoba government distinguishes seniors’ needs and contributions through provincial support and programs specifically for seniors as well as consideration of their needs in the design of programs available to everyone. Seniors’ special requirements are taken into account financially, emotionally, physically and through health issues. Consideration of personal losses due to aging needs to be balanced with a positive view of the wisdom, experience and accomplishment that also come with being a senior.
When planning for the needs of its citizens aged 65 and over, Manitoba has opted for an integrated, multidimensional approach that includes community partnerships. By working with communities and program participants, the province is better able to address people’s needs and promote their personal development throughout all stages of life. Some of the relevant provincial senior programs are outlined below, including new tax measures to assist low-income seniors.
The Seniors and Healthy Aging Secretariat is part of Manitoba Healthy Living, Youth and Seniors. The Secretariat works with all provincial departments to create an environment within Manitoba that promotes health, independence and the well-being of older Manitobans. Approximately 98% of provincial government spending on seniors is through three departments: Manitoba Health, Manitoba Housing and Community Development, and Manitoba Finance. More recently, the Secretariat funded the major report, “Profile of Manitoba’s Seniors, 2010,” carried out by researchers at the University of Manitoba, to ensure that comprehensive and up-to-date information is available on Manitoba seniors and their needs.
Age-Friendly Manitoba is a comprehensive initiative that promotes the participation, inclusion, and health of older adults in their communities across eight domains: 1) outdoor space and buildings; 2) transportation; 3) housing; 4) respect and social inclusion; 5) social participation; 6) communication and information; 7) civic participation and employment; and 8) community support and health services. This initiative was originally developed by the World Health Organization and continues to be supported by the Public Health Agency of Canada. Manitoba is seen as a leader nationally and internationally in encouraging communities to be more age friendly. Manitoba provides $487,000 annually to help 72 participating communities throughout the province to help them engage citizens and businesses. The goal is to position each community to engage older adults as active contributing members leading fully independent lives.
The Support Services to Seniors program provides global funding to Manitoba’s Regional Health Authorities to administer and deliver programs and services for seniors within the entire continuum of care. There are currently 105 Community Resource Councils and 21 Multi-Purpose Senior Centres. These are community-developed and run, with the main objective of supporting seniors to live independently in their communities as long as possible. Support Services, which vary from community to community based on local needs, can include congregate meals, transportation, home maintenance, information and referrals, friendly visiting, personal emergency support, fitness, and life-long learning.
Programming to Meet Seniors’ Housing-Related Needs A number of programs have been designed specifically to meet seniors’ special housing needs.
C38 / Taxation Adjustments BUDGET 2011
| • | | The SafetyAid Program provides $216,000 to help improve home security for seniors, including safety audits and the installation of security and fall-prevention devices. |
| |
| • | | Home Adaptations for Seniors Independence Program provides loans, to a maximum of $3,500, to lower-income homeowners aged 65 plus for improvements designed to help them stay in their own home longer. |
| |
| • | | Residential Rehabilitation Assistance Program provides loans for low-income homeowners to return substandard homes to a condition that meets health and safety levels. The maximum loan is $19,000 depending on household income. |
| |
| • | | RentAid (formerly the Manitoba Shelter Benefit) provides a rental supplement to low-income senior renters of up to $210 per month. |
| |
| • | | Aging in Place Strategy (part of Manitoba Health’s Long-Term Care strategy) addresses the need for affordable housing options, with varying levels of support, as alternatives to personal care home placement. The strategy focuses on the required elements that allow individuals to continue living in their home. |
Health-Care Related Programming takes into account the special needs of seniors within the context of Manitoba’s universal health care system.
| • | | The Eyeglass Program provides financial assistance for seniors to purchase eyeglasses. Manitoba Health covers 80% of the allowable total purchase price. |
| |
| • | | Flexible Contact Lenses are now available free for cataract operations, a universal service used primarily by seniors. This saves patients about $300. |
| |
| • | | The Pharmacare Program provides income-tested benefits for all ages. The program covers 100% of eligible drug costs after an income-based deductible. |
| |
| • | | The Home Care Program is the oldest, most comprehensive, province-wide, universal home care program in Canada. Home Care is provided to Manitobans based on assessed need. |
Tax-Based Programs: A number of tax-based credits, exemptions and preferences help Manitobans in retirement and to prepare for their retirement.
| • | | Manitobans save $224 million annually in Manitoba income taxes from registered pension plan contribution deductions. |
| |
| • | | Pensioners save $30 million annually in Manitoba income taxes through pension income splitting and the $1,000 private pension income exemption. |
| |
| • | | Low-income seniors save $18 million annually in Manitoba income taxes through the Guaranteed Income Supplement (GIS) exemption. |
| |
| • | | Low- and middle-income seniors save $33 million annually in Manitoba income taxes through the age exemption. |
| |
| • | | Senior homeowners and tenants save $73 million annually in property taxes and rental costs under the combined benefits of the Education Property Tax Credit, the Pensioners’ School Tax Assistance, and the elimination of the Education Support Levy. |
| |
| • | | Seniors save an estimated $111 million annually in Manitoba income taxes from other basic exemptions. |
| |
| • | | Several important sales tax exemptions that primarily benefit seniors include prescription drugs and medicine (savings of $22 million annually), and medical supplies, appliances and equipment (savings of $14 million annually). |
BUDGET 2011 Taxation Adjustments / C39
Budget 2011 Enhancements
Budget 2011 provides further tax savings to Manitoba seniors to enhance affordability.
Education Property Tax Credit: This tax credit makes property taxes more affordable for all Manitoba households. Homeowners typically receive the basic component of the credit as an offset to their property tax bills, while renters claim it on their income tax return. The basic credit will be increased from $650 to $700 in 2011. The basic tax credit has now been increased by 180%, from $250 in 1999 to $700.
Budget 2011 also announces increases in the seniors’ maximum Education Property Tax Credit from $800 to:
| • | | $950 in 2011, providing an average benefit enhancement, compared to 2010, of $62 annually to about 21,000 senior households; |
| |
| • | | $1,025 in 2012, providing an average benefit enhancement of $107 to over 27,000 senior households; and |
| |
| • | | $1,100 starting in 2013, providing an average enhancement of $151 to over 31,000 senior households, leaving all seniors with a family income of less than $40,000 better off. |
When completely phased in, the new $1,100 seniors’ maximum will save seniors about $4.8 million annually.
Primary Caregiver Tax Credit: This credit began in 2009 to recognize and support individuals who serve as volunteer primary caregivers, who provide care recipients with a level of care or supervision while living in his or her own home. The credit helps offset the caregiver’s out-of-pocket expenses of caregiving. Many primary caregivers are themselves seniors, and a large proportion of the care recipients are seniors over the age of 65. The value of the credit, which is fully refundable, is being increased by 25% starting in 2011, from $85 per month ($1,020 annually) to $106.25 per month ($1,275 annually). This enhancement is expected to benefit over 5,000 primary caregivers each year.
Basic Income Tax Credits: Budget 2011 increases three personal basic tax credits that reduce Manitoba income taxes for a majority of Manitobans. This includes increasing the personal amount, spousal amount and eligible dependent amount by $250 each, every year for four years, starting in 2011.
The following table summarizes the additional tax savings provided under Budget 2011 to single seniors and senior couples.
C40 / Taxation Adjustments BUDGET 2011
Increased Tax Savings For Seniors from Budget 2011 Tax Measures
Compared to 2010 Manitoba Income Tax and Tax Credit Levels
| | | | | | | | | | | | | | | | | | | | | |
| | | Tax Years | | | | |
| | | 2011 | | | 2012 | | | 2013 | | | 2014 | | | Total | |
| | | | | | | | | | | | | | | | | | | | | |
Single Senior | | | | | | | | | | | | | | | | | | | | |
| Basic Property Tax Credit | | $ | 50 | | | $ | 50 | | | $ | 50 | | | $ | 50 | | | $ | 200 | |
| Senior Property Tax Credit* | | $ | 62 | | | $ | 107 | | | $ | 151 | | | $ | 151 | | | $ | 471 | |
| Personal Income Tax Credits | | $ | 27 | | | $ | 54 | | | $ | 81 | | | $ | 108 | | | $ | 270 | |
| | | | | | | | | | | | | | | | |
| Total | | $ | 139 | | | $ | 211 | | | $ | 282 | | | $ | 309 | | | $ | 941 | |
| | | | | | | | | | | | | | | | | | | | | |
Senior Couple | | | | | | | | | | | | | | | | | | | | |
| Basic Property Tax Credit | | $ | 50 | | | $ | 50 | | | $ | 50 | | | $ | 50 | | | $ | 200 | |
| Senior Property Tax Credit* | | $ | 62 | | | $ | 107 | | | $ | 151 | | | $ | 151 | | | $ | 471 | |
| Personal Income Tax Credits | | $ | 54 | | | $ | 108 | | | $ | 162 | | | $ | 216 | | | $ | 540 | |
| | | | | | | | | | | | | | | | |
| Total | | $ | 166 | | | $ | 265 | | | $ | 363 | | | $ | 417 | | | $ | 1,211 | |
| | |
| * | | Average benefit for seniors with income below $25,000 in 2011, $32,500 in 2012, and $40,000 after 2012 |
In addition to the tax savings introduced in Budget 2011 that benefit seniors, Manitoba remains one of the most affordable provinces in which to live, work and retire. “The Manitoba Advantage” contains an interprovincial comparison that highlights Manitoba’s affordability for various households, including single seniors and senior couples.
BUDGET 2011 Taxation Adjustments / C41
| n | | APPENDIX 4:
MANITOBA’S COMPETITIVE ENVIRONMENT FOR MANUFACTURING |
Manitoba’s competitive business environment continues to attract manufacturing investment due to:
| • | | its central location and excellent transportation links to the rest of North America, including CentrePort Canada |
| |
| • | | low industrial and commercial land costs |
| |
| • | | electricity costs which are among the lowest in the world |
| |
| • | | a skilled, well-educated and affordable work force |
| |
| • | | one of the best R&D tax credit regimes |
| |
| • | | low taxes on capital investments. |
Manitoba Finance’s competitiveness model compares the tax structure and cost environment for representative smaller and larger manufacturing firms relative to several other North American cities.
The model simulates start-up, operating, financial and taxation costs over a period of 20 years. It incorporates future unconditional changes in taxes that have been announced by the federal, provincial, state or local governments. The representative firms’ profiles have been updated using the most recent data available from Statistics Canada, local economic development boards and other public sources.
Payroll-related Levies
U.S. employers pay federal and state unemployment taxes, social security tax and medicare tax and are also required to provide workers’ compensation coverage. Canadian employers do not pay provincial unemployment or federal medicare taxes, though some provinces have taxes on payroll. For example, at the same wage level, a firm in Atlanta will have higher payroll-related taxes and levies than in Winnipeg.
Interjurisdictional Competitiveness
The following indicators are used to assess cost and tax competitiveness for both a smaller and a larger manufacturing firm:
| • | | net cost of investment, or start-up costs (including applicable taxes) |
| |
| • | | pre-tax net income |
| |
| • | | effective tax rates |
| |
| • | | internal rates of return. |
Payroll-Related Taxes and Levies per Employee Larger Manufacturing Firm Winnipeg and Atlanta
C42 / Taxation Adjustments BUDGET 2011
The model uses actual costs for each city and calculates net revenue and cash flow, including start-up costs, based on the operating costs in each location.1 The results for each city are compared to the overall average of all cities (100.0) for each of the indicators and presented in the charts that follow.
Net Cost of Investment
The costs of starting a manufacturing plant (land, buildings, and machinery and equipment) in Manitoba are among the lowest of all cities. Investment tax credits on capital asset purchases reduce the net cost of investment. Start-up costs in larger cities tend to be higher due to the cost of land and construction labour wages and salaries.
| | | |
|
Net Cost of Investment | | Net Cost of Investment |
Smaller Manufacturing Firm | | Larger Manufacturing Firm |
| | | |
| | 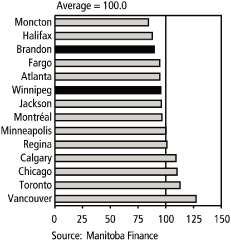 |
Pre-Tax Net Income
Pre-tax net income compares Manitoba’s business cost competitiveness to other jurisdictions. It is calculated by deducting production material costs and location-specific costs from fixed annual sales figures. Annual sales are uniform for all locations and are ramped up through the first four years of operation then fixed across the cities at $4 million for the smaller firm and $45 million for the larger firm for years five to twenty. Annual production material costs are equal to 46% of sales in a given year.
The following location-specific costs are also deducted from annual sales:
| • | | average manufacturing wages |
| |
| • | | local utility costs for electricity and basic business telephone lines |
| |
| • | | interest charges on debt used to finance construction of the manufacturing plants |
| | |
| 1 | | For comparison purposes U.S. data is converted to Canadian dollars at an exchange rate of C$0.9714 (March 8, 2011 rate). |
BUDGET 2011 Taxation Adjustments / C43
| • | | depreciation of capital assets: buildings costs (which vary by city based on local construction wages) and machinery and equipment (which are assumed to be the same across all cities) |
| |
| • | | employer paid health premiums. |
Brandon yields the highest pre-tax net income for both the smaller and larger manufacturing firms, while Winnipeg has the fourth-highest pre-tax net income for both model firms.
| | | |
|
Pre-Tax Net Income | | Pre-Tax Net Income |
Smaller Manufacturing Firm | | Larger Manufacturing Firm |
| | | |
| | 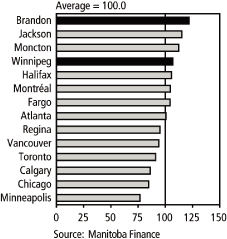 |
Effective Tax Rates
Effective tax rates are generated by computing gross taxes as a proportion of pre-tax net income over the 20-year period. The following annual taxes are taken into account:
| • | | corporation income taxes |
| |
| • | | local property and business taxes |
| |
| • | | corporation capital and U.S. franchise taxes |
| |
| • | | taxes on payroll |
| |
| • | | workers’ compensation premiums |
| |
| • | | statutory pension and unemployment insurance premiums. |
For U.S. firms, employer-paid health premiums are also included.
The following tax expenditures that benefit the manufacturing sector are also taken into account:
| • | | investment tax credits |
| |
| • | | tax holidays |
| |
| • | | accelerated capital cost allowances |
| |
| • | | preferential tax rates. |
C44 / Taxation Adjustments BUDGET 2011
Not included are enterprise zones, grants, and other forms of governmental and third-party financial assistance programs that are subject to an approval process.
For both the smaller and larger manufacturing firms, both Winnipeg’s and Brandon’s effective tax rates are well below the overall average (100.0).
| | | |
|
Effective Tax Rates | | Effective Tax Rates |
Smaller Manufacturing Firm | | Larger Manufacturing Firm |
| | | |
| | 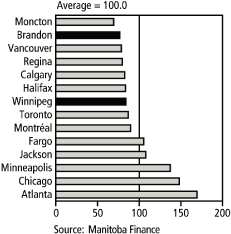 |
Overall Competitiveness
Overall competitiveness is compared by calculating internal rates of return, which are commonly used by business in making investment and location decisions. A higher internal rate of return indicates a city is more competitive than others. Internal rates of return for each city are calculated using start-up costs and cash flow over a 20-year period, specific to a smaller and a larger manufacturing firm, then discounted using applicable Canadian and U.S. commercial interest rates. The following charts illustrate the combined impact of taxes and costs on the internal rates of return for the representative smaller and larger manufacturing corporations in the selected jurisdictions.
BUDGET 2011 Taxation Adjustments / C45
| | | |
|
Internal Rates of Return | | Internal Rates of Return |
Smaller Manufacturing Firm | | Larger Manufacturing Firm |
| | | |
| |  |
The internal rates of return for both Winnipeg and Brandon are above the overall average of the cities included in the study. Brandon has the highest internal rate of return and Winnipeg has the fourth-highest internal rate of return for both the smaller and larger manufacturing firms.
| | | |
|
Internal Rates of Return | | Internal Rates of Return |
Smaller Manufacturing Firm | | Larger Manufacturing Firm |
in Cities over 500,000 | | in Cities over 500,000 |
| | | |
| |  |
Among cities with populations over 500,000, Winnipeg has the highest internal rate of return for both smaller and larger manufacturing firms.
CONCLUSION
Manitoba continues to maintain a highly competitive overall business cost and tax environment for both smaller and larger firms engaged in manufacturing and processing.