SUMMARY BUDGET 2012/13
SUMMARY BUDGET
For the Fiscal Year Ending March 31, 2013
With Comparative Data for the Year Ending March 31, 2012
| | | | | | | | | | | | | | | | | | | | |
| | | | | | | | | | | | Per cent Change | |
| | | | | | | | | | | | 2012/13 Budget from | |
| | | 2012/13 | | | 2011/12 | | | 2011/12 | | | 2011/12 | | | 2011/12 | |
| | | Budget | | | Forecast | | | Budget | | | Forecast | | | Budget | |
| | | (Millions of Dollars) | |
REVENUE SOURCE | | | | | | | | | | | | | | | | | | | | |
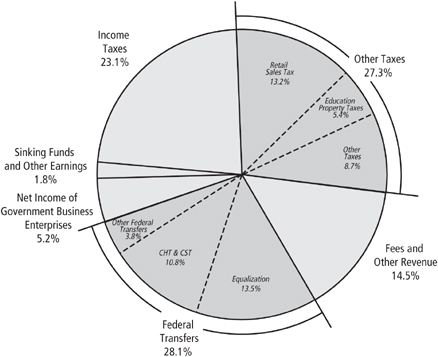
Income Taxes | | | 3,202 | | | | 3,141 | | | | 3,170 | | | | 1.9 | % | | | 1.0 | % |
Other Taxes | | | 3,788 | | | | 3,474 | | | | 3,470 | | | | 9.0 | % | | | 9.2 | % |
Fees and Other Revenue | | | 2,009 | | | | 1,837 | | | | 1,772 | | | | 9.4 | % | | | 13.4 | % |
Federal Transfers | | | 3,889 | | | | 4,351 | | | | 3,972 | | | | (10.6 | %) | | | (2.1 | %) |
Net Income of Government Business | | | 722 | | | | 761 | | | | 781 | | | | (5.1 | %) | | | (7.6 | %) |
Enterprises | | | | | | | | | | | | | | | | | | | | |
Sinking Funds and Other Earnings | | | 241 | | | | 245 | | | | 239 | | | | (1.6 | %) | | | 0.8 | % |
| | | | | | | | | | | | | | | | | | | | |
TOTAL REVENUE | | | 13,851 | | | | 13,809 | | | | 13,404 | | | | 0.3 | % | | | 3.3 | % |
| | | | | | | | | | | | | | | | | | | | |
EXPENDITURE SECTORS | | | | | | | | | | | | | | | | | | | | |
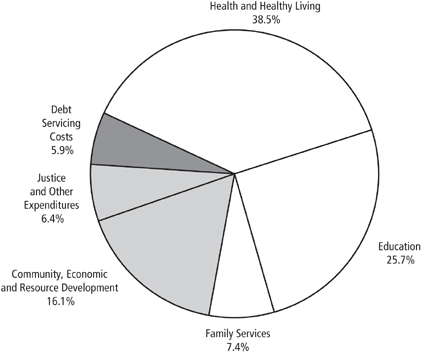
Health and Healthy Living | | | 5,547 | | | | 5,286 | | | | 5,387 | | | | 4.9 | % | | | 3.0 | % |
Education | | | 3,710 | | | | 3,576 | | | | 3,562 | | | | 3.7 | % | | | 4.2 | % |
Family Services | | | 1,064 | | | | 1,047 | | | | 990 | | | | 1.6 | % | | | 7.5 | % |
Community, Economic and Resource | | | 2,317 | | | | 2,614 | | | | 2,340 | | | | (11.4 | %) | | | (1.0 | %) |
Development | | | | | | | | | | | | | | | | | | | | |
Justice and Other Expenditures | | | 928 | | | | 1,666 | | | | 901 | | | | (44.3 | %) | | | 3.0 | % |
Debt Servicing Costs | | | 858 | | | | 813 | | | | 807 | | | | 5.5 | % | | | 6.3 | % |
| | | | | | | | | | | | | | | | | | | | |
TOTAL EXPENDITURE | | | 14,424 | | | | 15,002 | | | | 13,987 | | | | (3.9 | %) | | | 3.1 | % |
In-Year Adjustments/Lapse | | | (113 | ) | | | (73 | ) | | | (145 | ) | | | | | | | | |
| | | | | | | | | | | | | | | | | | | | |
NET INCOME (LOSS) | | | (460 | ) | | | (1,120 | ) | | | (438 | ) | | | | | | | | |
| | | | | | | | | | | | | | | | | | | | |
NOTES:
| • | | The 2011/12 Budget numbers originally presented in the 2011 Budget Address and the 2011/12 forecast from the Third Quarter Financial Report have been restated to be consistent with the current presentation for the GRE. |
| • | | Details of Expenditure and Revenue for Fiscal Year 2012/13, and a reconciliation to the amounts reported for core government are found in Schedules 1 and 2. |
| • | | Program portfolio management review savings have been allocated to Community, Economic and Resource Development (CERD) expenditures. |
| • | | In-Year Adjustments/Lapse could be an increase in revenue and/or a decrease in expenditure. |
| • | | Numbers may not add due to rounding. |
n SUMMARY BUDGET 2012/13
Revenue
Revenue in 2012/13, including new revenue measures, is projected to increase $42 million or 0.3% from the 2011/12. Forecast.
Income taxes are projected to increase by $61 million, with a $95 million increase in Individual Income Tax offset by a decrease of $34 million in Corporation Income Tax. Budget 2012 projects a $314 million, or 9.0%, increase in other taxes reflecting growth in retail sales taxes, a $49 million increase in fuel taxes as well as an $11 million increase in tobacco tax. Corporations taxes are forecast to increase by $27 million. Fees and Other Revenue is projected to increase $172 million, or 9.4%. Net Income of Government Business Enterprises (GBEs) is projected to decrease $39 million, or 5.1%. Federal transfers in 2011/12 included recoveries for the 2011 flood.
Expenditure
Total expenditure is budgeted to decrease $578 million or 3.9% from the 2011/12 Forecast.
The growth in Health and Healthy Living expenditure is $261 million or 4.9%. Education-related expenditure is increasing by $134 million or 3.7%. Family Services is up $17 million or 1.6%. Community, Economic and Resource Development expenditure will decrease by $297 million or 11.4%. Manitoba Justice is increasing by $6.3 million or 1.4%. Overall, the Justice and Other Expenditures sector will decrease by $738 million, mainly due to 2011 flood costs. Debt Servicing Costs are expected to increase by $45 million.1
In Budget 2012, services to people represent 76.4% of spending.
| | • | | Health and Healthy Living expenditure makes up 38.5% of total expenditure. |
| | • | | Education accounts for 25.7% of all expenditure; it includes public schools and post-secondary institutions. |
| | • | | Family Services, Justice, and Housing and Community Development represent 12.2% of total expenditure. |
| 1 | Debt Servicing Costs are forecast to equal 6.2¢ of every dollar of revenue in 2012/13, down 53.0% from 13.2¢ per dollar in 1999/2000. |
Schedule 1
Summary Revenue Estimate: Details and Reconciliation to Core Government Estimates
Fiscal Year ending March 31, 2013 (in Thousands of Dollars)
| | | | | | | | | | | | |
| | | CORE GOVERNMENT | | | CONSOLIDATION IMPACTS | | | SUMMARY | |
| | | Revenue | | | and Revenue of Other | | | | |
| Source of Revenue | | Estimate | | | Reporting Entities | | | | |
Income Taxes | | | | | | | | | | | | |
Individual Income Tax | | | 2,796,300 | | | | - | | | | 2,796,300 | |
Corporation Income Tax | | | 405,500 | | | | - | | | | 405,500 | |
| | | | | | | | | | | | |
Subtotal: Income Taxes | | | 3,201,800 | | | | - | | | | 3,201,800 | |
| | | | | | | | | | | | |
Other Taxes | | | | | | | | | | | | |
Corporations Taxes | | | 215,400 | | | | - | | | | 215,400 | |
Fuel Taxes | | | 296,500 | | | | 19,600 | | | | 316,100 | |
Land Transfer Tax | | | 66,200 | | | | - | | | | 66,200 | |
Levy for Health and Education | | | 410,000 | | | | (104,400 | ) | | | 305,600 | |
Mining Tax | | | 35,000 | | | | - | | | | 35,000 | |
Retail Sales Tax | | | 1,834,100 | | | | - | | | | 1,834,100 | |
Tobacco Tax | | | 256,400 | | | | - | | | | 256,400 | |
Other Taxes | | | 14,705 | | | | - | | | | 14,705 | |
Education Property Taxes | | | - | | | | 744,447 | | | | 744,447 | |
| | | | | | | | | | | | |
Subtotal: Other Taxes | | | 3,128,305 | | | | 659,647 | | | | 3,787,952 | |
| | | | | | | | | | | | |
Fees and Other Revenue | | | | | | | | | | | | |
Fines and Costs and Other Legal | | | 51,538 | | | | - | | | | 51,538 | |
Minerals and Petroleum | | | 28,820 | | | | - | | | | 28,820 | |
Automobile and Motor Carrier Licences and Fees | | | 147,026 | | | | - | | | | 147,026 | |
Parks: Forestry and Other Conservation | | | 33,088 | | | | - | | | | 33,088 | |
Water Power Rentals | | | 117,800 | | | | - | | | | 117,800 | |
Service Fees and Other Miscellaneous Charges | | | 218,624 | | | | 1,158,406 | | | | 1,377,030 | |
Revenue Sharing from SOAs | | | 26,180 | | | | - | | | | 26,180 | |
Tuition Fees | | | - | | | | 227,786 | | | | 227,786 | |
| | | | | | | | | | | | |
Subtotal: Fees and Other Revenue | | | 623,076 | | | | 1,386,192 | | | | 2,009,268 | |
| | | | | | | | | | | | |
Federal Transfers | | | | | | | | | | | | |
Equalization | | | 1,872,000 | | | | - | | | | 1,872,000 | |
Canada Health Transfer | | | 1,062,500 | | | | - | | | | 1,062,500 | |
Canada Social Transfer | | | 429,200 | | | | - | | | | 429,200 | |
Health Funds | | | 9,000 | | | | - | | | | 9,000 | |
Infrastructure Renewal | | | 28,800 | | | | - | | | | 28,800 | |
Manitoba Floodway Expansion | | | 10,000 | | | | - | | | | 10,000 | |
Shared Cost and Other Transfers | | | 187,745 | | | | 289,705 | | | | 477,450 | |
| | | | | | | | | | | | |
Subtotal: Federal Transfers | | | 3,599,245 | | | | 289,705 | | | | 3,888,950 | |
| | | | | | | | | | | | |
Net Income of Government | | | | | | | | | | | | |
Business Enterprises (GBEs) | | | | | | | | | | | | |
Manitoba Liquor Control Commission | | | 260,452 | | | | - | | | | 260,452 | |
Manitoba Lotteries Corporation | | | 346,000 | | | | - | | | | 346,000 | |
Deposit Guarantee Corporation | | | - | | | | 19,295 | | | | 19,295 | |
Manitoba Hydro | | | - | | | | 65,000 | | | | 65,000 | |
Workers Compensation Board | | | - | | | | 21,140 | | | | 21,140 | |
Manitoba Public Insurance Corporation | | | - | | | | 10,000 | | | | 10,000 | |
| | | | | | | | | | | | |
Subtotal: Net Income of GBEs | | | 606,452 | | | | 115,435 | | | | 721,887 | |
| | | | | | | | | | | | |
Sinking Funds and Other Earnings | | | - | | | | 241,541 | | | | 241,541 | |
| | | | | | | | | | | | |
Total Revenue Estimate | | | 11,158,878 | | | | 2,692,520 | | | | 13,851,398 | |
| | | | | | | | | | | | |
Schedule 2
Summary Expenditure Estimate: Details, Reconciliation to Core Government Estimates and Summary Budget Result
Fiscal Year ending March 31, 2013 (in Thousands of Dollars)
| | | | | | | | | | | | |
| | | CORE GOVERNMENT | | | CONSOLIDATION IMPACTS | | | SUMMARY | |
| | | Expenditure | | | and Expenditures of Other | | | | |
| Sector/Department | | Estimate | | | Reporting Entities | | | | |
Health and Healthy Living | | | | | | | | | | | | |
Health | | | 5,094,313 | | | | 363,348 | | | | 5,457,661 | |
Healthy Living, Seniors and Consumer Affairs | | | 57,862 | | | | 31,013 | | | | 88,875 | |
| | | | | | | | | | | | |
Total Health and Healthy Living | | | 5,152,175 | | | | 394,361 | | | | 5,546,536 | |
| | | | | | | | | | | | |
Education | | | | | | | | | | | | |
Advanced Education and Literacy | | | 689,205 | | | | 507,691 | | | | 1,196,896 | |
Education | | | 1,632,689 | | | | 880,875 | | | | 2,513,564 | |
| | | | | | | | | | | | |
Total Education | | | 2,321,894 | | | | 1,388,566 | | | | 3,710,460 | |
| | | | | | | | | | | | |
Family Services | | | | | | | | | | | | |
Children and Youth Opportunities | | | 44,611 | | | | — | | | | 44,611 | |
Family Services and Labour | | | 1,032,234 | | | | (13,074 | ) | | | 1,019,160 | |
| | | | | | | | | | | | |
Total Family Services | | | 1,076,845 | | | | (13,074 | ) | | | 1,063,771 | |
| | | | | | | | | | | | |
Community, Economic and Resource Development | | | | | | | | | | | | |
Aboriginal and Northern Affairs | | | 35,536 | | | | (408 | ) | | | 35,128 | |
Agriculture, Food and Rural Initiatives | | | 226,988 | | | | 222,825 | | | | 449,813 | |
Conservation and Water Stewardship | | | 156,037 | | | | (4,654 | ) | | | 151,383 | |
Entrepreneurship, Training and Trade | | | 574,473 | | | | 8,153 | | | | 582,626 | |
Housing and Community Development | | | 80,445 | | | | 137,844 | | | | 218,289 | |
Infrastructure and Transportation | | | 653,762 | | | | (126,428 | ) | | | 527,334 | |
Innovation, Energy and Mines | | | 87,906 | | | | 25,474 | | | | 113,380 | |
Local Government | | | 363,923 | | | | 3,721 | | | | 367,644 | |
| | | | | | | | | | | | |
Total Community, Economic and Resource Development | | | 2,179,070 | | | | 266,527 | | | | 2,445,597 | |
| | | | | | | | | | | | |
Justice and Other Expenditures | | | | | | | | | | | | |
Legislative Assembly | | | 40,181 | | | | (1,243 | ) | | | 38,938 | |
Executive Council | | | 2,827 | | | | (127 | ) | | | 2,700 | |
Civil Service Commission | | | 21,643 | | | | 783 | | | | 22,426 | |
Culture, Heritage and Tourism | | | 61,350 | | | | 5,654 | | | | 67,004 | |
Employee Pensions and Other Costs | | | 16,933 | | | | 55,000 | | | | 71,933 | |
Finance | | | 68,081 | | | | 3,366 | | | | 71,447 | |
Immigration and Multiculturalism | | | 38,818 | | | | 13,187 | | | | 52,005 | |
Justice | | | 460,873 | | | | 13,912 | | | | 474,785 | |
Sport | | | 11,970 | | | | 2,052 | | | | 14,022 | |
Enabling Appropriations | | | 40,671 | | | | — | | | | 40,671 | |
Other Appropriations | | | 72,175 | | | | — | | | | 72,175 | |
| | | | | | | | | | | | |
Total Justice and Other Expenditures | | | 835,522 | | | | 92,584 | | | | 928,106 | |
| | | | | | | | | | | | |
Debt Servicing Costs | | | 258,000 | | | | 599,584 | | | | 857,584 | |
Program Portfolio Management Reviews | | | (128,000 | ) | | | — | | | | (128,000 | ) |
| | | | | | | | | | | | |
Total Expenditure Estimate | | | 11,695,506 | | | | 2,728,548 | | | | 14,424,054 | |
Subtract: Total Revenue Estimate (Schedule 1) | | | 11,158,878 | | | | 2,692,520 | | | | 13,851,398 | |
In-Year Adjustments/Lapse | | | (32,500 | ) | | | (80,000 | ) | | | (112,500 | ) |
| | | | | | | | | | | | |
Net Result for the Year | | | (504,128 | ) | | | 43,972 | | | | (460,156 | ) |
Transfer from Fiscal Stabilization Account | | | 56,065 | | | | (56,065 | ) | | | — | |
| | | | | | | | | | | | |
NET INCOME (LOSS) | | | (448,063 | ) | | | (12,093 | ) | | | (460,156 | ) |
| | | | | | | | | | | | |
Note: In-Year Adjustments/Lapse could be an increase in revenue and/or a decrease in expenditure.
Revenue, 2012/13
Major Sources
Per cent of Total
Expenditure, 2012/13
Major Sectors
Per cent of Total
FINANCIAL MANAGEMENT STRATEGY
n FINANCIAL MANAGEMENT STRATEGY 2012/13
Financial Management Priorities
The Financial Management Strategy (FMS) sets out the government’s priorities for financial management. It includes five main priority areas with one or more measurable outcomes. Each measurable outcome includes objectives for the current year and for future years.
For 2012/13, the FMS continues to focus on the priority areas identified in prior years and reflects the balanced approach of Manitoba’s Five-Year Economic Plan.
| | | | |
| FINANCIAL MANAGEMENT PRIORITY | | MEASURABLE OUTCOMES |
| |
Transparency, Accountability and Fiscal Discipline | | • Summary Net Income |
| |
| | • Maintaining Accountability for Core Government Program Expenditure and Revenue |
| |
Stable and Affordable Government | | • Credit Ratings |
| |
| | • Expenditures as a Percentage of Gross Domestic Product (GDP) |
| |
| | • Strengthening the Management of Public Resources |
| |
Managing Debt | | • Debt Retirement |
| |
| | • Net Debt to GDP Ratio |
| |
Infrastructure and Capital Asset Renewal | | • Capital Investments |
| |
Performance Management | | • Continued Development of Performance Management Capacity |
n PRIORITY AREA – TRANSPARENCY, ACCOUNTABILITY AND FISCAL DISCIPLINE
Government has implemented a number of measures in recent years to ensure financial accountability and maintain fiscal discipline, including:
| | • | | implementing GAAP compliant summary financial statements as of March 31, 2005; |
| | • | | implementing summary budgeting and reporting in 2007/08 to present comprehensive information on the total cost of providing programs and services to Manitobans and how the GRE operates as a whole; |
| | • | | publishing an FMS as part of the annual budget and a report on outcomes within six months of the end of the fiscal year; |
| | • | | implementing summary quarterly financial reporting, consistent with GAAP as of 2009/10; |
| | • | | establishing and implementing plans to eliminate general purpose debt and pension liabilities; |
| | • | | funding the employer’s share of current service pension contributions for all employees; and |
| | • | | introducing a multi-year plan in Budget 2010 to address the impact of the global economic downturn. |
Government will continue to monitor changes in accounting standards and recommendations from the PSAB to facilitate the presentation of meaningful financial information for end users. The commitment to transparency, accountability and fiscal discipline continues in Budget 2012 with an update on the multi-year plan for 2012/13 and future years.
Measurable Outcome – Summary Net Income
Governments around the world were affected by the economic downturn and, like Manitoba, many were faced with budget deficits as they worked to stimulate the economy and manage expenditures. While Manitoba’s economy has traditionally been one of the most stable in Canada, there was no quick solution to the financial pressures that the province was facing.
The five-year economic plan introduced in Budget 2010 to address the challenges has seen positive results and the government continues to be committed to a balanced approach. With the continuing uncertainty in global economies and the additional fiscal pressures caused by record flooding in 2011, Budget 2012 demonstrates this balanced approach by focusing on:
| | • | | investing in vital front-line services to improve health care, education and training, policing and supports for families; |
| | • | | introducing responsible, innovative ways to reduce the cost of government; |
| | • | | supporting economic growth and innovation; |
| | • | | taking steps to ensure the long-term sustainability of infrastructure; |
| | • | | restoring balance and returning to surplus in Budget 2014; and |
| | • | | maintaining affordability to keep Manitoba one of the best places to live, work and raise a family. |
Challenges remain for the Manitoba and Canadian economies as they continue to expand at a modest pace. The unprecedented flooding in 2011 may have negatively impacted the province’s finances, but Manitoba has a strategy to keep the economy strong and growing, and meet the commitment to return to surplus in Budget 2014.
Manitoba’s Five-Year Economic Plan
| | | | | | | | | | | | | | | | | | | | |
| | | 2010/11 | | | 2011/12 | | | 2012/13 | | | 2013/14 | | | 2014/15 | |
| | | Actual | | | Forecast | | | Budget | | | Projection | | | Projection | |
| | | (Millions of Dollars) | |
REVENUE | | | | | | | | | | | | | | | | | | | | |
Core Government | | | 10,550 | | | | 11,146 | | | | 11,159 | | | | 11,672 | | | | 12,141 | |
Other Reporting Entities* | | | 2,655 | | | | 2,663 | | | | 2,692 | | | | 2,667 | | | | 2,727 | |
| | | | | | | | | | | | | | | | | | | | |
TOTAL REVENUE | | | 13,205 | | | | 13,809 | | | | 13,851 | | | | 14,339 | | | | 14,868 | |
| | | | | | | | | | | | | | | | | | | | |
| | | | | |
EXPENDITURE | | | | | | | | | | | | | | | | | | | | |
Core Government Programs and Services | | | 10,890 | | | | 12,171 | | | | 11,696 | | | | 11,930 | | | | 12,171 | |
Other Reporting Entities* | | | 2,613 | | | | 2,831 | | | | 2,728 | | | | 2,730 | | | | 2,819 | |
| | | | | | | | | | | | | | | | | | | | |
TOTAL EXPENDITURE | | | 13,503 | | | | 15,002 | | | | 14,424 | | | | 14,660 | | | | 14,990 | |
| | | | | | | | | | | | | | | | | | | | |
In-Year Adjustments/Lapse ** | | | — | | | | (73 | ) | | | (113 | ) | | | (145 | ) | | | (145 | ) |
| | | | | | | | | | | | | | | | | | | | |
SUMMARY NET INCOME (LOSS) | | | (298 | ) | | | (1,120 | ) | | | (460 | ) | | | (176 | ) | | | 23 | |
| | | | | | | | | | | | | | | | | | | | |
| * | includes consolidation adjustments |
| ** | In-Year Adjustments/Lapse could be an increase in revenue and/or a decrease in expenditure. |
The plan assumes GRE revenues will rise by an average of 3.6% annually from 2012/13 to 2014/15, while GRE expenditures are forecast to increase by an annual average of 1.9% during the same period.
Core government revenue is forecast to rise by an average of 4.3% annually while core government expenditure will grow by an annual average of 2.0% from 2012/13 to 2014/15.
Core government projections reflect the commitment to return to surplus while focusing on what matters most to Manitoba families. Budget 2012 makes strategic investments in front-line services, reduces spending growth in other areas and introduces modest measures to increase revenue. While several risks and challenges remain for the national economy, Manitoba’s economic and demographic fundamentals are projected to produce stable economic growth over the next two years.
The Manitoba government is committed to balancing summary net income over the medium term and Budget 2012 introduces more responsible, innovative ways to reduce the cost of government in the third year of the five-year plan:
| | • | | reducing the number of regional health authorities from 11 to five to streamline services; |
| | • | | merging the Manitoba Liquor Control Commission and the Manitoba Lotteries Corporation to reduce overhead and the regulatory costs; |
| | • | | working with municipal governments to encourage more regional co-operation; |
| | • | | continue the 20 per cent roll-back on salaries for government ministers; |
| | • | | defer wage increases and reduce office expenses for Members of the Legislative Assembly; |
| | • | | reduce travel costs in every government department; |
| | • | | reduce the number of government-appointed agencies, boards and commissions; and |
| | • | | implement program portfolio management reviews to reduce expenditures and focus on core government program priorities. |
These measures will reduce duplication and result in more efficient use of public resources and support the return to balance. The responsible plan to restore balance continues to be reflected in legislation that:
| | • | | requires the budget shortfall to be eliminated over four years and a return to surplus in 2014/15; |
| | • | | keeps the legal requirement to have balanced budgets into the future; |
| | • | | exceeds debt payment requirements under the previous legislation; and |
| | • | | retains the restrictions that prohibit increases to major taxes without a referendum. |
An annual financial management strategy and a report on outcomes will continue to be published. In addition, in-year financial reporting will provide updates on the progress made in achieving our economic recovery plan.
Measurable Outcome – Maintaining Accountability for Core
Government Program Expenditure and Revenue
Legislation requires government to include a summary of core government expenditures and projected revenues as part of the FMS. This is consistent with the main estimates of expenditure and revenue for the fiscal year.
While core government expenditure will exceed revenue in Budget 2012, the five-year economic recovery plan shows this reversing in Budget 2014. The projection includes allocations from the Fiscal Stabilization Account (FSA) for funding from the federal government for health-related programming and ecoTrust funding as well as for debt servicing costs resulting from the core government deficit.
Core Government Expenditure and Revenue, 2012/13
| | | | |
| | | $ Millions | |
Revenue | | | 11,159 | |
| |
Expenditure | | | 11,696 | |
| |
In-Year Adjustments/Lapse | | | (33 | ) |
| | | | |
| | | (504 | ) |
| |
Transfer from Fiscal Stabilization Account | | | | |
| |
Health-related programming | | | 8 | |
| |
ecoTrust | | | 4 | |
| |
Debt Servicing Costs | | | 44 | |
| | | | |
| |
Net Result | | | (448 | ) |
| | | | |
Year-end information on core government revenue and expenditure for 2012/13 will be provided as part of the FMS report on outcomes, scheduled to be released in the fall of 2013.
|
B U D G E T 2 0 1 2 / 1 3 |
n PRIORITY AREA – STABLE AND AFFORDABLE GOVERNMENT
Manitoba uses public revenues effectively and efficiently to deliver affordable government programs and services. Manitoba’s per capita spending growth over the past five years has been the fourth lowest of all provincial governments. Keeping programs affordable is achieved by continuing to improve the way government operates and delivers services.
During these uncertain economic times, the government will continue to carefully manage programs and services to protect the priorities of Manitobans.
Measurable Outcome – Credit Ratings
Manitoba continues to maintain its reputation for fiscal responsibility. The five-year plan includes a strategy to repay debt while restoring balance. The province’s measured approach to paying down debt and the pension liability, while dealing with the needs in health care and other program areas, has been positively acknowledged by credit rating agencies.
This is reflected in the credit rating upgrades Manitoba received from Moody’s Investors Service and by Standard & Poor’s through 2007, and through the reaffirmation of Manitoba’s credit quality by rating agencies in the last four years.
During this period of economic and financial recovery, Manitoba’s stable and diversified economy, strong financial position and commitment to responsible financial management will help ensure a steady credit outlook in 2012. The credit rating agencies have acknowledged the challenging economic conditions facing all Canadian provinces.
The Manitoba government remains committed to maintaining fiscal responsibility to achieve stable or improving credit ratings into the future.
| | | | | | | | | | | | | | |
Credit Rating Agency | | 2006
Actual | | 2007
Actual | | 2008
Actual | | 2009
Actual | | 2010
Actual | | 2011
Actual | | 2012
Actual |
| DBRS | | A(high) | | A(high) | | A(high) | | A(high) | | A(high) | | A(high) | | A(high) |
| Moody’s | | Aa2 | | Aa1 | | Aa1 | | Aa1 | | Aa1 | | Aa1 | | Aa1 |
| Standard & Poor’s | | AA- | | AA-(positive) | | AA | | AA | | AA | | AA | | AA |
NOTE: As at March 31 (end of fiscal year)
|
1 4 / B U D G E T 2 0 1 2 |
Measurable Outcome – Expenditures as a Percentage of Gross Domestic Product (GDP)
Maintaining stable and affordable government means managing the growth in spending to meet increasing demands for quality services. An effective measure of appropriate spending is the ratio of total expenditure as a percentage of GDP. This ratio has remained relatively stable over the last four years and is budgeted to return to a decline in the ratio for Budget 2012.
Expenditure to GDP ratios are reflected in the following table and as part of Appendix 1, Summary Financial Statistics.
| | | | | | | | | | | | | | | | | | | | | | | | | | | | |
| | | 2007/08 | | | 2008/09 | | | 2009/10 | | | 2010/11 | | | 2011/12 | | | 2012/13 | | | 2013/14 | |
| | | Actual | | | Actual | | | Actual | | | Actual | | | Forecast | | | Budget | | | Projection | |
Core Program Expenditure | | | 18.7 | % | | | 18.9 | % | | | 20.0 | % | | | 19.6 | % | | | 20.9 | % | | | 19.2 | % | | | 18.7 | % |
Other Reporting Entities Expenditure | | | 4.0 | % | | | 3.3 | % | | | 3.4 | % | | | 3.8 | % | | | 4.0 | % | | | 3.6 | % | | | 3.4 | % |
Debt Servicing Costs | | | 1.8 | % | | | 1.6 | % | | | 1.5 | % | | | 1.4 | % | | | 1.4 | % | | | 1.4 | % | | | 1.4 | % |
Total Expenditure | | | 24.4 | % | | | 23.8 | % | | | 24.9 | % | | | 24.9 | % | | | 26.3 | % | | | 24.2 | % | | | 23.5 | % |
The Manitoba government’s objective is to maintain a stable or declining ratio over the longer term.
Measurable Outcome – Strengthening the Management of Public Resources
Sound management and use of public resources are key to making government more effective. Government continues to explore ways to make sure that public spending remains under control and that tax dollars are used effectively and efficiently. Strategically managing and prioritizing expenditures, including limiting discretionary operating costs, on a government-wide basis is an ongoing objective. Reforms have been implemented with other reporting entities to better manage public resources, capitalize on synergies and enhance regional capabilities, expertise and talent. A pause in wage increases was successfully negotiated with many parts of the public sector and a cap on administrative costs for regional health authorities was legislated. Last year red-tape reduction measures were introduced for not-for-profit organizations and this year red tape will be cut for small businesses by reducing how often they have to file sales tax.
Budget 2012 continues to move forward with internal review and reform processes to control growth of government expenditures. A program portfolio management review process is being introduced to improve efficiency and effectiveness of government service delivery through reorganization or reallocation of funding within groups of related programs and services to produce better results at a lower cost. Examples of cost cutting reforms already identified for action this year are:
| | • | | reducing the number of regional health authorities; |
| | • | | reducing the number of Crown corporations by merging Manitoba Liquor Control Commission and Manitoba Lotteries Corporation; and |
| | • | | reducing the number of government-appointed agencies, boards and commissions. |
The target for total in-year savings resulting from internal review processes is $128 million, which is about 1% of core government expenditures.
The government will continue to emphasize reforms that improve accountability and transparency and sustainable programs that protect the priorities of Manitobans.
|
B U D G E T 2 0 1 2 / 1 5 |
n PRIORITY AREA – MANAGING DEBT
Over the years, government has continued to implement specific initiatives to ensure sound fiscal management. These include:
| | • | | addressing the unfunded pension liability; |
| | • | | funding the employer’s share of current service pension obligations; |
| | • | | ensuring all capital investments are amortized and all related costs are fully reflected in annual appropriations for core government; and |
| | • | | establishing a plan to address core government deficits during the economic recovery period. |
Solid debt management consists of a plan to repay general purpose debt and eliminate the pension liability, while making needed investments in Manitoba. The net debt to GDP ratio is one of the key indicators used by credit rating agencies in their analysis of provincial governments because it measures the level of debt relative to a province’s financial capacity. Like all other Canadian jurisdictions, the impact of the economic downturn has been an increase in Manitoba’s net debt to GDP ratio, but the five-year plan indicates this ratio returning to a downward trend in 2014/15.
Measurable Outcome – Debt Retirement
This government has contributed almost $1 billion to the debt retirement account for general purpose debt and pension obligations. Direct action to address the unfunded pension liabilities for the Civil Service Superannuation Plan (CSSP) and the Teachers’ Retirement Allowances Fund (TRAF) began in 2007/08 with the province borrowing funds that would be invested by these two pension plans on behalf of the province.
Borrowing funds to pay down the previously unfunded pension liability is a sound fiscal decision, as over the longer term, the cost of borrowing is less than the actuarially determined expected rate of return on the plan assets and the rate of growth in the pension liability.
Since 2000, over $615 million from the annual debt retirement payment has been directed to pension obligations. Net investment earnings in the Pension Asset Fund are projected to be $806 million by March 31, 2013. Combined with the $2.6 billion in new investment provided by the government since 2007, a total of $4.0 billion will have been directed to address the unfunded pension liability by March 31, 2013. In addition, Budget 2012 includes $152 million in core government expenditures for the employer’s share of current service pension obligations.
Capital investment continues to be a priority for government in order to support continued economic growth, reduce the maintenance burden and provide for the services Manitobans need in the future. The cost of these assets is amortized over a set period that represents the useful life of the asset as required by GAAP. The end result is increased infrastructure investment for Manitobans accompanied by a fixed discipline for paying down the associated debt.
The investment in tangible capital assets has increased steadily over the last decade, and with the $1.7 billion investment in Budget 2012, is projected to total $17.2 billion at March 31, 2013, with $7.0 billion of related debt retired through accumulated amortization. The net book value of these assets (cost less accumulated amortization) has more than tripled since 1999/2000 to $10.2 billion.
|
1 6 / B U D G E T 2 0 1 2 |
| | |
Tangible Capital Assets – Net Book Value 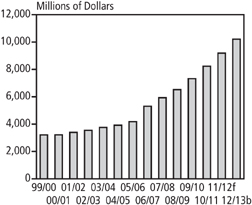
f-Forecast b-Budgeted Source: Manitoba Finance | | Manitoba’s communities and the economy have benefited over the years from the significant investment in public capital assets such as health facilities, universities, colleges and schools, as well as infrastructure assets such as roads, water-control structures and parks. To meet the needs of today’s and future generations, it is necessary to continue to invest in renewal of these assets. The public good provided by these investments is immeasurable. It is estimated that the insured or replacement value of these investments exceeds $38 billion. |
| | Based on projections, core government will have a total of $7.2 billion in capital asset investments at March 31, 2013 and $2.4 billion of related debt will have been retired through accumulated amortization. |
| | A total of $339 million has been included in core government appropriations to retire debt associated with capital investments – $196 million for amortization of department-owned assets and $143 million for principal payments for education and health-related assets. |
After years of surplus, the global economic downturn and the severe flooding in 2011 has had a negative impact on Manitoba’s core government operations. Budget 2010 introduced a five-year plan to stimulate the economy and create jobs, protect key services and return to surplus in 2014/15. In addition, Manitoba’s responsible management of public funds in previous years meant that the FSA had a healthy balance that would be available to mitigate the impact of the short-term deficits that would occur in core government operations.
| | |
Replacement Value of Public Assets1 Per cent of Total 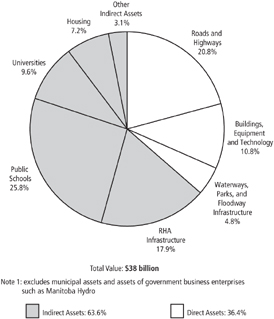
Totals may not add due to rounding. | | Manitoba’s five-year plan incorporates a legislated requirement to dedicate at least $600 million of the balance in the FSA to the amortization of increases in the general purpose debt, including related interest expenses, that are attributable to negative net results incurred during the period of economic recovery. In 2010/11, existing funds in the Debt Retirement Account were withdrawn to repay $145 million of debt and a further $200 million debt repayment was made with withdrawals of $90 million in 2010/11 and $110 million in 2011/12 from the FSA. Budget 2012 provides for an additional debt payment of $140 million, for a total payment of $485 million. With a return to surplus position in Budget 2014, scheduled debt payments for general purpose debt from current resources will resume. |
| | Over the last 11 years, prudent management of public funds has resulted in the actual cumulative total of core government revenue exceeding core government expenditures by over $450 million. Combined with the decisions Manitoba has taken to address the previously unfunded pension liability, budgeting for the employer’s share of current service obligations for all employees, ensuring all capital investments are amortized and all related costs are fully reflected |
|
B U D G E T 2 0 1 2 / 1 7 |
in annual appropriations, and continuing to make debt repayments to mitigate core government operating deficits, Manitoba has a solid debt management plan. This is reflected by the fact that debt servicing costs as a percentage of revenue remains constant. Since 1999/2000, the debt servicing cost rate has dropped by 53%, from 13.2¢ of every dollar of summary revenue collected to a forecasted level of 6.2¢ in Budget 2012.
Although the impact of economic uncertainty has slowed progress, the government remains committed to reducing debt over time with an ultimate goal of eliminating the general purpose debt and the remaining unfunded pension liabilities.
Measurable Outcome – Net Debt to GDP Ratio
Net debt is an important indicator of a government’s financial position as this highlights how government services will remain affordable in the future.
Summary net debt is financial assets (such as cash or investments) minus total liabilities (such as loans or financing). It is the remaining liability that must be financed by future revenues.
| | |
Net debt may grow from time to time, as needed investments in capital assets – like the Red River Floodway, highway infrastructure and economic stimulus investments – are made. These forward-looking investments help support Manitoba’s economy. | | Net Debt to GDP Ratio 
Source: Manitoba Finance |
Therefore, it is important to measure changes in net debt against the growth of the economy, as measured by the nominal GDP. | |
The Manitoba government has seen a substantial downward trend in the net debt to GDP ratio, lowering the ratio to a projected level of 26.1% in 2011/12 from 32.9% in 1999/2000, an improvement of 21%. | |
Manitoba has acknowledged that the net debt to GDP ratio will rise in the short term as the government makes needed investments in infrastructure projects including repairing the damage caused by the 2011 flood and mitigation of the impact of any future floods. In Budget 2012, the net debt to GDP ratio is forecast to increase to 27.4%, with a projected return to a downward trend in 2014/15, as the government remains committed to reducing the net debt to GDP ratio over the longer term. | |
|
1 8 / B U D G E T 2 0 1 2 |
n PRIORITY AREA – INFRASTRUCTURE AND CAPITAL ASSET RENEWAL
Building and upgrading Manitoba’s infrastructure has been a priority for the government since 1999. The government reinforced this priority by announcing a four-year, $4.7 billion economic stimulus investment plan in November 2008 to fund key infrastructure projects across the province. In 2011, Manitoba committed to providing the equivalent of one percentage point of the provincial sales tax to support investment in municipal infrastructure and public transit. This investment grows on the success of Manitoba’s economy. Manitoba has also dedicated the revenue raised through fuel taxes to fund public infrastructure.
Measurable Outcome – Capital Investments
Based on principles of sound financial management, Manitoba has been able to increase the assets of the province, while maintaining a sustainable level of debt. Since 2000, the government has invested $10.2 billion in public capital assets, including $3.4 billion for new or renewed hospitals, universities, colleges and public schools; $3.8 billion to upgrade Manitoba’s roads and highways and $3 billion for the Manitoba Floodway, the modernization and improvement of social housing, improving public service buildings, parks and camping infrastructure.
It is estimated that the insured or replacement value of these investments is more than $38 billion (see chart page 16).
Budget 2012 provides the resources to continue upgrading Manitoba’s roads and highways, wastewater treatment plants, health facilities across the province, building and restoring much needed social housing and modernizing our schools and post-secondary institutions.
Budget 2012 includes capital investment of $1.7 billion to support continued economic growth, reduce the maintenance burden and provide for the services Manitobans need in the future as outlined in the table below.
| | | | |
| | | $ Millions | |
Roads and Highways (including preservation) | | | 580 | |
Universities, Colleges and Public Schools | | | 296 | |
Health Facilities | | | 250 | |
Water Related Infrastructure | | | 59 | |
Housing (including third-party contributions) | | | 284 | |
Assistance to Third Parties | | | 121 | |
Public Service Buildings | | | 80 | |
Parks and Camping Infrastructure | | | 49 | |
| | | | |
| | | 1,719 | |
| | | | |
Manitoba’s commitment to infrastructure investments and renewal of existing assets, while maintaining a fiscally responsible approach to budgeting and debt management, will continue to deliver benefits to Manitobans.
|
B U D G E T 2 0 1 2 / 1 9 |
n PRIORITY AREA – PERFORMANCE MANAGEMENT
Improving the way government measures both financial and non-financial performance outcomes enhances both transparency and accountability. Outcomes-based reporting provides information on the actual impacts, benefits or changes experienced as a result of a program or government service.
Manitoba continues to apply the eight principles established in 2009 to guide measurement and reporting for government departments and major Crown corporations.
1. The organization’s public purpose is explained.
2. The organization’s priorities relate to overall government priorities.
3. Each organizational priority has objectives and actions to achieve them.
4. Measures are developed with outcomes in mind, focusing on a few critical aspects of performance.
5. Financial and non-financial information are linked.
6. The strategic context for the plan and reported results is discussed.
7. Performance information looks forward and backward in time.
8. Information is clear, relevant, credible and balanced.
These principles will help guide the program portfolio management review process for all government departments. This initiative will incorporate and continue to enhance the performance management work initiated in previous years.
Measurable Outcome – Continued Development of Performance Management Capacity
Manitoba is committed to continuing progress on the measurement of performance outcomes with a focus on SMART (specific, measureable, achievable, reliable, time bound) objectives.
Performance management continues to be refined to support management decision-making in the effective use of public funds with planning, measuring, and reporting activities that integrate financial and non-financial information.
In 2012/13 program portfolio management reviews will provide opportunities for collaboration and building capacity. Key performance measures and performance information for government departments and other entities in the GRE will continue to be included in annual reports and other specialized reports.
|
2 0 / B U D G E T 2 0 1 2 |
|
B U D G E T 2 0 1 2 / 2 1 |
APPENDIX 1
MANITOBA SUMMARY FINANCIAL STATISTICS
|
2 2 / B U D G E T 2 0 1 2 |
Manitoba Summary Financial Statistics
| | | | | | | | | | | | | | | | | | | | | | | | |
| | | 2012/13 | | | 2011/12 | | | 2010/11 | | | 2009/10 | | | 2008/09 | | | 2007/08 | |
| | | Budget | | | Forecast | | | Actual | | | Actual | | | Actual | | | Actual | |
SUMMARY FINANCIAL STATEMENTS | | | (Millions of Dollars) | |
Revenue | | | | | | | | | | | | | | | | | | | | | | | | |
Income Taxes | | | 3,202 | | | | 3,141 | | | | 2,922 | | | | 2,659 | | | | 2,841 | | | | 2,652 | |
Other Taxes | | | 3,788 | | | | 3,474 | | | | 3,406 | | | | 3,281 | | | | 3,276 | | | | 3,288 | |
Fees and Other Revenue | | | 2,009 | | | | 1,837 | | | | 1,825 | | | | 1,792 | | | | 1,722 | | | | 1,628 | |
Federal Transfers | | | 3,889 | | | | 4,351 | | | | 4,047 | | | | 3,924 | | | | 3,866 | | | | 3,597 | |
Net Income of Government Business Enterprises | | | 722 | | | | 761 | | | | 775 | | | | 772 | | | | 764 | | | | 947 | |
Sinking Funds and Other Earnings | | | 241 | | | | 245 | | | | 230 | | | | 220 | | | | 296 | | | | 384 | |
| | | | | | | | | | | | | | | | | | | | | | | | |
Total Revenue | | | 13,851 | | | | 13,809 | | | | 13,205 | | | | 12,648 | | | | 12,765 | | | | 12,496 | |
| | | | | | | | | | | | | | | | | | | | | | | | |
Expenditure | | | | | | | | | | | | | | | | | | | | | | | | |
Health and Healthy Living | | | 5,547 | | | | 5,286 | | | | 5,120 | | | | 4,831 | | | | 4,590 | | | | 4,232 | |
Education | | | 3,710 | | | | 3,576 | | | | 3,341 | | | | 3,227 | | | | 3,091 | | | | 3,224 | |
Family Services | | | 1,064 | | | | 1,047 | | | | 1,363 | | | | 1,295 | | | | 1,192 | | | | 1,224 | |
Community, Economic and Resource Development | | | 2,317 | | | | 2,614 | | | | 1,972 | | | | 1,813 | | | | 1,729 | | | | 1,420 | |
Justice and Other Expenditures | | | 928 | | | | 1,666 | | | | 934 | | | | 926 | | | | 882 | | | | 974 | |
Debt Servicing Costs | | | 858 | | | | 813 | | | | 773 | | | | 756 | | | | 830 | | | | 864 | |
| | | | | | | | | | | | | | | | | | | | | | | | |
Total Expenditure | | | 14,424 | | | | 15,002 | | | | 13,503 | | | | 12,848 | | | | 12,314 | | | | 11,938 | |
In-Year Adjustments/Lapse | | | (113 | ) | | | (73 | ) | | | - | | | | - | | | | - | | | | - | |
| | | | | | | | | | | | | | | | | | | | | | | | |
Net Income (Loss) | | | (460 | ) | | | (1,120 | ) | | | (298 | ) | | | (200 | ) | | | 451 | | | | 558 | |
| | | | | | | | | | | | | | | | | | | | | | | | |
Provincial Borrowings, Guarantees & Obligations | | | | | | | | | | | | | | | | | | | | | | | | |
General Government Programs | | | 8,041 | | | | 7,789 | | | | 6,925 | | | | 6,833 | | | | 6,400 | | | | 6,532 | |
General Government Programs - Federal Flood Relief | | | - | | | | 326 | | | | - | | | | - | | | | - | | | | - | |
General Government Programs - Pension Liability | | | 2,595 | | | | 2,595 | | | | 2,355 | | | | 2,175 | | | | 1,850 | | | | 1,500 | |
Manitoba Hydro | | | 9,832 | | | | 9,101 | | | | 8,362 | | | | 7,730 | | | | 7,499 | | | | 6,794 | |
Other Crown Organizations | | | 2,128 | | | | 1,868 | | | | 1,641 | | | | 1,478 | | | | 1,341 | | | | 1,269 | |
Health Facilities | | | 1,283 | | | | 1,074 | | | | 1,015 | | | | 949 | | | | 831 | | | | 833 | |
Other | | | 27 | | | | 41 | | | | 51 | | | | 65 | | | | 78 | | | | 92 | |
Capital Investments | | | 3,750 | | | | 3,183 | | | | 2,546 | | | | 1,846 | | | | 1,411 | | | | 1,084 | |
| | | | | | | | | | | | | | | | | | | | | | | | |
Subtotal | | | 27,656 | | | | 25,977 | | | | 22,895 | | | | 21,076 | | | | 19,410 | | | | 18,104 | |
Other Obligations | | | | | | | | | | | | | | | | | | | | | | | | |
Pension Liability | | | 7,051 | | | | 6,780 | | | | 6,600 | | | | 6,392 | | | | 6,152 | | | | 5,881 | |
Pension Asset Fund | | | (5,166 | ) | | | (5,076 | ) | | | (4,828 | ) | | | (4,592 | ) | | | (4,161 | ) | | | (3,653 | ) |
| | | | | | | | | | | | | | | | | | | | | | | | |
Net Pension Liability | | | 1,885 | | | | 1,704 | | | | 1,772 | | | | 1,800 | | | | 1,991 | | | | 2,228 | |
Debt incurred for and repayable by the Manitoba | | | | | | | | | | | | | | | | | | | | | | | | |
Hydro-Electric Board | | | (9,608 | ) | | | (8,847 | ) | | | (8,199 | ) | | | (7,479 | ) | | | (7,177 | ) | | | (6,449 | ) |
Education and Health Debt held by Government Enterprises | | | 499 | | | | 499 | | | | 471 | | | | 443 | | | | 406 | | | | 416 | |
Other Debt of Crown Organizations | | | 255 | | | | 255 | | | | 263 | | | | 255 | | | | 262 | | | | 252 | |
| | | | | | | | | | | | | | | | | | | | | | | | |
Subtotal | | | (6,969 | ) | | | (6,389 | ) | | | (5,693 | ) | | | (4,981 | ) | | | (4,518 | ) | | | (3,553 | ) |
| | | | | | | | | | | | | | | | | | | | | | | | |
Total Summary Borrowings, Guarantees & Obligations | | | 20,687 | | | | 19,588 | | | | 17,202 | | | | 16,095 | | | | 14,892 | | | | 14,551 | |
| | | | | | | | | | | | | | | | | | | | | | | | |
Adjustments to arrive at Summary Net Debt | | | | | | | | | | | | | | | | | | | | | | | | |
Guarantees | | | (227 | ) | | | (254 | ) | | | (165 | ) | | | (255 | ) | | | (326 | ) | | | (350 | ) |
Net Financial Assets | | | (4,137 | ) | | | (4,490 | ) | | | (4,370 | ) | | | (4,030 | ) | | | (3,086 | ) | | | (3,640 | ) |
| | | | | | | | | | | | | | | | | | | | | | | | |
Summary Net Debt | | | 16,323 | | | | 14,844 | | | | 12,667 | | | | 11,810 | | | | 11,480 | | | | 10,561 | |
| | | | | | | | | | | | | | | | | | | | | | | | |
Summary Net Debt as percentage of GDP | | | 27.4 | | | | 26.1 | | | | 23.3 | | | | 22.9 | | | | 22.2 | | | | 21.6 | |
Numbers may not add due to rounding.
NOTES
•The 2011/12 Forecast has been restated from the Third Quarter Financial Report to be consistent with Budget 2012 presentation.
•Program portfolio management review savings have been allocated to CERD expenses.
•Guarantees reflect only guaranteed balances for Manitoba Hydro Bonds and Manitoba Grow Bonds.
• Borrowings, guarantees and obligations are net of sinking funds.
•Historical results have not been restated to reflect the impact of the 2011/12 reorganization.
|
B U D G E T 2 0 1 2 / 2 3 |
Manitoba Summary Financial Statistics
| | | | | | | | | | | | | | | | | | | | | | | | |
| | | 2012/13 | | | 2011/12 | | | 2010/11 | | | 2009/10 | | | 2008/09 | | | 2007/08 | |
| | | Budget | | | Forecast | | | Actual | | | Actual | | | Actual | | | Actual | |
| | | (Percentage Change) | |
Annual Change | | | | | | | | | | | | | | | | | | | | | | | | |
Income Taxes | | | 1.9 | | | | 7.5 | | | | 9.9 | | | | (6.4 | ) | | | 7.1 | | | | 8.6 | |
Other Taxes | | | 9.0 | | | | 2.0 | | | | 3.8 | | | | 0.2 | | | | (0.4 | ) | | | 5.1 | |
Fees and Other Revenue | | | 9.4 | | | | 0.7 | | | | 1.8 | | | | 4.1 | | | | 5.8 | | | | 9.0 | |
Federal Transfers | | | (10.6 | ) | | | 7.5 | | | | 3.1 | | | | 1.5 | | | | 7.5 | | | | 8.3 | |
Total Revenue | | | 0.3 | | | | 4.6 | | | | 4.4 | | | | (0.9 | ) | | | 2.2 | | | | 9.3 | |
Health and Healthy Living | | | 4.9 | | | | 3.2 | | | | 6.0 | | | | 5.3 | | | | 8.5 | | | | 7.0 | |
Education | | | 3.7 | | | | 7.0 | | | | 3.5 | | | | 4.4 | | | | (4.1 | ) | | | 9.4 | |
Debt Servicing Costs | | | 5.5 | | | | 5.2 | | | | 2.2 | | | | (8.9 | ) | | | (3.9 | ) | | | 9.0 | |
Total Expenditure | | | (3.9 | ) | | | 11.1 | | | | 5.1 | | | | 4.3 | | | | 3.1 | | | | 9.0 | |
Summary Net Debt | | | 10.0 | | | | 17.2 | | | | 7.3 | | | | 2.9 | | | | 8.7 | | | | (2.3 | ) |
| | | (Per cent) | |
Per cent of GDP | | | | | | | | | | | | | | | | | | | | | | | | |
Income Taxes | | | 5.4 | | | | 5.5 | | | | 5.4 | | | | 5.2 | | | | 5.5 | | | | 5.4 | |
Other Taxes | | | 6.4 | | | | 6.1 | | | | 6.3 | | | | 6.4 | | | | 6.3 | | | | 6.7 | |
Fees and Other Revenue | | | 3.4 | | | | 3.2 | | | | 3.4 | | | | 3.5 | | | | 3.3 | | | | 3.3 | |
Federal Transfers | | | 6.5 | | | | 7.6 | | | | 7.5 | | | | 7.6 | | | | 7.5 | | | | 7.4 | |
Total Revenue | | | 23.2 | | | | 24.2 | | | | 24.3 | | | | 24.5 | | | | 24.7 | | | | 25.6 | |
Health and Healthy Living | | | 9.3 | | | | 9.3 | | | | 9.4 | | | | 9.4 | | | | 8.9 | | | | 8.7 | |
Education | | | 6.2 | | | | 6.3 | | | | 6.2 | | | | 6.3 | | | | 6.0 | | | | 6.6 | |
Debt Servicing Costs | | | 1.4 | | | | 1.4 | | | | 1.4 | | | | 1.5 | | | | 1.6 | | | | 1.8 | |
Total Expenditure | | | 24.2 | | | | 26.3 | | | | 24.9 | | | | 24.9 | | | | 23.8 | | | | 24.4 | |
Summary Net Debt | | | 27.4 | | | | 26.1 | | | | 23.3 | | | | 22.9 | | | | 22.2 | | | | 21.6 | |
| | | | | | |
Per cent of Revenue | | | | | | | | | | | | | | | | | | | | | | | | |
Income Taxes | | | 23.1 | | | | 22.7 | | | | 22.1 | | | | 21.0 | | | | 22.3 | | | | 21.2 | |
Other Taxes | | | 27.3 | | | | 25.2 | | | | 25.8 | | | | 25.9 | | | | 25.7 | | | | 26.3 | |
Fees and Other Revenue | | | 14.5 | | | | 13.3 | | | | 13.8 | | | | 14.2 | | | | 13.5 | | | | 13.0 | |
Federal Transfers | | | 28.1 | | | | 31.5 | �� | | | 30.6 | | | | 31.0 | | | | 30.3 | | | | 28.8 | |
Net Income of Government Business Enterprises | | | 5.2 | | | | 5.5 | | | | 5.9 | | | | 6.1 | | | | 6.0 | | | | 7.6 | |
Sinking Funds and Other Earnings | | | 1.7 | | | | 1.8 | | | | 1.7 | | | | 1.7 | | | | 2.3 | | | | 3.1 | |
| | | (Dollars) | |
Dollars Per capita | | | | | | | | | | | | | | | | | | | | | | | | |
Total Revenue | | | 10,927 | | | | 11,042 | | | | 10,697 | | | | 10,374 | | | | 10,589 | | | | 10,469 | |
Total Expenditure | | | 11,379 | | | | 11,996 | | | | 10,938 | | | | 10,538 | | | | 10,215 | | | | 10,002 | |
Debt Servicing Costs | | | 677 | | | | 650 | | | | 626 | | | | 620 | | | | 689 | | | | 724 | |
Summary Net Debt | | | 12,877 | | | | 11,870 | | | | 10,261 | | | | 9,687 | | | | 9,523 | | | | 8,848 | |
Memorandum Items | | | | | | | | | | | | | | | | | | | | | | | | |
Population (000’s) * | | | 1,267.6 | | | | 1,250.6 | | | | 1,234.5 | | | | 1,219.2 | | | | 1,205.5 | | | | 1,193.6 | |
GDP at Market Prices ($M) | | | 59,583 | | | | 56,947 | | | | 54,275 | | | | 51,554 | | | | 51,676 | | | | 48,902 | |
Source: Manitoba Finance
| * | official population July 1 |
|
2 4 / B U D G E T 2 0 1 2 |
Budget Paper B
SUPPLEMENTARY
FINANCIAL INFORMATION

|
SUPPLEMENTARY FINANCIAL INFORMATION |
CONTENTS
| | | | |
SPECIAL ACCOUNTS | | | 1 | |
Fiscal Stabilization Account | | | 1 | |
Debt Retirement Account | | | 2 | |
Pension Assets Fund | | | 2 | |
| |
CAPITAL INVESTMENT | | | 4 | |
| |
CAPITAL INVESTMENT – CORE GOVERNMENT | | | 5 | |
| |
LOAN REQUIREMENTS | | | 6 | |
| |
BORROWING REQUIREMENTS | | | 8 | |
| |
SUMMARY NET DEBT | | | 9 | |
| |
INTERPROVINCIAL COMPARISONS | | | 10 | |
|
B U D G E T 2 0 1 2 S u p p l e m e n t a r y F i n a n c i a l I n f o r m a t i o n / B 1 |
Fiscal Stabilization Account
The Fiscal Stabilization Account (FSA) is projected to have a balance of $525 million as at March 31, 2012, after a draw of $25 million for wait-time reduction and other health-related programming, $8 million related to ecoTrust and $124 million to retire a portion of the borrowings and incremental interest costs incurred during the period of recovery to support core government programs.
The budgeted draw in 2012/13 includes $8 million for health-related programming and $4 million for ecoTrust projects, funds prepaid by Canada in previous years, and $184 million to retire a portion of the borrowings ($140 million) and incremental interest costs ($44 million) for core government in 2012/13.
Fiscal Stabilization Account
Revenue, Expenditure and Balance
Projection as at March 31, 2013 and March 31, 2012
| | | | | | | | | | |
| | | 2012/13
Budget | | | | | 2011/12
Forecast | |
| | | | | | (Millions of Dollars) | | | |
Total Account Balance, Beginning of Year | | | 525 | | | | | | 682 | |
| | | | | | | | | | |
| | | |
Health Programs | | | | | | | | | | |
Balance, Beginning of Year | | | 8 | | | | | | 33 | |
Transfers to the Core Government | | | | | | | | | | |
Wait-Time Reduction Programming and Other Health-Related Programming | | | (8) | | | | | | (25) | |
| | | | | | | | | | |
Balance, End of Year | | | - | | | | | | 8 | |
| | | | | | | | | | |
| | | |
General Programs | | | | | | | | | | |
Balance, Beginning of Year | | | 517 | | | | | | 649 | |
Transfers to the Core Government | | | | | | | | | | |
Debt Repayment and Incremental Debt Servicing Costs | | | (184) | | | | | | (124) | |
ecoTrust | | | (4) | | | | | | (8) | |
| | | | | | | | | | |
Balance, End of Year | | | 329 | | | | | | 517 | |
| | | | | | | | | | |
| | | |
Total Account Balance, End of Year | | | 329 | | | | | | 525 | |
| | | | | | | | | | |
|
B 2 / S u p p l e m e n t a r y F i n a n c i a l I n f o r m a t i o n B U D G E T 2 0 1 2 |
Debt Retirement Account
In 2010/11 the entire balance of $145 million of the Debt Retirement Account was utilized to repay general purpose debt as part of Manitoba’s five-year plan.
Pension Assets Fund
The province changed the trust conditions of the funds held in the Pension Asset Fund to clarify that these funds are irrevocably restricted for pension purposes only. Net investment earnings of pension assets include the expected rate of return during the year as well as adjustments to market related value. Market fluctuations of pension assets are not recorded in the year in which they occur, but are recognized over the employee average remaining service life.
The Fund increased as a result of the government’s new investment of $240 million in 2011/12 to continue addressing the province’s unfunded liability for the Civil Service Superannuation Fund. Since 2000, the government has provided $4.0 billion to address the province’s unfunded pension liabilities.
The Fund is expected to have a balance of $3,485 million by the end of the 2012/13 fiscal year.
Pension Assets Fund
Projection as at March 31, 2013 and March 31, 2012
| | | | | | | | | | |
| | | 2012/13
Budget | | | | | 2011/12
Forecast | |
| | | | | | (Millions of Dollars) | | | |
Balance, Beginning of Year | | | 3,383 | | | | | | 3,174 | |
| | | | | | | | | | |
| | | |
Contributions and Revenue | | | | | | | | | | |
New Investment | | | - | | | | | | 240 | |
Net Investment Earnings | | | 212 | | | | | | 84 | |
Departments and Crown Corporations | | | 149 | | | | | | 139 | |
| | | | | | | | | | |
| | | |
| | | 361 | | | | | | 463 | |
| | | | | | | | | | |
Transfers | | | | | | | | | | |
TRAF and CSSF Payments | | | (259) | | | | | | (254) | |
| | | | | | | | | | |
| | | |
Balance, End of Year | | | 3,485 | | | | | | 3,383 | |
| | | | | | | | | | |
|
B U D G E T 2 0 1 2 S u p p l e m e n t a r y F i n a n c i a l I n f o r m a t i o n / B 3 |
SUMMARY OF ACCOUNT/FUND ACTIVITY
| | | | | | | | | | | | | | | | | | | | | | | | | | | | | | | | | | | | | | | | | | | | | | | | | | | | | | | | |
| | | 12/13 | | | 11/12 | | | 10/11 | | | 09/10 | | | 08/09 | | | 07/08 | | | 06/07 | | | 05/06 | | | 04/05 | | | 03/04 | | | 02/03 | | | 01/02 | | | 00/01 | | | 99/00 | |
| | | Budget | | | Forecast | | | Actual | | | Actual | | | Actual | | | Actual | | | Actual | | | Actual | | | Actual | | | Actual | | | Actual | | | Actual | | | Actual | | | Actual | |
| | | (Millions of Dollars) | |
Fiscal Stabilization Account | | | | | | | | | | | | | | | | | | | | | | | | | | | | | | | | | | | | | | | | | | | | | | | | | | | | | | | | |
| | | | | | | | | | | | | | |
Transfers to Account | | | - | | | | - | | | | - | | | | - | | | | 30 | | | | 128 | | | | 110 | | | | 31 | | | | 405 | | | | 13 | | | | 4 | | | | 63 | | | | 40 | | | | 11 | |
| | | | | | | | | | | | | | |
Transfers from Account | | | (196 | ) | | | (157 | ) | | | (125 | ) | | | (57 | ) | | | - | | | | - | | | | - | | | | - | | | | - | | | | (171 | ) | | | (22 | ) | | | (150 | ) | | | - | | | | (185 | ) |
| | | | | | | | | | | | | | |
Investment Revenue | | | - | | | | - | | | | - | | | | - | | | | 16 | | | | 27 | | | | 21 | | | | 15 | | | | 2 | | | | 1 | | | | 7 | | | | 14 | | | | 15 | | | | 12 | |
| | | | | | | | | | | | | | |
Balance, End of Year | | | 329 | | | | 525 | | | | 682 | | | | 807 | | | | 864 | | | | 818 | | | | 663 | | | | 532 | | | | 486 | | | | 79 | | | | 236 | | | | 247 | | | | 320 | | | | 265 | |
| | | | | | | | | | | | | | |
Debt Retirement Account | | | | | | | | | | | | | | | | | | | | | | | | | | | | | | | | | | | | | | | | | | | | | | | | | | | | | | | | |
| | | | | | | | | | | | | | |
Contribution | | | - | | | | - | | | | - | | | | 20 | | | | 110 | | | | 110 | | | | 110 | | | | 110 | | | | 99 | | | | 96 | | | | 96 | | | | 96 | | | | 96 | | | | 75 | |
| | | | | | | | | | | | | | |
Interest Earnings | | | - | | | | - | | | | - | | | | 1 | | | | 1 | | | | 2 | | | | 1 | | | | - | | | | 2 | | | | 7 | | | | 3 | | | | 5 | | | | - | | | | - | |
| | | | | | | | | | | | | | |
Transfers to Pension Assets Fund | | | - | | | | - | | | | - | | | | (10 | ) | | | (55 | ) | | | (85 | ) | | | (85 | ) | | | (85 | ) | | | (79 | ) | | | (75 | ) | | | (48 | ) | | | (75 | ) | | | (21 | ) | | | - | |
| | | | | | | | | | | | | | |
Transfers for General Purpose | | | - | | | | - | | | | (145 | ) | | | - | | | | - | | | | - | | | | - | | | | - | | | | (202 | ) | | | - | | | | - | | | | - | | | | - | | | | (305 | ) |
| | | | | | | | | | | | | | |
Debt Reduction | | | | | | | | | | | | | | | | | | | | | | | | | | | | | | | | | | | | | | | | | | | | | | | | | | | | | | | | |
| | | | | | | | | | | | | | |
Balance, End of Year | | | - | | | | - | | | | - | | | | 145 | | | | 134 | | | | 78 | | | | 51 | | | | 25 | | | | - | | | | 180 | | | | 152 | | | | 101 | | | | 75 | | | | - | |
| | | | | | | | | | | | | | |
Pension Assets Fund | | | | | | | | | | | | | | | | | | | | | | | | | | | | | | | | | | | | | | | | | | | | | | | | | | | | | | | | |
| | | | | | | | | | | | | | |
Transfers from Debt Retirement | | | - | | | | - | | | | - | | | | 10 | | | | 55 | | | | 85 | | | | 85 | | | | 85 | | | | 79 | | | | 75 | | | | 48 | | | | 75 | | | | 21 | | | | | |
| | | | | | | | | | | | | | |
Account | | | | | | | | | | | | | | | | | | | | | | | | | | | | | | | | | | | | | | | | | | | | | | | | | | | | | | | | |
| | | | | | | | | | | | | | |
Net Investment Earnings | | | 212 | | | | 84 | | | | 100 | | | | 160 | | | | 41 | | | | 16 | | | | 67 | | | | 61 | | | | 31 | | | | 38 | | | | (6 | ) | | | 2 | | | | - | | | | | |
| | | | | | | | | | | | | | |
Net Current Service Contributions | | | (110 | ) | | | (115 | ) | | | (114 | ) | | | (100 | ) | | | (80 | ) | | | (60 | ) | | | 10 | | | | 8 | | | | 6 | | | | 3 | | | | 2 | | | | 9 | | | | - | | | | | |
| | | | | | | | | | | | | | |
TRAF/CSSF Funding | | | - | | | | 240 | | | | 180 | | | | 330 | | | | 350 | | | | 1,502 | | | | | | | | | | | | | | | | | | | | | | | | | | | | | | | | | |
| | | | | | | | | | | | | | |
Balance, End of Year | | | 3,485 | | | | 3,383 | | | | 3,174 | | | | 3,008 | | | | 2,608 | | | | 2,242 | | | | 699 | | | | 537 | | | | 383 | | | | 267 | | | | 151 | | | | 107 | | | | 21 | | | | | |
|
B 4 / S u p p l e m e n t a r y F i n a n c i a l I n f o r m a t i o n B U D G E T 2 0 1 2 |
Capital investment continues to be a priority for government, with the cost of these assets amortized over a set period that represents the useful life of the asset as required by GAAP. These set periods result in regular repayment of debt. The end result is increased infrastructure investment for Manitobans, while spreading the cost of those assets over their useful life, a strategy which includes a plan to pay the debt. The net book value of these assets (cost less accumulated amortization) has almost tripled since 1999/2000 and is a major asset of the province in providing services to Manitobans into the future.
The investment in tangible capital assets is projected to be $17.2 billion as of March 31, 2013, with $7.0 billion of related debt having been retired through accumulated amortization. Core government will have a total of $7.2 billion in capital asset investments as of March 31, 2013 and $2.4 billion of related debt will have been retired through accumulated amortization.
Tangible Capital Assets —
Net Book Value
f - Forecast b - Budgeted
Source: Manitoba Finance
|
B U D G E T 2 0 1 2 S u p p l e m e n t a r y F i n a n c i a l I n f o r m a t i o n / B 5 |
| ¢ | CAPITAL INVESTMENT – CORE GOVERNMENT |
Provincially owned capital assets such as highways, waterways, buildings, machinery and computer systems are amortized over their useful life based on established guidelines for amortization (see Appendix B of the 2012/13 Estimates of Expenditure). The amortization and interest costs are borne by departments that are responsible for each asset and are reflected as annual costs related to capital assets. In total, costs related to capital assets are estimated at $382 million in 2012/13, an increase of $63 million from 2011/12. In 2012/13, departmental appropriations include $196 million for amortization and $186 million for allocation of interest.
Authority for the annual cost to acquire provincially owned assets is reflected as Part B – Capital Investment which totals $751 million in 2012/13, a decrease of $57 million from 2011/12.
Capital Investment, 2012/13
(Thousands of Dollars)
| | | | | | | | | | |
| | | 2012/13 | | | | | 2011/12 | |
| | | Budget | | | | | Budget* | |
General Assets | | | | | | | | | | |
Government Services Capital Projects | | | 128,346 | | | | | | 147,336 | |
Transportation Equipment and Aircraft | | | 42,164 | | | | | | 76,403 | |
Information Technology Projects | | | | | | | | | | |
Corporate Information Technology Projects | | | 21,558 | | | | | | 23,297 | |
Advanced Education and Literacy | | | 500 | | | | | | 1,132 | |
Entrepreneurship, Training and Trade | | | - | | | | | | 2,829 | |
Family Services and Labour | | | - | | | | | | 360 | |
Finance | | | 500 | | | | | | - | |
Health | | | 928 | | | | | | 175 | |
Justice | | | 413 | | | | | | 300 | |
Other Equipment and Buildings | | | 51,056 | | | | | | 14,178 | |
| | | | | | | | | | |
| | | |
| | | 245,465 | | | | | | 266,010 | |
| | | | | | | | | | |
Infrastructure Assets | | | | | | | | | | |
Provincial Roads, Highways and Airport Infrastructure | | | 432,045 | | | | | | 426,133 | |
Water Related Infrastructure | | | 47,800 | | | | | | 99,150 | |
Parks, Cottage and Camping Projects | | | 25,600 | | | | | | 16,757 | |
| | | | | | | | | | |
| | | 505,445 | | | | | | 542,040 | |
| | | | | | | | | | |
| | | |
Total Capital Investment | | | 750,910 | | | | | | 808,050 | |
| | | | | | | | | | |
*The 2011/12 Budget has been restated to be consistent with the 2012/13 Budget presentation.
|
B 6 / S u p p l e m e n t a r y F i n a n c i a l I n f o r m a t i o n B U D G E T 2 0 1 2 |
The Loan Act 2012 provides borrowing and expenditure authority and, in some cases, guarantee authority for the government and its agencies to undertake self-sustaining programs, where self-sustaining means having the ability for repayment. This authority is in addition to that voted in the printed estimates review.
Incremental Capital Authority Requirements for Non-Budgetary Programs, 2012/13
(Thousands of Dollars)
| | | | |
| The Loan Act, 2012 | | | |
The Manitoba Hydro-Electric Board | | $ | 1,490,000 | |
Manitoba Agricultural Services Corporation | | | 225,526 | |
The Manitoba Lotteries Corporation | | | 177,800 | |
Manitoba Housing and Renewal Corporation | | | 167,069 | |
Health Capital Program | | | 125,000 | |
Post-Secondary Institutions | | | 86,005 | |
Manitoba Opportunities Fund Ltd. | | | 38,726 | |
Business Support | | | 28,524 | |
Manitoba Student Aid Program | | | 19,098 | |
Special Operating Agencies Financing Authority - Vehicles and Equipment Management Agency | | | 19,000 | |
The Manitoba Water Services Board | | | 17,590 | |
Diagnostic Services Manitoba | | | 10,012 | |
Northern Affairs Communities | | | 9,659 | |
Cottage Lots Development | | | 6,971 | |
Communities Economic Development Fund | | | 6,800 | |
Special Operating Agencies Financing Authority - The Property Registry | | | 3,600 | |
Co-operative Loans and Loan Guarantee Board | | | 1,500 | |
Special Operating Agencies Financing Authority - Pineland Forest Nursery | | | 156 | |
Manitoba Film Guarantee Program | | | 29 | |
| | | | |
| | $ | 2,433,065 | |
| | | | |
|
B U D G E T 2 0 1 2 S u p p l e m e n t a r y F i n a n c i a l I n f o r m a t i o n / B 7 |
Non-Budgetary Capital Program, 2012/13
(Thousands of Dollars)
| | | | |
The Manitoba Hydro-Electric Board | | $ | 1,312,000 | |
Manitoba Housing and Renewal Corporation | | | 477,026 | |
The Manitoba Lotteries Corporation | | | 241,200 | |
Manitoba Agricultural Services Corporation | | | 226,450 | |
Health Capital Program | | | 197,609 | |
Post-Secondary Institutions | | | 193,264 | |
Manitoba Opportunities Fund Ltd. | | | 58,848 | |
Business Support (including Manitoba Industrial Opportunities Program) | | | 47,400 | |
Special Operating Agencies Financing Authority - Vehicles and Equipment Management Agency | | | 37,086 | |
Manitoba Student Aid Program | | | 36,820 | |
The Manitoba Water Services Board | | | 33,829 | |
Diagnostic Services Manitoba | | | 26,142 | |
Northern Affairs Communities | | | 20,293 | |
Miscellaneous Corporations, Agencies and Other Programs | | | 25,105 | |
| | | | |
| | $ | 2,933,072 | |
| | | | |
|
B 8 / S u p p l e m e n t a r y F i n a n c i a l I n f o r m a t i o n B U D G E T 2 0 1 2 |
Manitoba’s borrowing requirements in respect of both general and self-sustaining borrowings are estimated to total $3.7 billion in 2012/13, of which $2 billion is required for refinancing purposes. New cash requirements, net of estimated repayments, are $1.7 billion, which includes requirements for general government purposes, capital investments by departments and Manitoba Hydro. Estimated repayments are for general purpose borrowings, capital investment assets and health facilities. The Loan Act, 2012, provides incremental capital authority of $2.4 billion.
Borrowing Requirements 2012/13
(Thousands of Dollars)
| | | | | | | | | | | | | | | | |
| | | Refinancing | | | New Cash
Requirements | | | Estimated
Repayments | | | Borrowing
Requirements | |
Government Business Enterprises | | | | | | | | | | | | | | | | |
Manitoba Hydro | | | 557,000 | | | | 947,000 | | | | - | | | | 1,504,000 | |
Manitoba Lotteries Corporation | | | - | | | | 75,000 | | | | 7,000 | | | | 68,000 | |
| | | | | | | | | | | | | | | | |
Subtotal | | | 557,000 | | | | 1,022,000 | | | | 7,000 | | | | 1,572,000 | |
| | | | | | | | | | | | | | | | |
| | | | |
Other Borrowings | | | | | | | | | | | | | | | | |
General Purpose Borrowings | | | 534,037 | | | | 448,000 | | | | 521,000 | | | | 461,037 | |
Capital Investment Assets | | | 583,224 | | | | 750,910 | | | | 195,773 | | | | 1,138,361 | |
Health Facilities | | | - | | | | 180,000 | | | | 88,499 | | | | 91,501 | |
Post-Secondary Institutions | | | - | | | | 60,000 | | | | - | | | | 60,000 | |
Other Crowns and Organizations | | | 273,373 | | | | 75,000 | | | | - | | | | 348,373 | |
| | | | | | | | | | | | | | | | |
Subtotal | | | 1,390,634 | | | | 1,513,910 | | | | 805,272 | | | | 2,099,272 | |
| | | | | | | | | | | | | | | | |
| | | | |
Total Borrowing Requirements | | | 1,947,634 | | | | 2,535,910 | | | | 812,272 | | | | 3,671,272 | |
| | | | | | | | | | | | | | | | |
|
B U D G E T 2 0 1 2 S u p p l e m e n t a r y F i n a n c i a l I n f o r m a t i o n / B 9 |
Changes in Summary Net Debt
(Millions of Dollars)
| | | | |
2011/12 Summary Net Debt (Forecast) | | | 14,844 | |
| |
Net Investment in Tangible Capital Assets | | | | |
| |
Core Government | | | 555 | |
Other Reporting Entities | | | 464 | |
| | | | |
| | | 1,019 | |
| | | | |
Plus: Projected (Income) Loss for the Year | | | | |
| |
Core Government | | | 448 | |
Other Reporting Entities | | | 12 | |
| | | | |
| | | 460 | |
| | | | |
| |
Change in Net Debt | | | 1,479 | |
| | | | |
| |
2012/13 Summary Net Debt (Budget) | | | 16,323 | |
| | | | |
In Budget 2012, the net debt to GDP ratio is forecast to be 27.4%. Net debt is an important indicator of a government’s financial position as this highlights the affordability of future government service. Summary net debt represents the difference between the GREs’ total liabilities, such as borrowing and financing, less its financial assets* – it reflects the residual liability that must be financed by future revenues. Net debt may grow in absolute terms from time to time, as needed investments in capital assets are made. These investments underpin and support Manitoba’s economic performance. It is important to measure changes in net debt against the growth of the economy, as measured by the nominal GDP.
* Financial assets are liquid assets such as cash, investments, loans and accounts receivable that could be readily converted to cash.
|
B 10 / S u p p l e m e n t a r y F i n a n c i a l I n f o r m a t i o n B U D G E T 2 0 1 2 |
| ¢ | INTERPROVINCIAL COMPARISONS |
| | |
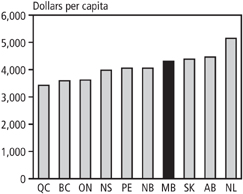
Provincial Expenditure Per Capita Increase, 2006/07 to 2011/12f | | Net Debt to GDP Ratio by Province, 2011/12f |
f – Forecast Source: Provincial fiscal documents | | 
f – Forecast Note: No projection from PE Source: Provincial fiscal documents |
| |
Provincial Government Expenditure on Health, 2010/11f | | Major Federal Cash Transfers, Change from 1999/00 to 2012/13 |
f – Forecast Source: Canadian Institute for Health Information | | 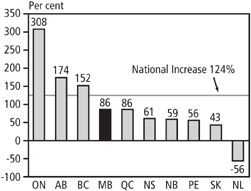
Note: Includes Offshore Accord, Total Transfer Protection and cumulative best-of payments Source: Finance Canada |
Budget Paper C
TAXATION ADJUSTMENTS
INCLUDES
THE MANITOBA ADVANTAGE
CONTENTS
| | | | |
SUMMARY OF 2012 TAX MEASURES | | | 1 | |
| |
PERSONAL MEASURES | | | 2 | |
Dividend Tax Credit | | | 2 | |
| |
HEALTH AND ENVIRONMENTAL MEASURES | | | 2 | |
Tobacco Tax | | | 2 | |
Fuel Tax | | | 2 | |
Nutrient Management Tax Credit | | | 3 | |
| |
BUSINESS MEASURES | | | 4 | |
Data Processing Investment Tax Credit | | | 4 | |
Film and Video Production Tax Credit | | | 4 | |
Co-op Education and Apprenticeship Tax Credits | | | 4 | |
Corporation Capital Tax on Financial Institutions | | | 5 | |
| |
SALES TAX MEASURES | | | 6 | |
| |
TECHNICAL AND ADMINISTRATIVE MEASURES | | | 6 | |
| |
CONTACTS FOR FURTHER INFORMATION | | | 7 | |
| |
PERSONAL TAX SAVINGS SINCE 1999 | | | 8 | |
| |
MANITOBA INCOME TAX SAVINGS FOR TYPICAL TAXPAYERS | | | 10 | |
| |
MANITOBA INCOME TAX SINCE 1999 | | | 11 | |
| |
2012 INTERPROVINCIAL COMPARISON OF TAX RATES | | | 12 | |
| |
FEDERAL AND MANITOBA INCOME TAX RATES, 2012 | | | 12 | |
| |
Appendix 1: MANITOBA TAX EXPENDITURES, 2011/12 | | | 14 | |
| |
Appendix 2: THE MANITOBA ADVANTAGE | | | 19 | |
| |
Appendix 3: MANITOBA’S COMPETITIVE ENVIRONMENT FOR MANUFACTURING | | | 30 | |
| |
CONCLUSION | | | 34 | |
|
B U D G E T 2 0 1 2 T a x a t i o n A d j u s t m e n t s / C 1 |
¢ SUMMARY OF 2012 TAX MEASURES
A negative amount represents a tax reduction.
| | | | | | | | |
| | | 2012/13 | | | Full Year | |
| | | | |
| | | (Millions of Dollars) | |
Ongoing Reductions (1) | | | | | | | | |
Personal Tax reductions | | | -27.5 | | | | -47.0 | |
Business Tax reductions | | | -6.0 | | | | -6.0 | |
| | | | | | | | |
| | | -33.5 | | | | -53.0 | |
Personal Measures | | | | | | | | |
Dividend Tax Credit reduced | | | 16.9 | | | | 13.5 | |
| | | | | | | | |
| | | 16.9 | | | | 13.5 | |
Health and Environmental Measures | | | | | | | | |
Tobacco Tax increased | | | 9.7 | | | | 10.0 | |
Fuel Tax increased | | | 44.5 | | | | 48.6 | |
Nutrient Management Tax Credit introduced | | | -0.1 | | | | -0.3 | |
| | | | | | | | |
| | | 54.1 | | | | 58.3 | |
Business Measures | | | | | | | | |
Data Processing Investment Tax Credit introduced | | | - | | | | - | |
Film and Video Production Tax Credit enhanced | | | - | | | | -0.1 | |
Co-op Education and Apprenticeship Tax Credit enhanced | | | -0.3 | | | | -8.0 | |
Corporation Capital Tax on Financial Institutions increased | | | 17.4 | | | | 11.6 | |
| | | | | | | | |
| | | 17.1 | | | | 3.5 | |
| | |
Sales Tax Measures | | | 95.5 | | | | 106.5 | |
| | |
Technical and Administrative Amendments | | | 0.4 | | | | 0.5 | |
| | |
Total Changes, 2012 Budget | | | 184.1 | | | | 182.3 | |
| | |
Total Changes, including Ongoing Tax Reductions | | | 150.6 | | | | 129.3 | |
| 1 | Tax reductions previously announced that take effect after 2011: |
| | - | increased seniors’ Education Property Tax Credit |
| | - | increased basic personal amount, spousal amount and eligible dependent amount |
| | - | increased take-up in Tuition Fee Income Tax Rebate |
| | - | enhanced R&D Tax Credit refundability |
|
C 2 / T a x a t i o n A d j u s t m e n t s B U D G E T 2 0 1 2 |
¢ PERSONAL MEASURES
Dividend Tax Credit
(2012/13 revenue impact: +$16.9 million)
The Dividend Tax Credit on eligible dividends paid to shareholders by companies subject to the general corporation income tax rate will be decreased from 11% to 8%, commencing with the 2012 taxation year.
The estimated additional full-year revenue is $13.5 million.
For more information, please contact Location A, page C7.
¢ HEALTH AND ENVIRONMENTAL MEASURES
Tobacco Tax
(2012/13 revenue impact: +$9.7 million)
The Tobacco Tax rate is increased effective midnight, April 17, 2012. The rate per cigarette will increase from 22.5¢ to 25.0¢; the rate on fine-cut tobacco will increase from 21.5¢ to 24.0¢ per gram; and the rate on raw leaf tobacco will increase from 20.0¢ to 22.5¢ per gram.
The estimated additional full-year revenue is $10.0 million.
For more information, please contact Location C, page C7.
Fuel Tax
(2012/13 revenue impact: +$44.5 million)
The fuel tax rate on unmarked gasoline and diesel fuel will increase from 11.5¢ per litre to 14.0¢, effective May 1, 2012. The 11.5¢ rate had been in effect since 1993 for gasoline and since 2004 for diesel fuel.
Marked gasoline will be subject to a 3.0¢ per litre fuel tax rate, effective May 1, 2012. The estimated additional full-year revenue is $48.6 million.
For more information, please contact Location C, page C7.
|
B U D G E T 2 0 1 2 T a x a t i o n A d j u s t m e n t s / C 3 |
Nutrient Management Tax Credit
(2012/13 revenue impact: -$0.1 million)
Agricultural producers will be eligible for a new, refundable Nutrient Management Tax Credit. This income tax credit is one component of the Manitoba Government’s strategy to facilitate implementation of amendments to The Environment Act introduced in The Save Lake Winnipeg Act. The credit will be equal to 10% of the capital cost of prescribed nutrient management equipment that is designed to meet water quality requirements. The assets must be acquired and available for use after April 17, 2012 and before 2016.
Capital investments that qualify for the credit are environmentally sound systems installed for use in Manitoba that reduce the risk of nutrient transport to water and help to improve the water quality of Lake Winnipeg. These will include: solid-liquid separation systems, anaerobic digesters, gravity settling tanks, manure treatment systems, and manure composting facilities. Also included are storage tanks suitable for winter manure storage by operators with fewer than 300 animal units.
The costs associated with electrical installations, plumbing, pumps, piping and groundwork required for the installation of the eligible systems are included in the capital cost for purposes of calculating the tax credit. Costs incurred and paid to acquire the system and make it operational are also included, such as engineering, design and installation costs. Borrowing costs are not eligible, and tax creditable capital costs will be net of any government assistance received or receivable on the eligible investment.
Both agribusiness corporations with a permanent establishment in Manitoba, and unincorporated individuals engaged in farming who are residents of Manitoba, are eligible for this support. Where the agricultural operations are owned by a partnership, the total tax credit will be allocated among those partners who reside in Manitoba.
The estimated full-year tax saving for agricultural producers is $0.3 million.
For more information, please contact Location A, page C7.
|
C 4 / T a x a t i o n A d j u s t m e n t s B U D G E T 2 0 1 2 |
¢ BUSINESS MEASURES
Data Processing Investment Tax Credit
(2012/13 revenue impact: not applicable)
In order to position Manitoba as a high technology data processing centre investment location, a refundable corporation income tax credit will be established for property purchased or leased by an eligible corporation after April 17, 2012 for use in Manitoba. The corporation must have a permanent establishment in Manitoba and its primary business activity, including the activities of its affiliates, must be data processing.
The tax credit will be equal to 4% on the capital cost of new qualified property that is a building and 7% on the capital cost of new qualified property that is machinery or equipment. The property must be purchased or leased by the company for use in its data processing centre in Manitoba and be available for use after April 17, 2012 and before 2016. New qualified property that is purchased or leased to replace or improve property that previously qualified for the tax credit will also be eligible for the tax credit.
The tax credit will effectively offset Manitoba sales tax on the qualified property.
For more information, please contact Location A, page C7.
Film and Video Production Tax Credit
(2012/13 revenue impact: negligible)
Companies starting a film or video production after April 17, 2012 will be able to claim accommodation costs incurred and paid up to $250 per night per unit as eligible tangible property expenditures for purposes of calculating the cost-of-production tax credit.
The estimated full-year tax saving for film and video producers is $0.1 million.
For more information, please contact Location A, page C7.
Co-op Education and Apprenticeship Tax Credits
(2012/13 revenue impact: -$0.3 million)
To enhance support for hiring apprentices and journeypersons, particularly early-level apprentices outside Winnipeg, three components of the Co-op Education and Apprenticeship Tax Credits will be enhanced.
| | • | | The Early-Level Apprentice Hiring Incentive (currently 10% of wages and salaries up to a maximum of $2,000 per year per apprentice) is enhanced to 15% of wages and salaries up to a maximum of $3,000. This component of the program is also expanded to cover employers eligible for the federal Apprenticeship Job Creation Tax Credit, who will receive a top-up to be treated consistently with other Manitoba tax credit recipients. |
| | • | | The Advanced-Level Apprentice Hiring Incentive (currently 5% of wages and salaries up to a maximum of $2,500 per level per employee) is doubled to 10% of wages and salaries up to a maximum of $5,000. |
| | • | | The Journeypersons Hiring Incentive (currently 5% of wages and salaries up to a maximum of $2,500 per year per employee) is also doubled to 10% of wages and salaries up to a maximum of $5,000. |
|
B U D G E T 2 0 1 2 T a x a t i o n A d j u s t m e n t s / C 5 |
These enhancements are available to employers of apprentices who complete a level after 2012, and employers of journeypersons who become newly certified after 2012. The tax credit is calculated based on wages and salaries paid to qualified employees, net of any support from government or a public authority.
The enhancements are part of a new, more comprehensive government initiative to support apprenticeship, which includes a Rural and Northern Apprenticeship Strategy. Under this strategy, an additional 5% tax credit will be available for employers who hire early-level apprentices who normally reside outside of Winnipeg and who normally report to an employer’s office in rural and northern Manitoba.
| | | | | | |
| | | Improvements to Apprenticeship and Journeyperson Tax Credits |
| | | Level 1 and 2
Apprentices | | Level 3, 4 & 5
Apprentices | | Newly Certified
Journeypersons |
Current | | | | | | |
Tax Credit | | 10% | | 5% | | 5% |
Maximum Credit | | $2,000 | | $2,500 | | $2,500 |
| | | |
Budget 2012 | | | | | | |
Winnipeg | | | | | | |
Tax Credit | | 15% | | 10% | | 10% |
Maximum Credit | | $3,000 | | $5,000 | | $5,000 |
| | | |
Rural/Northern | | | | | | |
Tax Credit | | 20% | | 10% | | 10% |
Maximum Credit | | $4,000 | | $5,000 | | $5,000 |
All components of the tax credit are fully refundable. Eligible employers include taxable corporations or exempt corporate entities (including not-for-profit agencies, Manitoba Crown entities, municipalities, universities, schools and hospitals). Unincorporated employers may claim the refundable credit on their individual income tax return.
The estimated full-year tax saving to employers from these enhancements is $8.0 million.
For more information, please contact Location B, page C7.
Corporation Capital Tax on Financial Institutions
(2012/13 revenue impact: +$17.4 million)
The 3% Corporation Capital Tax on Financial Institutions is increased to 4%, commencing with taxation years ending after April 17, 2012.
The estimated additional full-year revenue is $11.6 million.
For more information, please contact Location C, page C7.
|
C 6 / T a x a t i o n A d j u s t m e n t s B U D G E T 2 0 1 2 |
n SALES TAX MEASURES
(2012/13 revenue impact: +$95.5 million)
The following personal services will be taxable, effective July 1, 2012: spa treatments, non-medical skin and nail services (such as pedicures, manicures and facials), hair services (including haircuts, hairstyling, hair removal and augmentation), tattooing and piercing. No sales tax will apply to haircuts costing less than $50.
Sales tax will be applied to prescribed insurance premiums under a contract of insurance, effective July 1, 2012, other than for health, accident or sickness, Autopac, or individual life insurance. This includes property and casualty insurance, group life insurance, trip cancellation insurance, baggage insurance, and land titles insurance. The tax will apply where the insured is a person resident in Manitoba or the premiums are paid in respect of property located in Manitoba.
The estimated additional full-year revenue from these sales tax measures is +$106.5 million.
For more information, please contact Location C, page C7.
n TECHNICAL AND ADMINISTRATIVE MEASURES
(2012/13 revenue impact: +$0.4 million)
Technical amendments will be made to the Mineral Exploration Tax Credit to ensure it operates as intended, including where credits earned in a higher tax credit year are carried back to a year where lower tax credits were provided.
Now that several residential properties have been designated for tax increment financing, the Community Revitalization Levy paid by residents will be eligible for the Education Property Tax Credit.
To encourage improved tax remittance compliance, the interest rate on tax debts owing under provincially administered taxes and refundable Manitoba personal income tax credits will increase from the prime interest rate plus four percentage points to the prime interest rate plus six percentage points, effective on accounts receivable starting July 1, 2012. The fee for dishonoured taxation payments under provincially administered taxes will be increased from $20 to $25.
The following changes will be made to the Retail Sales Tax.
| | • | | To reduce tax administration costs for businesses, the tax return filing frequency will be reduced, allowing 17,000 businesses to file their sales tax returns less often. |
| | • | | The existing formula regarding the application of sales tax on the taxable use of demonstrator vehicles will be updated. |
| | • | | The fee for dishonoured taxation payments will be updated to reflect increased costs – an increase of $5.00 per item. |
The Neighbourhoods Alive! Tax Credit will be amended, retroactive to April 12, 2011 when the credit began, as follows:
| | • | | allowing a corporation up to four years to achieve the minimum $50,000 donation threshold; |
| | • | | allowing a corporation to make an up-front donation of up to $200,000 in the first year, and provide in-kind service contributions to earn the maximum credit in each of the subsequent four tax years; and |
| | • | | limiting in-kind contributions to earn the credit to the first five years of the social enterprise. |
Enhanced enforcement measures respecting Tobacco Tax and other taxes will be implemented under The Tax Administration and Miscellaneous Taxes Act.
The estimated additional full-year revenue from these technical and administrative measures is $0.5 million.
For more information, please contact Location A, B or C, page C7.
|
B U D G E T 2 0 1 2 T a x a t i o n A d j u s t m e n t s / C 7 |
n CONTACTS FOR FURTHER INFORMATION
| | | | | | |
A | | Taxation, Economic and | | Telephone: | | 204-945-3757 |
| | Intergovernmental Fiscal Research | | Fax: | | 204-945-5051 |
| | Division, Manitoba Finance | | e-mail: | | feedbackfin@gov.mb.ca |
| | | |
B | | Manitoba Tax Assistance Office, | | Telephone: | | 204-948-2115 in Winnipeg |
| | Manitoba Finance | | Toll-free: | | 1-800-782-0771 |
| | | | Fax: | | 204-948-2263 |
| | | | e-mail: | | tao@gov.mb.ca |
| | | |
C | | Taxation Division, | | Telephone: | | 204-945-5603 in Winnipeg |
| | Manitoba Finance | | Toll-free: | | 1-800-782-0318 |
| | | | Fax: | | 204-945-0896 |
| | | | e-mail: | | mbtax@gov.mb.ca |
|
C 8 / T a x a t i o n A d j u s t m e n t s B U D G E T 2 0 1 2 |
¢ PERSONAL TAX SAVINGS SINCE 1999
Personal Income Taxes, Education Property Tax Credits, Residential Education Support Levy and
Farmland School Tax Rebate
| | | | | | | | | | | | | | | | | | | | | | | | | | | | | | | | |
| | | 2000 | | | 2001 | | | 2002 | | | 2003 | | | 2004 | | | 2005 | | | 2006 | | | 2007 | |
| | | (Millions of Dollars) | |
Income Tax Reductions | | | | | | | | | | | | | | | | | | | | | | | | | | | | | | | | |
BUDGET | | | | | | | | | | | | | | | | | | | | | | | | | | | | | | | | |
2000 | | | 9 | | | | 68 | | | | 34 | | | | | | | | | | | | | | | | | | | | | |
2001 | | | | | | | 29 | | | | 7 | | | | 18 | | | | | | | | | | | | | | | | | |
2002 | | | | | | | | | | | 15 | | | | | | | | | | | | | | | | | | | | | |
2003 | | | | | | | | | | | | | | | | | | | 39 | | | | | | | | | | | | | |
2005 | | | | | | | | | | | | | | | | | | | | | | | | | | | 30 | | | | | |
2006 | | | | | | | | | | | | | | | | | | | | | | | | | | | 8 | | | | 34 | |
2007 | | | | | | | | | | | | | | | | | | | | | | | | | | | | | | | 25 | |
2008 | | | | | | | | | | | | | | | | | | | | | | | | | | | | | | | | |
2010 | | | | | | | | | | | | | | | | | | | | | | | | | | | | | | | | |
2011 | | | | | | | | | | | | | | | | | | | | | | | | | | | | | | | | |
SUBTOTAL | | | 9 | | | | 97 | | | | 56 | | | | 18 | | | | 39 | | | | - | | | | 38 | | | | 59 | |
| | | | | | | | |
Property Tax Reductions1 | | | | | | | | | | | | | | | | | | | | | | | | | | | | | | | | |
BUDGET | | | | | | | | | | | | | | | | | | | | | | | | | | | | | | | | |
2000 | | | 26 | | | | | | | | | | | | | | | | | | | | | | | | | | | | | |
2001 | | | | | | | 27 | | | | | | | | | | | | | | | | | | | | | | | | | |
2002 | | | | | | | | | | | 10 | | | | | | | | | | | | | | | | | | | | | |
2003 | | | | | | | | | | | | | | | 19 | | | | | | | | | | | | | | | | | |
2004 | | | | | | | | | | | | | | | | | | | 23 | | | | | | | | | | | | | |
2005 | | | | | | | | | | | | | | | | | | | | | | | 37 | | | | | | | | | |
2006 | | | | | | | | | | | | | | | | | | | | | | | | | | | 39 | | | | | |
2007 | | | | | | | | | | | | | | | | | | | | | | | | | | | | | | | 42 | |
2008 | | | | | | | | | | | | | | | | | | | | | | | | | | | | | | | | |
2009 | | | | | | | | | | | | | | | | | | | | | | | | | | | | | | | | |
2011 | | | | | | | | | | | | | | | | | | | | | | | | | | | | | | | | |
SUBTOTAL | | | 26 | | | | 27 | | | | 10 | | | | 19 | | | | 23 | | | | 37 | | | | 39 | | | | 42 | |
Annual Totals | | | 35 | | | | 124 | | | | 67 | | | | 37 | | | | 62 | | | | 37 | | | | 77 | | | | 101 | |
Cumulative Annual | | | | | | | | | | | | | | | | | | | | | | | | | | | | | | | | |
Totals | | | 35 | | | | 159 | | | | 226 | | | | 262 | | | | 324 | | | | 361 | | | | 438 | | | | 539 | |
Totals may not add due to rounding.
| 1 | Reductions include increases to the Education Property Tax Credit of $156 million; the introduction of and increases to the Farmland School Tax Rebate of $35 million; and reductions to the Education Support Levy which was eliminated in 2006 (the elimination of ESL now provides annual tax savings of $145 million compared to $100 million in 2006). |
|
B U D G E T 2 0 1 2 T a x a t i o n A d j u s t m e n t s / C 9 |
| | | | | | | | | | | | | | | | | | | | | | | | | | | | | | |
| 2008 | | 2009 | | | 2010 | | | 2011 | | | 2012 | | | 2013 | | | 2014 | | | Cumulative
Annual
Totals | | | |
| (Millions of Dollars) | | | |
| | | | | | | | | | | | | | | | | | | | | | | | | | | Income Tax Reductions |
| | | | | | | | | | | | | | | | | | | | | | | | | | | | | | BUDGET |
| | | | | | | | | | | | | | | | | | | | | | | | | | | 111 | | | 2000 |
| | | | | | | | | | | | | | | | | | | | | | | | | | | 54 | | | 2001 |
| | | | | | | | | | | | | | | | | | | | | | | | | | | 15 | | | 2002 |
| | | | | | | | | | | | | | | | | | | | | | | | | | | 39 | | | 2003 |
| | | | | | | | | | | | | | | | | | | | | | | | | | | 30 | | | 2005 |
| | | | | | | | | | | | | | | | | | | | | | | | | | | 42 | | | 2006 |
| 51 | | | 28 | | | | 16 | | | | | | | | | | | | | | | | | | | | 120 | | | 2007 |
| 1 | | | 24 | | | | 11 | | | | | | | | | | | | | | | | | | | | 36 | | | 2008 |
| | | | | | | 3 | | | | 8 | | | | | | | | | | | | | | | | 11 | | | 2010 |
| | | | | | | | | | | 24 | | | | 20 | | | | 19 | | | | 19 | | | | 81 | | | 2011 |
| 52 | | | 52 | | | | 30 | | | | 32 | | | | 20 | | | | 19 | | | | 19 | | | | 539 | | | SUBTOTAL |
| | | | | | | |
| | | | | | | | | | | | | | | | | | | | | | | | | | | Property Tax Reductions1 |
| | | | | | | | | | | | | | | | | | | | | | | | | | | | | | BUDGET |
| | | | | | | | | | | | | | | | | | | | | | | | | | | 26 | | | 2000 |
| | | | | | | | | | | | | | | | | | | | | | | | | | | 27 | | | 2001 |
| | | | | | | | | | | | | | | | | | | | | | | | | | | 10 | | | 2002 |
| | | | | | | | | | | | | | | | | | | | | | | | | | | 19 | | | 2003 |
| | | | | | | | | | | | | | | | | | | | | | | | | | | 23 | | | 2004 |
| | | | | | | | | | | | | | | | | | | | | | | | | | | 37 | | | 2005 |
| | | | | | | | | | | | | | | | | | | | | | | | | | | 39 | | | 2006 |
| 2 | | | 2 | | | | | | | | | | | | | | | | | | | | | | | | 46 | | | 2007 |
| 25 | | | | | | | | | | | | | | | | | | | | | | | | | | | 25 | | | 2008 |
| | | 16 | | | | | | | | | | | | | | | | | | | | | | | | 16 | | | 2009 |
| | | | | | | | | | | 19 | | | | 2 | | | | 2 | | | | | | | | 23 | | | 2011 |
| 27 | | | 18 | | | | - | | | | 19 | | | | 2 | | | | 2 | | | | - | | | | 291 | | | SUBTOTAL |
| | | | | | | | |
| 79 | | | 70 | | | | 30 | | | | 51 | | | | 21 | | | | 21 | | | | 19 | | | | 830 | | | Annual Totals |
| | | | | | | | |
| | | | | | | | | | | | | | | | | | | | | | | | | | | | | | Cumulative |
| 618 | | | 688 | | | | 718 | | | | 769 | | | | 790 | | | | 811 | | | | 830 | | | | | | | Annual Totals |
|
C 1 0 / T a x a t i o n A d j u s t m e n t s B U D G E T 2 0 1 2 |
¢ MANITOBA INCOME TAX SAVINGS FOR TYPICAL TAXPAYERS
| | | | | | | | | | | | | | | | | | | | |
| | | Tax Payable/(Refunds) | | | Tax Savings | | | 2012 Savings | | | Cumulative
Savings | |
| Income | | 1999 | | | 2012 | | | in 2012 | | | over 1999 | | | over 13 Years | |
| | | | | | | | | |
| | | (Dollars) | | | | | | | | | (Percentage) | | | (Dollars) | |
SINGLE PERSON1 | | | | | | | | | | | | | | | | | |
10,000 | | | 88 | | | | (95) | | | | 183 | | | | 207.0 | | | | 1,580 | |
20,000 | | | 1,369 | | | | 1,071 | | | | 298 | | | | 21.8 | | | | 2,588 | |
40,000 | | | 4,012 | | | | 3,289 | | | | 724 | | | | 18.0 | | | | 6,504 | |
70,000 | | | 9,153 | | | | 7,188 | | | | 1,965 | | | | 21.5 | | | | 17,325 | |
100,000 | | | 14,572 | | | | 12,408 | | | | 2,165 | | | | 14.9 | | | | 19,849 | |
|
| |
FAMILY OF FOUR – ONE EARNER1 | | | | | | | | | | | | | |
25,000 | | | 411 | | | | (192) | | | | 603 | | | | 146.7 | | | | 5,468 | |
40,000 | | | 2,861 | | | | 1,684 | | | | 1,177 | | | | 41.1 | | | | 10,048 | |
60,000 | | | 6,625 | | | | 4,405 | | | | 2,220 | | | | 33.5 | | | | 19,831 | |
75,000 | | | 9,435 | | | | 6,835 | | | | 2,599 | | | | 27.5 | | | | 23,087 | |
100,000 | | | 13,951 | | | | 11,428 | | | | 2,523 | | | | 18.1 | | | | 22,224 | |
|
| |
FAMILY OF FOUR – TWO EARNERS1 | |
30,000 | | | 533 | | | | (23) | | | | 555 | | | | 104.2 | | | | 4,527 | |
40,000 | | | 1,360 | | | | 737 | | | | 623 | | | | 45.8 | | | | 5,377 | |
60,000 | | | 4,107 | | | | 3,093 | | | | 1,015 | | | | 24.7 | | | | 9,403 | |
80,000 | | | 7,169 | | | | 5,505 | | | | 1,664 | | | | 23.2 | | | | 15,312 | |
100,000 | | | 10,188 | | | | 8,013 | | | | 2,176 | | | | 21.4 | | | | 19,635 | |
|
| |
SENIOR COUPLE2 | | | | | | | | | | | | | |
30,000 | | | 39 | | | | (316) | | | | 355 | | | | 910.4 | | | | 3,690 | |
40,000 | | | 1,667 | | | | 715 | | | | 953 | | | | 57.2 | | | | 7,377 | |
60,000 | | | 5,635 | | | | 3,342 | | | | 2,293 | | | | 40.7 | | | | 17,425 | |
80,000 | | | 8,893 | | | | 6,387 | | | | 2,505 | | | | 28.2 | | | | 20,442 | |
Note: Some values may differ from previous years’ tables due to changed assumptions regarding pension income splitting and the Personal Tax Credit.
| 1 | Taxfilers in the single and family examples have earned income and pay Canada Pension Plan and Employment Insurance premiums. In the two-earner family, one taxfiler earns 60% of the income and the other earns 40% and pays child-care fees. The Fitness Tax Credit and the Children’s Arts and Cultural Activity Tax Credit are claimed for one child in both family examples. Where applicable, tax payable has been reduced by the Personal Tax Credit. |
| 2 | For the senior couple, both receive the Old Age Security Pension and each spouse splits private pension income in applicable tax years. |
Note: Income does not reflect Universal Child Care Benefit entitlements but entitlements have been used to determine year-over-year savings.
|
B U D G E T 2 0 1 2 T a x a t i o n A d j u s t m e n t s / C 11 |
¢ MANITOBA INCOME TAX SINCE 1999
One-Earner Family of
Four at $40,000
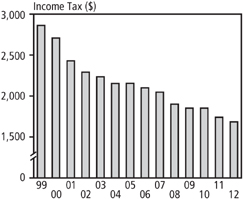
Source: Manitoba Finance
Two-Earner Family of
Four at $60,000
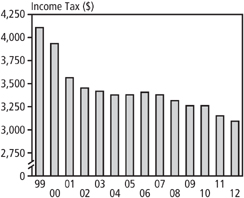
Source: Manitoba Finance
Single Individual at $70,000
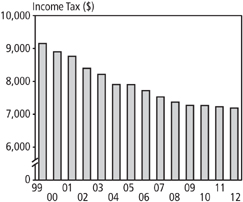
Source: Manitoba Finance
The Basic Personal Amount
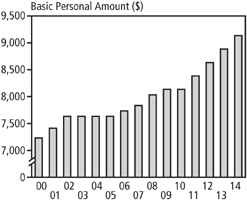
Source: Manitoba Finance
|
C 1 2 / T a x a t i o n A d j u s t m e n t s B U D G E T 2 0 1 2 |
¢ 2012 INTERPROVINCIAL COMPARISON OF TAX RATES
Shows rates applicable on December 31, 2012. Data as of April 1, 2012.
| | | | | | | | | | | | | | | | | | | | |
| | | BC | | | AB | | | SK | | | MB | | | ON | |
Personal Income Tax | | | | | | | | | | | | | | | | | | | | |
Top Marginal Rate (%) 1 | | | 14.7 | | | | 10.00 | | | | 15.00 | | | | 17.40 | | | | 17.41 | |
Health Care Premiums ($) 2 | | | 1,536 | | | | | | | | | | | | | | | | 900 | |
Health and Education Tax (%) 3 | | | | | | | | | | | | | | | 2.15 | | | | 1.95 | |
Corporation Income Tax (%) | | | | | | | | | | | | | | | | | | | | |
Small | | | 2.50 | | | | 3.00 | | | | 2.00 | | | | 0.00 | | | | 4.50 | |
Large | | | 10.00 | | | | 10.00 | | | | 12.00 | | | | 12.00 | | | | 11.50 | |
Manufacturing | | | 10.00 | | | | 10.00 | | | | 10.00 | | | | 12.00 | | | | 10.00 | |
Small business threshold ($000) | | | 500 | | | | 500 | | | | 500 | | | | 400 | | | | 500 | |
Capital Tax (%) | | | | | | | | | | | | | | | | | | | | |
Banks | | | - | | | | - | | | | 3.25 | | | | 4.00 | | | | - | |
Small Financial Institutions 4 | | | - | | | | - | | | | 0.70 | | | | - | | | | - | |
Sales Tax (%) | | | 7.0 | | | | - | | | | 5.0 | | | | 7.0 | | | | 8.0 | |
Gasoline Tax (¢/l) 5 | | | 21.67 | | | | 9.0 | | | | 15.0 | | | | 14.0 | | | | 14.7 | |
Diesel Fuel Tax (¢/l) 6 | | | 22.67 | | | | 9.0 | | | | 15.0 | | | | 14.0 | | | | 14.3 | |
Tobacco Tax (¢/cigarette) 7 | | | 18.50 | | | | 20.00 | | | | 21.00 | | | | 25.00 | | | | 12.35 | |
Corporation Income Tax Credits | | | | | | | | | | | | | | | | | | | | |
Manufacturing (%) | | | | | | | | | | | 5.00 | | | | 10.00 | | | | | |
Research and Development (%) | | | 10.00 | | | | 10.00 | | | | 15.00 | | | | 20.00 | | | | 14.50 | |
| 1 | Top marginal provincial rates include surtaxes. |
| 2 | The premium for BC is the maximum family rate. ON calculates premiums based on taxable income: for incomes of $20,000 or less the premium is zero and the maximum premium of $900 is reached at an income of $200,600. QC calculates premiums for the Prescription Drug Plan on net income: maximum $600 for a single person and $1,200 for a family, and the Parental Insurance Plan Premiums on insurable earnings of up to $66,000; maximum $369. The QC Health Contribution Fund is income tested; maximum per adult is $200. |
| 3 | MB exempts firms with payrolls of less than $1.25 million and a graduated rate for firms with payroll up to $2.5 million. ON provides a payroll deduction of $400,000 for all employers. QC has graduated rates for firms with payrolls under $5 million. NL exempts firms with payrolls of less than $1 million. |
| 4 | MB exempts small financial institutions with less than $4 billion in taxable paid-up capital. SK has a reduced tax rate for small financial institutions with less than $1.5 billion in taxable paid-up capital. |
¢ FEDERAL AND MANITOBA INCOME TAX RATES, 2012
Personal Income Tax Rates
| | | | | | | | |
Federal
Rate | | Taxable Income Range | | | | Manitoba
Rate | | Taxable Income Range |
| 15.0% | | $0 – $42,707 | | | | 10.8% | | $0 – $31,000 |
| 22.0% | | $42,707 – $85,414 | | | | 12.75% | | $31,001 – $67,000 |
| 26.0% | | $85,414 – $132,406 | | | | 17.4% | | over $67,000 |
| 29.0% | | over $132,406 | | | | | | |
|
B U D G E T 2 0 1 2 T a x a t i o n A d j u s t m e n t s / C 1 3 |
| | | | | | | | | | | | | | | | | | | | |
QC | | | | NB | | | | NS | | | | PE | | | | NL | | | | |
| | | | | | | | | | | | | | | | | | | | Personal Income Tax |
| 19.22 | | | | 14.30 | | | | 21.00 | | | | 18.37 | | | | 13.30 | | | | Top Marginal Rate (%) 1 |
| 1,400 | | | | | | | | | | | | | | | | | | | | Health Care Premiums ($) 2 |
| 4.26 | | | | | | | | | | | | | | | | 2.00 | | | | Health and Education Tax (%) 3 |
| | | | | | | | | | | | | | | | | | | | Corporation Income Tax (%) |
| 8.00 | | | | 4.50 | | | | 4.00 | | | | 1.00 | | | | 4.00 | | | | Small |
| 11.90 | | | | 10.00 | | | | 16.00 | | | | 16.00 | | | | 14.00 | | | | Large |
| 11.90 | | | | 10.00 | | | | 16.00 | | | | 16.00 | | | | 5.00 | | | | Manufacturing |
| 500 | | | | 500 | | | | 400 | | | | 500 | | | | 500 | | | | Small business threshold ($000) |
| | | | | | | | | | | | | | | | | | | | Capital Tax (%) |
| 0.25 | | | | 4.00 | | | | 4.00 | | | | 5.00 | | | | 4.00 | | | | Banks |
| - | | | | - | | | | - | | | | - | | | | - | | | | Small Financial Institutions 4 |
| 9.5 | | | | 8.0 | | | | 10.0 | | | | 10.0 | | | | 8.0 | | | | Sales Tax (%) |
| 18.2 | | | | 13.6 | | | | 15.5 | | | | 15.8 | | | | 16.5 | | | | Gasoline Tax (¢/l) 5 |
| 19.2 | | | | 19.2 | | | | 15.4 | | | | 20.2 | | | | 16.5 | | | | Diesel Fuel Tax (¢/l) 6 |
| 10.90 | | | | 17.00 | | | | 21.52 | | | | 25.40 | | | | 19.00 | | | | Tobacco Tax (¢/cigarette) 7 |
| | | | | | | | | | | | | | | | | | | | Corporation Income Tax Credits |
| 5.00 | | | | | | | | | | | | 10.00 | | | | | | | | Manufacturing (%) |
| 37.50 | | | | 15.00 | | | | 15.00 | | | | - | | | | 15.00 | | | | Research and Development (%) |
| 5 | Provincial gasoline taxes are fixed rates per litre. PE includes both a variable (maximum of 8.7¢/l) and a fixed (7.1¢/l) tax. The rate in BC includes 6.75¢/l dedicated to the BC Transportation Financing Authority and the carbon tax rate of 6.67¢/l for gasoline. ON, QC, NB, NS and NL apply provincial sales tax. |
| 6 | Provincial diesel fuel taxes are fixed rates per litre. PE includes both a variable (maximum of 8.7¢/l) and a fixed (11.5¢/l) tax. The rate in BC includes 6.75¢/l dedicated to the BC Transportation Financing Authority and the carbon tax rate of 7.67¢/l for diesel. Montréal has an additional levy of 3.0¢/l and QC imposes a carbon tax of 0.8¢/l on petroleum companies (which, it is assumed, is passed on to consumers). ON, QC, NB, NS and NL include provincial sales tax based on average pump prices. |
| 7 | Provincial sales tax applies to tobacco products in all provinces except AB, PE and QC. |
Corporation Income Tax Rates
| | | | | | | | |
| | | Federal | | | Manitoba | |
Basic Rate | | | 15.0% | | | | 12.0% | |
Small Business Rate | | | 11.0% | | | | 0.0% | |
Small Business Threshold | | $ | 500,000 | | | $ | 400,000 | |
|
C 1 4 / T a x a t i o n A d j u s t m e n t s B U D G E T 2 0 1 2 |
¢ Appendix 1:
MANITOBA TAX EXPENDITURES, 2011/12
Introduction
Governments use the tax system to pursue social, cultural and economic objectives. A tax expenditure is measured as a deviation from a benchmark tax base. The expenditure can be in the form of a deduction, credit, preferential rate, deferral or exemption. Tax expenditures may target taxpayers (ex: individuals, corporations); activities (ex: farming, film production, manufacturing); property (ex: machinery, equipment); sources of income (ex: pensions); transactions (ex: RRSP contributions); or events (ex: involuntary dispositions).
Accounting for Tax Expenditures
Certain tax expenditures are treated as departmental expenditures, which are subject to review and approval by the Legislature, and are published annually as an individual line item in the Estimates of Expenditure in public accounts.
Other tax expenditures are absorbed into revenue estimates, reducing government revenues that would otherwise have been available for various direct expenditures. Tax expenditure accounts help to enhance the transparency of program expenditures and promote public accountability for tax credits that are absorbed into tax revenue.
Limitations of Tax Expenditure Accounting
Tax expenditure accounting has important limitations that must be considered when interpreting results. The value of each tax expenditure is estimated individually. Interactions between provisions are not taken into account. This has two effects. First, estimates for two or more tax expenditures cannot be added together to arrive at a combined value. Second, changing any one tax expenditure might affect the value of another tax expenditure. For example, changing something that is a deduction from income, such as RRSP contributions, would change reported net income. This in turn would change the value of tax credits, such as Manitoba’s Personal Tax Credit, that depend on net income. The combined value of the tax expenditures listed in the account is substantially less than the sum of the individual items.
|
B U D G E T 2 0 1 2 T a x a t i o n A d j u s t m e n t s / C 1 5 |
Reporting Tax Expenditures
Manitoba’s tax expenditure accounts are separated into six sections: personal income tax, corporation income tax, health and education tax levy, retail sales tax, fuel tax and corporation capital tax. The estimates are calculated from tax assessment data provided by the Canada Revenue Agency and departmental data. The estimates provided are for the 2011/12 fiscal year and include measures announced in the 2012 Budget.
In the fall of 2011, the Public Sector Accounting Board (PSAB) issued guidelines on transfers made through the tax system that have an impact on revenue or expenditure, but no net fiscal impact. The guidelines took effect April 1, 2012. The PSAB guidelines stipulate that tax expenditures that provide a financial benefit through the tax system for a purpose other than the relief of taxes be shown as an expense.
The 2012 Budget reflects the following tax credits as expenditures and can be found in the Estimates of Expenditure in the departments of Agriculture, Food and Rural Initiatives, Education, and Finance. The 2011/12 Estimates have also been restated to conform with the new guidelines.
CREDITS ACCOUNTED FOR AS EXPENDITURE ITEMS
| | | | |
| | | 2011/12 | |
| | | (Millions of dollars) | |
Education Property Tax Credit (including the Advance) | | | 287.3 | |
Farmland School Tax Rebate | | | 35.5 | |
Film and Video Production Tax Credit | | | 15.0 | |
Tuition Fee Income Tax Rebate Advance | | | 7.9 | |
School Tax Credit for Tenants and Homeowners (55+) | | | 1.5 | |
Book Publishing Tax Credit | | | 0.4 | |
Co-operative Development Tax Credit | | | 0.2 | |
Interactive Digital Media Tax Credit | | | 0.1 | |
Cultural Industries Printing Tax Credit | | | 0.1 | |
TOTAL | | | 348.0 | |
The PSAB guidelines also define tax concessions as financial benefits that provide tax relief for taxes previously paid or currently owing and directs that they be netted against the related tax revenue. The 2011/12 Estimates have been restated to conform with the new guideline. The following tax concessions have been netted against revenue:
| • | Political Contribution Tax Credit (for individuals only) |
| • | Community Enterprise Development Tax Credit |
Revenue forecasts for 2011/12 have also been restated to reflect this new accounting standard.
|
C 1 6 / T a x a t i o n A d j u s t m e n t s B U D G E T 2 0 1 2 |
MANITOBA TAX EXPENDITURES, 2011/12
| | | | |
| | | (Millions of Dollars) | |
PERSONAL INCOME TAX | | | | |
| |
(a) Adjustments to Income (in accordance with tax collection agreements) | | | | |
Contributions to RRSPs | | | 144.0 | |
Contributions to RPPs | | | 89.6 | |
Capital gains inclusion rate | | | 76.5 | |
Lifetime capital gains exemption | | | 35.4 | |
Social assistance, WCB and OAS/GIS (non-taxable income) | | | 21.2 | |
Union dues and professional fees | | | 18.6 | |
Child-care expenses | | | 13.2 | |
Northern residents deduction | | | 6.8 | |
Pension income splitting | | | 17.1 | |
Moving expenses | | | 1.9 | |
| |
(b) Non-refundable tax credits (basic credits provided federally and by all provinces) | | | | |
Basic personal | | | 653.6 | |
CPP/EI | | | 115.0 | |
Charitable donations | | | 67.0 | |
Age | | | 33.5 | |
Tuition fees and education amount ($400/month) | | | 30.0 | |
Medical expenses | | | 33.4 | |
Spousal | | | 23.8 | |
Eligible dependant | | | 16.8 | |
Private pension | | | 15.1 | |
Disability | | | 19.1 | |
Caregiver | | | 1.4 | |
Student loan interest | | | 0.8 | |
Fitness Tax Credit | | | 3.9 | |
Children’s Arts and Cultural Activity Tax Credit | | | 3.8 | |
Infirm dependants | | | 0.2 | |
Adoption Expenses Tax Credit | | | 0.1 | |
Family Tax Benefit | | | 58.1 | |
| |
(c) Other Manitoba Tax Measures | | | | |
Tuition Fee Income Tax Rebate | | | 26.3 | |
Labour-sponsored Venture Capital Corporations Tax Credit | | | 0.3 | |
Mineral Exploration Tax Credit | | | 3.4 | |
Overseas Employment Tax Credit | | | 0.5 | |
Foreign Tax Credit | | | 2.9 | |
Primary Caregiver Tax Credit | | | 9.6 | |
Political Contributions Tax Credit | | | 1.6 | |
Community Enterprise Development Tax Credit | | | 0.1 | |
|
B U D G E T 2 0 1 2 �� T a x a t i o n A d j u s t m e n t s / C 1 7 |
| | | | |
| | | (Millions of Dollars) | |
| |
CORPORATION INCOME TAX | | | | |
Low rate for small business | | | 237.5 | |
Manufacturing Investment Tax Credit | | | 34.2 | |
Research and Development Tax Credit | | | 29.7 | |
Green Energy Equipment Tax Credit | | | 0.6 | |
Co-op Education and Apprenticeship Tax Credits | | | 0.9 | |
Odour Control Tax Credit | | | 0.1 | |
Riparian Tax Credit | | | 0.1 | |
Small Business Venture Capital Tax Credit | | | 0.4 | |
Neighbourhoods Alive! Tax Credit | | | 0.1 | |
Nutrient Management Tax Credit | | | 0.1 | |
| |
HEALTH AND EDUCATION LEVY | | | | |
$1.25 million exemption | | | 138.3 | |
Exemption for interjurisdictional common carriers | | | 14.0 | |
| |
RETAIL SALES TAX | | | | |
Personal Tax Credit | | | 39.8 | |
| |
Exemptions | | | | |
Groceries | | | 167.3 | |
Farm machinery and repairs | | | 45.5 | |
Farm and organic fertilizer | | | 23.3 | |
Prescription drugs and medicine | | | 22.8 | |
Books, free magazines and newspapers, and school yearbooks | | | 18.7 | |
Farm pesticides and herbicides | | | 17.0 | |
Medical supplies, appliances and equipment | | | 15.0 | |
Water supplied by a municipality | | | 12.9 | |
Natural gas for residential heating | | | 9.8 | |
Children’s clothing and footwear | | | 11.7 | |
Electricity used for manufacturing or mining | | | 11.8 | |
Custom software and computer programming | | | 7.8 | |
Electricity for residential heating | | | 7.1 | |
Vehicle trade-ins | | | 6.5 | |
Toll-free calls | | | 6.1 | |
Vehicle private buy/sell refunds | | | 3.9 | |
Direct agents and qualifying items used in manufacturing a product for sale and in mining or processing minerals | | | 3.2 | |
Municipal exemptions (including the purchase of ambulances, fire trucks and related equipment,flood protection and gravel or sand purchased by a municipality for its own use) | | | 1.8 | |
Qualifying geophysical survey and explorations equipment, drill rigs and well-servicing equipment used in oil and gas exploration and development | | | 1.6 | |
|
C 1 8 / T a x a t i o n A d j u s t m e n t s B U D G E T 2 0 1 2 |
| | | | |
| | | (Millions of Dollars) | |
Feminine hygiene products | | | 1.3 | |
Mobile, ready-to-move and modular homes (point of sale reduction) | | | 0.9 | |
Films for public broadcast | | | 0.4 | |
Non-prescription smoking cessation products | | | 0.4 | |
Farm manure slurry tanks and lagoon liners | | | 0.1 | |
Qualifying geophysical survey and exploration equipment, and prototype mining equipment | | | 0.1 | |
| |
FUEL TAX | | | | |
Marked gasoline and diesel | | | 43.7 | |
Ethanol grant | | | 19.5 | |
International cargo flight refunds | | | 0.1 | |
| |
CORPORATION CAPITAL TAX | | | | |
Elimination of General Corporation Capital Tax | | | 127.4 | |
Capital deduction | | | 0.2 | |
Credit unions and caisses populaires exemption | | | 12.5 | |
Co-operatives exemption | | | 0.7 | |
Small banks and trust and loan corporations exemptions | | | 0.8 | |
All estimates are based on the most complete information available at the time of publication.
In some cases, new information may significantly revise earlier estimates.
Source: Manitoba Finance
|
B U D G E T 2 0 1 2 T a x a t i o n A d j u s t m e n t s / C 1 9 |
n Appendix 2:
THE MANITOBA ADVANTAGE
Manitoba is a diversified economy where no single industry dominates the industrial base. Manitoba has been quick to adjust to the changing global market conditions. With emerging markets increasingly driving global growth, Manitoba has expanded its sales to Asia, the Middle East and Africa.
Diversity has provided Manitoba with balance, stability and measured growth over the long term. It has helped generate the best record for consistent growth in capital investment of all provinces, and supported the largest increase in population in 40years.
Manitoba provides businesses and residents with a unique set of benefits that we call “The Manitoba Advantage:”
| | • | | a productive, well-educated and multilingual labour force that consistently generates among the lowest unemployment rate and the highest overall labour force participation rate in Canada; |
| | • | | a favourable business cost environment, including competitive office and land costs, reasonable construction costs and affordable taxes; |
| | • | | a supportive capital investment information network for new and expanding business includes Manitoba Business Gateways, Yes! Winnipeg and CentrePort Canada, among others; |
| | • | | an extensive network of R&D facilities and communication infrastructure supporting innovation and productivity; |
| | • | | a convenient mid-continent location with cost-effective transportation links and intermodal facilities providing shipping by road, rail, air and sea, enhanced by CentrePort Canada, the country’s first foreign trade zone and inland port; |
| | • | | a favourable cost of living, including among the lowest electricity costs in North America; reliable and accessible public services, including quality universal public health care and education; |
| | • | | a dynamic cultural and artistic community with a strong background of caring, high level of charitable giving and volunteering; and an attractive natural environment with plenty of opportunities for recreation and relaxation which further enhance Manitobans’ quality of life. |
To show Manitoba’s cost competitiveness in more detail, several analyses are provided. The interprovincial comparison of annual personal costs and taxes, net of credits and rebates, compares provinces’ living costs and tax levels for a variety of family types (see p. C22) and graduate students (see p. C26).
Manitoba’s Competitive Environment for Manufacturing, provides a detailed comparison of the taxes and costs faced by representative manufacturers in various Canadian and U.S. cities (see p. C30).
Since 1999, Manitoba’s overall provincial rankings for personal costs and taxes have been among the best in Canada. For 2012, Manitoba’s performance remains favourable. Interprovincial comparison of provincial taxes, utilities and housing costs for five representative family types continues to leave Manitoba ranking in the top three most affordable provinces in which to live and work.
|
C 2 0 / T a x a t i o n A d j u s t m e n t s B U D G E T 2 0 1 2 |
2012 Comparison of Personal Costs and Taxes
| | |
| Single Person Earning $30,000 | | Single Parent Earning $30,000 |
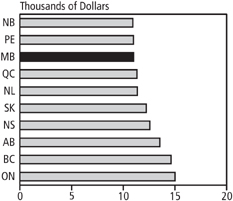
| | 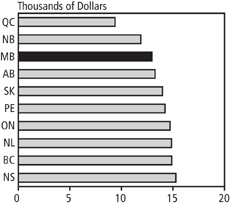
|
| |
Two-Earner Family of Four Earning $60,000 | | Two-Earner Family of Five Earning $75,000 |

| | 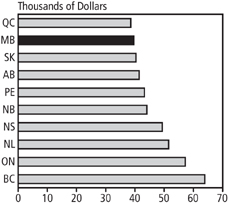
|
All Charts Source: Manitoba Finance
|
B U D G E T 2 0 1 2 T a x a t i o n A d j u s t m e n t s / C 2 1 |
|
C 2 2 / T a x a t i o n A d j u s t m e n t s B U D G E T 2 0 1 2 |
2012 Comparison of
Personal Costs and Taxes
| | | | | | | | | | | | | | | | | | | | |
| Single Person: $30,000 | | BC | | | AB | | | SK | | | MB | | | ON | |
| | | | | |
Provincial Income Tax | | | 833 | | | | 1,086 | | | | 1,245 | | | | 1,407 | | | | 427 | |
Health Premiums | | | 768 | | | | 0 | | | | 0 | | | | 0 | | | | 300 | |
| | | | | | | | | | | | | | | | | | | | |
Subtotal PIT and Premiums | | | 1,601 | | | | 1,086 | | | | 1,245 | | | | 1,407 | | | | 727 | |
| | | | | | | | | | | | | | | | | | | | |
| | | | | |
Provincial Sales Tax | | | 326 | | | | 0 | | | | 139 | | | | 288 | | | | 491 | |
Carbon Tax Credit | | | (116) | | | | 0 | | | | 0 | | | | 0 | | | | 0 | |
| | | | | | | | | | | | | | | | | | | | |
Total Provincial Taxes, Credits and Premiums | | | 1,811 | | | | 1,086 | | | | 1,383 | | | | 1,695 | | | | 1,218 | |
| | | | | | | | | | | | | | | | | | | | |
| | | | | |
Rent | | | 11,568 | | | | 10,788 | | | | 9,444 | | | | 8,136 | | | | 11,724 | |
Utilities | | | 316 | | | | 652 | | | | 606 | | | | 341 | | | | 629 | |
Public Transit | | | 923 | | | | 1,015 | | | | 801 | | | | 824 | | | | 1,436 | |
| | | | | | | | | | | | | | | | | | | | |
Total Living Costs | | | 12,807 | | | | 12,455 | | | | 10,851 | | | | 9,301 | | | | 13,789 | |
| | | | | | | | | | | | | | | | | | | | |
Total Personal Costs and Taxes | | | 14,618 | | | | 13,541 | | | | 12,234 | | | | 10,996 | | | | 15,007 | |
| | | | | | | | | | | | | | | | | | | | |
| | | | | | | | | | | | | | | | | | | | |
| Single Parent, One Child: $30,000 | | BC | | | AB | | | SK | | | MB | | | ON | |
| | | | | |
Provincial Income Tax | | | (154) | | | | 0 | | | | (446) | | | | (70) | | | | (809) | |
Health Premiums | | | 835 | | | | 0 | | | | 0 | | | | 0 | | | | 300 | |
| | | | | | | | | | | | | | | | | | | | |
Subtotal PIT and Premiums | | | 681 | | | | 0 | | | | (446) | | | | (70) | | | | (509) | |
| | | | | | | | | | | | | | | | | | | | |
| | | | | |
Family/Employment Tax Credits | | | 0 | | | | (715) | | | | 0 | | | | 0 | | | | 0 | |
Child Benefits | | | 0 | | | | 0 | | | | 0 | | | | 0 | | | | (210) | |
Provincial Sales Tax | | | 423 | | | | 0 | | | | 180 | | | | 374 | | | | 639 | |
Carbon Tax Credit | | | (231) | | | | 0 | | | | 0 | | | | 0 | | | | 0 | |
| | | | | | | | | | | | | | | | | | | | |
Total Provincial Taxes, Credits and Premiums | | | 873 | | | | (715) | | | | (266) | | | | 305 | | | | (80) | |
| | | | | | | | | | | | | | | | | | | | |
| | | | | |
Rent | | | 11,568 | | | | 10,788 | | | | 9,444 | | | | 8,136 | | | | 11,724 | |
Child Care | | | 1,200 | | | | 1,524 | | | | 3,396 | | | | 3,358 | | | | 1,000 | |
Utilities | | | 316 | | | | 652 | | | | 606 | | | | 341 | | | | 629 | |
Public Transit | | | 923 | | | | 1,015 | | | | 801 | | | | 824 | | | | 1,436 | |
| | | | | | | | | | | | | | | | | | | | |
Total Living Costs | | | 14,007 | | | | 13,979 | | | | 14,247 | | | | 12,659 | | | | 14,789 | |
| | | | | | | | | | | | | | | | | | | | |
Total Personal Costs and Taxes | | | 14,880 | | | | 13,264 | | | | 13,981 | | | | 12,964 | | | | 14,708 | |
| | | | | | | | | | | | | | | | | | | | |
Sums may not add due to rounding.
|
B U D G E T 2 0 1 2 T a x a t i o n A d j u s t m e n t s / C 2 3 |
| | | | | | | | | | | | | | | | | | | | |
| QC | | | NB | | | NS | | | PE | | | NL | | | Single Person: $30,000 |
| | | | | |
| | 1,145 | | | | 1,602 | | | | 1,508 | | | | 2,002 | | | | 1,532 | | | Provincial Income Tax |
| | 949 | | | | 0 | | | | 0 | | | | 0 | | | | 0 | | | Health Premiums |
| | | | | | | | | | | | | | | | | | | | |
| | 2,094 | | | | 1,602 | | | | 1,508 | | | | 2,002 | | | | 1,532 | | | Subtotal PIT and Premiums |
| | | | | | | | | | | | | | | | | | | | |
| | | | | |
| | 511 | | | | 472 | | | | 631 | | | | 378 | | | | 519 | | | Provincial Sales Tax |
| | 0 | | | | 0 | | | | 0 | | | | 0 | | | | 0 | | | Carbon Tax Credit |
| | | | | | | | | | | | | | | | | | | | |
| | 2,605 | | | | 2,074 | | | | 2,139 | | | | 2,380 | | | | 2,051 | | | Total Provincial Taxes, Credits and Premiums |
| | | | | | | | | | | | | | | | | | | | |
| | | | | |
| | 7,692 | | | | 7,644 | | | | 9,036 | | | | 7,224 | | | | 7,992 | | | Rent |
| | 326 | | | | 508 | | | | 637 | | | | 723 | | | | 554 | | | Utilities |
| | 698 | | | | 709 | | | | 766 | | | | 649 | | | | 775 | | | Public Transit |
| | | | | | | | | | | | | | | | | | | | |
| | 8,716 | | | | 8,861 | | | | 10,439 | | | | 8,596 | | | | 9,321 | | | Total Living Costs |
| | | | | | | | | | | | | | | | | | | | |
| | 11,321 | | | | 10,935 | | | | 12,578 | | | | 10,977 | | | | 11,373 | | | Total Personal Costs and Taxes |
| | | | | | | | | | | | | | | | | | | | |
| QC | | | NB | | | NS | | | PE | | | NL | | | Single Parent, One Child: $30,000 |
| | | | | |
| | 1,171 | | | | 44 | | | | 497 | | | | 1,039 | | | | 0 | | | Provincial Income Tax |
| | 620 | | | | 0 | | | | 0 | | | | 0 | | | | 0 | | | Health Premiums |
| | | | | | | | | | | | | | | | | | | | |
| | 1,791 | | | | 44 | | | | 497 | | | | 1,039 | | | | 0 | | | Subtotal PIT and Premiums |
| | | | | | | | | | | | | | | | | | | | |
| | | | | |
| | (551) | | | | (250) | | | | 0 | | | | 0 | | | | 0 | | | Family/Employment Tax Credits |
| | (3,056) | | | | (67) | | | | 0 | | | | 0 | | | | 0 | | | Child Benefits |
| | 664 | | | | 613 | | | | 820 | | | | 491 | | | | 674 | | | Provincial Sales Tax |
| | 0 | | | | 0 | | | | 0 | | | | 0 | | | | 0 | | | Carbon Tax Credit |
| | | | | | | | | | | | | | | | | | | | |
| | (1,152) | | | | 340 | | | | 1,317 | | | | 1,531 | | | | 674 | | | Total Provincial Taxes, Credits and Premiums |
| | | | | | | | | | | | | | | | | | | | |
| | | | | |
| | 7,692 | | | | 7,644 | | | | 9,036 | | | | 7,224 | | | | 7,992 | | | Rent |
| | 1,820 | | | | 2,686 | | | | 3,531 | | | | 4,104 | | | | 4,860 | | | Child Care |
| | 326 | | | | 508 | | | | 637 | | | | 723 | | | | 554 | | | Utilities |
| | 698 | | | | 709 | | | | 766 | | | | 649 | | | | 775 | | | Public Transit |
| | | | | | | | | | | | | | | | | | | | |
| | 10,536 | | | | 11,547 | | | | 13,970 | | | | 12,700 | | | | 14,181 | | | Total Living Costs |
| | | | | | | | | | | | | | | | | | | | |
| | 9,385 | | | | 11,887 | | | | 15,287 | | | | 14,231 | | | | 14,856 | | | Total Personal Costs and Taxes |
| | | | | | | | | | | | | | | | | | | | |
Sums may not add due to rounding.
|
C 2 4 / T a x a t i o n A d j u s t m e n t s B U D G E T 2 0 1 2 |
2012 Comparison of
Personal Costs and Taxes
| | | | | | | | | | | | | | | | | | | | |
| Two-Earner Family of 4: $60,000 | | BC | | | AB | | | SK | | | MB | | | ON | |
| | | | | |
Provincial Income Tax | | | 1,132 | | | | 1,645 | | | | 483 | | | | 3,046 | | | | 679 | |
Health Premiums | | | 1,536 | | | | 0 | | | | 0 | | | | 0 | | | | 300 | |
| | | | | | | | | | | | | | | | | | | | |
Subtotal PIT and Premiums | | | 2,668 | | | | 1,645 | | | | 483 | | | | 3,046 | | | | 979 | |
| | | | | | | | | | | | | | | | | | | | |
| | | | | |
Family/Employment Tax Credits | | | 0 | | | | (1,365) | | | | 0 | | | | 0 | | | | 0 | |
Child Benefits | | | 0 | | | | 0 | | | | 0 | | | | 0 | | | | 0 | |
Property Taxes | | | 3,291 | | | | 2,114 | | | | 2,684 | | | | 2,728 | | | | 2,999 | |
Property Tax Credits | | | (570) | | | | 0 | | | | 0 | | | | (700) | | | | 0 | |
Provincial Sales Tax | | | 1,103 | | | | 0 | | | | 695 | | | | 1,106 | | | | 1,824 | |
Gasoline Tax | | | 650 | | | | 270 | | | | 450 | | | | 420 | | | | 441 | |
Carbon Tax Credit | | | (72) | | | | 0 | | | | 0 | | | | 0 | | | | 0 | |
| | | | | | | | | | | | | | | | | | | | |
Total Provincial Taxes, Credits and Premiums | | | 7,071 | | | | 2,664 | | | | 4,312 | | | | 6,600 | | | | 6,243 | |
| | | | | | | | | | | | | | | | | | | | |
| | | | | |
Mortgage Costs | | | 23,471 | | | | 11,807 | | | | 9,837 | | | | 8,267 | | | | 13,231 | |
Child Care | | | 14,880 | | | | 8,868 | | | | 11,352 | | | | 9,776 | | | | 7,999 | |
Utilities | | | 1,661 | | | | 2,024 | | | | 1,972 | | | | 1,599 | | | | 2,065 | |
Auto Insurance | | | 2,719 | | | | 2,664 | | | | 1,949 | | | | 1,885 | | | | 8,666 | |
| | | | | | | | | | | | | | | | | | | | |
Total Living Costs | | | 42,731 | | | | 25,363 | | | | 25,110 | | | | 21,527 | | | | 31,961 | |
| | | | | | | | | | | | | | | | | | | | |
Total Personal Costs and Taxes | | | 49,802 | | | | 28,027 | | | | 29,422 | | | | 28,172 | | | | 38,204 | |
| | | | | | | | | | | | | | | | | | | | |
| | | | | | | | | | | | | | | | | | | | |
| Two-Earner Family of 5: $75,000 | | BC | | | AB | | | SK | | | MB | | | ON | |
| | | | | |
Provincial Income Tax | | | 1,768 | | | | 2,484 | | | | 1,297 | | | | 4,142 | | | | 1,445 | |
Health Premiums | | | 1,536 | | | | 0 | | | | 0 | | | | 0 | | | | 516 | |
| | | | | | | | | | | | | | | | | | | | |
Subtotal PIT and Premiums | | | 3,304 | | | | 2,484 | | | | 1,297 | | | | 4,142 | | | | 1,961 | |
| | | | | | | | | | | | | | | | | | | | |
| | | | | |
Family/Employment Tax Credits | | | 0 | | | | (1,755) | | | | 0 | | | | 0 | | | | 0 | |
Child Benefits | | | 0 | | | | 0 | | | | 0 | | | | 0 | | | | 0 | |
Property Taxes | | | 3,655 | | | | 2,950 | | | | 3,671 | | | | 3,596 | | | | 5,151 | |
Property Tax Credits | | | (570) | | | | 0 | | | | 0 | | | | (700) | | | | 0 | |
Provincial Sales Tax | | | 1,387 | | | | 0 | | | | 565 | | | | 1,301 | | | | 2,308 | |
Gasoline Tax | | | 650 | | | | 270 | | | | 450 | | | | 420 | | | | 441 | |
| | | | | | | | | | | �� | | | | | | | | | |
Total Provincial Taxes, Credits and Premiums | | | 8,426 | | | | 3,949 | | | | 5,983 | | | | 8,759 | | | | 9,861 | |
| | | | | | | | | | | | | | | | | | | | |
| | | | | |
Mortgage Costs | | | 26,610 | | | | 16,479 | | | | 13,455 | | | | 11,804 | | | | 22,723 | |
Child Care | | | 23,400 | | | | 14,940 | | | | 15,678 | | | | 14,495 | | | | 12,500 | |
Home Heating | | | 2,768 | | | | 3,373 | | | | 3,286 | | | | 2,665 | | | | 3,442 | |
Auto Insurance | | | 2,719 | | | | 2,664 | | | | 1,949 | | | | 1,885 | | | | 8,666 | |
| | | | | | | | | | | | | | | | | | | | |
Total Living Costs | | | 55,497 | | | | 37,456 | | | | 34,368 | | | | 30,849 | | | | 47,331 | |
| | | | | | | | | | | | | | | | | | | | |
Total Personal Costs and Taxes | | | 63,923 | | | | 41,405 | | | | 40,351 | | | | 39,608 | | | | 57,192 | |
| | | | | | | | | | | | | | | | | | | | |
Sums may not add due to rounding.
|
B U D G E T 2 0 1 2 T a x a t i o n A d j u s t m e n t s / C 2 5 |
| | | | | | | | | | | | | | | | | | | | |
| QC | | | NB | | | NS | | | PE | | | NL | | | Two-Earner Family of 4: $60,000 |
| | | | | |
| | 4,589 | | | | 2,335 | | | | 2,620 | | | | 2,989 | | | | 2,390 | | | Provincial Income Tax |
| | 1,698 | | | | 0 | | | | 0 | | | | 0 | | | | 0 | | | Health Premiums |
| | | | | | | | | | | | | | | | | | | | |
| | 6,288 | | | | 2,335 | | | | 2,620 | | | | 2,989 | | | | 2,390 | | | Subtotal PIT and Premiums |
| | | | | | | | | | | | | | | | | | | | |
| | | | | |
| | 0 | | | | (250) | | | | 0 | | | | 0 | | | | 0 | | | Family/Employment Tax Credits |
| | (2,698) | | | | 0 | | | | 0 | | | | 0 | | | | 0 | | | Child Benefits |
| | 3,083 | | | | 2,790 | | | | 2,332 | | | | 2,600 | | | | 1,545 | | | Property Taxes |
| | 0 | | | | 0 | | | | 0 | | | | 0 | | | | 0 | | | Property Tax Credits |
| | 1,979 | | | | 1,751 | | | | 2,274 | | | | 1,263 | | | | 1,923 | | | Provincial Sales Tax |
| | 546 | | | | 408 | | | | 465 | | | | 495 | | | | 474 | | | Gasoline Tax |
| | 0 | | | | 0 | | | | 0 | | | | 0 | | | | 0 | | | Carbon Tax Credit |
| | | | | | | | | | | | | | | | | | | | |
| | 9,198 | | | | 7,034 | | | | 7,691 | | | | 7,347 | | | | 6,333 | | | Total Provincial Taxes, Credits and Premiums |
| | | | | | | | | | | | | | | | | | | | |
| | | | | |
| | 8,280 | | | | 6,010 | | | | 7,744 | | | | 6,010 | | | | 7,694 | | | Mortgage Costs |
| | 3,640 | | | | 12,802 | | | | 14,217 | | | | 12,000 | | | | 15,120 | | | Child Care |
| | 2,149 | | | | 2,879 | | | | 2,704 | | | | 3,974 | | | | 3,641 | | | Utilities |
| | 1,988 | | | | 2,022 | | | | 2,069 | | | | 1,733 | | | | 2,839 | | | Auto Insurance |
| | | | | | | | | | | | | | | | | | | | |
| | 16,057 | | | | 23,713 | | | | 26,734 | | | | 23,717 | | | | 29,294 | | | Total Living Costs |
| | | | | | | | | | | | | | | | | | | | |
| | 25,255 | | | | 30,747 | | | | 34,425 | | | | 31,064 | | | | 35,627 | | | Total Personal Costs and Taxes |
| | | | | | | | | | | | | | | | | | | | |
| | | | | | | | | | | | | | | | | | | | |
| QC | | | NB | | | NS | | | PE | | | NL | | | Two-Earner Family of 5: $75,000 |
| | | | | |
| | 7,028 | | | | 3,503 | | | | 3,906 | | | | 4,131 | | | | 3,429 | | | Provincial Income Tax |
| | 1,782 | | | | 0 | | | | 0 | | | | 0 | | | | 0 | | | Health Premiums |
| | | | | | | | | | | | | | | | | | | | |
| | 8,810 | | | | 3,503 | | | | 3,906 | | | | 4,131 | | | | 3,429 | | | Subtotal PIT and Premiums |
| | | | | | | | | | | | | | | | | | | | |
| | | | | |
| | 0 | | | | (250) | | | | 0 | | | | 0 | | | | 0 | | | Family/Employment Tax Credits |
| | (3,200) | | | | 0 | | | | 0 | | | | 0 | | | | 0 | | | Child Benefits |
| | 5,152 | | | | 3,859 | | | | 3,196 | | | | 3,299 | | | | 2,306 | | | Property Taxes |
| | 0 | | | | 0 | | | | 0 | | | | 0 | | | | 0 | | | Property Tax Credits |
| | 2,396 | | | | 2,204 | | | | 2,781 | | | | 1,367 | | | | 2,232 | | | Provincial Sales Tax |
| | 546 | | | | 408 | | | | 465 | | | | 495 | | | | 474 | | | Gasoline Tax |
| | | | | | | | | | | | | | | | | | | | |
| | 13,704 | | | | 9,724 | | | | 10,348 | | | | 9,293 | | | | 8,441 | | | Total Provincial Taxes, Credits and Premiums |
| | | | | | | | | | | | | | | | | | | | |
| | | | | |
| | 13,836 | | | | 8,312 | | | | 10,614 | | | | 7,624 | | | | 11,481 | | | Mortgage Costs |
| | 5,460 | | | | 19,203 | | | | 21,793 | | | | 18,000 | | | | 22,680 | | | Child Care |
| | 3,582 | | | | 4,798 | | | | 4,507 | | | | 6,623 | | | | 6,068 | | | Home Heating |
| | 1,988 | | | | 2,022 | | | | 2,069 | | | | 1,733 | | | | 2,839 | | | Auto Insurance |
| | | | | | | | | | | | | | | | | | | | |
| | 24,866 | | | | 34,335 | | | | 38,983 | | | | 33,980 | | | | 43,068 | | | Total Living Costs |
| | | | | | | | | | | | | | | | | | | | |
| | 38,570 | | | | 44,059 | | | | 49,331 | | | | 43,273 | | | | 51,509 | | | Total Personal Costs and Taxes |
| | | | | | | | | | | | | | | | | | | | |
Sums may not add due to rounding.
|
C 2 6 / T a x a t i o n A d j u s t m e n t s B U D G E T 2 0 1 2 |
2012 Comparison of Personal Costs and Taxes
Net of Graduate Credits and Tuition Rebates
| | | | | | | | | | | | | | | | | | | | |
| Single Person: $50,000 | | BC | | | AB | | | SK | | | MB | | | ON | |
Provincial Income Tax | | | 2,139 | | | | 2,958 | | | | 3,669 | | | | 4,499 | | | | 2,342 | |
Graduate Tuition Credit/Rebate | | | 0 | | | | 0 | | | | (2,000) | | | | (2,500) | | | | 0 | |
Health Premiums | | | 768 | | | | 0 | | | | 0 | | | | 0 | | | | 600 | |
| | | | | | | | | | | | | | | | | | | | |
Subtotal PIT, Credit and Premiums | | | 2,907 | | | | 2,958 | | | | 1,669 | | | | 1,999 | | | | 2,942 | |
| | | | | | | | | | | | | | | | | | | | |
| | | | | |
Property Taxes | | | 3,291 | | | | 2,114 | | | | 2,684 | | | | 2,728 | | | | 2,999 | |
Property Tax Credits | | | (570) | | | | 0 | | | | 0 | | | | (700) | | | | 0 | |
Provincial Sales Tax | | | 479 | | | | 0 | | | | 260 | | | | 470 | | | | 777 | |
Gasoline Tax | | | 433 | | | | 180 | | | | 300 | | | | 280 | | | | 294 | |
| | | | | | | | | | | | | | | | | | | | |
Total Provincial Taxes, Credits and Premiums | | | 6,541 | | | | 5,252 | | | | 4,913 | | | | 4,776 | | | | 7,012 | |
| | | | | | | | | | | | | | | | | | | | |
| | | | | |
Mortgage Costs | | | 23,471 | | | | 11,807 | | | | 9,837 | | | | 8,267 | | | | 13,231 | |
Utilities | | | 1,661 | | | | 2,024 | | | | 1,972 | | | | 1,599 | | | | 2,065 | |
Auto Insurance | | | 1,286 | | | | 1,233 | | | | 877 | | | | 893 | | | | 4,268 | |
| | | | | | | | | | | | | | | | | | | | |
Total Living Costs | | | 26,418 | | | | 15,064 | | | | 12,686 | | | | 10,759 | | | | 19,564 | |
| | | | | | | | | | | | | | | | | | | | |
Total Personal Costs and Taxes | | | 32,959 | | | | 20,316 | | | | 17,599 | | | | 15,535 | | | | 26,576 | |
| | | | | | | | | | | | | | | | | | | | |
Sums may not add due to rounding.
| | |
Income Tax and Health Premiums, Net of Graduate Credits and Tuition Rebates | | Personal Costs and Taxes - Graduate Earning $50,000 |
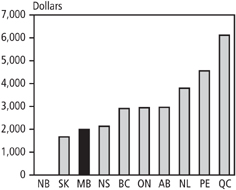
Source: Manitoba Finance | | 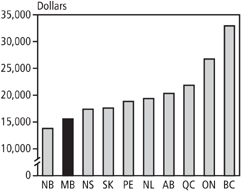
Source: Manitoba Finance |
|
B U D G E T 2 0 1 2 T a x a t i o n A d j u s t m e n t s / C 2 7 |
| | | | | | | | | | | | | | | | | | | | |
| QC | | | NB | | | NS | | | PE | | | NL | | | Single Person: $50,000 |
| | | | | |
| | 5,051 | | | | 3,781 | | | | 4,631 | | | | 4,557 | | | | 3,795 | | | Provincial Income Tax |
| | 0 | | | | (3,781) | | | | (2,500) | | | | 0 | | | | 0 | | | Graduate Tuition Credit/Rebate |
| | 1,061 | | | | 0 | | | | 0 | | | | 0 | | | | 0 | | | Health Premiums |
| | | | | | | | | | | | | | | | | | | | |
| | 6,112 | | | | 0 | | | | 2,131 | | | | 4,557 | | | | 3,795 | | | Subtotal PIT, Credit and Premiums |
| | | | | | | | | | | | | | | | | | | | |
| | | | | |
| | 3,083 | | | | 2,790 | | | | 2,332 | | | | 2,600 | | | | 1,545 | | | Property Taxes |
| | 0 | | | | 0 | | | | 0 | | | | 0 | | | | 0 | | | Property Tax Credits |
| | 852 | | | | 741 | | | | 978 | | | | 558 | | | | 818 | | | Provincial Sales Tax |
| | 364 | | | | 272 | | | | 310 | | | | 330 | | | | 316 | | | Gasoline Tax |
| | | | | | | | | | | | | | | | | | | | |
| | 10,411 | | | | 3,803 | | | | 5,751 | | | | 8,045 | | | | 6,474 | | | Total Provincial Taxes, Credits and Premiums |
| | | | | | | | | | | | | | | | | | | | |
| | | | | |
| | 8,280 | | | | 6,010 | | | | 7,744 | | | | 6,010 | | | | 7,694 | | | Mortgage Costs |
| | 2,149 | | | | 2,879 | | | | 2,704 | | | | 3,974 | | | | 3,641 | | | Utilities |
| | 816 | | | | 942 | | | | 983 | | | | 813 | | | | 1,377 | | | Auto Insurance |
| | | | | | | | | | | | | | | | | | | | |
| | 11,245 | | | | 9,831 | | | | 11,431 | | | | 10,797 | | | | 12,712 | | | Total Living Costs |
| | | | | | | | | | | | | | | | | | | | |
| | 21,656 | | | | 13,634 | | | | 17,182 | | | | 18,842 | | | | 19,186 | | | Total Personal Costs and Taxes |
| | | | | | | | | | | | | | | | | | | | |
Sums may not add due to rounding.
|
C 2 8 / T a x a t i o n A d j u s t m e n t s B U D G E T 2 0 1 2 |
NOTES
Provincial taxes, credits and premiums are based on information available prior to April 1, 2012, (except for Manitoba, which includes Budget 2012 changes) for the following major urban centres in each province: Vancouver, Calgary, Saskatoon, Winnipeg, Toronto, Montréal, Saint John, Halifax, Charlottetown and St. John’s.
Auto insurance coverage includes $2 million Third Party Liability, a $500 All Perils Deductible, accident benefits and $2 million Standard Policy Form #44 family protection coverage for those jurisdictions without no-fault injury coverage, and La Societé de l’Assurance Automobile du Québec injury protection in Montréal. Rates were provided by the Insurance Corporation of British Columbia for British Columbia, SGI Canada for Saskatchewan, and Manitoba Public Insurance (MPI) for Manitoba. Rates for other cities are the average of the quotes from 10 private insurers providing coverage in those provinces. Discounts for second or multiple vehicles, where available, are not included in the auto insurance calculations. Rebates issued by MPI or other insurers are also excluded. Auto insurance for the 2010 Dodge Grand Caravan SE and the 2003 Chevrolet Malibu are used in these examples, two of the more common vehicles driven in Manitoba.
Child-care costs are based on annual parent fees paid, less subsidies, for preschool aged children, typically over two years of age and under six years of age, for 260 days or 12 months per year. Manitoba and Quebec are the only provinces with regulated maximum parent fees. Fees for other provinces are those obtained from provincial offices, online and/or in a survey conducted in the first quarter of 2011.
Gasoline Tax is based on the annual consumption of 3,000 litres. The Gasoline Tax includes all provincial levies on gas, including carbon tax and sales tax where applicable.
Health premiums are annual premiums for hospital insurance and medical services in provinces which levy them. Quebec’s Prescription Drug Plan, Parental Insurance Plan and health contribution are included.
Mortgage costs are based on average home prices for a detached bungalow for the family with $60,000 of income and for the graduate with $50,000 of income, and on an executive detached two-storey for a family with $75,000 of income, from the “Royal LePage Fourth Quarter 2011 Survey of Canadian House Prices,” with one-half of the home price being financed over 25 years at a one-year closed mortgage rate of 3.48%.
Net child benefits represent provincial programs comparable to the Canada Child Tax Benefit for families with children. Provincial child benefit measures are available in British Columbia (Family Bonus and the Earned Income Benefit), Alberta (Family Employment Tax Credit), Manitoba (Child Benefit), Ontario (Trillium Benefit), Quebec (Child Assistance Payments), New Brunswick (Child Tax Benefit and the Working Income Supplement), Nova Scotia (Child Benefit), and Newfoundland and Labrador (Child Benefit).
Property taxes for the family with $60,000 and the graduate with $50,000 of income are based on the estimated taxes for a sample detached bungalow from the City of Edmonton “2010 Residential Property Taxes and Utility Charges Survey” with the exception of Charlottetown whose property tax estimate is based on the Saskatchewan 2012 Budget Paper “2012 Intercity Comparison of Taxes, Utilities and Housing.” Property taxes for the detached bungalow have been proportionally adjusted for a family with $75,000 of income to reflect the taxes paid for an executive detached two storey.
Provincial income tax is calculated for a single renter with $30,000 earned income, a single parent with one preschool child who rents and has $30,000 in earned income, and the two family profiles with $60,000 and $75,000 of earned income, respectively. These incomes are before receipt of the Universal Child Care Benefit (UCCB), but the UCCB is used in the calculation of income tax. For the single parent, UCCB is treated as taxable income of the dependant child. Family profiles include two income earners (one spouse earns 60% of the family income while the other spouse earns 40%) and two preschool
|
B U D G E T 2 0 1 2 T a x a t i o n A d j u s t m e n t s / C 2 9 |
children; or three preschool children. Personal non-refundable credits used include the CPP/QPP and EI contribution credits. For the single parent, child-care costs less subsidies for each province have been deducted from income. For two-earner families, eligible child-care costs have been deducted from the income of the spouse with the lower income. Gross Quebec personal income tax has been reduced by the 16.5% abatement for federal income tax. Refundable sales tax credits and provincial tax reductions and rebates have been deducted from income tax payable. Property tax credits for renters are included in income tax, but property tax credits for homeowners are shown separately.
Rent is from Canada Mortgage and Housing Corporation’s Rental Market Survey, October 2011, and is based on the average one-bedroom apartment rent for each urban centre.
Provincial sales tax is based upon an average expenditure basket at the total income levels from the “2009 Survey of Household Spending” (Statistics Canada), inflated to 2012 values using each province’s Consumer Price Index.
Transit fares are based on adult monthly pass rates in effect in January 2012. The impact of the federal non-refundable public transit tax credit has reduced the cost of transit fees shown for the single individual and single parent with one child examples.
Utilities are based on the Saskatchewan 2012 Budget Paper “2012 Intercity Comparison of Taxes, Utilities and Housing.”
| • | | Home heating charges are based on an annual consumption level of 2,800 cubic metres of natural gas for a detached bungalow for the family with $60,000 of income and the graduate with $50,000 of income. Annual consumption for the detached bungalow has been proportionally adjusted for the executive detached two storey. For the Atlantic provinces, the figures represent the BTU equivalent consumption of fuel oil. |
| • | | Electricity charges are based on the annual consumption of 8,100 kWh for a detached bungalow for the family with $60,000 of income and the graduate with $50,000 of income and 13,500 kWh for the family at $75,000. Annual consumption of 4,500 kWh is used for the single person and single-parent renters. Rates do not include municipal taxes. |
|
C 3 0 / T a x a t i o n A d j u s t m e n t s B U D G E T 2 0 1 2 |
MANITOBA’S COMPETITIVE ENVIRONMENT FOR MANUFACTURING
Competitive operating costs and taxes have made Manitoba one of the least expensive provinces in Canada to do business. Among representative North American cities, both smaller and larger manufacturers in Brandon and Winnipeg rank at or near the best on start-up costs, net income, overall taxes and return on investment. Manitoba’s competitive business environment continues to position Manitoba as an ideal manufacturing location due to:
| • | | its central location and excellent transportation links to the rest of North America, including CentrePort Canada |
| • | | low industrial and commercial land costs |
| • | | electricity costs which are among the lowest in the world |
| • | | a skilled, well-educated and affordable work force |
| • | | one of the best R&D tax credit regimes |
| • | | low taxes on capital investments. |
| | |
Manitoba Finance’s competitiveness model compares the tax structure and cost environment for representative smaller and larger manufacturing firms relative to several other North American cities. The model simulates start-up, operating, financial and taxation costs over a period of 20 years. It incorporates future unconditional changes in taxes that have been announced by the federal, provincial, state or local governments. The representative firms’ profiles have been updated using the most recent data available from Statistics Canada, local economic development boards and other public sources. | | Payroll-Related Taxes and Levies per Employee, Larger Manufacturing Firm Winnipeg and Atlanta, 2012 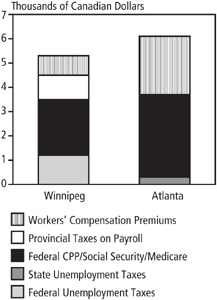
Source: Manitoba Finance |
Payroll-related Levies U.S. employers pay federal and state unemployment taxes, social security tax and medicare tax and are also required to provide workers’ compensation coverage. Canadian employers do not pay provincial unemployment or federal medicare taxes, though some provinces have taxes on payroll. For example, at the same wage level, a firm in Atlanta will have higher payroll-related taxes and levies than in Winnipeg. Interjurisdictional Competitiveness The following indicators are used to assess cost and tax competitiveness for both a smaller and a larger manufacturing firm: • net cost of investment, or start-up costs (including applicable taxes) • pre-tax net income • effective tax rates • internal rates of return. | |
|
B U D G E T 2 0 1 2 T a x a t i o n A d j u s t m e n t s / C 3 1 |
The model uses actual costs for each city and calculates net revenue and cash flow, including start-up costs, based on the operating costs in each location.1 The results for each city are compared to the overall average of all cities (100.0) for each of the indicators and presented in the charts that follow.
Net Cost of Investment
The costs of starting a manufacturing plant (land, buildings, and machinery and equipment) in Manitoba cities are among the lowest of all cities. Investment tax credits on capital asset purchases reduce the net cost of investment. Start-up costs in larger cities tend to be higher due to the cost of land and construction labour wages and salaries.
Pre-Tax Net Income
| | |
Net Cost of Investment Smaller Manufacturing Firm | | Net Cost of Investment Larger Manufacturing Firm |
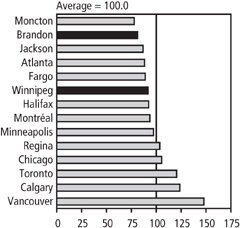
Source: Manitoba Finance | | 
Source: Manitoba Finance |
Pre-tax net income compares Manitoba’s business cost competitiveness to other jurisdictions. It is calculated by deducting production material costs and location-specific costs from fixed annual sales figures. Annual sales are uniform for all locations and are ramped up through epsthe first four years of operation then fixed across the cities at $4 million for the smaller firm and $45 million for March the 30, larger 2012 firm for years five to twenty. Annual production material costs are equal to 46% of sales in a given year.
The following location-specific costs are also deducted from sales:
| • | | average manufacturing wages |
| • | | local utility costs for electricity |
| • | | interest charges on debt used to finance construction of the manufacturing plants |
| 1 | For comparison purposes, U.S. data is converted to Canadian dollars at an exchange rate of C$0.9919 (March 16, 2012 rate). |
|
C 3 2 / T a x a t i o n A d j u s t m e n t s B U D G E T 2 0 1 2 |
| • | | depreciation of capital assets: buildings costs (which vary by city based on local construction wages) and machinery and equipment (which are assumed to be the same across all cities) |
| • | | employer-paid health premiums. |
Brandon yields the highest pre-tax net income for both the smaller and larger manufacturing firms, while Winnipeg has the sixth-highest pre-tax net income for both model firms, which is still above the overall average for all cities.
| | |
Pre-Tax Net Income Smaller Manufacturing Firm | | Pre-Tax Net Income Larger Manufacturing Firm |
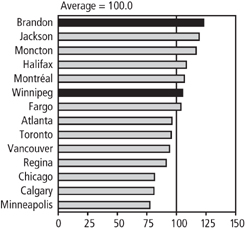
Source: Manitoba Finance | | 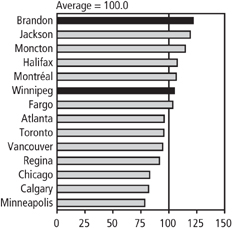
Source: Manitoba Finance |
Effective Tax Rates
Effective tax rates are generated by computing gross taxes as a proportion of pre-tax net income over the 20-year period. The following annual taxes are taken into account:
| • | | corporation income taxes |
| • | | local property and business taxes |
| • | | corporation capital and U.S. franchise taxes |
| • | | workers’ compensation premiums |
| • | | statutory pension and unemployment insurance premiums. |
For U.S. firms, employer-paid health premiums are also included.
The following tax expenditures that benefit the manufacturing sector are also taken into account:
| • | | accelerated capital cost allowances |
| • | | preferential tax rates. |
|
B U D G E T 2 0 1 2 T a x a t i o n A d j u s t m e n t s / C 3 3 |
Not included are enterprise zones, grants, and other forms of governmental and third-party financial assistance programs that are subject to an approval process.
For both the smaller and larger manufacturing firms, both Winnipeg’s and Brandon’s effective tax rates are well below the overall average (100.0).
| | |
Effective Tax Rates Smaller Manufacturing Firm | | Effective Tax Rates Larger Manufacturing Firm |
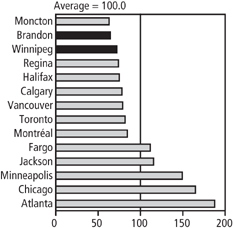
Source: Manitoba Finance | | 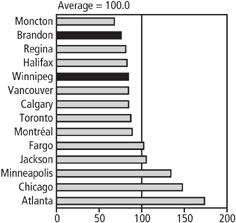
Source: Manitoba Finance |
Overall Competitiveness
Overall competitiveness is compared by calculating internal rates of return, which are commonly used by business in making investment and location decisions. A higher internal rate of return indicates a city is more competitive than others. Internal rates of return for each city are calculated using start-up costs and cash March flow 30, 2012 over a 20-year period, specific to a smaller and a larger manufacturing firm, then discounted using applicable Canadian and U.S. commercial interest rates. The following charts illustrate Fixed: the combined impact of taxes and costs on the Fixed: internal rates of return for the representative smaller and larger manufacturing corporations in the selected jurisdictions.
The internal rates of return for both Winnipeg and Brandon are above the overall average of the cities included in the study. Brandon has the highest internal rate of return. Winnipeg has the third-highest internal rate of return for the smaller manufacturing firm and the fourth-highest internal rate of return for the larger manufacturing firm.
Among cities with populations over 500,000, Winnipeg has the highest internal rate of return for both smaller and larger manufacturing firms.
|
C 3 4 / T a x a t i o n A d j u s t m e n t s B U D G E T 2 0 1 2 |
| | |
Internal Rates of Return Smaller Manufacturing Firm | | Internal Rates of Return Larger Manufacturing Firm |
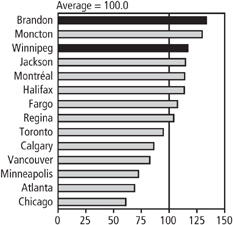
Source: Manitoba Finance | | 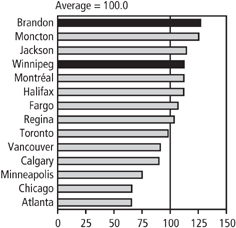
Source: Manitoba Finance |
| | |
Internal Rates of Return Smaller Manufacturing Firm in Cities over 500,000 | | Internal Rates of Return Larger Manufacturing Firm in Cities over 500,000 |
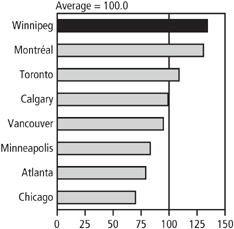
Source: Manitoba Finance | | 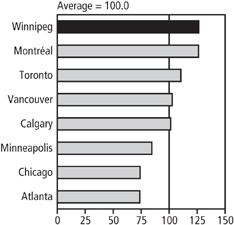
Source: Manitoba Finance |
¢ CONCLUSION
Manitoba continues to maintain a highly competitive overall business cost and tax environment for both smaller and larger firms engaged in manufacturing and processing.
Manitoba Finance’s March findings 31, 2012are consistent with the recently published March “Competitive 31, 2012 Alternatives 2012: KPMG’s Guide to International Business Location Costs,” which analyzes business Fixed: costs and other competitiveness factors of more than 110 cities in 14 countries. In the KPMG study, Winnipeg once again ranked as the most competitive among 25 larger North American mid-western cities. When smaller centres are included, Brandon ranked third and Winnipeg’s rank moves to fifth most competitive of 32 cities. Manitoba’s most cost-effective industries were in the R&D, digital and corporate services sectors (biotechnology, clinical trials, electronic product testing, digital entertainment, software design, professional services and support services).