Exhibit 99.1
B U D G E T 2 0 1 3 / 1
SUMMARY BUDGET 2013/14
2 / B U D G E T 2 0 1 3
SUMMARY BUDGET
For the Fiscal Year Ending March 31, 2014
With Comparative Data for the year ending March 31, 2013
| | | | | | | | | | | | | | | | | | | | | | | | | | |
| | | | | | | | | | | | | | | | Per Cent Change 2013/14 Budget from |
| | | 2013/14 Budget | | | | | 2012/13 Forecast | | | | | 2012/13 Budget | | | | | 2012/13 Forecast | | | | 2012/13 Budget | | |
| | | (Millions of Dollars) | | | | | | | | | | | |
REVENUE SOURCE | | | | | | | | | | | | | | | | | | | | | | | | | | |
Income Taxes | | | 3,366 | | | | | | 3,291 | | | | | | 3,202 | | | | | 2.3 | | | | 5.1 | | |
Other Taxes | | | 4,015 | | | | | | 3,630 | | | | | | 3,684 | | | | | 10.6 | | | | 9.0 | | |
Fees and Other Revenue | | | 1,987 | | | | | | 2,027 | | | | | | 2,009 | | | | | (2.0) | | | | (1.1) | | |
Federal Transfers | | | 3,849 | | | | | | 3,898 | | | | | | 3,889 | | | | | (1.3) | | | | (1.0) | | |
Net Income of Government Business Enterprises | | | 738 | | | | | | 685 | | | | | | 722 | | | | | 7.7 | | | | 2.2 | | |
Sinking Funds and Other Earnings | | | 227 | | | | | | 233 | | | | | | 241 | | | | | (2.6) | | | | (5.8) | | |
| | | | | | | | | | | | | | | | | | | | | | | | | | |
TOTAL REVENUE | | | 14,182 | | | | | | 13,764 | | | | | | 13,747 | | | | | 3.0 | | | | 3.2 | | |
| | | | | | | | | | | | | | | | | | | | | | | | | | |
EXPENDITURE SECTORS | | | | | | | | | | | | | | | | | | | | | | | | | | |
Health | | | 5,660 | | | | | | 5,416 | | | | | | 5,547 | | | | | 4.5 | | | | 2.0 | | |
Education | | | 3,807 | | | | | | 3,643 | | | | | | 3,605 | | | | | 4.5 | | | | 5.6 | | |
Family Services | | | 1,133 | | | | | | 1,109 | | | | | | 1,066 | | | | | 2.2 | | | | 6.3 | | |
Community, Economic and Resource Development | | | 2,484 | | | | | | 2,466 | | | | | | 2,447 | | | | | 0.7 | | | | 1.5 | | |
Justice and Other Expenditures | | | 924 | | | | | | 950 | | | | | | 925 | | | | | (2.7) | | | | (0.1) | | |
Debt Servicing Costs | | | 839 | | | | | | 820 | | | | | | 858 | | | | | 2.3 | | | | (2.2) | | |
| | | | | | | | | | | | | | | | | | | | | | | | | | |
TOTAL EXPENDITURE | | | 14,847 | | | | | | 14,404 | | | | | | 14,448 | | | | | 3.1 | | | | 2.8 | | |
In-Year Adjustments/Lapse | | | (150) | | | | | | (57) | | | | | | (241) | | | | | | | | | | | |
| | | | | | | | | | | | | | | | | | | | | | | | | | |
NET RESULT FOR THE YEAR | | | (515) | | | | | | (583) | | | | | | (460) | | | | | | | | | | | |
| | | | | | | | | | | | | | | | | | | | | | | | | | |
2013 SPRING FLOOD CONTINGENCY | | | | | | | | | | | | | | | | | | | | | | | | | | |
Expenditures | | | (30) | | | | | | - | | | | | | - | | | | | | | | | | | |
Recovery from Disaster Financial Assistance | | | 27 | | | | | | - | | | | | | - | | | | | | | | | | | |
| | | | | | | | | | | | | | | | | | | | | | | | | | |
TOTAL 2013 SPRING FLOOD CONTINGENCY | | | (3) | | | | | | - | | | | | | - | | | | | | | | | | | |
| | | | | | | | | | | | | | | | | | | | | | | | | | |
NET INCOME (LOSS) | | | (518) | | | | | | (583) | | | | | | (460) | | | | | | | | | | | |
| | | | | | | | | | | | | | | | | | | | | | | | | | |
NOTES:
| — | | The 2012/13 Budget numbers originally presented in the 2012 Budget Address and the 2012/13 forecast from the Third Quarter Financial Report have been re-stated to be consistent with the current presentation for the GRE. |
| — | | Details of Expenditure and Revenue for Fiscal Year 2013/14, and a reconciliation to the amounts reported for core government are found in Schedules 1 and 2. |
| — | | The 2012/13 expenditure forecast includes reductions related to Program Portfolio Management Reviews. |
| — | | In-Year Adjustments/Lapse could be an increase in revenue and/or decrease in expenditure. |
| — | | The 2012/13 Budget In-Year Adjustments/Lapse includes $128 million for the Program Portfolio Management Reviews. |
| — | | Numbers may not add due to rounding. |
B U D G E T 2 0 1 3 / 3
Revenue
Revenue in 2013/14, including new revenue measures, is projected to increase $418 million or 3% from the 2012/13 Forecast.
Income taxes are projected to increase by $75 million, with a $109 million increase in Individual Income Tax offset by a decrease of $34 million in Corporation Income Tax. Budget 2013 projects a $385 million or 10.6%, increase in other taxes, principally reflecting an increase in retail sales tax. Fees and Other Revenue are projected to decline $40 million or 2%. Net Income of Government Business Enterprises (GBEs) is projected to increase $53 million or 7.7%. Federal transfers are projected to decrease $49 million or 1.3%.
Expenditure
Total expenditure is budgeted to increase $443 million or 3.1% from the 2012/13 Forecast.
The growth in Health expenditure is $244 million or 4.5%. Education-related expenditure is increasing by $164 million or 4.5%. Family Services is up $24 million or 2.2%. Community, Economic and Resource Development expenditure will increase by $18 million or 0.7%. Manitoba Justice is increasing by $13 million or 2.6%. Overall, the Justice and Other Expenditures sector will decrease by $26 million or 2.7%. Debt Servicing Costs are expected to increase by $19 million.1
In Budget 2013, services to people represent 76.3% of spending.
Health expenditure makes up 38.1% of total expenditure.
Education accounts for 25.6% of all expenditure; it includes public schools and post-secondary institutions.
Family Services, Justice, and Housing and Community Development represent 12.6% of total expenditure.
| 1 | Debt Servicing Costs are forecast to equal 5.9¢ of every dollar of revenue in 2013/14, down 55.3% from 13.2¢ per dollar in 1999/2000. |
4 / B U D G E T 2 0 1 3
Schedule 1
Summary Revenue Estimate: Details and Reconciliation to Core Government Estimates
Fiscal Year ending March 31, 2014 (in Thousands of Dollars)
| | | | | | | | | | | | | | | |
| | | CORE GOVERNMENT | | CONSOLIDATION IMPACTS | | SUMMARY |
| Source of Revenue | | Revenue
Estimate | | and Revenue of Other
Reporting Entities | | |
| | | |
Income Taxes | | | | | | | | | | | | | | | |
Individual Income Tax | | | | 2,952,400 | | | | | - | | | | | 2,952,400 | |
Corporation Income Tax | | | | 413,200 | | | | | - | | | | | 413,200 | |
| | | | | | | | | | | | | | | |
Subtotal: Income Taxes | | | | 3,365,600 | | | | | - | | | | | 3,365,600 | |
| | | | | | | | | | | | | | | |
Other Taxes | | | | | | | | | | | | | | | |
Corporations Taxes | | | | 227,000 | | | | | - | | | | | 227,000 | |
Fuel Taxes | | | | 312,100 | | | | | 13,700 | | | | | 325,800 | |
Land Transfer Tax | | | | 74,000 | | | | | - | | | | | 74,000 | |
Levy for Health and Education | | | | 433,500 | | | | | (107,472) | | | | | 326,028 | |
Mining Tax | | | | 40,000 | | | | | - | | | | | 40,000 | |
Retail Sales Tax | | | | 2,047,200 | | | | | - | | | | | 2,047,200 | |
Tobacco Tax | | | | 283,000 | | | | | - | | | | | 283,000 | |
Other Taxes | | | | 16,173 | | | | | - | | | | | 16,173 | |
Education Property Taxes | | | | - | | | | | 676,019 | | | | | 676,019 | |
| | | | | | | | | | | | | | | |
Subtotal: Other Taxes | | | | 3,432,973 | | | | | 582,247 | | | | | 4,015,220 | |
| | | | | | | | | | | | | | | |
Fees and Other Revenue | | | | | | | | | | | | | | | |
Fines and Costs and Other Legal | | | | 52,030 | | | | | - | | | | | 52,030 | |
Minerals and Petroleum | | | | 29,074 | | | | | - | | | | | 29,074 | |
Automobile and Motor Carrier Licences and Fees | | | | 140,530 | | | | | - | | | | | 140,530 | |
Parks: Forestry and Other Conservation | | | | 32,446 | | | | | - | | | | | 32,446 | |
Water Power Rentals | | | | 107,700 | | | | | - | | | | | 107,700 | |
Service Fees and Other Miscellaneous Charges | | | | 166,196 | | | | | 1,174,579 | | | | | 1,340,775 | |
Revenue Sharing from SOAs | | | | 16,880 | | | | | - | | | | | 16,880 | |
Tuition Fees | | | | - | | | | | 267,673 | | | | | 267,673 | |
| | | | | | | | | | | | | | | |
Subtotal: Fees and Other Revenue | | | | 544,856 | | | | | 1,442,252 | | | | | 1,987,108 | |
| | | | | | | | | | | | | | | |
Federal Transfers | | | | | | | | | | | | | | | |
Equalization | | | | 1,799,228 | | | | | - | | | | | 1,799,228 | |
Canada Health Transfer | | | | 1,120,800 | | | | | - | | | | | 1,120,800 | |
Canada Social Transfer | | | | 442,753 | | | | | - | | | | | 442,753 | |
Health Funds | | | | 9,062 | | | | | - | | | | | 9,062 | |
Infrastructure Renewal | | | | 22,100 | | | | | - | | | | | 22,100 | |
Shared Cost and Other Transfers | | | | 144,403 | | | | | 310,440 | | | | | 454,843 | |
| | | | | | | | | | | | | | | |
Subtotal: Federal Transfers | | | | 3,538,346 | | | | | 310,440 | | | | | 3,848,786 | |
| | | | | | | | | | | | | | | |
Net Income of Government | | | | | | | | | | | | | | | |
Business Enterprises (GBEs) | | | | | | | | | | | | | | | |
Manitoba Liquor and Lotteries Corporation | | | | 615,055 | | | | | - | | | | | 615,055 | |
Deposit Guarantee Corporation | | | | - | | | | | 21,561 | | | | | 21,561 | |
Manitoba Hydro | | | | - | | | | | 72,000 | | | | | 72,000 | |
Workers Compensation Board | | | | - | | | | | 10,608 | | | | | 10,608 | |
Manitoba Public Insurance Corporation | | | | - | | | | | 18,234 | | | | | 18,234 | |
| | | | | | | | | | | | | | | |
Subtotal: Net Income of GBEs | | | | 615,055 | | | | | 122,403 | | | | | 737,458 | |
| | | | | | | | | | | | | | | |
Sinking Funds and Other Earnings | | | | - | | | | | 227,302 | | | | | 227,302 | |
| | | | | | | | | | | | | | | |
Total Revenue Estimate | | | | 11,496,830 | | | | | 2,684,644 | | | | | 14,181,474 | |
| | | | | | | | | | | | | | | |
NOTE: Legislation to effect the merger of Manitoba Liquor Control Commission and Manitoba Lotteries Corporation will be introduced in the spring session.
B U D G E T 2 0 1 3 / 5
Schedule 2
Summary Expenditure Estimate: Details, Reconciliation to Core Government Estimates and Summary Budget Result
Fiscal Year ending March 31, 2014 (in Thousands of Dollars)
| | | | | | | | | | | | | | | |
| | | CORE GOVERNMENT | | CONSOLIDATION IMPACTS | | SUMMARY |
| Sector/Department | | Expenditure
Estimate | | and Expenditures of Other
Reporting Entities | | |
Health | | | | | | | | | | | | | | | |
Health | | | | 5,230,778 | | | | | 364,592 | | | | | 5,595,370 | |
Healthy Living, Seniors and Consumer Affairs | | | | 55,490 | | | | | 9,112 | | | | | 64,602 | |
| | | | | | | | | | | | | | | |
Total Health | | | | 5,286,268 | | | | | 373,704 | | | | | 5,659,972 | |
| | | | | | | | | | | | | | | |
Education | | | | | | | | | | | | | | | |
Advanced Education and Literacy | | | | 707,662 | | | | | 599,810 | | | | | 1,307,472 | |
Education | | | | 1,681,786 | | | | | 817,971 | | | | | 2,499,757 | |
| | | | | | | | | | | | | | | |
Total Education | | | | 2,389,448 | | | | | 1,417,781 | | | | | 3,807,229 | |
| | | | | | | | | | | | | | | |
Family Services | | | | | | | | | | | | | | | |
Children and Youth Opportunities | | | | 47,910 | | | | | - | | | | | 47,910 | |
Family Services and Labour | | | | 1,097,412 | | | | | (12,034) | | | | | 1,085,378 | |
| | | | | | | | | | | | | | | |
Total Family Services | | | | 1,145,322 | | | | | (12,034) | | | | | 1,133,288 | |
| | | | | | | | | | | | | | | |
Community, Economic and Resource Development | | | | | | | | | | | | | | | |
Aboriginal and Northern Affairs | | | | 34,249 | | | | | 2,902 | | | | | 37,151 | |
Agriculture, Food and Rural Initiatives | | | | 214,643 | | | | | 255,270 | | | | | 469,913 | |
Conservation and Water Stewardship | | | | 146,391 | | | | | (2,155) | | | | | 144,236 | |
Entrepreneurship, Training and Trade | | | | 580,539 | | | | | 22,655 | | | | | 603,194 | |
Housing and Community Development | | | | 82,587 | | | | | 137,178 | | | | | 219,765 | |
Infrastructure and Transportation | | | | 639,203 | | | | | (140,898) | | | | | 498,305 | |
Innovation, Energy and Mines | | | | 85,136 | | | | | 23,277 | | | | | 108,413 | |
Local Government | | | | 398,678 | | | | | 4,663 | | | | | 403,341 | |
| | | | | | | | | | | | | | | |
Total Community, Economic and Resource Development | | | | 2,181,426 | | | | | 302,892 | | | | | 2,484,318 | |
| | | | | | | | | | | | | | | |
Justice and Other Expenditures | | | | | | | | | | | | | | | |
Legislative Assembly | | | | 42,560 | | | | | (1,220) | | | | | 41,340 | |
Executive Council | | | | 2,622 | | | | | (133) | | | | | 2,489 | |
Civil Service Commission | | | | 20,200 | | | | | 468 | | | | | 20,668 | |
Culture, Heritage and Tourism | | | | 60,841 | | | | | 5,872 | | | | | 66,713 | |
Employee Pensions and Other Costs | | | | 18,288 | | | | | 52,000 | | | | | 70,288 | |
Finance | | | | 69,166 | | | | | 4,093 | | | | | 73,259 | |
Immigration and Multiculturalism | | | | 16,892 | | | | | 11,114 | | | | | 28,006 | |
Justice | | | | 507,064 | | | | | 13,965 | | | | | 521,029 | |
Sport | | | | 11,770 | | | | | 869 | | | | | 12,639 | |
Enabling Appropriations | | | | 31,623 | | | | | - | | | | | 31,623 | |
Other Appropriations | | | | 55,393 | | | | | - | | | | | 55,393 | |
| | | | | | | | | | | | | | | |
Total Justice and Other Expenditures | | | | 836,419 | | | | | 87,028 | | | | | 923,447 | |
| | | | | | | | | | | | | | | |
Debt Servicing Costs | | | | 230,000 | | | | | 608,682 | | | | | 838,682 | |
| | | | | | | | | | | | | | | |
Total Expenditure Estimate | | | | 12,068,883 | | | | | 2,778,053 | | | | | 14,846,936 | |
Subtract: Total Revenue Estimate (Schedule 1) | | | | 11,496,830 | | | | | 2,684,644 | | | | | 14,181,474 | |
In-Year Adjustments/Lapse | | | | (70,000) | | | | | (80,000) | | | | | (150,000) | |
| | | | | | | | | | | | | | | |
Net Result for the Year | | | | (502,053) | | | | | (13,409) | | | | | (515,462) | |
2013 Spring Flood Contingency | | | | | | | | | | | | | | | |
Expenditures | | | | (30,000) | | | | | - | | | | | (30,000) | |
Recovery from Disaster Financial Assistance | | | | 27,000 | | | | | - | | | | | 27,000 | |
| | | | | | | | | | | | | | | |
Total 2013 Spring Flood | | | | (3,000) | | | | | - | | | | | (3,000) | |
| | | | | | | | | | | | | | | |
NET INCOME (LOSS) | | | | (505,053) | | | | | (13,409) | | | | | (518,462) | |
| | | | | | | | | | | | | | | |
NOTE: In-Year Adjustments/Lapse could be an increase in revenue and/or decrease in expenditures.
6 / B U D G E T 2 0 1 3
B U D G E T 2 0 1 3 / 7
FINANCIAL MANAGEMENT STRATEGY
8 / B U D G E T 2 0 1 3
| ¢ | | FINANCIAL MANAGEMENT STRATEGY 2013/14 |
Financial Management Priorities
The Financial Management Strategy (FMS) sets out the government’s priorities for financial management. It includes four main priority areas with one or more measurable outcomes. Each measurable outcome includes objectives for the current year and for future years.
For 2013/14, the FMS continues to focus on priority areas identified in prior years and reflects government’s balanced approach to return to surplus.
| | |
FINANCIAL MANAGEMENT PRIORITY | | MEASURABLE OUTCOMES |
| |
| Transparency, Accountability and Fiscal Discipline | | — Summary Budget Outlook |
| |
| | — Maintaining Accountability for Core Government Program Expenditure and Revenue |
| |
| Stable and Affordable Government | | — Credit Ratings |
| |
| | — Expenditures as a Percentage of Gross Domestic Product (GDP) |
| |
| | — Responsible Management of Public Resources |
| |
| Managing Debt | | — Debt Retirement |
| |
| | — Net Debt to GDP Ratio |
| |
| Infrastructure and Capital Asset Renewal | | — Capital Investments |
| ¢ | | PRIORITY AREA – TRANSPARENCY, ACCOUNTABILITY AND FISCAL DISCIPLINE |
Government has implemented a number of measures to ensure financial accountability and maintain fiscal discipline, including:
| — | | implementing GAAP compliant summary financial statements as of March 31, 2005; |
| — | | implementing summary budgeting and reporting in 2007/08 to present comprehensive information on the total cost of providing programs and services to Manitobans and how the GRE operates as a whole; |
| — | | publishing a FMS as part of the annual budget and a report on outcomes within six months of the end of the fiscal year; |
| — | | implementing summary quarterly financial reporting, consistent with GAAP as of 2009/10; |
| — | | establishing a plan to reduce the unfunded pension liabilities; |
| — | | funding the employer’s share of current service pension contributions for all employees; and |
| — | | ensuring all capital investments are amortized and all related costs are included in annual appropriations for core government. |
The commitment to transparency, accountability and fiscal discipline continues in Budget 2013, with an update on the balanced financial strategy for 2013/14 and future years.
B U D G E T 2 0 1 3 / 9
Measurable Outcome – Summary Budget Outlook
With slower than anticipated global economic activity in 2011 and 2012, governments around the world continue to be affected by the fragile recovery from the Great Recession. Due to the sluggish recovery, the International Monetary Fund and other private sector forecasters recently lowered their economic outlook for 2013. While Manitoba’s economy has traditionally been one of the most stable in Canada, economic growth continues to be modest. The current Manitoba Finance survey of forecasters calls for 2.2% GDP growth in 2012, slowing to 1.9% in 2013. With global demand improving, Manitoba’s real GDP is expected to increase by 2.3% in 2014.
Budget 2013 reflects an updated multi-year financial strategy projecting a return to balance in 2016/17. Manitoba continues to be committed to a balanced approach for delivering services, while recognizing the continued uncertainty in global economies. Budget 2013 demonstrates this balanced approach by focusing on:
| — | | supporting economic growth by upgrading needed infrastructure, restoring the damage from past floods and making investments to mitigate the impacts of future floods; |
| — | | investing in vital front-line services by continuing to improve health care, education and training, policing and supports for families; |
| — | | managing government spending strategically to ensure Manitobans’ priorities come first; |
| — | | restoring balance and returning to surplus in Budget 2016; and |
| — | | maintaining affordability to keep Manitoba one of the best places to live, work and raise a family. |
Challenges remain for the Canadian economies as they continue to expand at a subdued pace. Manitoba’s updated strategy to return to surplus in Budget 2016 will keep the economy strong and growing.
1 0 / B U D G E T 2 0 1 3
Summary Budget Outlook
| | | | | | | | | | | | | | | | | | | | | | | | | |
| | | 2012/13 | | 2013/14 | | 2014/15 | | 2015/16 | | 2016/17 |
| | | | | |
| | | Forecast | | Budget | | Projection | | Projection | | Projection |
| | | (Millions of Dollars) |
| | | | | |
REVENUE | | | | | | | | | | | | | | | | | | | | | | | | | |
Core Government1 | | | | 11,143 | | | | | 11,524 | | | | | 11,977 | | | | | 12,449 | | | | | 12,937 | |
Other Reporting Entities2 | | | | 2,621 | | | | | 2,685 | | | | | 2,575 | | | | | 2,618 | | | | | 2,671 | |
| | | | | | | | | | | | | | | | | | | | | | | | | |
TOTAL REVENUE | | | | 13,764 | | | | | 14,209 | | | | | 14,552 | | | | | 15,067 | | | | | 15,608 | |
| | | | | | | | | | | | | | | | | | | | | | | | | |
| | | | | |
EXPENDITURE | | | | | | | | | | | | | | | | | | | | | | | | | |
Core Government Programs and Services1 | | | | 11,825 | | | | | 12,099 | | | | | 12,371 | | | | | 12,639 | | | | | 12,912 | |
Other Reporting Entities2 | | | | 2,579 | | | | | 2,778 | | | | | 2,696 | | | | | 2,742 | | | | | 2,797 | |
| | | | | | | | | | | | | | | | | | | | | | | | | |
TOTAL EXPENDITURE | | | | 14,404 | | | | | 14,877 | | | | | 15,067 | | | | | 15,381 | | | | | 15,709 | |
| | | | | | | | | | | | | | | | | | | | | | | | | |
Re-statement Adjustment | | | | | | | | | | | | | | | | | | | | | | | | | |
In-Year Adjustments/Lapse 3 | | | | (57) | | | | | (150) | | | | | (150) | | | | | (150) | | | | | (150) | |
| | | | | | | | | | | | | | | | | | | | | | | | | |
SUMMARY NET INCOME (LOSS) | | | | (583) | | | | | (518) | | | | | (365) | | | | | (164) | | | | | 49 | |
| | | | | | | | | | | | | | | | | | | | | | | | | |
| 1 | Includes 2013 Spring Flood Contingency of $30 million in expenditures offset by $27 million in revenue. |
| 2 | Includes Consolidation Impacts. |
| 3 | In-Year Adjustments/Lapse could be an increase in revenue and/or a decrease in expenditure. |
The summary budget outlook assumes GRE revenue will rise by an average of 3.2% annually from 2013/14 to 2016/17, while GRE expenditures are forecast to increase by an annual average of 1.8% during the same period.
Core government revenue is forecast to rise by an average of 3.9% annually, while core government expenditure will grow by an annual average of 2.2% from 2013/14 to 2016/17.
Core government projections reflect the commitment to return to surplus, while protecting the services Manitoba families need. Budget 2013 makes strategic investments in infrastructure and focuses spending growth on key services. External economic factors associated with developments in the global economy present risks to the economic outlooks for Canada and Manitoba. Given the elevated level of global economic uncertainty, private sector forecasters expect Manitoba’s overall economic growth to remain comparatively stable among provinces. The Manitoba government is committed to balancing summary net income over the medium term and Budget 2013 introduces more responsible, innovative ways to reduce the cost of government and to increase efficiency.
| — | | Entrepreneurship Manitoba is being established to provide an integrated suite of programs and innovative service improvements for entrepreneurs and businesses. |
| — | | The operations of the Financial Institutions Regulation Branch have been integrated in the new Manitoba Financial Services Agency (formerly the Manitoba Securities Commission) to gain efficiencies, while acting in the public interest to protect Manitoba investors. |
| — | | Regional office amalgamations in the departments of Agriculture, Food and Rural Initiatives, Conservation and Water Stewardship, Entrepreneurship Training and Trade, and Infrastructure and Transportation will increase efficiency, while providing core government services. |
| — | | Administrative costs will be contained and the civil service will be reduced by 600 over a three-year period. |
B U D G E T 2 0 1 3 / 1 1
| — | | The 20 per cent rollback on salaries for government ministers will continue. |
| — | | The focus on core government program priorities will continue. |
These measures will result in more efficient use of public resources, declining deficits and the return to balance in 2016/17.
As part of the renewal of Manitoba’s Video Lottery Terminal (VLT) program, Manitoba Liquor and Lotteries Corporation will enhance opportunities for VLT siteholders through the replacement of all VLTs across the province, increasing the number of VLTs by up to five machines for selected high-performing commercial sites, and adjusting the commission structure to benefit smaller sites. As well, additional machines will be made available to higher performing First Nations sites.
The deficit to GDP ratio measures a government’s fiscal deficit, or the amount by which budgetary expenditures exceed revenues, in relation to the size of the overall economy. Broadly, it is an indicator of the size of the shortfall relative to all economic activity in the jurisdiction. Comparing this ratio over time permits an eventuation of the trend in the deficit. Manitoba’s deficit as a percentage of GDP in 2013/14 is forecast at (0.8)%, down from the 2012/13 forecast of (1.0)%. This percentage is declining, demonstrating the commitment to achieve improved fiscal balances.
The balanced approach includes amendments to legislation that recognize the challenging economic conditions, while continuing to require a responsible plan to restore balance and provide a sustainable funding source for needed infrastructure. These amendments will:
| — | | maintain the requirement to eliminate the budget shortfall with a return to surplus in 2016/17; |
| — | | keep the legal requirement to have balanced budgets into the future; |
| — | | include the provision for annual debt payments to resume once balance is achieved; |
| — | | continue with the provision to utilize the Fiscal Stabilization Account (FSA) to address the amortization of increases in general purpose debt and related interest expenses; |
| — | | recognize the requirement for immediate and future infrastructure investment; and |
| — | | continue with transparency through the reporting requirements. |
Over the past three years, the government will have transferred $360 million out of the fiscal stabilization account to meet the legislative requirement noted above. Budget 2013 includes a $100 million draw for debt repayment only, in recognition of lower than anticipated interest rates.
The annual FMS and a report on outcomes will continue to be published. In addition, in-year financial reporting will provide updates on the progress made in achieving our balanced financial strategy.
1 2 / B U D G E T 2 0 1 3
Measurable Outcome – Maintaining Accountability for Core
Government Program Expenditure and Revenue
Legislation requires government to include a summary of core government expenditures and projected revenues as part of the FMS. This is consistent with the main estimates of expenditure and revenue for the fiscal year.
While core government expenditure will exceed revenue in Budget 2013, Manitoba’s balanced financial strategy shows declining deficits over the medium term, with a return to balance in Budget 2016.
| | | | | |
| Core Government Expenditure and Revenue, 2013/14 | |
| |
| | | (Millions of Dollars) |
| |
Revenue | | | | 11,497 | |
| |
Expenditure | | | | 12,069 | |
| |
In-Year Adjustments/Lapse | | | | (70) | |
| | | | | |
| | | | (502) | |
| |
2013 Spring Flood Contingency | | | | | |
| |
Flood Fighting Expenditures | | | | (30) | |
| |
Recovery from Disaster Financial Assistance | | | | 27 | |
| | | | | |
| | | | (3) | |
| | | | | |
Net Result | | | | (505) | |
| | | | | |
Year-end information on core government revenue and expenditure for 2013/14 will be provided as part of the FMS report on outcomes, scheduled to be released in the fall of 2014.
| ¢ | | PRIORITY AREA – STABLE AND AFFORDABLE GOVERNMENT |
The Manitoba government continues to be one of the most effective governments in Canada in containing costs. Keeping programs affordable is achieved by continuing to improve the way government operates and delivers services.
Manitoba uses public revenues effectively and efficiently to deliver affordable government programs and services.
As part of the balanced financial strategy, government will continue to carefully manage programs and services to protect the priorities of Manitobans.
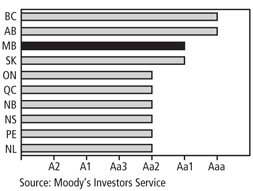
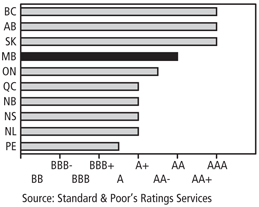
Measurable Outcome – Credit Ratings
Manitoba continues to maintain its reputation for fiscal responsibility. The government’s measured approach to paying down debt and the pension liability, while dealing with the needs in health care and other program areas has been positively acknowledged by credit rating agencies.
This is reflected in the credit rating upgrades Manitoba received from Moody’s Investors Service and by Standard & Poor’s through 2007, and through the re-affirmation of Manitoba’s credit quality by rating agencies in the last five years.
During this period of economic and financial recovery, Manitoba’s stable and diversified economy, strong financial position and commitment to responsible financial management is anticipated to result in a steady credit outlook in 2013. The credit rating agencies are aware of the challenging economic conditions facing all Canadian provinces. Manitoba’s balanced multi-year approach continues to include draws from the fiscal stabilization account to repay debt, while restoring balance.
B U D G E T 2 0 1 3 / 1 3
The Manitoba government remains committed to maintaining fiscal responsibility to achieve stable or improving credit ratings into the future.
| | | | | | | | | | | | | | |
Credit Rating
Agency | | 2007
Actual | | 2008
Actual | | 2009
Actual | | 2010
Actual | | 2011
Actual | | 2012
Actual | | 2013
Actual |
| DBRS | | A(high) | | A(high) | | A(high) | | A(high) | | A(high) | | A(high) | | A(high) |
| Moody’s | | Aa1 | | Aa1 | | Aa1 | | Aa1 | | Aa1 | | Aa1 | | Aa1 |
| Standard & Poor’s | | AA (positive) | | AA | | AA | | AA | | AA | | AA | | AA |
NOTE: As at March 31 (end of fiscal year)
Measurable Outcome – Expenditures as a Percentage of Gross Domestic Production (GDP)
Maintaining stable and affordable government means managing the growth in spending to meet increasing demands for quality services. An effective measure of appropriate spending is the ratio of total expenditures as a percentage of GDP. This ratio has remained relatively stable over the last five years and is budgeted to decline in 2013/14.
Expenditure to GDP ratios are reflected in the following table and as part of Appendix 1, Summary Financial Statistics.
| | | | | | | | | | | | | | | | | | | | | | | | | | | | | | | | | | | |
| | | 2008/09
Actual | | 2009/10
Actual | | 2010/11
Actual | | 2011/12
Actual | | 2012/13
Forecast | | 2013/14
Budget | | 2014/15
Projection |
| | | | | | | | | (Per Cent) | | | | | | |
| | | | | | | |
Core Program Expenditure | | | | 18.9 | | | | | 20.0 | | | | | 19.6 | | | | | 20.8 | | | | | 19.5 | | | | | 19.1 | | | | | 18.8 | |
| | | | | | | |
Other Reporting Entities Expenditure | | | | 3.3 | | | | | 3.4 | | | | | 3.7 | | | | | 3.8 | | | | | 3.4 | | | | | 3.5 | | | | | 3.2 | |
| | | | | | | |
Debt Servicing Costs | | | | 1.6 | | | | | 1.5 | | | | | 1.4 | | | | | 1.4 | | | | | 1.4 | | | | | 1.4 | | | | | 1.3 | |
| | | | | | | |
Total Expenditure | | | | 23.8 | | | | | 24.9 | | | | | 24.7 | | | | | 26.1 | | | | | 24.2 | | | | | 24.0 | | | | | 23.3 | |
The government’s objective is to maintain a stable or declining ratio over the longer term.
Measurable Outcome – Responsible Management of Public Resources
Responsible management and use of public resources are key to making government more effective. The government continues to explore ways to make sure that public spending remains under control and that tax dollars are used effectively and efficiently.
Budget 2013 continues to move forward on containing core government expenditure growth. The balanced financial strategy projects medium-term expenditure growth at 2.2%, enabling declining deficits, with a return to balance in 2016/17. Meeting government priorities and getting back to a balanced budget will require continuing review and reprioritization of existing funding and streamlining internal operations to find opportunities for lowering costs.
The government supports continuous internal review and reform to provide Manitobans with affordable, innovative and effective public service operations, programs and services. Lean management initiatives will be implemented throughout the year in support of this commitment. This will include continued rationalization of government offices and co-locating departmental staff where appropriate, while ensuring service levels remain constant.
The government will continue to emphasize reforms that improve accountability and transparency and sustainable programs that protect the priorities of Manitobans, including its commitment to reduce the civil service by 600 over three years. Measures have been implemented to meet the commitment.
1 4 / B U D G E T 2 0 1 3
| ¢ | | PRIORITY AREA – MANAGING DEBT |
Over the years, the government has continued to implement specific initiatives to ensure sound fiscal management. These include:
| — | | addressing the unfunded pension liability; |
| — | | funding the employer’s share of current service pension entitlements; |
| — | | ensuring all capital investments are amortized and all related costs are fully reflected in annual appropriations for core government; and |
| — | | establishing a plan to address core government deficits during the economic recovery period. |
Solid debt management consists of a plan to address general purpose debt and the pension liability while making needed investments in Manitoba. The net debt to GDP ratio is one of the key indicators used by credit rating agencies in their analysis of provincial governments because it measures the level of debt relative to a province’s financial capacity. Like all other Canadian jurisdictions, the impact of the economic downturn was an increase in Manitoba’s net debt to GDP ratio. Consistent with the Summary Budget Outlook, this ratio stabilizes in 2014/15 and returns to a downward trend by 2015/16.
Measurable Outcome – Debt Retirement
The government has contributed almost $1 billion to reduce the general purpose debt and meet pension obligations. Direct action to address the unfunded pension liabilities for the Civil Service Superannuation Plan (CSSP) and the Teachers’ Retirement Allowances Fund (TRAF) began in 2007/08 with the government borrowing funds that would be invested by these two pension plans on behalf of the government.
Borrowing funds to pay down the previously unfunded pension liability is a sound fiscal decision, when the cost of borrowing is less than the actuarially determined expected rate of return on the plan assets and the rate of growth in the pension liability.
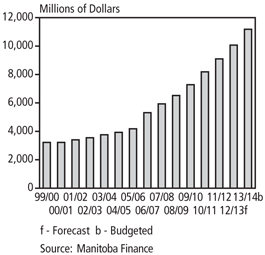
Since 2000, over $4.1 billion have been directed to pension obligations, including over $615 million of the annual debt retirement payments, $2.6 billion in new investment provided by the government since 2007 and net investment earnings projected to be $911 million by March 31, 2014. In addition, Budget 2013 includes $176 million in core government expenditures for the employer’s share of current service pension obligations.
Tangible Capital Assets –
Net Book Value
The potential benefits from borrowing to pay down pension liability are especially favourable in times like these with historically low interest rates. This is why the government will be assessing the merits of another round of borrowing to pay down some portion of the remaining unfunded liability.
The government continues to recognize capital investment as a priority in order to support economic growth and provide for the services Manitobans need in the future. The cost of these assets is amortized over a set period that represents the useful life of the asset as required by GAAP. The end result is increased infrastructure investment for Manitobans, accompanied by a fixed discipline for paying down the associated debt.
The investment in tangible capital assets has increased steadily over the last decade, and with the $1.7 billion investment in Budget 2013, is projected to total $18.7 billion at March 31, 2014, with $7.5 billion of
B U D G E T 2 0 1 3 / 1 5
related debt retired through accumulated amortization. The net book value of these assets (cost less accumulated amortization) has more than tripled since 1999/2000 to $11.2 billion.
Manitoba’s communities and the economy have benefited over the years from the significant investment in public capital assets such as health facilities, universities, colleges and schools as well as infrastructure assets such as roads, water-control structures and parks. To meet the needs of today’s and future generations, it is necessary to continue to invest in renewal of these assets. The public good provided by these investments is immeasurable. It is estimated that the insured or replacement value of these investments exceeds $38 billion.
Based on projections, core government will have a total of $7.6 billion in capital asset investments at March 31, 2014, and $2.6 billion of related debt will have been retired through accumulated amortization.
A total of $353 million has been included in core government appropriations to retire debt associated with capital investments – $214 million for amortization of department owned assets and $139 million for principal payments for education and health-related assets.
Two thousand and eight saw the onset of the worst global economic downturn in a generation. Throughout the period of economic weakness, the government acted to stimulate the economy, protect jobs and preserve key services. This strategy helped Manitoba fare better than most provinces in weathering the recession. In 2011 and 2012, even as Manitoba’s economic and fiscal recovery was challenged by a historically weak global economic recovery, the government was also forced to confront the devastating effects of flooding. As the government continues to work toward returning to balance, it will benefit from the past key investments in the economy and from the commitment to fiscal prudence – including a healthy FSA that will help mitigate the deficits expected in core government operations.
Replacement Value of Public Assets1
Per Cent of Total
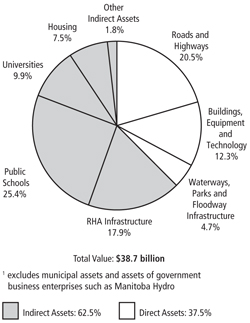
Totals may not add due to rounding.
The government’s balanced financial strategy maintains the legislated requirement to utilize the FSA for the amortization of increases in the general purpose debt, including related interest expenses that are attributable to negative net results incurred during the period of economic recovery. Existing funds in the Debt Retirement Account (DRA) were withdrawn in 2010/11 to repay $145 million of debt and further debt payments of $340 million have been made by withdrawal from the FSA – $90 million in 2010/11, $110 million in 2011/12 and $140 million in 2012/13. Budget 2013 provides for an additional debt payment of $100 million, for a total payment of $585 million. With a return to surplus position in Budget 2016, scheduled debt payments for general purpose debt will resume.
The government has a solid debt management plan which includes addressing the previously unfunded pension liability, budgeting for the employer’s share of current service entitlements for all employees, ensuring all capital investments are amortized and all related costs are fully reflected in annual appropriations, and continuing to make debt repayments to mitigate core government operating deficits.
Strategic decision making has resulted in debt servicing costs as a percentage of revenue remaining constant. Since 1999/2000, the debt servicing cost rate has dropped by 55.3%, from 13.2¢ of every dollar of summary revenue collected to a forecasted level of 5.9¢ in Budget 2013.
Although the lingering financial uncertainty slowed progress, the government remains committed to reducing debt over time with an ultimate goal of eliminating the general purpose debt and the remaining unfunded pension liabilities.
1 6 / B U D G E T 2 0 1 3
Measurable Outcome – Net Debt to GDP Ratio
Summary net debt is financial assets (such as cash or investments) minus total liabilities (such as loans or financing). It is the remaining liability that must be financed by future revenues.
Net debt may grow from time to time, as needed investments in capital assets – like the Red River Floodway, highway infrastructure and economic stimulus investments – are made. These forward-looking investments help support Manitoba’s economy.
Therefore, it is important to measure changes in net debt against the growth of the economy as measured by the nominal GDP.
Manitoba’s net debt to GDP has declined from 32.9% in 1999/2000 to a forecasted 28.7% in Budget 2013.
The government acknowledges that the ratio does need to rise in the short term as it makes needed investments in infrastructure projects, restores the damage from past floods and invests to mitigate impacts of future floods.
The outlook is for a decline in this ratio in 2015/16, demonstrating the government’s commitment to return to a downward trend over the longer term.
| ¢ | | PRIORITY AREA – INFRASTRUCTURE AND CAPITAL ASSET RENEWAL |
Building and upgrading Manitoba’s infrastructure has been a priority for the government since 1999. The government announced a four-year, $4.7 billion economic stimulus investment plan in November 2008 to fund key infrastructure projects across the province. Manitoba has also dedicated revenue raised through fuel taxes to fund infrastructure and in 2011, legislated the equivalent of one-seventh of the provincial sales tax revenue to support investment in municipal infrastructure and public transit. Record levels of investment in roads and bridges, water and wastewater treatment plants, health facilities, and schools, colleges and universities have driven growth and created a wealth of economic opportunities across the province.
Budget 2013 reinforces the commitment to infrastructure funding by continuing to support public service structures and systems that benefit the people of Manitoba. This investment includes projects to restore the damages from past floods and mitigate impacts of future floods.
Measurable Outcome – Capital Investments
Based on principles of sound financial management, the government has been able to increase its assets, while maintaining a sustainable level of debt. Since 2000, the government has invested $11.3 billion in public capital assets, including: $3.8 billion for new or renewed hospitals, universities, colleges and public schools; $4.3 billion to upgrade Manitoba’s roads and highways; and $3.2 billion for the Manitoba Floodway, the modernization and improvement of social housing, improving public service buildings and parks and camping infrastructure.
It is estimated that the insured or replacement value of these investments is more than $38 billion (see chart page 15).
Budget 2013 invests in much needed flood-related and other infrastructure to meet the needs of Manitobans into the future. This includes upgrading roads and highways, wastewater treatment plants, health facilities across the province, building and restoring much needed social housing, and modernizing our schools and post-secondary institutions.
B U D G E T 2 0 1 3 / 1 7
Budget 2013 includes capital investment of $1.8 billion to support continued economic growth, reduce the maintenance burden and provide for the services Manitobans need in the future as outlined in the table below.
| | | | | |
| | | 2013/14 |
| | | (Millions of Dollars) |
| |
Roads and Highways (including preservation and winter roads) | | | | 622 | |
| |
Universities, Colleges and Public Schools | | | | 228 | |
| |
Health Facilities | | | | 350 | |
| |
Manitoba Floodway and Water-Related Infrastructure | | | | 48 | |
| |
Housing (including third-party contributions) | | | | 333 | |
| |
Assistance to Third Parties | | | | 123 | |
| |
Public Service Buildings | | | | 71 | |
| |
Parks and Camping Infrastructure | | | | 24 | |
| |
| | | | | |
| | | | 1,799 | |
| | | | | |
The government’s commitment to infrastructure investments and renewal of existing assets, while maintaining a fiscally responsible approach to budgeting and debt management, will continue to deliver benefits to Manitobans.
1 8 / B U D G E T 2 0 1 3
B U D G E T 2 0 1 3 / 1 9
APPENDIX 1
MANITOBA SUMMARY FINANCIAL STATISTICS
2 0 / B U D G E T 2 0 1 3
Manitoba Summary Financial Statistics
| | | | | | | | | | | | | | | | | | | | | | | | |
| | | 2013/14 Budget | | | 2012/13 Forecast | | | 2011/12 Actual | | | 2010/11 Actual | | | 2009/10 Actual | | | 2008/09 Actual | |
| SUMMARY FINANCIAL STATEMENTS | | (Millions of Dollars) | |
| | | | | | |
Revenue | | | | | | | | | | | | | | | | | | | | | | | | |
Income Taxes | | | 3,366 | | | | 3,291 | | | | 3,124 | | | | 2,922 | | | | 2,659 | | | | 2,841 | |
Other Taxes | | | 4,015 | | | | 3,630 | | | | 3,531 | | | | 3,406 | | | | 3,281 | | | | 3,276 | |
Fees and Other Revenue | | | 1,987 | | | | 2,027 | | | | 1,906 | | | | 1,828 | | | | 1,792 | | | | 1,722 | |
Federal Transfers | | | 3,849 | | | | 3,898 | | | | 4,332 | | | | 4,047 | | | | 3,924 | | | | 3,866 | |
Net Income of Government Business Enterprises | | | 738 | | | | 685 | | | | 713 | | | | 807 | | | | 789 | | | | 764 | |
Sinking Funds and Other Earnings | | | 227 | | | | 233 | | | | 249 | | | | 230 | | | | 220 | | | | 296 | |
| | | | | | | | | | | | | | | | | | | | | | | | |
Total Revenue | | | 14,182 | | | | 13,764 | | | | 13,855 | | | | 13,240 | | | | 12,665 | | | | 12,765 | |
| | | | | | | | | | | | | | | | | | | | | | | | |
Expenditure | | | | | | | | | | | | | | | | | | | | | | | | |
Health | | | 5,660 | | | | 5,416 | | | | 5,328 | | | | 5,044 | | | | 4,831 | | | | 4,590 | |
Education | | | 3,807 | | | | 3,643 | | | | 3,489 | | | | 3,330 | | | | 3,227 | | | | 3,091 | |
Family Services | | | 1,133 | | | | 1,109 | | | | 1,013 | | | | 978 | | | | 1,295 | | | | 1,192 | |
Community, Economic and Resource Development | | | 2,484 | | | | 2,466 | | | | 2,771 | | | | 2,400 | | | | 1,813 | | | | 1,729 | |
Justice and Other Expenditures | | | 924 | | | | 950 | | | | 1,438 | | | | 894 | | | | 926 | | | | 882 | |
Debt Servicing Costs | | | 839 | | | | 820 | | | | 815 | | | | 773 | | | | 756 | | | | 830 | |
| | | | | | | | | | | | | | | | | | | | | | | | |
Total Expenditure | | | 14,847 | | | | 14,404 | | | | 14,854 | | | | 13,419 | | | | 12,848 | | | | 12,314 | |
| | | | | | |
In-Year Adjustments/Lapse | | | (150) | | | | (57) | | | | - | | | | - | | | | - | | | | - | |
| | | | | | | | | | | | | | | | | | | | | | | | |
Net Result for the Year | | | (515) | | | | (583) | | | | (999) | | | | (179) | | | | (183) | | | | 451 | |
| | | | | | |
2013 Spring Flood Contingency | | | | | | | | | | | | | | | | | | | | | | | | |
Expenditures | | | (30) | | | | - | | | | - | | | | - | | | | - | | | | - | |
Recovery from Disaster Financial Assistance | | | 27 | | | | - | | | | - | | | | - | | | | - | | | | - | |
| | | | | | | | | | | | | | | | | | | | | | | | |
Total 2013 Spring Flood Contingency | | | (3) | | | | - | | | | - | | | | - | | | | - | | | | - | |
| | | | | | | | | | | | | | | | | | | | | | | | |
Net Income (Loss) | | | (518) | | | | (583) | | | | (999) | | | | (179) | | | | (183) | | | | 451 | |
| | | | | | | | | | | | | | | | | | | | | | | | |
Provincial Borrowings, Guarantees & Obligations | | | | | | | | | | | | | | | | | | | | | | | | |
General Government Programs | | | 8,659 | | | | 8,254 | | | | 7,803 | | | | 6,955 | | | | 6,863 | | | | 6,400 | |
General Government Programs - Federal Flood Relief | | | - | | | | 276 | | | | 326 | | | | - | | | | - | | | | - | |
General Government Programs - Pension Liability | | | 2,595 | | | | 2,595 | | | | 2,595 | | | | 2,355 | | | | 2,175 | | | | 1,850 | |
The Manitoba Hydro-Electric Board | | | 11,046 | | | | 9,608 | | | | 8,999 | | | | 8,362 | | | | 7,730 | | | | 7,499 | |
Other Crown Organizations | | | 2,397 | | | | 2,247 | | | | 1,926 | | | | 1,641 | | | | 1,478 | | | | 1,341 | |
Health Facilities | | | 1,314 | | | | 1,162 | | | | 1,094 | | | | 1,015 | | | | 949 | | | | 831 | |
Other | | | 17 | | | | 27 | | | | 37 | | | | 51 | | | | 65 | | | | 78 | |
Capital Investments | | | 4,089 | | | | 3,668 | | | | 3,195 | | | | 2,546 | | | | 1,846 | | | | 1,411 | |
| | | | | | | | | | | | | | | | | | | | | | | | |
Subtotal | | | 30,117 | | | | 27,837 | | | | 25,975 | | | | 22,925 | | | | 21,106 | | | | 19,410 | |
| | | | | | |
Other Obligations | | | | | | | | | | | | | | | | | | | | | | | | |
Pension Liability | | | 7,264 | | | | 6,892 | | | | 6,697 | | | | 6,545 | | | | 6,392 | | | | 6,152 | |
Pension Asset Fund | | | (5,266) | | | | (5,083) | | | | (5,063) | | | | (4,814) | | | | (4,624) | | | | (4,161) | |
| | | | | | | | | | | | | | | | | | | | | | | | |
Net Pension Liability | | | 1,998 | | | | 1,809 | | | | 1,634 | | | | 1,731 | | | | 1,768 | | | | 1,991 | |
Debt incurred for and repayable by the Manitoba Hydro-Electric Board | | | (10,698) | | | | (9,445) | | | | (8,742) | | | | (8,199) | | | | (7,479) | | | | (7,177) | |
Education and Health Debt held by Government Enterprises | | | 535 | | | | 505 | | | | 505 | | | | 471 | | | | 443 | | | | 406 | |
Other Debt of Crown Organizations | | | 266 | | | | 266 | | | | 266 | | | | 263 | | | | 255 | | | | 262 | |
| | | | | | | | | | | | | | | | | | | | | | | | |
Subtotal | | | (7,899) | | | | (6,865) | | | | (6,337) | | | | (5,734) | | | | (5,013) | | | | (4,518) | |
| | | | | | | | | | | | | | | | | | | | | | | | |
Total Summary Borrowings, Guarantees & Obligations | | | 22,218 | | | | 20,972 | | | | 19,638 | | | | 17,191 | | | | 16,093 | | | | 14,892 | |
| | | | | | | | | | | | | | | | | | | | | | | | |
Adjustments to arrive at Summary Net Debt | | | | | | | | | | | | | | | | | | | | | | | | |
Guarantees | | | (351) | | | | (166) | | | | (257) | | | | (165) | | | | (255) | | | | (326) | |
Net Financial Assets | | | (4,113) | | | | (4,687) | | | | (4,870) | | | | (4,501) | | | | (4,231) | | | | (3,086) | |
| | | | | | | | | | | | | | | | | | | | | | | | |
Summary Net Debt | | | 17,754 | | | | 16,119 | | | | 14,511 | | | | 12,525 | | | | 11,607 | | | | 11,480 | |
| | | | | | | | | | | | | | | | | | | | | | | | |
NOTES:
| — | | The 2012/13 Budget numbers originally presented in the 2012 Budget Address and the 2012/13 forecast from the Third Quarter Financial Report have been re-stated to be consistent with the current presentation for the GRE. |
| — | | Details of Expenditure and Revenue for Fiscal Year 2013/14, and a reconciliation to the amounts reported for core government are found in Schedules 1 and 2. |
| — | | In-Year Adjustments/Lapse could be an increase in revenue and/or decrease in expenditures. |
| — | | Numbers may not add due to rounding. |
B U D G E T 2 0 1 3 / 2 1
Manitoba Summary Financial Statistics
| | | | | | | | | | | | | | | | | | | | | | | | |
| | | 2013/14 Budget | | | 2012/13 Forecast | | | 2011/12 Actual | | | 2010/11 Actual | | | 2009/10 Actual | | | 2008/09 Actual | |
| |
| | | (Percentage Change) | |
Annual Change | | | | | | | | | | | | | | | | | | | | | | | | |
Income Taxes | | | 2.3 | | | | 5.3 | | | | 6.9 | | | | 9.9 | | | | (6.4) | | | | 7.1 | |
Other Taxes | | | 10.6 | | | | 2.8 | | | | 3.7 | | | | 3.8 | | | | 0.2 | | | | (0.4) | |
Fees and Other Revenue | | | (2.0) | | | | 6.3 | | | | 4.3 | | | | 2.0 | | | | 4.1 | | | | 5.8 | |
Federal Transfers | | | (1.3) | | | | (10.0) | | | | 7.0 | | | | 3.1 | | | | 1.5 | | | | 7.5 | |
Total Revenue | | | 3.0 | | | | (0.7) | | | | 4.6 | | | | 4.5 | | | | (0.8) | | | | 2.2 | |
Health | | | 4.5 | | | | 1.7 | | | | 5.6 | | | | 4.4 | | | | 5.3 | | | | 8.5 | |
Education | | | 4.5 | | | | 4.4 | | | | 4.8 | | | | 3.2 | | | | 4.4 | | | | (4.1) | |
Debt Servicing Costs | | | 2.3 | | | | 0.6 | | | | 5.4 | | | | 2.2 | | | | (8.9) | | | | (3.9) | |
Total Expenditure | | | 3.1 | | | | (3.0) | | | | 10.7 | | | | 4.4 | | | | 4.3 | | | | 3.1 | |
Summary Net Debt | | | 10.1 | | | | 11.1 | | | | 15.9 | | | | 7.9 | | | | 1.1 | | | | 8.7 | |
| |
| | | (Per Cent) | |
Per Cent of GDP | | | | | | | | | | | | | | | | | | | | | | | | |
Income Taxes | | | 5.4 | | | | 5.5 | | | | 5.5 | | | | 5.4 | | | | 5.2 | | | | 5.5 | |
Other Taxes | | | 6.5 | | | | 6.1 | | | | 6.2 | | | | 6.3 | | | | 6.4 | | | | 6.3 | |
Fees and Other Revenue | | | 3.2 | | | | 3.4 | | | | 3.3 | | | | 3.4 | | | | 3.5 | | | | 3.3 | |
Federal Transfers | | | 6.2 | | | | 6.6 | | | | 7.6 | | | | 7.5 | | | | 7.6 | | | | 7.5 | |
Total Revenue | | | 22.9 | | | | 23.2 | | | | 24.3 | | | | 24.4 | | | | 24.6 | | | | 24.7 | |
Health | | | 9.2 | | | | 9.1 | | | | 9.4 | | | | 9.3 | | | | 9.4 | | | | 8.9 | |
Education | | | 6.2 | | | | 6.1 | | | | 6.1 | | | | 6.1 | | | | 6.3 | | | | 6.0 | |
Debt Servicing Costs | | | 1.4 | | | | 1.4 | | | | 1.4 | | | | 1.4 | | | | 1.5 | | | | 1.6 | |
Total Expenditure | | | 24.0 | | | | 24.2 | | | | 26.1 | | | | 24.7 | | | | 24.9 | | | | 23.8 | |
Summary Net Debt | | | 28.7 | | | | 27.1 | | | | 25.5 | | | | 23.1 | | | | 22.5 | | | | 22.2 | |
| | | | | | |
Per Cent of Revenue | | | | | | | | | | | | | | | | | | | | | | | | |
Income Taxes | | | 23.7 | | | | 23.9 | | | | 22.5 | | | | 22.1 | | | | 21.0 | | | | 22.3 | |
Other Taxes | | | 28.3 | | | | 26.4 | | | | 25.5 | | | | 25.7 | | | | 25.9 | | | | 25.7 | |
Fees and Other Revenue | | | 14.0 | | | | 14.7 | | | | 13.8 | | | | 13.8 | | | | 14.1 | | | | 13.5 | |
Federal Transfers | | | 27.1 | | | | 28.3 | | | | 31.3 | | | | 30.6 | | | | 31.0 | | | | 30.3 | |
Net Income of Government Business Enterprises | | | 5.2 | | | | 5.0 | | | | 5.1 | | | | 6.1 | | | | 6.2 | | | | 6.0 | |
Sinking Funds and Other Earnings | | | 1.6 | | | | 1.7 | | | | 1.8 | | | | 1.7 | | | | 1.7 | | | | 2.3 | |
| |
| | | (Dollars) | |
| | | | | | |
Dollars Per Capita | | | | | | | | | | | | | | | | | | | | | | | | |
| | | | | | |
Total Revenue | | | 11,063 | | | | 10,863 | | | | 11,069 | | | | 10,715 | | | | 10,382 | | | | 10,587 | |
Total Expenditure | | | 11,582 | | | | 11,369 | | | | 11,867 | | | | 10,859 | | | | 10,532 | | | | 10,213 | |
Debt Servicing Costs | | | 654 | | | | 647 | | | | 651 | | | | 626 | | | | 620 | | | | 688 | |
Summary Net Debt | | | 13,850 | | | | 12,722 | | | | 11,593 | | | | 10,136 | | | | 9,515 | | | | 9,521 | |
| | | | | | |
Memorandum Items | | | | | | | | | | | | | | | | | | | | | | | | |
| | | | | | |
Population (000’s) * | | | 1,281.9f | | | | 1,267.0 | | | | 1,251.7 | | | | 1,235.7 | | | | 1,219.9 | | | | 1,205.7 | |
GDP at Market Prices ($M) | | | 61,850f | | | | 59,405f | | | | 56,947 | | | | 54,275 | | | | 51,554 | | | | 51,676 | |
Source: Manitoba Finance
* official population July 1
f - Forecast
2 2 / B U D G E T 2 0 1 3
Budget Paper B
SUPPLEMENTARY
FINANCIAL INFORMATION
| | | | |
Available in alternate formats upon request. | | | |  |
SUPPLEMENTARY FINANCIAL INFORMATION
| | | | |
CONTENTS | | | | |
| |
SPECIAL ACCOUNTS | | | 1 | |
Fiscal Stabilization Account | | | 1 | |
Pension Assets Fund | | | 2 | |
| |
CAPITAL INVESTMENT | | | 4 | |
| |
CAPITAL INVESTMENT – CORE GOVERNMENT | | | 5 | |
| |
LOAN REQUIREMENTS | | | 6 | |
| |
BORROWING REQUIREMENTS | | | 8 | |
| |
SUMMARY NET DEBT | | | 9 | |
| |
INTERPROVINCIAL COMPARISONS | | | 9 | |
B U D G E T 2 0 1 3 S u p p l e m e n t a r y F i n a n c i a l I n f o r m a t i o n / B 1
Fiscal Stabilization Account
The Fiscal Stabilization Account (FSA) is projected to have a balance of $375 million as at March 31, 2013, after a draw of $8 million for wait-time reduction and other health-related programming, $4 million related to ecoTrust and $140 million to retire a portion of the borrowings incurred during the period of economic recovery to support core government programs.
The budgeted draw in 2013/14 of $100 million is to retire a portion of the borrowings for core government.
Fiscal Stabilization Account
Revenue, Expenditure and Balance
Projection as at March 31, 2014 and March 31, 2013
| | | | | | | | | | |
| | | 2013/14 Budget | | | | | 2012/13 Forecast | |
| | | | | | (Millions of Dollars) | | | |
| | | |
Total Account Balance, Beginning of Year | | | 375 | | | | | | 527 | |
| | | | | | | | | | |
Health Programs | | | | | | | | | | |
Balance, Beginning of Year | | | - | | | | | | 8 | |
Transfers to the Core Government | | | | | | | | | | |
Wait-Time Reduction Programming and | | | | | | | | | | |
Other Health-Related Programming | | | - | | | | | | (8) | |
| | | | | | | | | | |
| | | |
Balance, End of Year | | | - | | | | | | - | |
| | | | | | | | | | |
| | | |
General Programs | | | | | | | | | | |
Balance, Beginning of Year | | | 375 | | | | | | 519 | |
Transfers to the Core Government | | | | | | | | | | |
Debt Repayment | | | (100) | | | | | | (140) | |
ecoTrust | | | - | | | | | | (4) | |
| | | | | | | | | | |
| | | |
Balance, End of Year | | | 275 | | | | | | 375 | |
| | | | | | | | | | |
| | | |
Total Account Balance, End of Year | | | 275 | | | | | | 375 | |
| | | | | | | | | | |
B 2 / S u p p l e m e n t a r y F i n a n c i a l I n f o r m a t i o n B U D G E T 2 0 1 3
Pension Assets Fund
The government continues its commitment to fund its unfunded pension liabilities. As part of this commitment, the government has changed the trust conditions of the funds held in the Pension Assets Fund to clarify that these funds are irrevocably restricted for pension purposes only. Net investment earnings of pension assets include the expected rate of return during the year as well as adjustments to market-related value. Market fluctuations of pension assets are not recorded in the year in which they occur but are recognized over the employee average remaining service life.
The fund is expected to have a balance of $3,439 million by the end of the 2013/14 fiscal year.
Pension Assets Fund
Projection as at March 31, 2014 and March 31, 2013
| | | | | | | | | | |
| | | 2013/14 Budget | | | | | 2012/13 Forecast | |
| | | | | | (Millions of Dollars) | | | |
Balance, Beginning of Year | | | 3,347 | | | | | | 3,324 | |
| | | | | | | | | | |
| | | |
Contributions and Revenue | | | | | | | | | | |
Net Investment Earnings | | | 209 | | | | | | 152 | |
Departments and Crown Corporations | | | 172 | | | | | | 153 | |
| | | | | | | | | | |
| | | |
| | | 381 | | | | | | 305 | |
| | | | | | | | | | |
| | | |
Transfers | | | | | | | | | | |
TRAF and CSSP Payments | | | (289) | | | | | | (282) | |
| | | | | | | | | | |
| | | |
Balance, End of Year | | | 3,439 | | | | | | 3,347 | |
| | | | | | | | | | |
B U D G E T 2 0 1 3 S u p p l e m e n t a r y F i n a n c i a l I n f o r m a t i o n / B 3
SUMMARY OF ACCOUNT/FUND ACTIVITY
| | | | | | | | | | | | | | | | | | | | | | | | | | | | | | | | | | | | | | | | | | | | | | | | | | | | | | | | | | | | |
| | | 13/14 Budget | | | 12/13 Forecast | | | 11/12 Actual | | | 10/11 Actual | | | 09/10 Actual | | | 08/09 Actual | | | 07/08 Actual | | | 06/07 Actual | | | 05/06 Actual | | | 04/05 Actual | | | 03/04 Actual | | | 02/03 Actual | | | 01/02 Actual | | | 00/01 Actual | | | 99/00 Actual | |
| | | (Millions of Dollars) | |
| | | | | | | | | | | | | | | |
Fiscal Stabilization Account | | | | | | | | | | | | | | | | | | | | | | | | | | | | | | | | | | | | | | | | | | | | | | | | | | | | | | | | | | | | |
| | | | | | | | | | | | | | | |
Transfers to Account | | | - | | | | - | | | | - | | | | - | | | | - | | | | 30 | | | | 128 | | | | 110 | | | | 31 | | | | 405 | | | | 13 | | | | 4 | | | | 63 | | | | 40 | | | | 11 | |
| | | | | | | | | | | | | | | |
Transfers from Account | | | (100 | ) | | | (152 | ) | | | (155 | ) | | | (125 | ) | | | (57 | ) | | | - | | | | - | | | | - | | | | - | | | | - | | | | (171 | ) | | | (22 | ) | | | (150 | ) | | | - | | | | (185 | ) |
| | | | | | | | | | | | | | | |
Investment Revenue | | | - | | | | - | | | | - | | | | - | | | | - | | | | 16 | | | | 27 | | | | 21 | | | | 15 | | | | 2 | | | | 1 | | | | 7 | | | | 14 | | | | 15 | | | | 12 | |
| | | | | | | | | | | | | | | |
Balance, End of Year | | | 275 | | | | 375 | | | | 527 | | | | 682 | | | | 807 | | | | 864 | | | | 818 | | | | 663 | | | | 532 | | | | 486 | | | | 79 | | | | 236 | | | | 247 | | | | 320 | | | | 265 | |
| | | | | | | | | | | | | | | |
Debt Retirement Account | | | | | | | | | | | | | | | | | | | | | | | | | | | | | | | | | | | | | | | | | | | | | | | | | | | | | | | | | | | | |
| | | | | | | | | | | | | | | |
Contribution | | | - | | | | - | | | | - | | | | - | | | | 20 | | | | 110 | | | | 110 | | | | 110 | | | | 110 | | | | 99 | | | | 96 | | | | 96 | | | | 96 | | | | 96 | | | | 75 | |
| | | | | | | | | | | | | | | |
Interest Earnings | | | - | | | | - | | | | - | | | | - | | | | 1 | | | | 1 | | | | 2 | | | | 1 | | | | - | | | | 2 | | | | 7 | | | | 3 | | | | 5 | | | | - | | | | - | |
| | | | | | | | | | | | | | | |
Transfers to Pension Assets Fund | | | - | | | | - | | | | - | | | | - | | | | (10 | ) | | | (55 | ) | | | (85 | ) | | | (85 | ) | | | (85 | ) | | | (79 | ) | | | (75 | ) | | | (48 | ) | | | (75 | ) | | | (21 | ) | | | - | |
| | | | | | | | | | | | | | | |
Transfers for General Purpose Debt Reduction | | | - | | | | - | | | | - | | | | (145 | ) | | | - | | | | - | | | | - | | | | - | | | | - | | | | (202 | ) | | | - | | | | - | | | | - | | | | - | | | | (305 | ) |
| | | | | | | | | | | | | | | |
Balance, End of Year | | | - | | | | - | | | | - | | | | - | | | | 145 | | | | 134 | | | | 78 | | | | 51 | | | | 25 | | | | - | | | | 180 | | | | 152 | | | | 101 | | | | 75 | | | | - | |
| | | | | | | | | | | | | | | |
Pension Assets Fund | | | | | | | | | | | | | | | | | | | | | | | | | | | | | | | | | | | | | | | | | | | | | | | | | | | | | | | | | | | | |
| | | | | | | | | | | | | | | |
Transfers from Debt Retirement Account | | | - | | | | - | | | | - | | | | - | | | | 10 | | | | 55 | | | | 85 | | | | 85 | | | | 85 | | | | 79 | | | | 75 | | | | 48 | | | | 75 | | | | 21 | | | | - | |
| | | | | | | | | | | | | | | |
Net Investment Earnings | | | 209 | | | | 152 | | | | 40 | | | | 100 | | | | 160 | | | | 41 | | | | 16 | | | | 67 | | | | 61 | | | | 31 | | | | 38 | | | | (6 | ) | | | 2 | | | | - | | | | - | |
| | | | | | | | | | | | | | | |
Net Current Service Contributions | | | (117 | ) | | | (129 | ) | | | (130 | ) | | | (114 | ) | | | (100 | ) | | | (80 | ) | | | (60 | ) | | | 10 | | | | 8 | | | | 6 | | | | 3 | | | | 2 | | | | 9 | | | | - | | | | - | |
| | | | | | | | | | | | | | | |
TRAF/CSSP Funding | | | - | | | | - | | | | 240 | | | | 180 | | | | 330 | | | | 350 | | | | 1,502 | | | | - | | | | - | | | | - | | | | - | | | | - | | | | - | | | | - | | | | - | |
| | | | | | | | | | | | | | | |
Balance, End of Year | | | 3,439 | | | | 3,347 | | | | 3,324 | | | | 3,174 | | | | 3,008 | | | | 2,608 | | | | 2,242 | | | | 699 | | | | 537 | | | | 383 | | | | 267 | | | | 151 | | | | 107 | | | | 21 | | | | - | |
B 4 / S u p p l e m e n t a r y F i n a n c i a l I n f o r m a t i o n B U D G E T 2 0 1 3
Capital investment continues to be a priority for the government, with the cost of these assets amortized over a set period that represents the useful life of the asset as required by GAAP. These set periods result in regular repayment of debt. The end result is increased infrastructure investment for Manitobans, while spreading the cost of those assets over their useful life, a strategy which includes a plan to pay the debt. The net book value of these assets (cost less accumulated amortization) has more than tripled since 1999/2000 and is a major asset of the government in providing services to Manitobans into the future.
The investment in tangible capital assets is projected to be $18.7 billion as at March 31, 2014, with $7.5 billion of related debt having been retired through accumulated amortization. Core government will have a total of $7.6 billion in capital asset investments as at March 31, 2014 and $2.6 billion of related debt will have been retired through accumulated amortization.
Tangible Capital Assets – Net Book Value

B U D G E T 2 0 1 3 S u p p l e m e n t a r y F i n a n c i a l I n f o r m a t i o n / B 5
| ¢ | | CAPITAL INVESTMENT – CORE GOVERNMENT |
Government owned capital assets such as highways, waterways, buildings, machinery and computer systems are amortized over their useful life based on established guidelines for amortization (see Appendix B of the 2013/14 Estimates of Expenditure). The amortization and interest costs are borne by departments that are responsible for each asset and are reflected as annual costs related to capital assets. In total, costs related to capital assets are estimated at $413 million in 2013/14, an increase of $31 million from 2012/13. In 2013/14, departmental appropriations include $214 million for amortization and $199 million for allocation of interest.
Authority for the annual cost to acquire government owned assets is reflected as Part B – Capital Investment which totals $696 million in 2013/14, a decrease of $55 million from 2012/13.
Capital Investment, 2013/14
(Thousands of Dollars)
| | | | | | | | | | |
| | | 2013/14 Budget | | 2012/13 Budget |
General Assets | | | | | | | | | | |
Government Services Capital Projects | | | | 112,000 | | | | | 128,346 | |
Transportation Equipment and Aircraft | | | | 16,920 | | | | | 42,164 | |
Information Technology Projects | | | | | | | | | | |
Corporate Information Technology Projects | | | | 21,904 | | | | | 21,558 | |
Advanced Education and Literacy | | | | 100 | | | | | 500 | |
Conservation and Water Stewardship | | | | 405 | | | | | - | |
Finance | | | | 500 | | | | | 500 | |
Health | | | | 665 | | | | | 928 | |
Justice | | | | 325 | | | | | 413 | |
Other Equipment and Buildings | | | | 19,427 | | | | | 51,056 | |
| | | | | | | | | | |
| | | | 172,246 | | | | | 245,465 | |
| | | | | | | | | | |
| | |
Infrastructure Assets | | | | | | | | | | |
Provincial Roads, Highways and Airport Infrastructure | | | | 470,510 | | | | | 427,045 | |
Water Related Infrastructure | | | | 37,100 | | | | | 52,800 | |
Parks, Cottage and Camping Projects | | | | 15,839 | | | | | 25,600 | |
| | | | | | | | | | |
| | | | 523,449 | | | | | 505,445 | |
| | | | | | | | | | |
Total Capital Investment | | | | 695,695 | | | | | 750,910 | |
| | | | | | | | | | |
B 6 / S u p p l e m e n t a r y F i n a n c i a l I n f o r m a t i o n B U D G E T 2 0 1 3
The Loan Act 2013 provides borrowing and expenditure authority and, in some cases, guarantee authority for the government and its agencies to undertake self-sustaining programs, where self-sustaining means having the ability for repayment. This authority is in addition to that voted in the printed estimates review.
Incremental Capital Authority Requirements for Non-Budgetary Programs, 2013/14
(Thousands of Dollars)
| | | | |
| The Loan Act, 2013 | | | |
The Manitoba Hydro-Electric Board | | | $2,070,000 | |
Manitoba Housing and Renewal Corporation | | | 408,733 | |
Manitoba Agricultural Services Corporation | | | 173,130 | |
Manitoba Liquor and Lotteries Corporation | | | 108,000 | |
Health Capital Program | | | 92,800 | |
Business Support | | | 32,238 | |
Manitoba Student Aid Program | | | 29,476 | |
Diagnostic Services Manitoba | | | 14,683 | |
Special Operating Agencies Financing Authority - Vehicles and Equipment Management Agency | | | 8,000 | |
Communities Economic Development Fund | | | 6,800 | |
Special Operating Agencies Financing Authority - Crown Lands and Property Agency | | | 5,000 | |
Post-Secondary Institutions | | | 2,678 | |
Leaf Rapids Town Properties Ltd. | | | 500 | |
Manitoba Film Guarantee Program | | | 257 | |
Special Operating Agencies Financing Authority - Vital Statistics | | | 200 | |
| | | | |
| |
| | | $2,952,495 | |
| | | | |
B U D G E T 2 0 1 3 S u p p l e m e n t a r y F i n a n c i a l I n f o r m a t i o n / B 7
Non-Budgetary Capital Program, 2013/14
(Thousands of Dollars)
| | | | |
The Manitoba Hydro-Electric Board | | | $2,158,000 | |
Manitoba Housing and Renewal Corporation | | | 341,743 | |
Manitoba Agricultural Services Corporation | | | 240,895 | |
Manitoba Liquor and Lotteries Corporation | | | 215,400 | |
Health Capital Program | | | 167,478 | |
Post-Secondary Institutions | | | 82,802 | |
Business Support (including Manitoba Industrial Opportunities Program) | | | 76,871 | |
Manitoba Opportunities Fund | | | 58,848 | |
Manitoba Student Aid Program | | | 36,796 | |
Diagnostic Services Manitoba | | | 34,641 | |
Special Operating Agencies Financing Authority - Vehicles and Equipment Management Agency | | | 30,400 | |
The Manitoba Water Services Board | | | 27,876 | |
Northern Affairs Communities | | | 11,880 | |
Communities Economic Development Fund | | | 9,000 | |
Cottage Lots Development | | | 6,971 | |
Special Operating Agencies Financing Authority - Crown Lands and Property Agency | | | 5,000 | |
Miscellaneous Corporations, Agencies and Other Programs | | | 9,322 | |
| | | | |
| | | $3,513,923 | |
| | | | |
B 8 / S u p p l e m e n t a r y F i n a n c i a l I n f o r m a t i o n B U D G E T 2 0 1 3
Manitoba’s borrowing requirements with respect to both general and self sustaining borrowings is estimated to total $4.8 billion in 2013/14, of which $2.2 billion is required for refinancing purposes. New cash requirements, net of estimated repayments, are $2.6 billion, which includes requirements for general government purposes, capital investments by departments and The Manitoba Hydro-Electric Board. Estimated repayments are for general purpose borrowings, capital investment assets and health facilities. The Loan Act, 2013, will provide incremental capital authority of $3 billion. To date, approximately $0.6 billion of Manitoba’s borrowing requirements have been funded.
Borrowing Requirements 2013/14
(Thousands of Dollars)
| | | | | | | | | | | | | | | | | | | | |
| | | Refinancing | | New Cash Requirements | | Estimated Repayments | | Borrowing Requirements |
Government Business Enterprises | | | | | | | | | | | | | | | | | | | | |
The Manitoba Hydro-Electric Board | | | | 728,800 | | | | | 1,584,800 | | | | | - | | | | | 2,313,600 | |
Manitoba Liquor and Lotteries Corporation | | | | - | | | | | 75,000 | | | | | 24,786 | | | | | 50,214 | |
| | | | | | | | | | | | | | | | | | | | |
Subtotal | | | | 728,800 | | | | | 1,659,800 | | | | | 24,786 | | | | | 2,363,814 | |
| | | | | | | | | | | | | | | | | | | | |
| | | | |
Other Borrowings | | | | | | | | | | | | | | | | | | | | |
General Purpose Borrowings | | | | 760,208 | | | | | 505,053 | | | | | 100,000 | | | | | 1,165,261 | |
Capital Investment Assets | | | | 158,567 | | | | | 635,001 | | | | | 214,862 | | | | | 578,706 | |
Health Facilities | | | | 384,000 | | | | | 100,000 | | | | | 88,600 | | | | | 395,400 | |
Other Crowns and Organizations | | | | 150,000 | | | | | 100,000 | | | | | - | | | | | 250,000 | |
| | | | | | | | | | | | | | | | | | | | |
Subtotal | | | | 1,452,775 | | | | | 1,340,054 | | | | | 403,462 | | | | | 2,389,367 | |
| | | | | | | | | | | | | | | | | | | | |
Total Borrowing Requirements | | | | 2,181,575 | | | | | 2,999,854 | | | | | 428,248 | | | | | 4,753,181 | |
| | | | | | | | | | | | | | | | | | | | |
B U D G E T 2 0 1 3 S u p p l e m e n t a r y F i n a n c i a l I n f o r m a t i o n / B 9
Changes in Summary Net Debt
(Millions of Dollars)
| | | | |
2012/13 Summary Net Debt (Forecast) | | | 16,119 | |
| |
Net Investment in Tangible Capital Assets | | | | |
| |
Core Government | | | 481 | |
| |
Other Reporting Entities | | | 636 | |
| | | | |
| | | 1,117 | |
| | | | |
Plus: Projected (Income) Loss for the Year | | | | |
| |
Core Government | | | 505 | |
| |
Other Reporting Entities | | | 13 | |
| | | | |
| | | 518 | |
| | | | |
Change in Net Debt | | | 1,635 | |
| | | | |
| |
2013/14 Summary Net Debt (Budget) | | | 17,754 | |
| | | | |
In Budget 2013, the net debt to GDP ratio is forecast to be 28.7%. Net debt is an important indicator of a government’s financial position as this highlights the affordability of future government service. Summary net debt represents the difference between the GREs’ total liabilities, such as borrowing and financing, less its financial assets* – it reflects the residual liability that must be financed by future revenues. Net debt may grow in absolute terms from time to time, as needed investments in capital assets are made. These investments underpin and support Manitoba’s economic performance. It is important to measure changes in net debt against the growth of the economy, as measured by the nominal GDP.
* Financial assets are liquid assets such as cash, investments, loans and accounts receivable that could be readily converted to cash.
| ¢ | | INTERPROVINCIAL COMPARISONS |
Moody’s Credit Ratings
S&P Credit Ratings
B 1 0 / S u p p l e m e n t a r y F i n a n c i a l I n f o r m a t i o n B U D G E T 2 0 1 3
Provincial Expenditure
Per Capita Increase,
2007/08 to 2012/13f
Net Debt to GDP Ratio,
2012/13f
Provincial Government Expenditure
on Health, 2011/12f
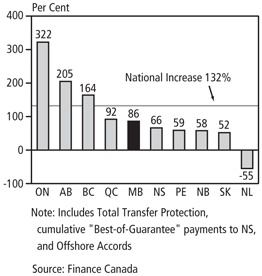
Major Federal Cash Transfers,
Change from 1999/00 to 2013/14
Budget Paper C
TAXATION ADJUSTMENTS
| | | | |
Available in alternate formats upon request. | | | |  |
TAXATION ADJUSTMENTS
| | | | |
CONTENTS | | | | |
| |
SUMMARY OF 2013 TAX MEASURES | | | 1 | |
| |
PERSONAL MEASURES | | | 2 | |
Seniors’ School Tax Rebate | | | 2 | |
Dividend Tax Credit | | | 2 | |
| |
HEALTH AND ENVIRONMENTAL MEASURES | | | 2 | |
Tobacco Tax | | | 2 | |
Natural Gas Fuel Tax | | | 2 | |
Odour Control Tax Credit | | | 3 | |
| |
BUSINESS AND FARM MEASURES | | | 3 | |
Data Processing Investment Tax Credit | | | 3 | |
Rental Housing Construction Tax Credit | | | 3 | |
Research and Development Tax Credit | | | 4 | |
Manufacturing Investment Tax Credit | | | 4 | |
Small Business Income Limit | | | 5 | |
Film and Video Production Tax Credit | | | 5 | |
Interactive Digital Media Tax Credit | | | 5 | |
Small Business Venture Capital Tax Credit | | | 6 | |
Farmland School Tax Rebate | | | 6 | |
Corporation Capital Tax on Financial Institutions | | | 7 | |
| |
SALES TAX MEASURES | | | 7 | |
Sales Tax Rate | | | 7 | |
Exemptions | | | 7 | |
| |
TECHNICAL AND ADMINISTRATIVE AMENDMENTS | | | 8 | |
| |
GOODS AND SERVICES NOT TAXABLE UNDER MANITOBA SALES TAX | | | 9 | |
| |
CONTACTS FOR FURTHER INFORMATION | | | 10 | |
| |
PERSONAL TAX SAVINGS SINCE 1999 | | | 12 | |
| |
MANITOBA INCOME TAX SAVINGS FOR TYPICAL TAXPAYERS | | | 14 | |
| |
MANITOBA INCOME TAX SINCE 1999 | | | 15 | |
| |
2013 INTERPROVINCIAL COMPARISON OF TAX RATES | | | 16 | |
| |
FEDERAL AND MANITOBA INCOME TAX RATES, 2013 | | | 16 | |
| |
Appendix 1: MANITOBA TAX EXPENDITURES, 2012/13 | | | 18 | |
| |
Appendix 2: THE MANITOBA ADVANTAGE | | | 23 | |
| |
Appendix 3: MANITOBA’S COMPETITIVE ENVIRONMENT FOR MANUFACTURING | | | 34 | |
B U D G E T 2 0 1 3 T a x a t i o n A d j u s t m e n t s / C 1
| ¢ | | SUMMARY OF 2013 TAX MEASURES |
A negative amount represents a tax reduction.
| | | | | | | | | | |
| | | 2013/14 | | Full Year |
| |
| | | | | |
| | | (Millions of Dollars) |
| | |
Ongoing Reductions1 | | | | | | | | | | |
Personal Tax reductions | | | | -25.0 | | | | | -41.3 | |
Business Tax reductions | | | | -4.8 | | | | | -11.8 | |
| | |
| | | | | | | | | | |
| | | | -29.8 | | | | | -53.1 | |
| | |
Personal Measures | | | | | | | | | | |
Seniors’ School Tax Rebate introduced | | | | -6.5 | | | | | -50.0 | |
Dividend Tax Credit changed | | | | - | | | | | - | |
| | |
| | | | | | | | | | |
| | | | -6.5 | | | | | -50.0 | |
| | |
Health and Environmental Measures | | | | | | | | | | |
Tobacco Tax increased | | | | 16.4 | | | | | 17.2 | |
Natural Gas Fuel Tax introduced | | | | - | | | | | - | |
Odour Control Tax Credit enhanced | | | | - | | | | | - | |
| | |
| | | | | | | | | | |
| | | | 16.4 | | | | | 17.2 | |
| | |
Business and Farm Measures | | | | | | | | | | |
Data Processing Investment Tax Credit enhanced | | | | -1.0 | | | | | -1.0 | |
Rental Housing Construction Tax Credit introduced | | | | -1.4 | | | | | -4.4 | |
Research and Development Tax Credit changed | | | | -0.2 | | | | | -0.3 | |
Manufacturing Investment Tax Credit enhanced | | | | -2.0 | | | | | -2.7 | |
Small Business Income Limit increased | | | | -1.1 | | | | | -4.4 | |
Film and Video Production Tax Credit extended | | | | - | | | | | -19.0 | |
Interactive Digital Media Tax Credit extended and enhanced | | | | -0.3 | | | | | -1.2 | |
Small Business Venture Capital Tax Credit extended | | | | - | | | | | -1.4 | |
Farmland School Tax Rebate changed | | | | 6.2 | | | | | 6.2 | |
Corporation Capital Tax on Financial Institutions changed | | | | 15.7 | | | | | 12.5 | |
| | |
| | | | | | | | | | |
| | | | 15.9 | | | | | -15.7 | |
| | |
Sales Tax Measures | | | | | | | | | | |
Sales Tax Rate changed | | | | 198.5 | | | | | 277.6 | |
Exemptions introduced | | | | -2.9 | | | | | -3.8 | |
| | |
Technical and Administrative Amendments | | | | - | | | | | - | |
| | |
Total Changes, 2013 Budget | | | | 221.4 | | | | | 225.3 | |
| | |
Total Changes, including Ongoing Tax Reductions | | | | 191.6 | | | | | 172.2 | |
| 1 | Tax reductions previously announced that take effect after 2012: |
| | - | increased seniors’ Education Property Tax Credit |
| | - | increased basic personal amount, spousal amount and eligible dependent amount |
| | - | increased take-up in Tuition Fee Income Tax Rebate |
| | - | increased take-up and expansion in the Co-op Education and Apprenticeship Tax Credits |
For a comprehensive listing of the 2012/13 value of tax expenditures, please see pages C20 to C22.
C 2 / T a x a t i o n A d j u s t m e n t s B U D G E T 2 0 1 3
Seniors’ School Tax Rebate
(2013/14 expenditure impact: +$6.5 million)
Budget 2013 re-affirms the Manitoba government’s commitment to eliminate the school division special levy paid by eligible senior homeowners on qualifying residential properties.
In 2014, one-half of the estimated total savings will be delivered to seniors. Additional details on eligible seniors, qualifying residences and other parameters will be made available in the near future.
The estimated full-year tax savings to seniors is $50.0 million in 2015.
For more information, please contact Location B, page C10.
Dividend Tax Credit
(2013/14 revenue impact: not applicable)
As a fair taxation measure, the 2013 federal budget announced that the gross-up on non-eligible dividends distributed by Canadian-controlled private corporations is being reduced from 25% to 18% commencing in 2014. This means an adjustment to Manitoba’s 1.75% Dividend Tax Credit on non-eligible dividends is required to maintain integration.
The 1.75% Dividend Tax Credit will be adjusted to 0.83% starting in 2014.
The change to the Dividend Tax Credit rate effectively offsets the federal changes to the dividend gross-up.
For more information, please contact Location A, page C10.
| ¢ | | HEALTH AND ENVIRONMENTAL MEASURES |
Tobacco Tax
(2013/14 revenue impact: +$16.4 million)
The Tobacco Tax rate is changed effective midnight, April 16, 2013. The rate per cigarette will change from 25.0¢ to 29.0¢; on fine-cut tobacco will change from 24.0¢ to 28.0¢ per gram; and on raw leaf tobacco will change from 22.5¢ to 26.5¢ per gram.
The estimated additional full-year revenue is $17.2 million.
For more information, please contact Location C, page C10.
Natural Gas Fuel Tax
(2013/14 revenue impact: negligible)
Natural gas is now being used in motor vehicles in Manitoba. Without any change, a per litre tax rate would be inappropriate relative to the energy produced by volume.
A fuel tax rate for natural gas used in motor vehicles will be phased in as follows: 3¢ per cubic metre for sales after April 16, 2013 until March 31, 2014; 6¢ per cubic metre from April 1, 2014 to March 31, 2015; and 10¢ per cubic metre after March 31, 2015.
The estimated full-year revenue is negligible.
For more information, please contact Location C, page C10.
B U D G E T 2 0 1 3 T a x a t i o n A d j u s t m e n t s / C 3
Odour Control Tax Credit
(2013/14 revenue impact: negligible)
Budget 2013 expands the credit, making it fully refundable to agricultural producers, including individual farmers, on qualifying property acquired after 2012.
The Odour Control Tax Credit was established in 2004 to provide a 10% non-refundable corporate income tax credit for businesses that invest in capital property for the purpose of preventing, eliminating or significantly reducing nuisance odours arising from the use or production of organic waste. The 10% credit was made refundable for agricultural producers, based on income tax and property tax on farmland paid by the farmer. This cap is now eliminated.
The estimated full-year tax savings for agricultural producers is negligible.
For more information, please contact Location A, page C10.
| ¢ | | BUSINESS AND FARM MEASURES |
Data Processing Investment Tax Credit
(2013/14 revenue impact: -$1.0 million)
The Data Processing Investment Tax Credit introduced in Budget 2012 is broadened to include companies that are not engaged primarily in data processing in Manitoba but that make a significant incremental investment in data processing equipment in Manitoba.
A taxable Canadian corporation with a permanent establishment in Manitoba that acquires at least $10 million of incremental eligible data processing equipment in a taxation year will qualify for an 8% refundable investment tax credit. Eligible property includes Class 46 and Class 50 data processing equipment purchased, leased and made available for use in Manitoba after April 16, 2013 and before 2016.
Commensurate with the change in the sales tax rate from 7% to 8%, the refundable Data Processing Investment Tax Credit available to corporations that are primarily engaged in data processing in Manitoba will increase from 7% to 8% on “data processing centre equipment” and from 4% to 4.5% on “data processing buildings.”
The tax credit effectively offsets Manitoba sales tax on data processing equipment and buildings.
The estimated additional full-year tax savings for companies is $1.0 million.
For more information, please contact Location E, page C10.
Rental Housing Construction Tax Credit
(2013/14 revenue impact: -$1.4 million)
A new tax credit is introduced, equal to 8% of the capital cost of new rental housing construction in Manitoba. The tax credit will stimulate the construction of rental housing and increase the quantity of affordable rental housing units. Eligible landlords must be residents of Manitoba or have a permanent establishment in Manitoba, and can operate on either a for-profit or not-for-profit basis, including rental housing co-operatives.
C 4 / T a x a t i o n A d j u s t m e n t s B U D G E T 2 0 1 3
Eligible projects include the construction of five or more new residential rental units. New rental units include existing non-residential properties being converted into residential units, in which case capital costs related to the acquisition and conversion of the property are eligible for the credit. The maximum credit is set at $12,000 per eligible rental unit. At least 10% of the units on an eligible project must be affordable housing units for the unit type.
The tax credit is earned on a project when it becomes available for rental and the affordable housing criteria are met. Eligible not-for-profit projects will receive a fully refundable tax credit in the year in which the tax credit is earned, as qualifying units are rented. The tax credit on for-profit projects will be non-refundable, claimable over a minimum of five years, and capped annually by the amount of Manitoba income tax payable by the landlord. The tax credit will be claimable by filing an income tax return with the Canada Revenue Agency.
For-profit and not-for-profit landlords will be required to file an annual attestation for five years identifying the affordable units, the monthly rents assessed on those units as well as identifying the total new rental units constructed.
The credit is intended to offset Manitoba sales tax payable by landlords on new rental housing construction.
The estimated full-year tax savings for landlords is $4.4 million.
For more information, please contact Location G, page C10.
Research and Development Tax Credit
(2013/14 revenue impact: -$0.2 million)
The Manitoba Research and Development Tax Credit is being amended to, in part, parallel the federal Scientific Research and Experimental Development Tax Credit changes.
The federal budget removed capital expenditures from the federal investment tax credit base, but Manitoba is not adjusting its tax credit for this change. In addition, contract payments to eligible institutes will remain fully eligible for the Manitoba tax credit.
The 2012 federal budget also announced that the Scientific Research and Experimental Development Tax Credit will be adjusted to reduce the 65% prescribed proxy amount – which recognizes overhead costs attributable to eligible projects – from 65% to 60% of direct labour costs in 2013 and to 55% starting in 2014. In addition, contract payments will be 80% claimable instead of fully claimable, so that tax credits will no longer include the profit element under the contract fees. The Manitoba Research and Development Tax Credit will reflect these changes.
The estimated additional full-year tax savings is $0.3 million.
For more information, please contact Location A, page C10.
Manufacturing Investment Tax Credit
(2013/14 revenue impact: -$2.0 million)
Commensurate with the change in the sales tax rate from 7% to 8%, the refundable portion of the 10% Manufacturing Investment Tax Credit will increase from seven-tenths refundable to eight-tenths refundable commencing on qualified property acquired after June 30, 2013.
The credit is intended to offset Manitoba sales tax payable by manufacturers.
The estimated additional full-year tax savings for manufacturers is $2.7 million.
For more information, please contact Location A, page C10.
B U D G E T 2 0 1 3 T a x a t i o n A d j u s t m e n t s / C 5
Small Business Income Limit
(2013/14 revenue impact: -$1.1 million)
Canadian-controlled private corporations that qualify for the small business deduction pay a 0% rate of Manitoba Corporation Income Tax.
This Budget increases Manitoba’s small business income limit eligible for the small business deduction from $400,000 to $425,000 on January 1, 2014.
The estimated additional full-year savings for corporations is $4.4 million.
For more information, please contact Location A, page C10.
Film and Video Production Tax Credit
(2013/14 expenditure impact: not applicable)
The Manitoba Film and Video Production Tax Credit, which was set to expire March 1, 2014, is extended to December 31, 2016.
This refundable corporation income tax credit is attributable to companies that develop and produce eligible film and video projects in Manitoba. The tax credit is equal to 45% of the remuneration paid to Manitobans on eligible projects, with a 10% frequent filming bonus, 5% Manitoba producer bonus, and 5% rural and northern bonus on eligible salaries. A film that meets all program criteria will earn a 65% credit on eligible salaries.
Since 2010, production companies are able to elect to claim the film tax credit based either on eligible labour costs (described above), or at a 30% rate based on production costs incurred and paid, for labour, goods and services provided in Manitoba that are directly attributable to the production of an eligible film.
The estimated full-year tax savings for film and video producers in 2013/14 is $19.0 million.
For more information, please contact Location D, page C10.
Interactive Digital Media Tax Credit
(2013/14 expenditure impact: +$0.3 million)
The Interactive Digital Media Tax Credit, which was set to expire December 31, 2013, is extended to December 31, 2016.
The tax credit is equal to 40% of qualifying labour costs related to the production of eligible interactive digital media projects. The maximum tax credit for a project is $500,000.
For projects that have been issued an eligibility certificate by Manitoba Innovation, Energy and Mines after 2011, and that commence production after 2012, the following four enhancements will be made:
| — | | companies may claim up to $100,000 in eligible marketing and distribution expenses that are directly attributable to that eligible project; |
| — | | financial support from the Canada Media Fund that is recoupable or repayable will not be treated as “government assistance;” |
| — | | an eligible product that is developed under contract for an arm’s-length purchaser does not need to demonstrate the product will be resold or licensed by that arm’s-length purchaser; and |
C 6 / T a x a t i o n A d j u s t m e n t s B U D G E T 2 0 1 3
| — | | a broader interpretation of the sale requirement will provide the province with added flexibility in determining which types of commercialization projects will be eligible. |
The estimated additional full-year tax savings of the enhancements is $0.5 million.
The estimated full-year tax savings for digital media producers in 2013/14 is $1.2 million.
For more information, please contact Location E, page C10.
Small Business Venture Capital Tax Credit
(2013/14 revenue impact: not applicable)
The Small Business Venture Capital Tax Credit, which was set to expire December 31, 2013, is extended to December 31, 2016.
The Small Business Venture Capital Tax Credit is a non-refundable, 30% income tax credit for investors who acquire equity capital in emerging enterprises that require larger amounts of capital than community ownership can provide. Corporate and individual investors qualify for this credit. The maximum credit that an investor can earn in a year is $135,000. The maximum amount of the tax credit deductible against Manitoba income tax is $45,000 per tax year. Any credits earned, but unused in a given year, are available to be carried forward for up to 10 years and carried back up to three years.
The estimated full-year tax savings for Manitoba investors is $1.4 million.
For more information, please contact Location F, page C10.
Farmland School Tax Rebate
(2013/14 expenditure impact: -$6.2 million)
The Farmland School Tax Rebate will be targeted more effectively in keeping with other government programs in general.
| — | | Commencing with the 2013 property tax year, the rebate will be available only to eligible farmland owners who are Manitoba residents. |
| — | | The rebate will be capped at $5,000 commencing with the 2013 property tax year. |
| — | | Starting with the 2013 property tax year, applications for a rebate for a given tax year must be filed no later than March 31 of the following year. Applications related to the 2011 and 2012 property tax years have until March 31, 2014 to apply for the rebate for those years. |
The estimated full-year cost reduction for these measures is $6.2 million.
For more information, please contact Location H, page C10.
B U D G E T 2 0 1 3 T a x a t i o n A d j u s t m e n t s / C 7
Corporation Capital Tax on Financial Institutions
(2013/14 revenue impact: +$15.7 million)
The Corporation Capital Tax on Financial Institutions is changed from 4% to 5%, commencing for taxation years ending after April 16, 2013.
The estimated full-year additional revenue impact is $12.5 million.
For more information, please contact Location C, page C10.
Sales Tax Rate
(2013/14 revenue impact: +$198.5 million)
The general sales tax rate will change from 7% to 8%, starting July 1, 2013. The average impact on a household is estimated at $25 per month. The rate is third lowest among provinces and the base is not harmonized with the federal GST.
For additional details on goods and services subject to GST and HST, but not taxable under Manitoba sales tax, see page C9.
The estimated full-year revenue impact is $277.6 million.
For more information, please contact Location C, page C10.
Exemptions
(2013/14 revenue impact: -$2.9 million)
The following exemptions will be applied effective July 1, 2013 to:
| — | | child safety restraint systems, such as car seats and booster seats; |
| — | | baby supplies, including diapers, strollers, cribs, gates, monitors, and items used for nursing, feeding or bathing; and |
| — | | bicycle helmets (both children and adults). |
The sales tax exemption for qualifying sand and salt mixtures purchased by municipalities will be expanded.
The estimated full-year tax savings for consumers is $3.8 million.
For more information, please contact Location C, page C10.
C 8 / T a x a t i o n A d j u s t m e n t s B U D G E T 2 0 1 3
| ¢ | | TECHNICAL AND ADMINISTRATIVE AMENDMENTS |
(2013/14 revenue impact: not applicable)
Technical amendments will be made to the Manufacturing Investment Tax Credit, and the Research and Development Tax Credit to ensure they operate as intended, particularly where a corporation elects to renounce tax credits.
For more information, please contact Location A, page C10.
To reduce the administration requirements for retail fuel dealers, a fuel tax license will no longer be required.
Enforcement and collection measures under The Tax Administration and Miscellaneous Taxes Act will be enhanced.
For more information, please contact Location C, page C10.
Land Transfer Tax will be amended to provide the Registrar-General authority to:
| — | | exempt property subject to Retail Sales Tax from Land Transfer Tax; |
| — | | provide tax relief for court ordered rescissions, or mutually agreed-upon sales reversals; |
| — | | issue an assessment notice under General Anti-Avoidance Rules where the conveyance of title is registered in order to reduce or eliminate tax in a manner that is an avoidance transaction; and |
| — | | exempt a statutory easement the first time it is registered. |
For more information, please contact Location I, page C10.
B U D G E T 2 0 1 3 T a x a t i o n A d j u s t m e n t s / C 9
| ¢ | | GOODS AND SERVICES NOT TAXABLE UNDER MANITOBA SALES TAX BUT SUBJECT TO FEDERAL GST AND PROVINCIAL HST/QST |
Goods
| — | | Gasoline and diesel fuel |
| — | | Home heating products (electricity, natural gas, wood) |
| — | | Children’s clothing and footwear |
| — | | Feminine hygiene products |
| — | | Vegetable and fruit plants, seeds and trees |
| — | | Organic fertilizers and topsoil |
| — | | Smoking cessation products |
Services
| — | | Construction services to real property (land and houses excluding mechanical/electrical systems) |
| | - | | Excavation, basements, foundation, piles and waterproofing |
| | - | | Concrete and asphalt work |
| | - | | Roofing and shingling including vents |
| | - | | Eaves troughs, soffits and fascia |
| | - | | Stucco, siding, plastering and other exterior finishing |
| | - | | Painting (interior/exterior homes/garages/fences) |
| | - | | Doors and windows including hardware and millwork |
| — | | Real estate agency fees |
| — | | Investment services (portfolio management fees), financial planning, tax/estate planning |
| — | | Transportation (taxi, bus, rail, air, courier and delivery) |
| — | | Entertainment services (admission to theatre, movies, circus, fairs, sporting events, concerts, parks, zoos) |
C 1 0 / T a x a t i o n A d j u s t m e n t s B U D G E T 2 0 1 3
| ¢ | | CONTACTS FOR FURTHER INFORMATION |
| | | | | | |
| | | |
| A | | Taxation, Economic and | | Telephone | | 204-945-3757 |
| | Intergovernmental Fiscal Research | | Fax | | 204-945-5051 |
| | Division, Manitoba Finance | | e-mail | | feedbackfin@gov.mb.ca |
| | | |
| B | | Manitoba Tax Assistance Office, | | Telephone | | 204-948-2115 in Winnipeg |
| | Manitoba Finance | | Toll-free | | 1-800-782-0771 |
| | | | Fax | | 204-948-2263 |
| | | | e-mail | | tao@gov.mb.ca |
| | | |
| C | | Taxation Division, | | Telephone | | 204-945-5603 in Winnipeg |
| | Manitoba Finance | | Toll-free | | 1-800-782-0318 |
| | | | Fax | | 204-945-0896 |
| | | | e-mail | | mbtax@gov.mb.ca |
| | | |
| D | | Manitoba Film and Music Recording | | Telephone | | 204-947-2040 |
| | Development Corporation | | Fax | | 204-956-5261 |
| | | | e-mail | | explore@mbfilmmusic.ca |
| | | |
| E | | Science, Innovation and Business | | Telephone | | 204-945-0975 |
| | Development, | | Fax | | 204-945-3977 |
| | Manitoba Innovation, Energy, | | e-mail | | avery.jodoin@gov.mb.ca |
| | and Mines | | | | |
| | | |
| F | | Financial Services Division, | | Telephone | | 204-945-2475 in Winnipeg |
| | Manitoba Entrepreneurship, | | Toll-free | | 1-800-282-8069 |
| | Training and Trade | | Fax | | 204-945-1193 |
| | | | e-mail | | doug.fyfe@gov.mb.ca |
| | | |
| G | | Manitoba Housing and Community | | Telephone | | 204-945-4663 |
| | Development | | Fax | | 204-948-2013 |
| | | | e-mail | | housing@gov.mb.ca |
| | | |
| H | | Manitoba Agricultural Services | | Telephone | | 204-726-7068 |
| | Corporation | | Fax | | 204-726-6849 |
| | | | e-mail | | fstr@masc.mb.ca |
| | | |
| I | | Manitoba Land Titles | | Telephone | | 204-945-2042 (Winnipeg) |
| | | | Fax | | 204-948-2140 (Winnipeg) |
| | | | For other locations, see: |
| | | | Web | | www.gov.mb.ca/tpr/land_titles/surveys/docs/faq_lto.pdf |
B U D G E T 2 0 1 3 T a x a t i o n A d j u s t m e n t s / C 1 1
C 1 2 / T a x a t i o n A d j u s t m e n t s B U D G E T 2 0 1 3
| ¢ | | PERSONAL TAX SAVINGS SINCE 1999 |
Personal Income Taxes, Education Property Tax Credits, Residential Education Support Levy, Seniors School Tax Levy Savings and Farmland School Tax Rebate
| | | | | | | | | | | | | | | | | | | | | | | | | | | | | | | | | | | | | | | | | | | | | | |
| | | 2000 | | | | | 2001 | | | | | 2002 | | | | | 2003 | | | | | 2004 | | | | | 2005 | | | | | 2006 | | | | | 2007 | |
| | | (Millions of Dollars) | |
| | | | | | | | | | | | | | | |
Income Tax Reductions | | | | | | | | | | | | | | | | | | | | | | | | | | | | | | | | | | | | | | | | | | | | | | |
| | | | | | | | | | | | | | | |
BUDGET | | | | | | | | | | | | | | | | | | | | | | | | | | | | | | | | | | | | | | | | | | | | | | |
| | | | | | | | | | | | | | | |
2000 | | | 9 | | | | | | 68 | | | | | | 34 | | | | | | | | | | | | | | | | | | | | | | | | | | | | | | | |
| | | | | | | | | | | | | | | |
2001 | | | | | | | | | 29 | | | | | | 7 | | | | | | 18 | | | | | | | | | | | | | | | | | | | | | | | | | |
| | | | | | | | | | | | | | | |
2002 | | | | | | | | | | | | | | | 15 | | | | | | | | | | | | | | | | | | | | | | | | | | | | | | | |
| | | | | | | | | | | | | | | |
2003 | | | | | | | | | | | | | | | | | | | | | | | | | | | 39 | | | | | | | | | | | | | | | | | | | |
| | | | | | | | | | | | | | | |
2005 | | | | | | | | | | | | | | | | | | | | | | | | | | | | | | | | | | | | | | | 30 | | | | | | | |
| | | | | | | | | | | | | | | |
2006 | | | | | | | | | | | | | | | | | | | | | | | | | | | | | | | | | | | | | | | 8 | | | | | | 34 | |
| | | | | | | | | | | | | | | |
2007 | | | | | | | | | | | | | | | | | | | | | | | | | | | | | | | | | | | | | | | | | | | | | 25 | |
| | | | | | | | | | | | | | | |
2008 | | | | | | | | | | | | | | | | | | | | | | | | | | | | | | | | | | | | | | | | | | | | | | |
| | | | | | | | | | | | | | | |
2010 | | | | | | | | | | | | | | | | | | | | | | | | | | | | | | | | | | | | | | | | | | | | | | |
| | | | | | | | | | | | | | | |
2011 | | | | | | | | | | | | | | | | | | | | | | | | | | | | | | | | | | | | | | | | | | | | | | |
| | | | | | | | | | | | | | | |
SUBTOTAL | | | 9 | | | | | | 97 | | | | | | 56 | | | | | | 18 | | | | | | 39 | | | | | | - | | | | | | 38 | | | | | | 59 | |
| | | | | | | | | | | | | | | |
Property Tax Reductions1 | | | | | | | | | | | | | | | | | | | | | | | | | | | | | | | | | | | | | | | | | | | | | | |
| | | | | | | | | | | | | | | |
BUDGET | | | | | | | | | | | | | | | | | | | | | | | | | | | | | | | | | | | | | | | | | | | | | | |
| | | | | | | | | | | | | | | |
2000 | | | 26 | | | | | | | | | | | | | | | | | | | | | | | | | | | | | | | | | | | | | | | | | | | |
| | | | | | | | | | | | | | | |
2001 | | | | | | | | | 27 | | | | | | | | | | | | | | | | | | | | | | | | | | | | | | | | | | | | | |
| | | | | | | | | | | | | | | |
2002 | | | | | | | | | | | | | | | 10 | | | | | | | | | | | | | | | | | | | | | | | | | | | | | | | |
| | | | | | | | | | | | | | | |
2003 | | | | | | | | | | | | | | | | | | | | | 19 | | | | | | | | | | | | | | | | | | | | | | | | | |
| | | | | | | | | | | | | | | |
2004 | | | | | | | | | | | | | | | | | | | | | | | | | | | 23 | | | | | | | | | | | | | | | | | | | |
| | | | | | | | | | | | | | | |
2005 | | | | | | | | | | | | | | | | | | | | | | | | | | | | | | | | | 37 | | | | | | | | | | | | | |
| | | | | | | | | | | | | | | |
2006 | | | | | | | | | | | | | | | | | | | | | | | | | | | | | | | | | | | | | | | 39 | | | | | | | |
| | | | | | | | | | | | | | | |
2007 | | | | | | | | | | | | | | | | | | | | | | | | | | | | | | | | | | | | | | | | | | | | | 42 | |
| | | | | | | | | | | | | | | |
2008 | | | | | | | | | | | | | | | | | | | | | | | | | | | | | | | | | | | | | | | | | | | | | | |
| | | | | | | | | | | | | | | |
2009 | | | | | | | | | | | | | | | | | | | | | | | | | | | | | | | | | | | | | | | | | | | | | | |
| | | | | | | | | | | | | | | |
2011 | | | | | | | | | | | | | | | | | | | | | | | | | | | | | | | | | | | | | | | | | | | | | | |
| | | | | | | | | | | | | | | |
2013 | | | | | | | | | | | | | | | | | | | | | | | | | | | | | | | | | | | | | | | | | | | | | | |
| | | | | | | | | | | | | | | |
SUBTOTAL | | | 26 | | | | | | 27 | | | | | | 10 | | | | | | 19 | | | | | | 23 | | | | | | 37 | | | | | | 39 | | | | | | 42 | |
| | | | | | | | | | | | | | | |
Annual Totals | | | 35 | | | | | | 124 | | | | | | 67 | | | | | | 37 | | | | | | 62 | | | | | | 37 | | | | | | 77 | | | | | | 101 | |
| | | | | | | | | | | | | | | |
Cumulative | | | | | | | | | | | | | | | | | | | | | | | | | | | | | | | | | | | | | | | | | | | | | | |
Annual Totals | | | 35 | | | | | | 159 | | | | | | 226 | | | | | | 262 | | | | | | 324 | | | | | | 361 | | | | | | 438 | | | | | | 539 | |
Totals may not add due to rounding.
| | 1 | Reductions include the seniors’ school tax rebate of $50 million, increases to the Education Property Tax Credit of $156 million, the introduction of and increases to the Farmland School Tax Rebate of $35 million, and reductions to the Education Support Levy which was eliminated in 2006 (the elimination of ESL now provides annual tax savings of $145 million compared to $100 million in 2006). |
B U D G E T 2 0 1 3 T a x a t i o n A d j u s t m e n t s / C 1 3
| | | | | | | | | | | | | | | | | | | | | | | | | | | | | | | | | | | | | | |
| | | | | | | | | | | | | | | | | | | | | | | | | Cumulative | | | | |
| | | | | | | | | | | | | | | | | | | | | | | | | | | | | | | | | Annual | | | | | |
| 2008 | | | 2009 | | | 2010 | | | 2011 | | | 2012 | | | 2013 | | | 2014 | | | 2015 | | | Totals | | | | |
| | | | | | | | | | (Millions of Dollars) | | | | | | | | | | | | | |
| | | | | | | | |
| | | | | | | | | | | | | | | | | | | | | | | | | | | | | | | | | Income Tax Reductions | |
| | | | | | | | | |
| | | | | | | | | | | | | | | | | | | | | | | | | | | | | | | | | | | | | BUDGET | |
| | | | | | | | | |
| | | | | | | | | | | | | | | | | | | | | | | | | | | | | | | | | 111 | | | | 2000 | |
| | | | | | | | | |
| | | | | | | | | | | | | | | | | | | | | | | | | | | | | | | | | 54 | | | | 2001 | |
| | | | | | | | | |
| | | | | | | | | | | | | | | | | | | | | | | | | | | | | | | | | 15 | | | | 2002 | |
| | | | | | | | | |
| | | | | | | | | | | | | | | | | | | | | | | | | | | | | | | | | 39 | | | | 2003 | |
| | | | | | | | | |
| | | | | | | | | | | | | | | | | | | | | | | | | | | | | | | | | 30 | | | | 2005 | |
| | | | | | | | | |
| | | | | | | | | | | | | | | | | | | | | | | | | | | | | | | | | 42 | | | | 2006 | |
| | | | | | | | | |
| | 51 | | | | 28 | | | | 16 | | | | | | | | | | | | | | | | | | | | | | | | 120 | | | | 2007 | |
| | | | | | | | | |
| | 1 | | | | 24 | | | | 11 | | | | | | | | | | | | | | | | | | | | | | | | 36 | | | | 2008 | |
| | | | | | | | | |
| | | | | | | | | 3 | | | | 8 | | | | | | | | | | | | | | | | | | | | 11 | | | | 2010 | |
| | | | | | | | | |
| | | | | | | | | | | | | 24 | | | | 20 | | | | 19 | | | | 19 | | | | | | | | 81 | | | | 2011 | |
| | | | | | | | | |
| | 52 | | | | 52 | | | | 30 | | | | 32 | | | | 20 | | | | 19 | | | | 19 | | | | | | | | 539 | | | | SUBTOTAL | |
| | | | | | | | |
| | | | | | | | | | | | | | | | | | | | | | | | | | | | | | | | | Property Tax Reductions1 | |
| | | | | | | | | |
| | | | | | | | | | | | | | | | | | | | | | | | | | | | | | | | | | | | | BUDGET | |
| | | | | | | | | |
| | | | | | | | | | | | | | | | | | | | | | | | | | | | | | | | | 26 | | | | 2000 | |
| | | | | | | | | |
| | | | | | | | | | | | | | | | | | | | | | | | | | | | | | | | | 27 | | | | 2001 | |
| | | | | | | | | |
| | | | | | | | | | | | | | | | | | | | | | | | | | | | | | | | | 10 | | | | 2002 | |
| | | | | | | | | |
| | | | | | | | | | | | | | | | | | | | | | | | | | | | | | | | | 19 | | | | 2003 | |
| | | | | | | | | |
| | | | | | | | | | | | | | | | | | | | | | | | | | | | | | | | | 23 | | | | 2004 | |
| | | | | | | | | |
| | | | | | | | | | | | | | | | | | | | | | | | | | | | | | | | | 37 | | | | 2005 | |
| | | | | | | | | |
| | | | | | | | | | | | | | | | | | | | | | | | | | | | | | | | | 39 | | | | 2006 | |
| | | | | | | | | |
| | 2 | | | | 2 | | | | | | | | | | | | | | | | | | | | | | | | | | | | 46 | | | | 2007 | |
| | | | | | | | | |
| | 25 | | | | | | | | | | | | | | | | | | | | | | | | | | | | | | | | 25 | | | | 2008 | |
| | | | | | | | | |
| | | | | 16 | | | | | | | | | | | | | | | | | | | | | | | | | | | | 16 | | | | 2009 | |
| | | | | | | | | |
| | | | | | | | | | | | | 19 | | | | 2 | | | | 2 | | | | | | | | | | | | 23 | | | | 2011 | |
| | | | | | | | | |
| | | | | | | | | | | | | | | | | | | | | | | | | 25 | | | | 25 | | | | 50 | | | | 2013 | |
| | | | | | | | | |
| | 27 | | | | 18 | | | | - | | | | 19 | | | | 2 | | | | 2 | | | | 25 | | | | 25 | | | | 341 | | | | SUBTOTAL | |
| | | | | | | | | |
| | 79 | | | | 70 | | | | 30 | | | | 51 | | | | 21 | | | | 21 | | | | 44 | | | | 25 | | | | 880 | | | | Annual Totals | |
| | | | | | | | | |
| | | | | | | | | | | | | | | | | | | | | | | | | | | | | | | | | | | | | Cumulative | |
| | 618 | | | | 688 | | | | 718 | | | | 769 | | | | 790 | | | | 811 | | | | 855 | | | | 880 | | | | | | | | Annual Totals | |
C 1 4 / T a x a t i o n A d j u s t m e n t s B U D G E T 2 0 1 3
| ¢ | | MANITOBA INCOME TAX SAVINGS FOR TYPICAL TAXPAYERS |
| | | | | | | | | | | | | | | | | | | | | | |
| | | | Tax Payable/(Refunds) | | | | | | | | | Cumulative | |
| Income* | | | 1999 | | | 2013 | | | Tax Savings in 2013 | | | 2013 Savings
over 1999 | | | Savings
over 14 Years | |
| | | | (Dollars) | | | | | | (Percentage) | | | (Dollars) | |
| | | | | |
| | SINGLE PERSON1 | | | | | | | | | | | | | | | | | | | | | |
| | | | | |
| | 10,000 | | | | 88 | | | | (95 | ) | | | 183 | | | | 207.0 | | | | 1,763 | |
| | | | | |
| | 20,000 | | | | 1,369 | | | | 1,043 | | | | 326 | | | | 23.8 | | | | 2,914 | |
| | | | | |
| | 40,000 | | | | 4,012 | | | | 3,260 | | | | 753 | | | | 18.8 | | | | 7,257 | |
| | | | | |
| | 70,000 | | | | 9,153 | | | | 7,150 | | | | 2,003 | | | | 21.9 | | | | 19,328 | |
| | | | | |
| | 100,000 | | | | 14,572 | | | | 12,370 | | | | 2,203 | | | | 15.1 | | | | 22,052 | |
| FAMILY OF FOUR – ONE EARNER1 | | | | | | | | | | | | | |
| | | | | |
| | 25,000 | | | | 411 | | | | (192 | ) | | | 603 | | | | 146.7 | | | | 6,071 | |
| | | | | |
| | 40,000 | | | | 2,861 | | | | 1,628 | | | | 1,233 | | | | 43.1 | | | | 11,281 | |
| | | | | |
| | 60,000 | | | | 6,625 | | | | 4,340 | | | | 2,285 | | | | 34.5 | | | | 22,116 | |
| | | | | |
| | 75,000 | | | | 9,435 | | | | 6,770 | | | | 2,664 | | | | 28.2 | | | | 25,751 | |
| | | | | |
| | 100,000 | | | | 13,951 | | | | 11,363 | | | | 2,587 | | | | 18.5 | | | | 24,811 | |
| FAMILY OF FOUR – TWO EARNERS1 | | | | | | | | | |
| | | | | |
| | 30,000 | | | | 533 | | | | (51 | ) | | | 583 | | | | 109.5 | | | | 5,110 | |
| | | | | |
| | 40,000 | | | | 1,360 | | | | 709 | | | | 651 | | | | 47.9 | | | | 6,028 | |
| | | | | |
| | 60,000 | | | | 4,107 | | | | 3,064 | | | | 1,044 | | | | 25.4 | | | | 10,447 | |
| | | | | |
| | 80,000 | | | | 7,169 | | | | 5,472 | | | | 1,697 | | | | 23.7 | | | | 17,009 | |
| | | | | |
| | 100,000 | | | | 10,188 | | | | 7,975 | | | | 2,213 | | | | 21.7 | | | | 21,848 | |
| SENIOR COUPLE2 | | | | | | | | | | | | | | | | | |
| | | | | |
| | 30,000 | | | | 39 | | | | (316 | ) | | | 355 | | | | 910.4 | | | | 4,045 | |
| | | | | |
| | 40,000 | | | | 1,667 | | | | 688 | | | | 979 | | | | 58.7 | | | | 8,356 | |
| | | | | |
| | 60,000 | | | | 5,635 | | | | 3,315 | | | | 2,320 | | | | 41.2 | | | | 19,745 | |
| | | | | |
| | 80,000 | | | | 8,893 | | | | 6,360 | | | | 2,533 | | | | 28.5 | | | | 22,975 | |
Note: Some values may differ from previous years’ tables due to changed assumptions regarding pension income splitting and the Personal Tax Credit.
| | |
| * | | Income does not reflect Universal Child Care Benefit entitlements, but entitlements have been used to determine year-over-year savings. |
| 1 | | Taxfilers in the single and family examples have earned income and pay Canada Pension Plan and Employment Insurance premiums. In the two-earner family, one taxfiler earns 60% of the income and the other earns 40% and pays child-care fees. The Fitness Tax Credit and the Children’s Arts and Cultural Activities Tax Credit are claimed for one child in both family examples. Where applicable, tax payable has been reduced by the Personal Tax Credit. |
| 2 | | For the senior couple, both receive the Old Age Security Pension and each spouse splits private pension income in applicable tax years. |
B U D G E T 2 0 1 3 T a x a t i o n A d j u s t m e n t s / C 1 5
| ¢ | | MANITOBA INCOME TAX SINCE 1999 |
One-Earner Family of
Four at $40,000
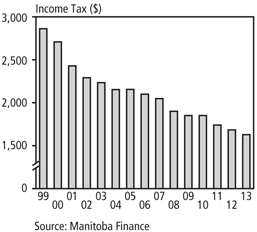
Two-Earner Family of
Four at $60,000
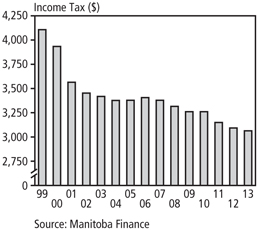
Single Individual at $70,000
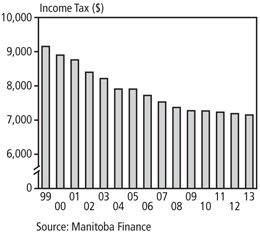
The Basic Personal Amount
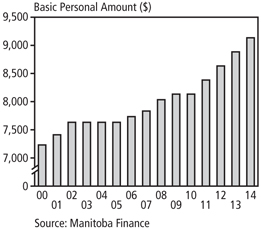
Since 1999, the basic personal amount has increased from $6,794 to $8,884 in 2013, and will increase again to $9,134 in 2014. This represents a 34% increase. The increased amounts benefit over 650,000 individual Manitobans, over 36,000 couples and common-law partnerships, and nearly 18,000 single parents. In 2013, another 5,500 Manitobans will be removed from the tax rolls. By 2014, almost 22,000 Manitobans will no longer pay Manitoba income tax because of the increased amounts since 2011.
C 1 6 / T a x a t i o n A d j u s t m e n t s B U D G E T 2 0 1 3
| ¢ | | 2013 INTERPROVINCIAL COMPARISON OF TAX RATES |
Shows rates applicable on December 31, 2013. Data as of April 5, 2013.
| | | | | | | | | | | | | | | | | | | | | | | | | | | | |
| | | BC | | | | | AB | | | | | SK | | | | | MB | | | | | ON | |
Personal Income Tax | | | | | | | | | | | | | | | | | | | | | | | | | | | | |
| | | | | | | | | |
Top Marginal Rate (%) 1 | | | 14.70 | | | | | | 10.00 | | | | | | 15.00 | | | | | | 17.40 | | | | | | 20.53 | |
| | | | | | | | | |
Health Care Premiums ($) 2 | | | 798 | | | | | | | | | | | | | | | | | | | | | | | | 900 | |
| | | | | | | | | |
Health and Education Tax (%) 3 | | | | | | | | | | | | | | | | | | | | | 2.15 | | | | | | 1.95 | |
| | | | | | | | | |
Corporation Income Tax (%) 4 | | | | | | | | | | | | | | | | | | | | | | | | | | | | |
| | | | | | | | | |
Small | | | 2.5 | | | | | | 3.0 | | | | | | 2.0 | | | | | | 0.0 | | | | | | 4.5 | |
| | | | | | | | | |
Large5 | | | 11.0 | | | | | | 10.0 | | | | | | 12.0 | | | | | | 12.0 | | | | | | 11.5 | |
| | | | | | | | | |
Manufacturing5 | | | 11.0 | | | | | | 10.0 | | | | | | 10.0 | | | | | | 12.0 | | | | | | 10.0 | |
| | | | | | | | | |
Small business limit ($000) | | | 500.0 | | | | | | 500.0 | | | | | | 500.0 | | | | | | 400.0 | | | | | | 500.0 | |
| | | | | | | | | |
Capital Tax (%) 6 | | | | | | | | | | | | | | | | | | | | | | | | | | | | |
| | | | | | | | | |
Banks | | | - | | | | | | - | | | | | | 3.25 | | | | | | 5.00 | | | | | | - | |
| | | | | | | | | |
Small Financial Institutions | | | - | | | | | | - | | | | | | 0.70 | | | | | | - | | | | | | - | |
| | | | | | | | | |
Sales Tax (%) 7 | | | 7.0 | | | | | | - | | | | | | 5.0 | | | | | | 8.0 | | | | | | 8.0 | |
| | | | | | | | | |
Gasoline Tax (¢/l) 8 | | | 21.17 | | | | | | 9.0 | | | | | | 15.0 | | | | | | 14.0 | | | | | | 14.7 | |
| | | | | | | | | |
Diesel Fuel Tax (¢/l) 9 | | | 22.67 | | | | | | 9.0 | | | | | | 15.0 | | | | | | 14.0 | | | | | | 14.3 | |
| | | | | | | | | |
Tobacco Tax (¢/cigarette) 5 | | | 22.3 | | | | | | 20.0 | | | | | | 25.0 | | | | | | 29.0 | | | | | | 12.35 | |
| | | | | | | | | |
Corporation Income Tax Credits10 | | | | | | | | | | | | | | | | | | | | | | | | | | | | |
| | | | | | | | | |
Manufacturing (%) | | | | | | | | | | | | | | | 5.00 | | | | | | 10.00 | | | | | | | |
| | | | | | | | | |
Research and Development (%) | | | 10.00 | | | | | | 10.00 | | | | | | 15.00 | | | | | | 20.00 | | | | | | 14.50 | |
| | |
1 | | Top marginal provincial rates include surtaxes. |
2 | | The health premium for BC is the maximum individual rate. The premium for ON is calculated as part of its provincial personal income tax system; maximum individual rate shown. QC levies a progressive health contribution, a prescription drug plan and a parental insurance plan; maximum total individual rate shown. |
3 | | MB exempts firms with payrolls of less than $1.25 million. ON provides a payroll deduction of $400,000 for all employers. QC has graduated rates for firms with payrolls under $5 million. NL exempts firms with payrolls of less than $1.2 million. |
4 | | MB’s small business limit will increase from $400,000 to $425,000 on January 1, 2014. The NS small business tax rate will decrease from 4% to 3% in 2014, and the small business limit will decrease from $400,000 to $350,000. |
5 | | BC’s corporation income tax rate and tobacco tax rate are subject to legislative approval. |
| ¢ | | FEDERAL AND MANITOBA INCOME TAX RATES, 2013 |
Personal Income Tax Rates
| | |
Federal |
| Rate | | Taxable Income Range |
| |
| 15.0% | | $0 – $43,561 |
| |
| 22.0% | | $43,561 – $87,123 |
| |
| 26.0% | | $87,123 – $135,054 |
| |
| 29.0% | | over $135,054 |
| | |
Manitoba |
| Rate | | Taxable Income Range |
| |
| 10.8% | | $0 – $31,000 |
| |
| 12.75% | | $31,001 – $67,000 |
| |
| 17.4% | | over $67,000 |
B U D G E T 2 0 1 3 T a x a t i o n A d j u s t m e n t s / C 1 7
| | | | | | | | | | | | | | | | | | | | | | | | | | | | | | |
| QC | | | | | NB | | | | | NS | | | | | PE | | | | | NL | | | | | |
| | | | | | | | | | | | | | | | | | | | | | | | | | | | | | Personal Income Tax |
| | | | | | | | | | |
| | 25.75 | | | | | | 16.07 | | | | | | 21.00 | | | | | | 18.37 | | | | | | 13.30 | | | | | Top Marginal Rate (%) 1 |
| | | | | | | | | | |
| | 1,956 | | | | | | | | | | | | | | | | | | | | | | | | | | | | | Health Care Premiums ($) 2 |
| | | | | | | | | | |
| | 4.26 | | | | | | | | | | | | | | | | | | | | | | | | 2.00 | | | | | Health and Education Tax (%) 3 |
| | | | | | | | | | |
| | | | | | | | | | | | | | | | | | | | | | | | | | | | | | Corporation Income Tax (%) 4 |
| | | | | | | | | | |
| | 8.0 | | | | | | 4.5 | | | | | | 3.5 | | | | | | 4.5 | | | | | | 4.0 | | | | | Small |
| | | | | | | | | | |
| | 11.9 | | | | | | 12.0 | | | | | | 16.0 | | | | | | 16.0 | | | | | | 14.0 | | | | | Large5 |
| | | | | | | | | | |
| | 11.9 | | | | | | 12.0 | | | | | | 16.0 | | | | | | 16.0 | | | | | | 5.0 | | | | | Manufacturing5 |
| | | | | | | | | | |
| | 500.0 | | | | | | 500.0 | | | | | | 400.0 | | | | | | 500.0 | | | | | | 500.0 | | | | | Small business limit ($000) |
| | | | | | | | | | |
| | | | | | | | | | | | | | | | | | | | | | | | | | | | | | Capital Tax (%) 6 |
| | | | | | | | | | |
| | - | | | | | | 4.00 | | | | | | 4.00 | | | | | | 5.00 | | | | | | 4.00 | | | | | Banks |
| | | | | | | | | | |
| | - | | | | | | - | | | | | | - | | | | | | - | | | | | | - | | | | | Small Financial Institutions |
| | | | | | | | | | |
| | 9.975 | | | | | | 8.0 | | | | | | 10.0 | | | | | | 9.0 | | | | | | 8.0 | | | | | Sales Tax (%) 7 |
| | | | | | | | | | |
| | 19.2 | | | | | | 13.6 | | | | | | 15.5 | | | | | | 13.1 | | | | | | 16.5 | | | | | Gasoline Tax (¢/l) 8 |
| | | | | | | | | | |
| | 20.2 | | | | | | 19.2 | | | | | | 15.4 | | | | | | 20.2 | | | | | | 16.5 | | | | | Diesel Fuel Tax (¢/l) 9 |
| | | | | | | | | | |
| | 12.90 | | | | | | 19.00 | | | | | | 23.52 | | | | | | 22.50 | | | | | | 20.50 | | | | | Tobacco Tax (¢/cigarette) 5 |
| | | | | | | | | | |
| | | | | | | | | | | | | | | | | | | | | | | | | | | | | | Corporation Income Tax Credits10 |
| | | | | | | | | | |
| | 5.00 | | | | | | | | | | | | | | | | | | 10.00 | | | | | | | | | | | Manufacturing (%) |
| | | | | | | | | | |
| | 37.50 | | | | | | 15.00 | | | | | | 15.00 | | | | | | | | | | | | 15.00 | | | | | Research and Development (%) |
| | |
| 6 | | QC levies a 25% compensation tax on the paid-up capital of bank, trust and loan companies. SK has a reduced tax rate for small financial institutions with less than $1.5 billion in taxable paid-up capital. MB exempts small financial institutions with less than $4 billion in taxable paid-up capital. |
| 7 | | MB’s Retail Sales Tax will increase to 8% effective July 1, 2013. |
| 8 | | Provincial gasoline taxes are fixed rates per litre. PE includes both a variable (maximum of 6.0¢/l) and a fixed (7.1¢/l) tax. The rate in BC includes 6.75¢/l dedicated to the BC Transportation Financing Authority and the carbon tax rate of 6.67¢/l for gasoline. ON, QC, NB, NS, NL and PE include provincial sales tax based on average pump prices. |
| 9 | | Provincial diesel fuel taxes are fixed rates per litre. PE includes both a variable (maximum of 8.7¢/l) and a fixed (11.5¢/l) diesel fuel tax. The rate in BC includes 6.75¢/l dedicated to the BC Transportation Financing Authority and the carbon tax rate of 7.67¢/l for diesel. Montréal has an additional levy of 3.0¢/l and QC imposes a carbon tax of 0.8¢/l on petroleum companies (it is assumed the tax is passed on to consumers). QC, NB, NS, NL and PE levy provincial sales tax on the pump price. |
| 10 | | QC R&D tax credit only applies on eligible labour, which reduces the effective tax rate to below 20%. |
Corporation Income Tax Rates
| | | | | | | | |
| | | Federal | | | Manitoba | |
| | |
Basic Rate | | | 15.0% | | | | 12.0% | |
| | |
Small Business Rate | | | 11.0% | | | | 0.0% | |
| | |
Small Business Limit* | | $ | 500,000 | | | $ | 400,000 | |
*In 2014, the Manitoba small business limit increases to $425,000.
C 1 8 / T a x a t i o n A d j u s t m e n t s B U D G E T 2 0 1 3
MANITOBA TAX EXPENDITURES, 2012/13
Introduction
Governments use the tax system to pursue social, cultural and economic objectives. A tax expenditure is measured as a deviation from a benchmark tax base. The expenditure can be in the form of a deduction, credit, preferential rate, deferral or exemption. Tax expenditures may target taxpayers (ex: individuals, corporations); activities (ex: farming, film production, manufacturing); property (ex: machinery, equipment); sources of income (ex: pensions); transactions (ex: RRSP contributions); or events (ex: involuntary dispositions).
Accounting for Tax Expenditures
Certain tax expenditures are treated as departmental expenditures, which are subject to review and approval by the Legislature, and are published annually as an individual line item in the Estimates of Expenditure in public accounts.
Other tax expenditures are absorbed into revenue estimates, reducing government revenues that would otherwise have been available for various direct expenditures. Tax expenditure accounts help to enhance the transparency of program expenditures and promote public accountability for tax credits that are absorbed into tax revenue.
Limitations of Tax Expenditure Accounting
Tax expenditure accounting has important limitations that must be considered when interpreting results. The value of each tax expenditure is estimated individually. Interactions between provisions are not taken into account. This has two effects. First, estimates for two or more tax expenditures cannot be added together to arrive at a combined value. Second, changing any one tax expenditure might affect the value of another tax expenditure. For example, changing something that is a deduction from income, such as RRSP contributions, would change reported net income. This in turn would change the value of tax credits, such as Manitoba’s Personal Tax Credit, that depend on net income. The combined value of the tax expenditures listed in the account is substantially less than the sum of the individual items.
B U D G E T 2 0 1 3 T a x a t i o n A d j u s t m e n t s / C 1 9
Reporting Tax Expenditures
Manitoba’s tax expenditure accounts are separated into six sections: personal income tax, corporation income tax, health and education tax levy, retail sales tax, fuel tax and corporation capital tax. The estimates are calculated from tax assessment data provided by the Canada Revenue Agency and departmental data. The estimates provided are for the 2012/13 fiscal year and include measures announced in the 2013 Budget.
Public Sector Accounting Board guidelines stipulate that tax expenditures that provide a financial benefit through the tax system for a purpose other than the relief of taxes be shown as an expense. The 2013 Budget reflects the following tax credits as expenditures and can be found in the Estimates of Expenditure in the departments of Agriculture, Food and Rural Initiatives, Education, Finance, and Innovation, Energy and Mines.
CREDITS ACCOUNTED FOR AS EXPENDITURE ITEMS
| | | | | |
| | | 2012/13 |
| |
| | | (Millions of Dollars) |
Education Property Tax Credit (including the Advance) | | | | 310.7 | |
Farmland School Tax Rebate | | | | 35.5 | |
Film and Video Production Tax Credit | | | | 19.0 | |
Tuition Fee Income Tax Rebate Advance | | | | 3.3 | |
Cultural Industries Printing Tax Credit | | | | 1.5 | |
School Tax Credit for Tenants and Homeowners (55+) | | | | 1.1 | |
Interactive Digital Media Tax Credit | | | | 0.6 | |
Book Publishing Tax Credit | | | | 0.5 | |
Co-operative Development Tax Credit | | | | 0.1 | |
| |
TOTAL | | | | 372.3 | |
C 2 0 / T a x a t i o n A d j u s t m e n t s B U D G E T 2 0 1 3
MANITOBA TAX EXPENDITURES, 2012/13
| | | | |
| | | (Millions of Dollars) | |
PERSONAL INCOME TAX | | | | |
(a) Adjustments to Income (in accordance with tax collection agreements) | | | | |
Contributions to RRSPs | | | 152.5 | |
Contributions to RPPs | | | 95.3 | |
Capital gains inclusion rate | | | 87.9 | |
Lifetime capital gains exemption | | | 35.4 | |
Social assistance, WCB, and OAS/GIS (non-taxable income) | | | 21.0 | |
Union dues and professional fees | | | 20.3 | |
Pension Income Splitting | | | 18.0 | |
Child-care expenses | | | 14.0 | |
Northern residents deduction | | | 6.8 | |
Moving expenses | | | 1.9 | |
| |
(b) Non-refundable tax credits (basic credits provided federally and by all provinces) | | | | |
Basic personal | | | 677.1 | |
CPP/EI | | | 120.2 | |
Charitable donations | | | 67.6 | |
Family Tax Benefit | | | 57.3 | |
Age | | | 33.5 | |
Medical expenses | | | 33.4 | |
Tuition fees and education amount | | | 30.6 | |
Spousal | | | 25.0 | |
Disability | | | 20.0 | |
Eligible dependant | | | 17.5 | |
Private pension | | | 15.5 | |
Fitness Tax Credit | | | 4.0 | |
Children’s Arts and Cultural Tax Credit | | | 2.3 | |
Caregiver | | | 1.5 | |
Student loan interest | | | 0.8 | |
Infirm dependants | | | 0.2 | |
Adoption Expenses Tax Credit | | | 0.1 | |
| |
(c) Other Manitoba Tax Measures | | | | |
Tuition Fee Income Tax Rebate | | | 35.7 | |
Primary Caregiver Tax Credit | | | 20.5 | |
Mineral Exploration Tax Credit | | | 5.5 | |
Foreign Tax Credit | | | 2.5 | |
Political Contributions Tax Credit | | | 1.8 | |
Fertility Treatment Tax Credit | | | 1.0 | |
Overseas Employment Tax Credit | | | 0.5 | |
Labour-Sponsored Venture Capital Corporations Tax Credit | | | 0.2 | |
Community Enterprise Development Tax Credit | | | 0.1 | |
B U D G E T 2 0 1 3 T a x a t i o n A d j u s t m e n t s / C 2 1
| | | | |
| | | (Millions of Dollars) | |
| |
CORPORATE INCOME TAX | | | | |
Low rate for small business | | | 260.5 | |
Manufacturing Investment Tax Credit | | | 42.0 | |
Research and Development Tax Credit | | | 25.6 | |
Green Energy Equipment Tax Credit | | | 1.7 | |
Co-op Education and Apprenticeship Tax Credits | | | 1.7 | |
Small Business Venture Capital Tax Credit | | | 1.1 | |
Odour Control Tax Credit* | | | - | |
Riparian Tax Credit* | | | - | |
Neighbourhoods Alive! Tax Credit* | | | - | |
Nutrient Management Tax Credit* | | | - | |
| |
HEALTH AND EDUCATION LEVY | | | | |
$1.25 million exemption | | | 143.1 | |
Exemption for interjurisdictional common carriers | | | 14.5 | |
| |
RETAIL SALES TAX | | | | |
Personal Tax Credit | | | 44.2 | |
Data Processing Investment Tax Credit* | | | - | |
Exemptions | | | | |
Groceries | | | 170.8 | |
Farm machinery and repairs | | | 46.0 | |
Farm and organic fertilizer | | | 23.5 | |
Prescription drugs and medicine | | | 23.3 | |
Books, free magazines and newspapers, and school yearbooks | | | 19.1 | |
Farm pesticides and herbicides | | | 17.2 | |
Medical supplies, appliances and equipment | | | 15.3 | |
Water supplied by a municipality | | | 13.2 | |
Electricity used for manufacturing or mining | | | 12.2 | |
Children’s clothing and footwear | | | 11.9 | |
Natural gas for residential heating | | | 9.8 | |
Custom software and computer programming | | | 8.0 | |
Vehicle trade-ins | | | 6.5 | |
Toll-free calls | | | 6.2 | |
Electricity for residential heating | | | 6.1 | |
Vehicle private buy/sell refunds | | | 3.8 | |
Direct agents and qualifying items used in manufacturing a product for sale and in mining or processing minerals | | | 3.3 | |
Municipal exemptions (including the purchase of ambulances, fire trucks and related equipment, and gravel or sand purchased by a municipality for its own use) | | | 1.8 | |
Qualifying geophysical survey and explorations equipment, drill rigs and well servicing equipment used in oil and gas exploration and development | | | 1.6 | |
C 2 2 / T a x a t i o n A d j u s t m e n t s B U D G E T 2 0 1 3
| | | | |
| | | (Millions of Dollars) | |
| |
Exemptions (continued) | | | | |
Feminine hygiene products | | | 1.3 | |
Mobile, ready-to-move and modular homes (point of sale reduction) | | | 0.9 | |
Films for public broadcast | | | 0.4 | |
Non-prescription smoking cessation products | | | 0.4 | |
Farm manure slurry tanks and lagoon liners | | | 0.1 | |
Qualifying geophysical survey and exploration equipment, and prototype mining equipment | | | 0.1 | |
| |
FUEL TAX | | | | |
Marked gasoline and diesel | | | 41.3 | |
Ethanol grant | | | 18.8 | |
International cargo flight refunds | | | 0.1 | |
| |
CORPORATE CAPITAL TAX | | | | |
Elimination of general Corporation Capital Tax | | | 128.9 | |
Credit unions and caisses populaires exemption | | | 12.6 | |
Small banks and trust and loan corporations exemptions | | | 0.8 | |
Co-operatives exemption | | | 0.7 | |
Capital deduction | | | 0.2 | |
All estimates are based on the most complete information available at the time of publication.
In some cases, new information may significantly revise earlier estimates.
* Tax credit uptake is negligible
Source: Manitoba Finance, April 5, 2013
B U D G E T 2 0 1 3 T a x a t i o n A d j u s t m e n t s / C 2 3
THE MANITOBA ADVANTAGE
Manitoba’s competitive cost structure and central geographical location in North America support an independent and interconnected mix of industries, including manufacturing, wholesale trade, transportation, mining, agriculture and financial services. As a result, the province is recognized as one of the most diversified economies in Canada with 11 different industrial sectors each making up more than 5% of the total economy.
Encouraged by initiatives and development opportunities, Manitoba has posted the second-fastest real GDP growth among provinces in the last five years. Over the same period, capital investment increased 38% in Manitoba, the third-highest increase among provinces, and double the 19% national increase. According to Statistics Canada, Winnipeg, Manitoba’s capital city, ranks third among metropolitan areas in Canada for highest number of head offices per capita. In 2011, Manitobans also declared the highest per capita of charitable donations in Canada.
Manitoba provides businesses and residents with a unique set of benefits that we call “The Manitoba Advantage:”
| — | | a productive, well-educated and multilingual labour force that consistently generates an unemployment rate among the lowest in Canada, and the highest overall labour force participation rate in Canada; |
| — | | a favourable business cost environment, including competitive office and land costs, reasonable construction costs and affordable taxes; |
| — | | a supportive capital investment information network for new and expanding business, including Manitoba Business Gateways, Yes! Winnipeg and CentrePort Canada, among others; |
| — | | an extensive network of R&D facilities and communication infrastructure supporting innovation and productivity; |
| — | | a convenient mid-continent location with cost-effective transportation links and intermodal facilities providing shipping by road, rail, air and sea, enhanced by CentrePort Canada, the country’s first foreign trade zone and inland port; |
| — | | a favourable cost of living, including among the lowest electricity costs in North America; affordable automobile insurance rates; reliable and accessible public services, including quality universal public health care and education; |
| — | | a dynamic cultural and artistic community; and |
| — | | a strong background of caring, high level of charitable giving and volunteering; and an attractive natural environment with plenty of opportunities for recreation and relaxation which further enhance Manitobans’ quality of life. |
To show Manitoba’s cost competitiveness in more detail, several analyses are provided. The interprovincial comparison of annual personal costs and taxes, net of credits and rebates, compares provinces’ living costs and tax levels for a variety of family types (see p. C26).
Manitoba’s Competitive Environment for Manufacturing provides a detailed comparison of the taxes and costs faced by representative manufacturers in various Canadian and U.S. cities (see p. C34).
Since 1999, Manitoba’s overall provincial rankings for personal costs and taxes have been among the best in Canada. For 2013, Manitoba’s performance remains favourable. Interprovincial comparison of provincial taxes, utilities and housing costs for five representative family types continues to leave Manitoba ranking in the top three most affordable provinces in which to live and work.
C 2 4 / T a x a t i o n A d j u s t m e n t s B U D G E T 2 0 1 3
2013 Comparison of Personal Costs and Taxes
Single Person Earning $30,000
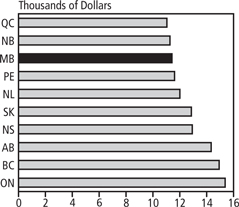
Two-Earner Family of Four
Earning $60,000
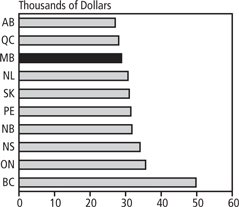
Single Parent Earning $30,000
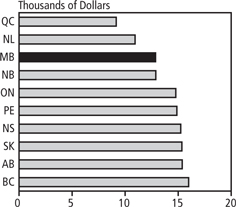
Two-Earner Family of Five
Earning $75,000
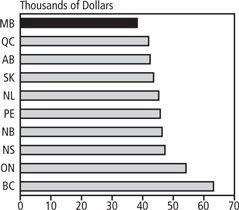
All Charts Source: Manitoba Finance
B U D G E T 2 0 1 3 T a x a t i o n A d j u s t m e n t s / C 2 5
C 2 6 / T a x a t i o n A d j u s t m e n t s B U D G E T 2 0 1 3
2013 Comparison of Personal Costs and Taxes
| | | | | | | | | | | | | | | | | | | | | | | | | | | | | | |
| Single Person: $30,000 | | | | BC | | | | | AB | | | | | SK | | | | | MB | | | | | ON | |
| | | | | | | | | | |
Provincial Income Tax | | | | | 847 | | | | | | 1,053 | | | | | | 1,196 | | | | | | 1,378 | | | | | | 394 | |
Health Premiums | | | | | 798 | | | | | | 0 | | | | | | 0 | | | | | | 0 | | | | | | 300 | |
| | | | | | | | | | | | | | | | | | | | | | | | | | | | | | |
Subtotal PIT and Premiums | | | | | 1,645 | | | | | | 1,053 | | | | | | 1,196 | | | | | | 1,378 | | | | | | 694 | |
| | | | | | | | | | | | | | | | | | | | | | | | | | | | | | |
| | | | | | | | | | |
Provincial Sales Tax | | | | | 214 | | | | | | 0 | | | | | | 141 | | | | | | 314 | | | | | | 498 | |
Carbon Tax Credit | | | | | (116) | | | | | | 0 | | | | | | 0 | | | | | | 0 | | | | | | 0 | |
| | | | | | | | | | | | | | | | | | | | | | | | | | | | | | |
Total Provincial Taxes, Credits and Premiums | | | | | 1,744 | | | | | | 1,053 | | | | | | 1,337 | | | | | | 1,691 | | | | | | 1,192 | |
| | | | | | | | | | | | | | | | | | | | | | | | | | | | | | |
| | | | | | | | | | |
Rent | | | | | 11,784 | | | | | | 11,496 | | | | | | 9,972 | | | | | | 8,448 | | | | | | 12,084 | |
Utilities | | | | | 365 | | | | | | 772 | | | | | | 718 | | | | | | 393 | | | | | | 640 | |
Public Transit | | | | | 1,037 | | | | | | 1,015 | | | | | | 833 | | | | | | 886 | | | | | | 1,464 | |
| | | | | | | | | | | | | | | | | | | | | | | | | | | | | | |
Total Living Costs | | | | | 13,186 | | | | | | 13,283 | | | | | | 11,523 | | | | | | 9,727 | | | | | | 14,188 | |
| | | | | | | | | | | | | | | | | | | | | | | | | | | | | | |
Total Personal Costs and Taxes | | | | | 14,930 | | | | | | 14,336 | | | | | | 12,860 | | | | | | 11,419 | | | | | | 15,380 | |
| | | | | | | | | | | | | | | | | | | | | | | | | | | | | | |
| | | | | | | | | | |
Single Parent, One Child: $30,000 | | | | BC | | | | | AB | | | | | SK | | | | | MB | | | | | ON | |
| | | | | | | | | | |
Provincial Income Tax | | | | | 181 | | | | | | 0 | | | | | | (474) | | | | | | (53) | | | | | | (827) | |
Health Premiums | | | | | 835 | | | | | | 0 | | | | | | 0 | | | | | | 0 | | | | | | 300 | |
| | | | | | | | | | | | | | | | | | | | | | | | | | | | | | |
Subtotal PIT and Premiums | | | | | 1,016 | | | | | | 0 | | | | | | (474) | | | | | | (53) | | | | | | (527) | |
| | | | | | | | | | | | | | | | | | | | | | | | | | | | | | |
| | | | | | | | | | |
Family/Employment Tax Credits | | | | | 0 | | | | | | (507) | | | | | | 0 | | | | | | 0 | | | | | | 0 | |
Child Benefits | | | | | 0 | | | | | | 0 | | | | | | 0 | | | | | | 0 | | | | | | 0 | |
Provincial Sales Tax | | | | | 279 | | | | | | 0 | | | | | | 183 | | | | | | 408 | | | | | | 647 | |
Carbon Tax Credit | | | | | (231) | | | | | | 0 | | | | | | 0 | | | | | | 0 | | | | | | 0 | |
| | | | | | | | | | | | | | | | | | | | | | | | | | | | | | |
Total Provincial Taxes, Credits and Premiums | | | | | 1,064 | | | | | | (507) | | | | | | (291) | | | | | | 354 | | | | | | 120 | |
| | | | | | | | | | | | | | | | | | | | | | | | | | | | | | |
| | | | | | | | | | |
Rent | | | | | 11,784 | | | | | | 11,496 | | | | | | 9,972 | | | | | | 8,448 | | | | | | 12,084 | |
Child Care | | | | | 1,740 | | | | | | 2,604 | | | | | | 4,115 | | | | | | 2,793 | | | | | | 476 | |
Utilities | | | | | 365 | | | | | | 772 | | | | | | 718 | | | | | | 393 | | | | | | 640 | |
Public Transit | | | | | 1,037 | | | | | | 1,015 | | | | | | 833 | | | | | | 886 | | | | | | 1,464 | |
| | | | | | | | | | | | | | | | | | | | | | | | | | | | | | |
Total Living Costs | | | | | 14,926 | | | | | | 15,887 | | | | | | 15,638 | | | | | | 12,520 | | | | | | 14,664 | |
| | | | | | | | | | | | | | | | | | | | | | | | | | | | | | |
Total Personal Costs and Taxes | | | | | 15,990 | | | | | | 15,380 | | | | | | 15,347 | | | | | | 12,875 | | | | | | 14,784 | |
| | | | | | | | | | | | | | | | | | | | | | | | | | | | | | |
Sums may not add due to rounding.
B U D G E T 2 0 1 3 T a x a t i o n A d j u s t m e n t s / C 2 7
| | | | | | | | | | | | | | | | | | | | | | | | | | | | | | |
| QC | | | | | NB | | | | | NS | | | | | PE | | | | | NL | | | | | Single Person: $30,000 |
| | | | | | | | | | |
| | 896 | | | | | | 1,617 | | | | | | 1,497 | | | | | | 2,001 | | | | | | 1,515 | | | | | Provincial Income Tax |
| | 839 | | | | | | 0 | | | | | | 0 | | | | | | 0 | | | | | | 0 | | | | | Health Premiums |
| | | | | | | | | | | | | | | | | | | | | | | | | | | | | | |
| | 1,735 | | | | | | 1,617 | | | | | | 1,497 | | | | | | 2,001 | | | | | | 1,515 | | | | | Subtotal PIT and Premiums |
| | | | | | | | | | | | | | | | | | | | | | | | | | | | | | |
| | | | | | | | | | |
| | 547 | | | | | | 480 | | | | | | 644 | | | | | | 490 | | | | | | 530 | | | | | Provincial Sales Tax |
| | 0 | | | | | | 0 | | | | | | 0 | | | | | | 0 | | | | | | 0 | | | | | Carbon Tax Credit |
| | | | | | | | | | | | | | | | | | | | | | | | | | | | | | |
| | 2,282 | | | | | | 2,097 | | | | | | 2,140 | | | | | | 2,490 | | | | | | 2,044 | | | | | Total Provincial Taxes, Credits and Premiums |
| | | | | | | | | | | | | | | | | | | | | | | | | | | | | | |
| | | | | | | | | | |
| | 7,644 | | | | | | 7,812 | | | | | | 9,252 | | | | | | 7,572 | | | | | | 8,508 | | | | | Rent |
| | 393 | | | | | | 597 | | | | | | 768 | | | | | | 847 | | | | | | 683 | | | | | Utilities |
| | 725 | | | | | | 764 | | | | | | 766 | | | | | | 704 | | | | | | 775 | | | | | Public Transit |
| | | | | | | | | | | | | | | | | | | | | | | | | | | | | | |
| | 8,762 | | | | | | 9,173 | | | | | | 10,786 | | | | | | 9,123 | | | | | | 9,966 | | | | | Total Living Costs |
| | | | | | | | | | | | | | | | | | | | | | | | | | | | | | |
| | 11,044 | | | | | | 11,269 | | | | | | 12,927 | | | | | | 11,613 | | | | | | 12,011 | | | | | Total Personal Costs and Taxes |
| | | | | | | | | | | | | | | | | | | | | | | | | | | | | | |
| | | | | | | | | | |
| | QC | | | | | | NB | | | | | | NS | | | | | | PE | | | | | | NL | | | | | Single Parent, One Child: $30,000 |
| | | | | | | | | | |
| | 824 | | | | | | 0 | | | | | | 403 | | | | | | 1,040 | | | | | | 286 | | | | | Provincial Income Tax |
| | 565 | | | | | | 0 | | | | | | 0 | | | | | | 0 | | | | | | 0 | | | | | Health Premiums |
| | | | | | | | | | | | | | | | | | | | | | | | | | | | | | |
| | 1,389 | | | | | | 0 | | | | | | 403 | | | | | | 1,040 | | | | | | 286 | | | | | Subtotal PIT and Premiums |
| | | | | | | | | | | | | | | | | | | | | | | | | | | | | | |
| | | | | | | | | | |
| | (393) | | | | | | (250) | | | | | | 0 | | | | | | 0 | | | | | | 0 | | | | | Family/Employment Tax Credits |
| | (3,132) | | | | | | (86) | | | | | | 0 | | | | | | 0 | | | | | | 0 | | | | | Child Benefits |
| | 711 | | | | | | 623 | | | | | | 837 | | | | | | 636 | | | | | | 688 | | | | | Provincial Sales Tax |
| | 0 | | | | | | 0 | | | | | | 0 | | | | | | 0 | | | | | | 0 | | | | | Carbon Tax Credit |
| | | | | | | | | | | | | | | | | | | | | | | | | | | | | | |
| | (1,425) | | | | | | 288 | | | | | | 1,240 | | | | | | 1,676 | | | | | | 974 | | | | | Total Provincial Taxes, Credits and Premiums |
| | | | | | | | | | | | | | | | | | | | | | | | | | | | | | |
| | | | | | | | | | |
| | 7,644 | | | | | | 7,812 | | | | | | 9,252 | | | | | | 7,572 | | | | | | 8,508 | | | | | Rent |
| | 1,820 | | | | | | 3,427 | | | | | | 3,218 | | | | | | 4,080 | | | | | | 0 | | | | | Child Care |
| | 393 | | | | | | 597 | | | | | | 768 | | | | | | 847 | | | | | | 683 | | | | | Utilities |
| | 725 | | | | | | 764 | | | | | | 766 | | | | | | 704 | | | | | | 775 | | | | | Public Transit |
| | | | | | | | | | | | | | | | | | | | | | | | | | | | | | |
| | 10,582 | | | | | | 12,600 | | | | | | 14,004 | | | | | | 13,203 | | | | | | 9,966 | | | | | Total Living Costs |
| | | | | | | | | | | | | | | | | | | | | | | | | | | | | | |
| | 9,157 | | | | | | 12,887 | | | | | | 15,244 | | | | | | 14,879 | | | | | | 10,940 | | | | | Total Personal Costs and Taxes |
| | | | | | | | | | | | | | | | | | | | | | | | | | | | | | |
Sums may not add due to rounding.
C 2 8 / T a x a t i o n A d j u s t m e n t s B U D G E T 2 0 1 3
2013 Comparison of Personal Costs and Taxes
| | | | | | | | | | | | | | | | | | | | | | | | | | | | | | |
| Two-Earner Family of 4: $60,000 | | | | BC | | | | | AB | | | | | SK | | | | | MB | | | | | ON | |
| | | | | | | | | | |
Provincial Income Tax | | | | | 1,186 | | | | | | 1,612 | | | | | | 437 | | | | | | 2,901 | | | | | | 563 | |
Health Premiums | | | | | 1,596 | | | | | | 0 | | | | | | 0 | | | | | | 0 | | | | | | 300 | |
| | | | | | | | | | | | | | | | | | | | | | | | | | | | | | |
Subtotal PIT and Premiums | | | | | 2,782 | | | | | | 1,612 | | | | | | 437 | | | | | | 2,901 | | | | | | 863 | |
| | | | | | | | | | | | | | | | | | | | | | | | | | | | | | |
| | | | | | | | | | |
Family/Employment Tax Credits | | | | | 0 | | | | | | (1,390) | | | | | | 0 | | | | | | 0 | | | | | | 0 | |
Child Benefits | | | | | 0 | | | | | | 0 | | | | | | 0 | | | | | | 0 | | | | | | 58 | |
Property Taxes | | | | | 3,469 | | | | | | 2,383 | | | | | | 2,513 | | | | | | 2,965 | | | | | | 2,993 | |
Property Tax Credits | | | | | (570) | | | | | | 0 | | | | | | 0 | | | | | | (700) | | | | | | (59) | |
Provincial Sales Tax | | | | | 752 | | | | | | 0 | | | | | | 706 | | | | | | 1,204 | | | | | | 1,850 | |
Gasoline Tax | | | | | 635 | | | | | | 270 | | | | | | 450 | | | | | | 420 | | | | | | 441 | |
Carbon Tax Credit | | | | | (83) | | | | | | 0 | | | | | | 0 | | | | | | 0 | | | | | | 0 | |
| | | | | | | | | | | | | | | | | | | | | | | | | | | | | | |
Total Provincial Taxes, Credits and Premiums | | | | | 6,985 | | | | | | 2,875 | | | | | | 4,106 | | | | | | 6,790 | | | | | | 6,146 | |
| | | | | | | | | | | | | | | | | | | | | | | | | | | | | | |
| | | | | | | | | | |
Mortgage Costs | | | | | 22,489 | | | | | | 11,771 | | | | | | 10,355 | | | | | | 8,445 | | | | | | 13,878 | |
Child Care | | | | | 15,972 | | | | | | 7,956 | | | | | | 12,789 | | | | | | 10,296 | | | | | | 7,969 | |
Utilities | | | | | 1,626 | | | | | | 1,900 | | | | | | 1,954 | | | | | | 1,490 | | | | | | 1,903 | |
Auto Insurance | | | | | 2,719 | | | | | | 2,581 | | | | | | 1,812 | | | | | | 1,825 | | | | | | 5,723 | |
| | | | | | | | | | | | | | | | | | | | | | | | | | | | | | |
Total Living Costs | | | | | 42,806 | | | | | | 24,208 | | | | | | 26,910 | | | | | | 22,056 | | | | | | 29,473 | |
| | | | | | | | | | | | | | | | | | | | | | | | | | | | | | |
Total Personal Costs and Taxes | | | | | 49,791 | | | | | | 27,083 | | | | | | 31,016 | | | | | | 28,846 | | | | | | 35,619 | |
| | | | | | | | | | | | | | | | | | | | | | | | | | | | | | |
| | | | | | | | | | |
| Two-Earner Family of 5: $75,000 | | | | BC | | | | | AB | | | | | SK | | | | | MB | | | | | ON | |
| | | | | | | | | | |
Provincial Income Tax | | | | | 1,806 | | | | | | 2,313 | | | | | | 1,950 | | | | | | 4,198 | | | | | | 1,312 | |
Health Premiums | | | | | 1,596 | | | | | | 0 | | | | | | 0 | | | | | | 0 | | | | | | 519 | |
| | | | | | | | | | | | | | | | | | | | | | | | | | | | | | |
Subtotal PIT and Premiums | | | | | 3,402 | | | | | | 2,313 | | | | | | 1,950 | | | | | | 4,198 | | | | | | 1,831 | |
| | | | | | | | | | | | | | | | | | | | | | | | | | | | | | |
| | | | | | | | | | |
Family/Employment Tax Credits | | | | | 0 | | | | | | (1,787) | | | | | | 0 | | | | | | 0 | | | | | | 0 | |
Child Benefits | | | | | 0 | | | | | | 0 | | | | | | 0 | | | | | | 0 | | | | | | 526 | |
Property Taxes | | | | | 3,814 | | | | | | 3,115 | | | | | | 3,454 | | | | | | 3,753 | | | | | | 4,912 | |
Property Tax Credits | | | | | (570) | | | | | | 0 | | | | | | 0 | | | | | | (700) | | | | | | 0 | |
Provincial Sales Tax | | | | | 979 | | | | | | 0 | | | | | | 574 | | | | | | 1,416 | | | | | | 2,341 | |
Gasoline Tax | | | | | 635 | | | | | | 270 | | | | | | 450 | | | | | | 420 | | | | | | 441 | |
| | | | | | | | | | | | | | | | | | | | | | | | | | | | | | |
Total Provincial Taxes, Credits and Premiums | | | | | 8,261 | | | | | | 3,911 | | | | | | 6,428 | | | | | | 9,088 | | | | | | 10,050 | |
| | | | | | | | | | | | | | | | | | | | | | | | | | | | | | |
| | | | | | | | | | |
Mortgage Costs | | | | | 25,164 | | | | | | 15,386 | | | | | | 14,233 | | | | | | 11,381 | | | | | | 22,773 | |
Child Care | | | | | 24,294 | | | | | | 17,388 | | | | | | 17,829 | | | | | | 13,438 | | | | | | 12,451 | |
Home Heating | | | | | 2,710 | | | | | | 3,167 | | | | | | 3,256 | | | | | | 2,483 | | | | | | 3,172 | |
Auto Insurance | | | | | 2,719 | | | | | | 2,581 | | | | | | 1,812 | | | | | | 1,825 | | | | | | 5,723 | |
| | | | | | | | | | | | | | | | | | | | | | | | | | | | | | |
Total Living Costs | | | | | 54,887 | | | | | | 38,522 | | | | | | 37,130 | | | | | | 29,127 | | | | | | 44,119 | |
| | | | | | | | | | | | | | | | | | | | | | | | | | | | | | |
Total Personal Costs and Taxes | | | | | 63,148 | | | | | | 42,433 | | | | | | 43,558 | | | | | | 38,215 | | | | | | 54,169 | |
| | | | | | | | | | | | | | | | | | | | | | | | | | | | | | |
Sums may not add due to rounding.
B U D G E T 2 0 1 3 T a x a t i o n A d j u s t m e n t s / C 2 9
| | | | | | | | | | | | | | | | | | | | | | | | | | | | | | |
| QC | | | | | NB | | | | | NS | | | | | PE | | | | | NL | | | | | Two-Earner Family of 4: $60,000 |
| | | | | | | | | | |
| | 4,584 | | | | | | 2,299 | | | | | | 2,685 | | | | | | 2,888 | | | | | | 2,232 | | | | | Provincial Income Tax |
| | 1,677 | | | | | | 0 | | | | | | 0 | | | | | | 0 | | | | | | 0 | | | | | Health Premiums |
| | | | | | | | | | | | | | | | | | | | | | | | | | | | | | |
| | 6,261 | | | | | | 2,299 | | | | | | 2,685 | | | | | | 2,888 | | | | | | 2,232 | | | | | Subtotal PIT and Premiums |
| | | | | | | | | | | | | | | | | | | | | | | | | | | | | | |
| | | | | | | | | | |
| | 0 | | | | | | (250) | | | | | | 0 | | | | | | 0 | | | | | | 0 | | | | | Family/Employment Tax Credits |
| | (2,870) | | | | | | 0 | | | | | | 0 | | | | | | 0 | | | | | | 0 | | | | | Child Benefits |
| | 3,083 | | | | | | 2,701 | | | | | | 2,375 | | | | | | 2,600 | | | | | | 1,986 | | | | | Property Taxes |
| | 0 | | | | | | 0 | | | | | | 0 | | | | | | 0 | | | | | | 0 | | | | | Property Tax Credits |
| | 2,122 | | | | | | 1,781 | | | | | | 2,319 | | | | | | 1,578 | | | | | | 1,964 | | | | | Provincial Sales Tax |
| | 546 | | | | | | 408 | | | | | | 465 | | | | | | 474 | | | | | | 495 | | | | | Gasoline Tax |
| | 0 | | | | | | 0 | | | | | | 0 | | | | | | 0 | | | | | | 0 | | | | | Carbon Tax Credit |
| | | | | | | | | | | | | | | | | | | | | | | | | | | | | | |
| | 9,143 | | | | | | 6,939 | | | | | | 7,844 | | | | | | 7,540 | | | | | | 6,677 | | | | | Total Provincial Taxes, Credits and Premiums |
| | | | | | | | | | | | | | | | | | | | | | | | | | | | | | |
| | 8,054 | | | | | | 5,836 | | | | | | 8,184 | | | | | | 4,896 | | | | | | 7,544 | | | | | Mortgage Costs |
| | 3,640 | | | | | | 14,050 | | | | | | 13,234 | | | | | | 13,000 | | | | | | 10,193 | | | | | Child Care |
| | 1,998 | | | | | | 2,909 | | | | | | 2,752 | | | | | | 4,158 | | | | | | 3,850 | | | | | Utilities |
| | 5,217 | | | | | | 2,026 | | | | | | 2,032 | | | | | | 1,880 | | | | | | 2,407 | | | | | Auto Insurance |
| | | | | | | | | | | | | | | | | | | | | | | | | | | | | | |
| | 18,909 | | | | | | 24,821 | | | | | | 26,202 | | | | | | 23,934 | | | | | | 23,994 | | | | | Total Living Costs |
| | | | | | | | | | | | | | | | | | | | | | | | | | | | | | |
| | 28,052 | | | | | | 31,760 | | | | | | 34,046 | | | | | | 31,474 | | | | | | 30,671 | | | | | Total Personal Costs and Taxes |
| | | | | | | | | | | | | | | | | | | | | | | | | | | | | | |
| | | | | | | | | | |
| QC | | | | | NB | | | | | NS | | | | | PE | | | | | NL | | | | | Two-Earner Family of 5: $75,000 |
| | | | | | | | | | |
| | 7,018 | | | | | | 3,760 | | | | | | 3,904 | | | | | | 3,981 | | | | | | 3,221 | | | | | Provincial Income Tax |
| | 1,861 | | | | | | 0 | | | | | | 0 | | | | | | 0 | | | | | | 0 | | | | | Health Premiums |
| | | | | | | | | | | | | | | | | | | | | | | | | | | | | | |
| | 8,879 | | | | | | 3,760 | | | | | | 3,904 | | | | | | 3,981 | | | | | | 3,221 | | | | | Subtotal PIT and Premiums |
| | | | | | | | | | | | | | | | | | | | | | | | | | | | | | |
| | | | | | | | | | |
| | 0 | | | | | | (250) | | | | | | 0 | | | | | | 0 | | | | | | 0 | | | | | Family/Employment Tax Credits |
| | (3,429) | | | | | | 0 | | | | | | 0 | | | | | | 0 | | | | | | 0 | | | | | Child Benefits |
| | 5,367 | | | | | | 3,874 | | | | | | 2,957 | | | | | | 3,900 | | | | | | 3,170 | | | | | Property Taxes |
| | 0 | | | | | | 0 | | | | | | 0 | | | | | | 0 | | | | | | 0 | | | | | Property Tax Credits |
| | 2,569 | | | | | | 2,242 | | | | | | 2,837 | | | | | | 1,733 | | | | | | 2,279 | | | | | Provincial Sales Tax |
| | 546 | | | | | | 408 | | | | | | 465 | | | | | | 474 | | | | | | 495 | | | | | Gasoline Tax |
| | | | | | | | | | | | | | | | | | | | | | | | | | | | | | |
| | 13,933 | | | | | | 10,034 | | | | | | 10,163 | | | | | | 10,088 | | | | | | 9,165 | | | | | Total Provincial Taxes, Credits and Premiums |
| | | | | | | | | | | | | | | | | | | | | | | | | | | | | | |
| | | | | | | | | | |
| | 14,020 | | | | | | 8,369 | | | | | | 10,191 | | | | | | 7,344 | | | | | | 12,041 | | | | | Mortgage Costs |
| | 5,460 | | | | | | 21,076 | | | | | | 20,295 | | | | | | 19,500 | | | | | | 15,227 | | | | | Child Care |
| | 3,330 | | | | | | 4,848 | | | | | | 4,586 | | | | | | 6,930 | | | | | | 6,416 | | | | | Home Heating |
| | 5,217 | | | | | | 2,026 | | | | | | 2,032 | | | | | | 1,880 | | | | | | 2,407 | | | | | Auto Insurance |
| | | | | | | | | | | | | | | | | | | | | | | | | | | | | | |
| | 28,027 | | | | | | 36,319 | | | | | | 37,104 | | | | | | 35,654 | | | | | | 36,091 | | | | | Total Living Costs |
| | | | | | | | | | | | | | | | | | | | | | | | | | | | | | |
| | 41,960 | | | | | | 46,353 | | | | | | 47,267 | | | | | | 45,742 | | | | | | 45,256 | | | | | Total Personal Costs and Taxes |
| | | | | | | | | | | | | | | | | | | | | | | | | | | | | | |
Sums may not add due to rounding.
C 3 0 / T a x a t i o n A d j u s t m e n t s B U D G E T 2 0 1 3
2013 Comparison of Personal Costs and Taxes
Net of Graduate Credits and Tuition Rebates
| | | | | | | | | | | | | | | | | | | | | | | | | | | | | | |
| Single Person (Graduate): $50,000 | | | | BC | | | | | AB | | | | | SK | | | | | MB | | | | | ON | |
| | | | | | | | | | |
Provincial Income Tax | | | | | 2,177 | | | | | | 2,921 | | | | | | 3,614 | | | | | | 4,466 | | | | | | 2,302 | |
Graduate Tuition Credit/Rebate | | | | | 0 | | | | | | 0 | | | | | | (2,000) | | | | | | (2,500) | | | | | | 0 | |
Health Premiums | | | | | 798 | | | | | | 0 | | | | | | 0 | | | | | | 0 | | | | | | 600 | |
| | | | | | | | | | | | | | | | | | | | | | | | | | | | | | |
Subtotal PIT, Credit and Premiums | | | | | 2,975 | | | | | | 2,921 | | | | | | 1,614 | | | | | | 1,966 | | | | | | 2,902 | |
| | | | | | | | | | | | | | | | | | | | | | | | | | | | | | |
| | | | | | | | | | |
Property Taxes | | | | | 3,469 | | | | | | 2,383 | | | | | | 2,513 | | | | | | 2,965 | | | | | | 2,993 | |
Property Tax Credits | | | | | (570) | | | | | | 0 | | | | | | 0 | | | | | | (700) | | | | | | 0 | |
Provincial Sales Tax | | | | | 324 | | | | | | 0 | | | | | | 264 | | | | | | 511 | | | | | | 788 | |
Gasoline Tax | | | | | 423 | | | | | | 180 | | | | | | 300 | | | | | | 280 | | | | | | 294 | |
| | | | | | | | | | | | | | | | | | | | | | | | | | | | | | |
Total Provincial Taxes, Credits and Premiums | | | | | 6,621 | | | | | | 5,484 | | | | | | 4,691 | | | | | | 5,022 | | | | | | 6,977 | |
| | | | | | | | | | | | | | | | | | | | | | | | | | | | | | |
| | | | | | | | | | |
Mortgage Costs | | | | | 22,489 | | | | | | 11,771 | | | | | | 10,355 | | | | | | 8,445 | | | | | | 13,878 | |
Utilities | | | | | 1,626 | | | | | | 1,900 | | | | | | 1,954 | | | | | | 1,490 | | | | | | 1,903 | |
Auto Insurance | | | | | 1,286 | | | | | | 1,185 | | | | | | 852 | | | | | | 865 | | | | | | 4,692 | |
| | | | | | | | | | | | | | | | | | | | | | | | | | | | | | |
Total Living Costs | | | | | 25,401 | | | | | | 14,856 | | | | | | 13,161 | | | | | | 10,800 | | | | | | 20,473 | |
| | | | | | | | | | | | | | | | | | | | | | | | | | | | | | |
Total Personal Costs and Taxes | | | | | 32,022 | | | | | | 20,340 | | | | | | 17,852 | | | | | | 15,822 | | | | | | 27,450 | |
| | | | | | | | | | | | | | | | | | | | | | | | | | | | | | |
Sums may not add due to rounding.
| | | | |
Income Tax and Health Premiums Net of Graduate Credits and | | | | |
Tuition Rebates – Graduate Earning $50,000 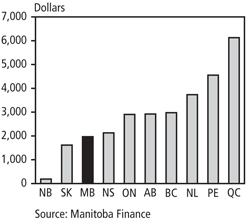
| | Personal Costs and Taxes – Graduate Earning $50,000 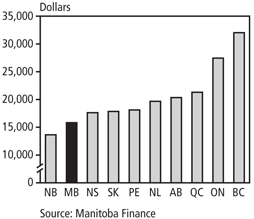
| �� | |
B U D G E T 2 0 1 3 T a x a t i o n A d j u s t m e n t s / C 3 1
| | | | | | | | | | | | | | | | | | | | | | | | | | | | | | |
| QC | | | | | NB | | | | | NS | | | | | PE | | | | | NL | | | | | Single Person (Graduate): $50,000 |
| | | | | | | | | | |
| | 5,077 | | | | | | 4,187 | | | | | | 4,626 | | | | | | 4,552 | | | | | | 3,734 | | | | | Provincial Income Tax |
| | 0 | | | | | | (4,000) | | | | | | (2,500) | | | | | | 0 | | | | | | 0 | | | | | Graduate Tuition Credit/Rebate |
| | 1,051 | | | | | | 0 | | | | | | 0 | | | | | | 0 | | | | | | 0 | | | | | Health Premiums |
| | | | | | | | | | | | | | | | | | | | | | | | | | | | | | |
| | 6,127 | | | | | | 187 | | | | | | 2,126 | | | | | | 4,552 | | | | | | 3,734 | | | | | Subtotal PIT, Credit and Premiums |
| | | | | | | | | | | | | | | | | | | | | | | | | | | | | | |
| | | | | | | | | | |
| | 3,083 | | | | | | 2,701 | | | | | | 2,375 | | | | | | 2,600 | | | | | | 1,986 | | | | | Property Taxes |
| | 0 | | | | | | 0 | | | | | | 0 | | | | | | 0 | | | | | | 0 | | | | | Property Tax Credits |
| | 914 | | | | | | 754 | | | | | | 998 | | | | | | 703 | | | | | | 835 | | | | | Provincial Sales Tax |
| | 364 | | | | | | 272 | | | | | | 310 | | | | | | 316 | | | | | | 330 | | | | | Gasoline Tax |
| | | | | | | | | | | | | | | | | | | | | | | | | | | | | | |
| | 10,488 | | | | | | 3,914 | | | | | | 5,809 | | | | | | 8,171 | | | | | | 6,885 | | | | | Total Provincial Taxes, Credits and Premiums |
| | | | | | | | | | | | | | | | | | | | | | | | | | | | | | |
| | | | | | | | | | |
| | 8,054 | | | | | | 5,836 | | | | | | 8,184 | | | | | | 4,896 | | | | | | 7,544 | | | | | Mortgage Costs |
| | 1,998 | | | | | | 2,909 | | | | | | 2,752 | | | | | | 4,158 | | | | | | 3,850 | | | | | Utilities |
| | 767 | | | | | | 987 | | | | | | 883 | | | | | | 889 | | | | | | 1,388 | | | | | Auto Insurance |
| | | | | | | | | | | | | | | | | | | | | | | | | | | | | | |
| | 10,819 | | | | | | 9,732 | | | | | | 11,819 | | | | | | 9,943 | | | | | | 12,782 | | | | | Total Living Costs |
| | | | | | | | | | | | | | | | | | | | | | | | | | | | | | |
| | 21,307 | | | | | | 13,646 | | | | | | 17,628 | | | | | | 18,114 | | | | | | 19,667 | | | | | Total Personal Costs and Taxes |
| | | | | | | | | | | | | | | | | | | | | | | | | | | | | | |
Sums may not add due to rounding.
C 3 2 / T a x a t i o n A d j u s t m e n t s B U D G E T 2 0 1 3
NOTES
Provincial taxes, credits and premiums are based on information available prior to April 5, 2013, (except for Manitoba, which includes Budget 2013 changes).
Auto insurance coverage includes $2 million Third Party Liability, a $500 All Perils Deductible, accident benefits and $2 million Standard Policy Form #44 family protection coverage for those jurisdictions without no-fault injury coverage, and La Societé de l’Assurance Automobile du Québec injury protection in Montréal. Rates were provided by the Insurance Corporation of British Columbia for BC, SGI Canada for SK, and Manitoba Public Insurance (MPI) for MB. Rates for other cities are the average of the quotes from 10 private insurers providing coverage in those provinces. Discounts for second or multiple vehicles, where available, are not included in the auto insurance calculations. Rebates issued by MPI or other insurers are also excluded. Auto insurance for the 2010 Dodge Grand Caravan SE and the 2003 Chevrolet Malibu are used in these examples, two of the more common vehicles driven in Manitoba.
Child-care costs are based on annual parent fees paid, less subsidies, for preschool aged children, typically over two years of age and under six years of age, for 260 days or 12 months per year. Manitoba, Prince Edward Island and Quebec are the only provinces with regulated maximum parent fees. Fees for other provinces are those obtained from provincial offices and online.
Gasoline Tax is based on the annual consumption of 2,000 litres for the single-vehicle family and 3,000 litres for the two-vehicle families. The Gasoline Tax includes all provincial levies on gas, including carbon tax and sales tax where applicable.
Health premiums are annual premiums for hospital insurance and medical services in provinces which levy them. Quebec’s Prescription Drug Plan, Parental Insurance Plan and Progressive Health Contribution are included.
Mortgage costs are based on average home prices for a detached bungalow and an executive detached two-storey from the “Royal LePage Fourth Quarter 2012 Survey of Canadian House Prices,” with one-half of the home price being financed over 25 years at a one-year closed mortgage rate of 3.2%.
Net child benefits represent provincial programs comparable to the Canada Child Tax Benefit for families with children.
Property taxes are based on the estimated taxes for a sample detached bungalow from the Saskatchewan 2013 Budget Paper “2013 Intercity Comparison of Taxes, Utilities and Housing.” Property taxes for the detached bungalow have been proportionally adjusted for the executive detached two-storey.
Provincial income tax is calculated for a single renter with $30,000 earned income, a single parent with one preschool child who rents and has $30,000 in earned income, and the two family profiles with $60,000 and $75,000 of earned income, respectively. These incomes are before receipt of the Universal Child Care Benefit (UCCB), but the UCCB is used in the calculation of income tax. For the single parent, UCCB is treated as taxable income of the dependent child. Family profiles include two income earners (one spouse earns 60% of the family income while the other spouse earns 40%) and two preschool children; or three preschool children. Personal non-refundable credits used include the CPP/QPP and EI contribution credits. For the single parent, child-care costs less subsidies for each province have been deducted from income. For two-earner families, eligible child-care costs have been deducted from the income of the spouse with the lower income. Gross Quebec personal income tax has been reduced by the 16.5% abatement for federal income tax. Refundable sales tax credits and provincial tax reductions and rebates have been deducted from income tax payable. Property tax credits for renters are included in income tax, but property tax credits for homeowners are shown separately.
B U D G E T 2 0 1 3 T a x a t i o n A d j u s t m e n t s / C 3 3
Rent is from Canada Mortgage and Housing Corporation’s Rental Market Survey, October 2012, and is based on the average one-bedroom apartment rent for each urban centre.
Provincial sales tax is based upon an average expenditure basket at the total income levels from the “2009 Survey of Household Spending” (Statistics Canada), inflated to 2013 values using each province’s Consumer Price Index. In addition, the change in Manitoba’s provincial sales tax rate on July 1, 2013 has been incorporated in the estimates. BC has returned to a provincial sales tax and PE has changed to the Harmonized Sales Tax.
Transit fares are based on adult monthly pass rates in effect in January 2013. The impact of the federal non-refundable public transit tax credit has reduced the cost of transit fees shown for the single individual and single parent with one child examples.
Utilities are based on the Saskatchewan 2013 Budget Paper “2013 Intercity Comparison of Taxes, Utilities and Housing.”
| — | | Home heating charges are based on an annual consumption level of 2,800 cubic metres of natural gas for a detached bungalow. Annual consumption for the detached bungalow has been proportionally adjusted for the executive detached two storey and for the Atlantic provinces, the figures represent the BTU equivalent consumption of fuel oil. |
| — | | Electricity charges are based on the annual consumption of 8,100 kWh for a detached bungalow, 13,500 kWh for the executive detached two-storey and 4,584 kWh for renters. |
C 3 4 / T a x a t i o n A d j u s t m e n t s B U D G E T 2 0 1 3
MANITOBA’S COMPETITIVE ENVIRONMENT FOR MANUFACTURING
Competitive operating costs and taxes have made Manitoba one of the least expensive provinces in Canada in which to do business. Among representative North American cities, both smaller and larger manufacturers in Brandon and Winnipeg rank at or near the best on start-up costs, net income, overall taxes and return on investment. Manitoba’s competitive business environment continues to position Manitoba as an ideal manufacturing location due to:
| — | | its central location and excellent transportation links to the rest of North America, including CentrePort Canada |
| — | | low industrial and commercial land costs |
| — | | electricity costs which are among the lowest in the world |
| — | | a skilled, well-educated and affordable work force |
| — | | one of the best R&D tax credit regimes |
| — | | low taxes on capital investments. |
| | |
Manitoba Finance’s competitiveness model compares the tax structure and cost environment for representative smaller and larger manufacturing firms relative to several other North American cities. The model simulates start-up, operating, financial and taxation costs over a period of 20 years. It incorporates future unconditional changes in taxes that have been announced by the federal, provincial, state or local governments. The representative firms’ profiles have been updated using the most recent data available from Statistics Canada, local economic development boards and other public sources. Payroll-related Levies U.S. employers pay federal and state unemployment taxes, social security tax and medicare tax, and are also required to provide workers’ compensation coverage. Canadian employers do not pay provincial unemployment or federal medicare taxes, though some provinces have taxes on payroll. For example, at the same wage level, a firm in Atlanta will have higher payroll-related taxes and levies than in Winnipeg. Interjurisdictional Competitiveness The following indicators are used to assess cost and tax competitiveness for both a smaller and a larger manufacturing firm: — net cost of investment, or start-up costs (including applicable taxes) — pre-tax net income — effective tax rates — internal rates of return. | | Payroll-Related Taxes and Levies per Employee, Larger Manufacturing Firm Winnipeg and Atlanta, 2013 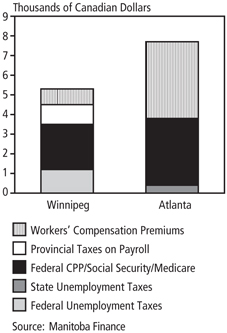
|
B U D G E T 2 0 1 3 T a x a t i o n A d j u s t m e n t s / C 3 5
The model uses actual costs for each city and calculates net revenue and cash flow, including start-up costs, based on the operating costs in each location.1 The results for each city are compared to the overall average of all cities (100.0) for each of the indicators and presented in the charts that follow.
Net Cost of Investment
The costs of starting a manufacturing plant (land, buildings, and machinery and equipment) in Manitoba cities are among the lowest of all cities. Investment tax credits on capital asset purchases reduce the net cost of investment. Start-up costs in larger cities tend to be higher due to the cost of land and construction labour wages and salaries.
| | | | |
Net Cost of Investment Smaller Manufacturing Firm 
| | Net Cost of Investment Larger Manufacturing Firm 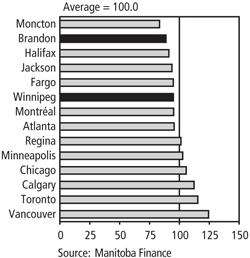
| | |
Pre-Tax Net Income
Pre-tax net income compares Manitoba’s business cost competitiveness to other jurisdictions. It is calculated by deducting production material costs and location-specific costs from fixed annual sales figures. Annual sales are uniform for all locations and are ramped up through the first four years of operation then fixed across the cities at $4 million for the smaller firm and $45 million for the larger firm for years five to twenty. Annual production material costs are equal to 46% of sales in a given year.
The following location-specific costs are also deducted from annual sales:
| — | | average manufacturing wages |
| — | | local utility costs for electricity |
| — | | interest charges on debt used to finance construction of the manufacturing plants |
| — | | depreciation of capital assets: building costs (which vary by city based on local construction wages) and machinery and equipment (which are assumed to be the same across all cities) |
| — | | employer-paid payroll related taxes, levies and health premiums. |
1 For comparison purposes, U.S. data is converted to Canadian dollars at an exchange rate of C$0.9846 (April 1, 2013 rate).
C 3 6 / T a x a t i o n A d j u s t m e n t s B U D G E T 2 0 1 3
Brandon yields the highest pre-tax net income for both the smaller and larger manufacturing firms, while Winnipeg has the sixth-highest pre-tax net income for both model firms, which is still above the overall average for all cities.
| | | | |
Pre-Tax Net Income Smaller Manufacturing Firm 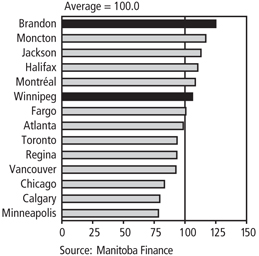
| | Pre-Tax Net Income Larger Manufacturing Firm 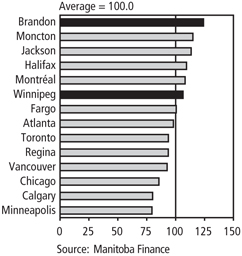
| | |
Effective Tax Rates
Effective tax rates are generated by computing gross taxes as a proportion of pre-tax net income over the 20-year period. The following annual taxes are taken into account:
| — | | corporation income taxes |
| — | | local property and business taxes |
| — | | corporation capital and U.S. franchise taxes |
| — | | workers’ compensation premiums |
| — | | statutory pension and unemployment insurance premiums. |
For U.S. firms, employer-paid health premiums are also included.
The following tax expenditures that benefit the manufacturing sector are also taken into account:
| — | | accelerated capital cost allowances |
| — | | preferential tax rates. |
B U D G E T 2 0 1 3 T a x a t i o n A d j u s t m e n t s / C 3 7
Not included are enterprise zones, grants, and other forms of governmental and third-party financial assistance programs that are subject to an approval process.
For both the smaller and larger manufacturing firms, both Winnipeg’s and Brandon’s effective tax rates are well below the overall average (100.0).
| | | | |
Effective Tax Rates Smaller Manufacturing Firm 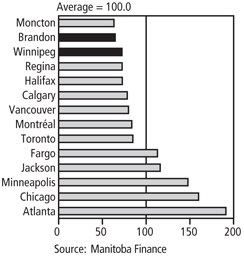
| | Effective Tax Rates Larger Manufacturing Firm 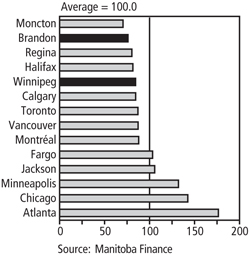
| | |
Overall Competitiveness
Overall competitiveness is compared by calculating internal rates of return, which are commonly used by business in making investment and location decisions. A higher internal rate of return indicates a city is more competitive than others. Internal rates of return for each city are calculated using start-up costs and cash flow over a 20-year period, specific to a smaller and a larger manufacturing firm, then discounted using applicable Canadian and U.S. commercial interest rates. The following charts illustrate the combined impact of taxes and costs on the internal rates of return for the representative smaller and larger manufacturing corporations in the selected jurisdictions.
The internal rates of return for both Winnipeg and Brandon are above the overall average of the cities included in the study. Brandon has the highest internal rate of return. Winnipeg has the third-highest internal rate of return for the smaller manufacturing firm and the fifth-highest internal rate of return for the larger manufacturing firm.
Among cities with populations over 500,000, Winnipeg has the highest internal rate of return for the smaller manufacturing firm and the second-highest internal rate of return for the larger manufacturing firm.
C 3 8 / T a x a t i o n A d j u s t m e n t s B U D G E T 2 0 1 3
| | | | |
Internal Rates of Return Smaller Manufacturing Firm 
Internal Rates of Return Smaller Manufacturing Firm in Cities over 500,000 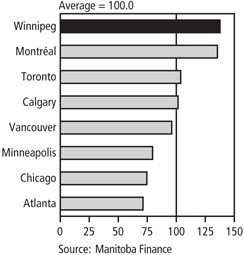
| | Internal Rates of Return Larger Manufacturing Firm 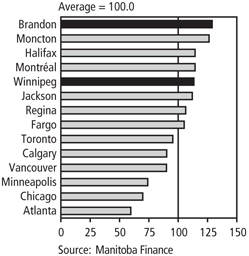
Internal Rates of Return Larger Manufacturing Firm in Cities over 500,000 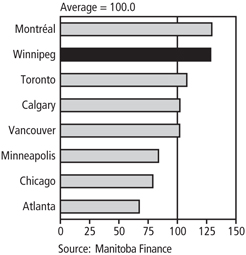
| | |
B U D G E T 2 0 1 3 T a x a t i o n A d j u s t m e n t s / C 3 9
Manitoba continues to maintain a highly competitive overall business cost and tax environment for both smaller and larger firms engaged in manufacturing and processing.
Since 1999, Manitoba has significantly reduced business taxes by:
| — | | decreasing the general corporate income tax rate from 17% to 12% |
| — | | eliminating the small business income tax rate, and increasing in this budget the income limit eligible for the nil rate from $400,000 to $425,000 |
| — | | eliminating the general capital tax |
| — | | increasing the Health and Education Tax Levy exemption threshold |
| — | | introducing tax credits for investors into Manitoba enterprises |
| — | | providing employers who hire co-op students and graduates, apprentices and newly certified journeypersons with significant tax credits |
| — | | enhancing the level of assistance for R&D and manufacturing capital investments |
| — | | encouraging youth retention through tuition fee rebates and employer hiring incentives |
| — | | introducing new tax credits for the printing, publishing, data processing and interactive digital media sectors. |
These measures ensure the Manitoba business tax environment remains competitive, especially for the manufacturing sector and small businesses.
C 4 0 / T a x a t i o n A d j u s t m e n t s B U D G E T 2 0 1 3