Exhibit 99.1
B U D G E T 2 0 1 4 / 1
SUMMARY BUDGET 2014/15
2 / B U D G E T 2 0 1 4
SUMMARY BUDGET
For the Fiscal Year Ending March 31, 2015
With Comparative Data for the year ending March 31, 2014
| | | | | | | | | | | | | | | | | | | | | | | | | |
| | | | | | | | | Per Cent Change |
| | | | | | | | | 2014/15 Budget from |
| | | 2014/15 | | 2013/14 | | 2013/14 | | 2013/14 | | 2013/14 |
| | | Budget | | Forecast | | Budget | | Forecast | | Budget |
| | | (Millions of Dollars) | | | | |
REVENUE SOURCE | | | | | | �� | | | | | | | | | | | | | | | | | | | |
Income Taxes | | | | 3,632 | | | | | 3,460 | | | | | 3,366 | | | | | 5.0 | | | | | 7.9 | |
Other Taxes | | | | 4,232 | | | | | 3,961 | | | | | 4,015 | | | | | 6.8 | | | | | 5.4 | |
Fees and Other Revenue | | | | 2,039 | | | | | 2,119 | | | | | 1,987 | | | | | (3.8) | | | | | 2.6 | |
Federal Transfers | | | | 3,793 | | | | | 3,823 | | | | | 3,876 | | | | | (0.8) | | | | | (2.1) | |
Net Income of Government Business Enterprises | | | | 692 | | | | | 863 | | | | | 737 | | | | | (19.8) | | | | | (6.1) | |
Sinking Funds and Other Earnings | | | | 242 | | | | | 238 | | | | | 227 | | | | | 1.7 | | | | | 6.6 | |
| | | | | | | | | | | | | | | | | | | | | | | | | |
TOTAL REVENUE | | | | 14,630 | | | | | 14,464 | | | | | 14,208 | | | | | 1.1 | | | | | 3.0 | |
| | | | | | | | | | | | | | | | | | | | | | | | | |
EXPENDITURE SECTORS | | | | | | | | | | | | | | | | | | | | | | | | | |
Health | | | | 5,791 | | | | | 5,684 | | | | | 5,689 | | | | | 1.9 | | | | | 1.8 | |
Education | | | | 3,895 | | | | | 3,802 | | | | | 3,786 | | | | | 2.4 | | | | | 2.9 | |
Family Services | | | | 1,115 | | | | | 1,094 | | | | | 1,069 | | | | | 1.9 | | | | | 4.3 | |
Community, Economic and Resource Development | | | | 2,477 | | | | | 2,341 | | | | | 2,483 | | | | | 5.8 | | | | | (0.2) | |
Justice and Other Expenditures | | | | 987 | | | | | 1,056 | | | | | 1,010 | | | | | (6.5) | | | | | (2.3) | |
Debt Servicing Costs | | | | 872 | | | | | 836 | | | | | 839 | | | | | 4.3 | | | | | 3.9 | |
| | | | | | | | | | | | | | | | | | | | | | | | | |
SUBTOTAL EXPENDITURE | | | | 15,137 | | | | | 14,813 | | | | | 14,876 | | | | | | | | | | | |
Extraordinary Item | | | | | | | | | | | | | | | | | | | | | | | | | |
First Nations Flood Contingency | | | | - | | | | | 100 | | | | | - | | | | | | | | | | | |
| | | | | | | | | | | | | | | | | | | | | | | | | |
TOTAL EXPENDITURE | | | | 15,137 | | | | | 14,913 | | | | | 14,876 | | | | | 1.5 | | | | | 1.8 | |
In-Year Adjustments/Lapse | | | | (150) | | | | | (17) | | | | | (150) | | | | | | | | | | | |
| | | | | | | | | | | | | | | | | | | | | | | | | |
NET INCOME (LOSS) | | | | (357) | | | | | (432) | | | | | (518) | | | | | | | | | | | |
| | | | | | | | | | | | | | | | | | | | | | | | | |
NOTES:
| • | | The 2013/14 Budget numbers originally presented in the 2013 Budget Address and the 2013/14 forecast from the Third Quarter Financial Report have been restated to be consistent with the current presentation for the GRE. |
| • | | Details of Expenditure and Revenue for Fiscal Year 2014/15, and a reconciliation to the amounts reported for core government can be found in Schedules 1 and 2. |
| • | | In-Year Adjustments/Lapse could be an increase in revenue and/or a decrease in expenditures. |
| • | | Numbers may not add due to rounding. |
B U D G E T 2 0 1 4 / 3
n SUMMARY BUDGET 2014/15
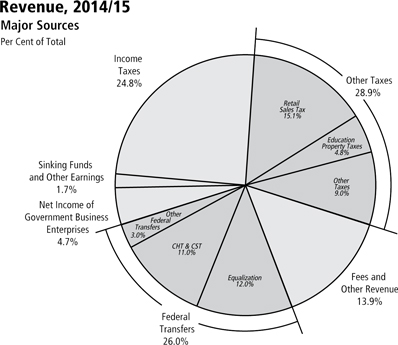
Revenue
Revenue in 2014/15 is projected to increase $166 million or 1.1% from the 2013/14 Forecast.
Income taxes are projected to increase by $172 million, with a $132 million increase in Individual Income Tax and an increase of $40 million in Corporation Income Tax. Budget 2014 projects a $271 million, or 6.8%, increase in other taxes reflecting growth in retail sales tax, fuel taxes, tobacco tax and corporations taxes. Fees and Other Revenue is projected to decline $80 million, or 3.8%. Net Income of Government Business Enterprises (GBEs) is projected to decline $171 million, or 19.8%. Federal transfers are projected to decrease $30 million, or 0.8%.
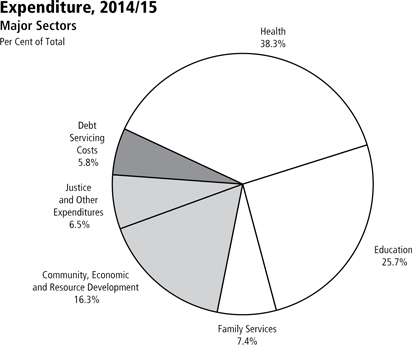
Expenditure
Total expenditure is budgeted to increase $224 million or 1.5% from the 2013/14 Forecast.
The growth in Health expenditure is $107 million or 1.9%. Education-related expenditure is increasing by $93 million or 2.4%. Family Services is up $21 million or 1.9%. Community, Economic and Resource Development expenditure will increase by $136 million or 5.8%. The Justice and Other Expenditures sector will decrease by $69 million, or 6.5%. Debt Servicing Costs are expected to increase by $36 million.1
In Budget 2014, services to people represent 76.4% of spending.
Health expenditure makes up 38.3% of total expenditure.
Education accounts for 25.7% of all expenditure; it includes public schools and post-secondary institutions.
Family Services, Justice, and Housing and Community Development represent 12.4% of total expenditure.
| 1 | Debt Servicing Costs are forecast to equal 6.0¢ of every dollar of revenue in 2014/15, down 54.5% from 13.2¢ per dollar in 1999/2000. |
4 / B U D G E T 2 0 1 4
Schedule 1
Summary Revenue Estimate: Details and Reconciliation to Core Government Estimates
Fiscal Year ending March 31, 2015 (in Thousands of Dollars)
| | | | | | | | | | | | | | | |
| | | CORE GOVERNMENT | | CONSOLIDATION IMPACTS | | SUMMARY |
| | | Revenue | | and Revenue of Other | | |
| Source of Revenue | | Estimate | | Reporting Entities | | |
Income Taxes | | | | | | | | | | | | | | | |
Individual Income Tax | | | | 3,101,900 | | | | | - | | | | | 3,101,900 | |
Corporation Income Tax | | | | 530,100 | | | | | - | | | | | 530,100 | |
| | | | | | | | | | | | | | | |
Subtotal: Income Taxes | | | | 3,632,000 | | | | | - | | | | | 3,632,000 | |
| | | | | | | | | | | | | | | |
Other Taxes | | | | | | | | | | | | | | | |
Corporations Taxes | | | | 268,600 | | | | | - | | | | | 268,600 | |
Fuel Taxes | | | | 326,100 | | | | | 13,700 | | | | | 339,800 | |
Land Transfer Tax | | | | 89,500 | | | | | - | | | | | 89,500 | |
Levy for Health and Education | | | | 446,900 | | | | | (121,352) | | | | | 325,548 | |
Retail Sales Tax | | | | 2,207,000 | | | | | - | | | | | 2,207,000 | |
Tobacco Tax | | | | 286,300 | | | | | - | | | | | 286,300 | |
Other Taxes | | | | 13,956 | | | | | - | | | | | 13,956 | |
Education Property Taxes | | | | - | | | | | 701,480 | | | | | 701,480 | |
| | | | | | | | | | | | | | | |
Subtotal: Other Taxes | | | | 3,638,356 | | | | | 593,828 | | | | | 4,232,184 | |
| | | | | | | | | | | | | | | |
Fees and Other Revenue | | | | | | | | | | | | | | | |
Fines and Costs and Other Legal | | | | 52,187 | | | | | - | | | | | 52,187 | |
Minerals and Petroleum | | | | 18,861 | | | | | - | | | | | 18,861 | |
Automobile and Motor Carrier Licences and Fees | | | | 150,500 | | | | | - | | | | | 150,500 | |
Parks: Forestry and Other Conservation | | | | 34,190 | | | | | - | | | | | 34,190 | |
Water Power Rentals | | | | 125,000 | | | | | - | | | | | 125,000 | |
Service Fees and Other Miscellaneous Charges | | | | 171,175 | | | | | 1,194,338 | | | | | 1,365,513 | |
Revenue Sharing from SOAs | | | | 18,050 | | | | | - | | | | | 18,050 | |
Tuition Fees | | | | - | | | | | 274,585 | | | | | 274,585 | |
| | | | | | | | | | | | | | | |
Subtotal: Fees and Other Revenue | | | | 569,963 | | | | | 1,468,923 | | | | | 2,038,886 | |
| | | | | | | | | | | | | | | |
Federal Transfers | | | | | | | | | | | | | | | |
Equalization | | | | 1,749,900 | | | | | - | | | | | 1,749,900 | |
Canada Health Transfer | | | | 1,156,308 | | | | | - | | | | | 1,156,308 | |
Canada Social Transfer | | | | 453,200 | | | | | - | | | | | 453,200 | |
Infrastructure Renewal | | | | 16,900 | | | | | - | | | | | 16,900 | |
Shared Cost and Other Transfers | | | | 153,054 | | | | | 263,422 | | | | | 416,476 | |
| | | | | | | | | | | | | | | |
Subtotal: Federal Transfer | | | | 3,529,362 | | | | | 263,422 | | | | | 3,792,784 | |
| | | | | | | | | | | | | | | |
Net Income of Government | | | | | | | | | | | | | | | |
Business Enterprises (GBEs) | | | | | | | | | | | | | | | |
Manitoba Liquor and Lotteries Corporation | | | | 575,000 | | | | | - | | | | | 575,000 | |
Deposit Guarantee Corporation | | | | - | | | | | 22,199 | | | | | 22,199 | |
Manitoba Hydro | | | | - | | | | | 62,000 | | | | | 62,000 | |
Workers Compensation Board | | | | - | | | | | 16,663 | | | | | 16,663 | |
Manitoba Public Insurance Corporation | | | | - | | | | | 16,172 | | | | | 16,172 | |
| | | | | | | | | | | | | | | |
Subtotal: Net Income of GBEs | | | | 575,000 | | | | | 117,034 | | | | | 692,034 | |
| | | | | | | | | | | | | | | |
Sinking Funds and Other Earnings | | | | - | | | | | 241,911 | | | | | 241,911 | |
| | | | | | | | | | | | | | | |
Total Revenue Estimate | | | | 11,944,681 | | | | | 2,685,118 | | | | | 14,629,799 | |
| | | | | | | | | | | | | | | |
B U D G E T 2 0 1 4 / 5
Schedule 2
Summary Expenditure Estimate: Details, Reconciliation to Core Government Estimates and Summary Budget Result
Fiscal Year ending March 31, 2015 (in Thousands of Dollars)
| | | | | | | | | | | | | | | |
| | | CORE GOVERNMENT | | CONSOLIDATION IMPACTS | | SUMMARY |
| | | Expenditure | | and Expenditures of Other | | |
| Sector/Department | | Estimate | | Reporting Entities | | |
Health | | | | | | | | | | | | | | | |
Health | | | | 5,382,077 | | | | | 408,639 | | | | | 5,790,716 | |
Education | | | | | | | | | | | | | | | |
Education and Advanced Learning | | | | 2,430,348 | | | | | 1,465,059 | | | | | 3,895,407 | |
Family Services | | | | | | | | | | | | | | | |
Children and Youth Opportunities | | | | 48,247 | | | | | (13,067) | | | | | 35,180 | |
Family Services | | | | 1,124,762 | | | | | (44,851) | | | | | 1,079,911 | |
| | | | | | | | | | | | | | | |
Total Family Services | | | | 1,173,009 | | | | | (57,918) | | | | | 1,115,091 | |
| | | | | | | | | | | | | | | |
Community, Economic and Resource Development | | | | | | | | | | | | | | | |
Aboriginal and Northern Affairs | | | | 34,226 | | | | | 2,967 | | | | | 37,193 | |
Agriculture, Food and Rural Development | | | | 209,035 | | | | | 206,498 | | | | | 415,533 | |
Conservation and Water Stewardship | | | | 144,236 | | | | | (2,561) | | | | | 141,675 | |
Housing and Community Development | | | | 79,119 | | | | | 146,676 | | | | | 225,795 | |
Infrastructure and Transportation | | | | 660,780 | | | | | (160,393) | | | | | 500,387 | |
Jobs and the Economy | | | | 669,545 | | | | | 21,574 | | | | | 691,119 | |
Mineral Resources | | | | 10,780 | | | | | 15,178 | | | | | 25,958 | |
Municipal Government | | | | 423,341 | | | | | 16,007 | | | | | 439,348 | |
| | | | | | | | | | | | | | | |
Total Community, Economic and Resource Development | | | | 2,231,062 | | | | | 245,946 | | | | | 2,477,008 | |
| | | | | | | | | | | | | | | |
Justice and Other Expenditures | | | | | | | | | | | | | | | |
Legislative Assembly | | | | 44,324 | | | | | (771) | | | | | 43,553 | |
Executive Council | | | | 2,679 | | | | | (102) | | | | | 2,577 | |
Civil Service Commission | | | | 20,141 | | | | | (688) | | | | | 19,453 | |
Employee Pensions and Other Costs | | | | 13,899 | | | | | 59,160 | | | | | 73,059 | |
Finance | | | | 65,981 | | | | | 6,128 | | | | | 72,109 | |
Justice | | | | 533,384 | | | | | 8,664 | | | | | 542,048 | |
Labour and Immigration | | | | 25,427 | | | | | 13,800 | | | | | 39,227 | |
Multiculturalism and Literacy | | | | 21,170 | | | | | (240) | | | | | 20,930 | |
Tourism, Culture, Heritage, Sport and Consumer Protection | | | | 85,912 | | | | | 7,938 | | | | | 93,850 | |
Enabling Appropriations | | | | 38,124 | | | | | - | | | | | 38,124 | |
Other Appropriations | | | | 41,587 | | | | | - | | | | | 41,587 | |
| | | | | | | | | | | | | | | |
Total Justice and Other Expenditures | | | | 892,628 | | | | | 93,889 | | | | | 986,517 | |
| | | | | | | | | | | | | | | |
Debt Servicing Costs | | | | 230,000 | | | | | 642,133 | | | | | 872,133 | |
| | | | | | | | | | | | | | | |
Total Expenditure Estimate | | | | 12,339,124 | | | | | 2,797,748 | | | | | 15,136,872 | |
Subtract: Total Revenue Estimate (Schedule 1) | | | | 11,944,681 | | | | | 2,685,118 | | | | | 14,629,799 | |
In-Year Adjustments/Lapse | | | | (70,000) | | | | | (80,000) | | | | | (150,000) | |
| | | | | | | | | | | | | | | |
NET INCOME (LOSS) | | | | (324,443) | | | | | (32,630) | | | | | (357,073) | |
| | | | | | | | | | | | | | | |
NOTE: In-Year Adjustments/Lapse could be an increase in revenue and/or decrease in expenditures.
6 / B U D G E T 2 0 1 4
B U D G E T 2 0 1 4 / 7
FINANCIAL MANAGEMENT STRATEGY
8 / B U D G E T 2 0 1 4
n FINANCIAL MANAGEMENT STRATEGY 2014/15
Financial Management Priorities
The Financial Management Strategy (FMS) sets out the government’s priorities for financial management. It includes four main priority areas with one or more measurable outcomes. Each measurable outcome includes objectives for the current year and for future years.
For 2014/15, the FMS continues to focus on priority areas identified in prior years and reflects government’s commitment to return to balance.
| | |
FINANCIAL MANAGEMENT PRIORITY | | MEASURABLE OUTCOMES |
Transparency, Accountability and Fiscal Discipline | | • Summary Budget Outlook |
| |
| | • Maintaining Accountability for Core Government Program Expenditure and Revenue |
| |
Stable and Affordable Government | | • Credit Ratings |
| |
| | • Expenditures as a Percentage of Gross Domestic Product (GDP) |
| |
| | • Sustainable Management of Public Resources |
| |
Managing Debt | | • Debt Management |
| |
| | • Net Debt to GDP Ratio |
| |
Five-Year Core Infrastructure Plan | | • Core Infrastructure Investment |
n PRIORITY AREA – TRANSPARENCY, ACCOUNTABILITY AND FISCAL DISCIPLINE
Government has implemented a number of measures to ensure financial accountability and maintain fiscal discipline, including:
| • | | implementing GAAP compliant summary financial statements as of March 31, 2005; |
| • | | implementing summary budgeting and reporting in 2007/08 to present comprehensive information on the total cost of providing programs and services to Manitobans and how the GRE operates as a whole; |
| • | | publishing a financial management strategy as part of the annual budget and a report on outcomes within six months of the end of the fiscal year; |
| • | | implementing summary quarterly financial reporting, consistent with GAAP as of 2009/10; |
| • | | establishing a plan to reduce the unfunded pension liabilities; |
| • | | funding the employer’s share of current service pension contributions for all employees; and |
| • | | ensuring all capital investments are amortized and all related costs are included in annual appropriations for core government. |
The commitment to transparency, accountability and fiscal discipline continues in Budget 2014 with an update on the balanced financial strategy for 2014/15 and future years.
B U D G E T 2 0 1 4 / 9
Measurable Outcome – Summary Budget Outlook
The Manitoba economy has remained relatively steady in an uncertain global economic climate. Through the post-recession period, the high level of industrial diversity and a balance between domestic demand and export sales have provided Manitoba with modest and stable economic growth. However, five years after the Great Recession, global economic conditions remain tenuous as fiscal stimulus and accommodative monetary policies in advanced economies are being unwound and growth in Canada has softened. In spite of the forecast for the external environment, Manitoba is still expected to post steady growth over the next two years. The current Manitoba Finance survey of forecasters calls for 2.2% growth in 2014 before increasing to 2.4% in 2015.
Budget 2014 continues with a multi-year financial strategy based on declining deficits and a return to balance in 2016/17. Manitoba’s balanced approach continues to focus on what matters most – jobs, a stable economy and key services that families count on. Budget 2014 demonstrates this balanced approach by focusing on:
| • | | supporting economic growth and the creation of new job opportunities with a five-year core infrastructure plan; |
| • | | managing government spending strategically to hold expenditure growth below economic growth while continuing to ensure Manitobans’ priorities come first; |
| • | | reducing the deficit while continuing to invest in vital front-line services to continue to improve health care, education and training and supports for families; |
| • | | delivering services in the most efficient way possible by expanding the use of lean processes in core government departments; and |
| • | | maintaining affordability to keep Manitoba one of the best places to live, work, raise a family and retire. |
The commitment to build a stronger economy and create new job opportunities, while returning to balance, will make Manitoba an even better place for families.
1 0 / B U D G E T 2 0 1 4
Manitoba’s Balanced Financial Strategy
| | | | | | | | | | | | | | | | | | | | | | | | | |
| | | 2013/14 | | 2014/15 | | 2015/16 | | 2016/17 | | 2017/18 |
| | | Forecast | | Budget | | Projection | | Projection | | Projection |
| | | (Millions of Dollars) |
REVENUE | | | | | | | | | | | | | | | | | | | | | | | | | |
Core Government | | | | 11,600 | | | | | 11,945 | | | | | 12,402 | | | | | 12,924 | | | | | 13,456 | |
Other Reporting Entities1 | | | | 2,864 | | | | | 2,685 | | | | | 2,626 | | | | | 2,652 | | | | | 2,658 | |
| | | | | | | | | | | | | | | | | | | | | | | | | |
TOTAL REVENUE | | | | 14,464 | | | | | 14,630 | | | | | 15,028 | | | | | 15,576 | | | | | 16,114 | |
| | | | | | | | | | | | | | | | | | | | | | | | | |
| | | | | |
EXPENDITURE | | | | | | | | | | | | | | | | | | | | | | | | | |
Core Government | | | | 12,230 | | | | | 12,339 | | | | | 12,619 | | | | | 12,900 | | | | | 13,187 | |
Other Reporting Entities1 | | | | 2,683 | | | | | 2,798 | | | | | 2,777 | | | | | 2,787 | | | | | 2,815 | |
| | | | | | | | | | | | | | | | | | | | | | | | | |
TOTAL EXPENDITURE | | | | 14,913 | | | | | 15,137 | | | | | 15,396 | | | | | 15,687 | | | | | 16,002 | |
| | | | | | | | | | | | | | | | | | | | | | | | | |
Restatement Adjustment | | | | | | | | | | | | | | | | | | | | | | | | | |
In-Year Adjustments/Lapse2 | | | | (17) | | | | | (150) | | | | | (150) | | | | | (150) | | | | | (150) | |
| | | | | | | | | | | | | | | | | | | | | | | | | |
SUMMARY NET INCOME (LOSS) | | | | (432) | | | | | (357) | | | | | (218) | | | | | 39 | | | | | 262 | |
| | | | | | | | | | | | | | | | | | | | | | | | | |
| 1 | Includes consolidation adjustments. |
| 2 | In-Year Adjustment/Lapse could be an increase in revenue and/or a decrease in expenditure. |
The summary budget outlook projects GRE revenue will rise by an average of 3.3% annually from 2014/15 to 2017/18 while GRE expenditures are projected to increase by an annual average of 1.9% during the same period.
Core government revenue is forecast to rise by an average of 4.1% annually while core government expenditure will grow by an annual average of 2.2% from 2014/15 to 2017/18.
Core government projections reflect declining deficits while protecting the services Manitoba families need. Budget 2014 includes strategic investments in core infrastructure as well as investments in infrastructure required to support health, education and housing, while limiting spending growth to key front-line services. Although several risks and challenges remain for the global economy, Manitoba’s stable economic and demographic fundamentals are projected to produce steady economic growth over the next few years.
The government is committed to protecting the services Manitobans rely on, and ensuring that delivery methods consider innovative ways to reduce the cost of government and to increase efficiency. Measures implemented in recent years include:
| • | | reducing the number of regional health authorities to streamline administration; |
| • | | merging the Manitoba Liquor Control Commission and Manitoba Lotteries Corporation to reduce overhead and regulatory costs; |
| • | | reducing the number of government-appointed agencies, boards and commissions; |
| • | | establishing Entrepreneurship Manitoba to provide an integrated suite of programs and innovative service improvements for entrepreneurs and businesses; and |
| • | | integrating the financial institutions regulation operations in the Manitoba Financial Services Agency to gain efficiencies, while acting further in the public interest to protect Manitoba investors. |
B U D G E T 2 0 1 4 / 1 1
Budget 2014 continues to move forward with further improvements in the coming year by:
| • | | expanding the use of lean management across government to maximize value and eliminate duplication and repetitive processes; |
| • | | scrutinizing internal resource requirements to build on successes already achieved and continuing to reduce the size of the civil service to meet the commitment of a 600 reduction overall; |
| • | | undertaking a comprehensive review of office space to reduce the footprint of government; |
| • | | continuing to innovate within health care to control costs while delivering needed patient care; |
| • | | Manitoba Liquor and Lotteries Corporation becoming a fully matching employer on April 1, allowing the past pension liability to be addressed; |
| • | | continuing to improve service delivery by focusing on operational issues – the way in which implementation or execution is being managed to improve the effectiveness of government’s ability to deliver results; and |
| • | | continuing to focus on core government program priorities. |
These measures will continue to address redundancy and result in more efficient use of human and financial resources.
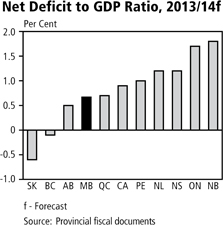
The deficit to GDP ratio relates a government’s fiscal deficit, or the amount by which budgetary expenditures exceed expected revenues, in relation to the size of the overall economy. Broadly, it is an indicator of the size of the shortfall relative to all economic activity in the jurisdiction. For 2013/14, Manitoba’s deficit as a percentage of GDP is forecast to be (0.7)%, the fourth lowest among provinces and below the federal government. Manitoba’s ratio for 2014/15 is forecast to improve to (0.6)%.
The annual financial management strategy and a report on outcomes will continue to be published. In addition, in-year financial reporting will provide updates on the progress made in achieving our balanced financial strategy.
Measurable Outcome – Maintaining Accountability for Core
Government Program Expenditure and Revenue
Legislation requires government to include a summary of core government expenditure and projected revenue as part of the FMS. This is consistent with the main estimates of expenditure and revenue for the fiscal year.
While core government expenditure will exceed revenue in Budget 2014, Manitoba’s balanced financial strategy shows declining deficits and a return to surplus in 2016/17.
Core Government Expenditure and Revenue, 2014/15
| | | | | |
| | | (Millions of Dollars) |
Revenue | | | | 11,945 | |
Expenditure | | | | 12,339 | |
In-Year Adjustments/Lapse | | | | (70 | ) |
| | | | | |
Net Result | | | | (324 | ) |
| | | | | |
Year-end information on core government revenue and expenditure for 2014/15 will be provided as part of the FMS report on outcomes, scheduled to be released in the fall of 2015.
1 2 / B U D G E T 2 0 1 4
n PRIORITY AREA – STABLE AND AFFORDABLE GOVERNMENT
Manitoba uses public revenues effectively and efficiently to deliver affordable government programs and services. Keeping programs affordable is achieved by continuing to improve the way government operates and delivers services.
As part of the balanced financial strategy, government will continue to carefully manage programs and services to protect the priorities of Manitobans.
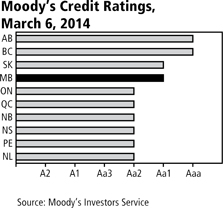
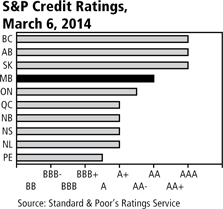
Measurable Outcome – Credit Ratings
Manitoba continues to maintain its reputation for fiscal responsibility. The government’s balanced approach to paying down debt and the pension liability, while maintaining core services in health care and other program areas has been positively acknowledged by credit rating agencies through the reaffirmation of Manitoba’s credit rating over the last six years, including the period of the Great Recession.
Despite lingering uncertainty in external economies, Manitoba’s economy is the most stable among provinces as measured by long-term annual fluctuation in economic growth. Manitoba’s stability, industrial diversity and commitment to responsible financial management, is anticipated to contribute to a steady credit outlook in 2014. Manitoba’s balanced multi-year approach continues to include draws from the fiscal stabilization account to repay debt, while returning to balance in 2016/17.
The Manitoba government remains committed to maintaining fiscal responsibility to achieve stable or improving credit ratings into the future.
| | | | | | | | | | | | | | |
Credit Rating Agency | | 2008
Actual | | 2009
Actual | | 2010
Actual | | 2011
Actual | | 2012
Actual | | 2013
Actual | | 2014
Actual |
DBRS | | A(high) | | A(high) | | A(high) | | A(high) | | A(high) | | A(high) | | A(high) |
Moody’s | | Aa1 | | Aa1 | | Aa1 | | Aa1 | | Aa1 | | Aa1 | | Aa1 |
Standard & Poor’s | | AA | | AA | | AA | | AA | | AA | | AA | | AA |
NOTE: For fiscal year ending March 31.
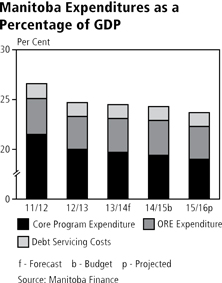
Measurable Outcome – Expenditures as a Percentage of GDP
Maintaining stable and affordable government means managing the growth in spending to meet increasing demands for quality services. An effective measure of appropriate spending is the ratio of total expenditures as a percentage of GDP. This ratio has remained relatively stable over the last four years and is anticipated to decline in Budget 2014.
Expenditure to GDP ratios are reflected in the following table and as part of Appendix 1: Manitoba Summary Financial Statistics.
| | | | | | | | | | | | | | | | | | | | | | | | | |
| | | 2011/12 | | 2012/13 | | 2013/14
Forecast | | 2014/15
Budget | | 2015/16
Projection |
| | | (Per Cent) |
Core Program Expenditure | | | | 21.5 | | | | | 20.0 | | | | | 19.9 | | | | | 19.4 | | | | | 19.0 | |
Other Reporting Entities (ORE) Expenditure | | | | 3.6 | | | | | 3.3 | | | | | 3.4 | | | | | 3.5 | | | | | 3.3 | |
Debt Servicing Costs | | | | 1.5 | | | | | 1.4 | | | | | 1.4 | | | | | 1.4 | | | | | 1.4 | |
Total Expenditure | | | | 26.6 | | | | | 24.7 | | | | | 24.7 | | | | | 24.2 | | | | | 23.6 | |
The Manitoba government’s objective is to maintain a stable or declining ratio over the longer term.
B U D G E T 2 0 1 4 / 1 3
Measurable Outcome – Sustainable Management of Public Resources
Sustainable management of public resources is key to making government more effective, now and into the future. Government continues to explore ways to make sure that public spending remains under control and that tax dollars are used effectively and efficiently.
Budget 2014 continues to move forward on containing core government expenditure growth. The balanced financial strategy projects medium-term expenditure growth at 2.2%, enabling declining deficits with a return to balance in 2016/17. Meeting government priorities and getting back to a balanced budget will require continual review and reprioritization of existing funding and streamlining internal operations to find opportunities for lowering costs.
The government supports continuous internal review and reform to provide Manitobans with affordable, innovative and effective public service operations, programs and services. A Lean Council is being established whose mandate will be to help government reduce costs while providing better services for Manitobans. Under the leadership of this council, government departments will be identifying ways to make their operations more efficient by eliminating any duplication or redundancies. The initiatives will include ongoing reviews of the current processes to deliver services, aiming to reduce administrative costs, while ensuring service levels remain constant.
The government committed to reducing the size of the civil service by 600 over three years. Projections to March 31, 2014, halfway through the three-year period, show a reduction of over 370 will be achieved in support of this commitment. Measures will continue to fully meet the commitment while protecting the services that Manitobans need.
A review of office space will also be undertaken in 2014/15. This review will be aimed at ensuring that all space is used in the most efficient way to potentially reduce the footprint of government. This review, and the on-going scrutiny of operating costs incurred to deliver services such as the use of consulting services, travel and the purchase of various goods and services, will provide savings across departments to assist government in achieving a return to balance in 2016/17. The government continues to emphasize reforms that improve accountability and transparency and support sustainable programs that protect the priorities of Manitobans.
n PRIORITY AREA – MANAGING DEBT
Over the years, government has continued to implement specific initiatives to ensure sound fiscal management. These include:
| • | | addressing the unfunded pension liability; |
| • | | funding the employer’s share of current service pension entitlements in 2008/09, the first time since April 1, 1961; |
| • | | ensuring all capital investments are amortized and all related costs are fully reflected in annual appropriations for core government; and |
| • | | establishing a plan to reduce deficits with a return to balance in 2016/17. |
Solid debt management consists of a plan to address general purpose debt and the pension liability while making needed investments in Manitoba. The net debt to GDP ratio is one of the key indicators used by credit rating agencies in their analysis because it measures the level of debt relative to a jurisdiction’s financial capacity. While deficits and the increased investment in capital assets will add to the net debt in the short term, spending on core infrastructure is a priority of government because of the economic growth it creates. Increased investment in a core infrastructure plan and continuing investment in education and technology, lays the groundwork for continued economic expansion and the creation of good jobs, and helps Manitoba remain competitive.
1 4 / B U D G E T 2 0 1 4
Measurable Outcome – Debt Management
Direct action to address the unfunded pension liabilities for the Civil Service Superannuation Plan (CSSP) and the Teachers’ Retirement Allowances Fund (TRAF) began in 2007/08 with the province borrowing funds that have been invested by these two pension plans on behalf of the province.
| | |
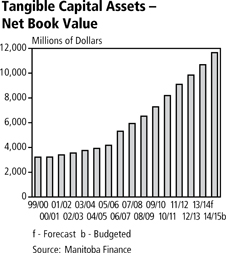
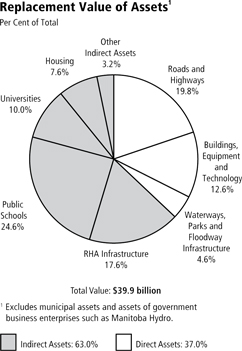
| | Borrowing funds to pay down the previously unfunded pension liability is a sound fiscal decision, as over the longer term, the cost of borrowing is less than the actuarially determined expected rate of return on the plan assets and the rate of growth in the pension liability. Since 2000, over $4.5 billion has been directed to pension obligations, including over $615 million of the annual debt retirement payments, $2.6 billion in new investment provided by the government since 2007 and net investment earnings projected to be $1.3 billion by March 31, 2014. In addition, Budget 2014 includes $196 million in core government expenditures for the employer’s share of current service pension obligations. The government continues to recognize capital investment as a priority in order to support economic growth and the related new job opportunities, while continuing to provide for the services Manitobans need in the future. The cost of these assets is amortized over a set period that represents the useful life of the asset as required by GAAP. The end result is increased infrastructure investment for Manitobans accompanied by a fixed discipline for paying down the associated debt. The investment in tangible capital assets has increased steadily over the last decade and with the investment in core and other capital investment of $1.6 billion in Budget 2014, is projected to total $19.7 billion at March 31, 2015 with $8.0 billion of related debt retired through accumulated amortization. The net book value of these assets (cost less accumulated amortization) has more than tripled since 1999/2000 to $11.7 billion. Manitoba’s communities and the economy have benefited over the years from the significant investment in infrastructure assets such as roads and water-control structures and other capital assets such as health facilities, universities, colleges and schools, and parks. To meet the needs of today’s and future generations, it is necessary to continue to invest in the renewal of these assets. The public good provided by these investments is immeasurable. It is estimated that the insured or replacement value of these investments is $40 billion. Based on projections, core government will have a total of $8.1 billion in capital asset investments at March 31, 2015 and $2.7 billion of related debt will have been retired through accumulated amortization. A total of $375 million has been included in core government appropriations to retire debt associated with capital investments – $225 million for amortization of department-owned assets and $150 million for principal payments for education and health-related assets. |
| |
Totals may not add due to rounding.
B U D G E T 2 0 1 4 / 1 5
The year 2008 saw the onset of the worst global economic downturn in a generation. Throughout the period of economic weakness, the government acted to stimulate the economy, protect jobs and preserve key services. This strategy helped Manitoba fare better than most provinces in weathering the recession. The global economic instability remains. As the government continues to work toward returning to balance, investments included in Budget 2014 will support continued economic growth and create good jobs while protecting key services.
Manitoba’s balanced financial strategy maintains the legislated requirement to dedicate at least $600 million of the balance in the FSA to the amortization of increases in the general purpose debt, including related interest expenses that are attributable to negative net results incurred during the period of economic recovery. Funds in the Debt Retirement Account (DRA) were withdrawn in 2010/11 to repay $145 million of debt. A further $460 million is being withdrawn from the FSA for both debt and interest: $96 million in 2010/11; $124 million in 2011/12; $140 million in 2012/13; and $100 million for 2013/14. Budget 2014 provides for an additional debt payment of $55 million, for a total payment of $515 million. With a return to surplus position in Budget 2016, scheduled debt payments for general purpose debt will resume.
Manitoba has a solid debt management plan which includes addressing the previously unfunded pension liability, budgeting for the employer’s share of current service entitlements for all employees, ensuring all capital investments are amortized and all related costs are fully reflected in annual appropriations, and continuing to make debt repayments to mitigate core government operating deficits.
Strategic decision making has resulted in debt servicing costs as a percentage of revenue decreasing. Since 1999/2000, the debt servicing cost rate has dropped by 54.5%, from 13.2¢ of every dollar of summary revenue collected to a forecasted level of 6.0¢ in Budget 2014.
The government remains committed to reducing debt over time with an ultimate goal of eliminating the general purpose debt and the remaining unfunded pension liabilities.
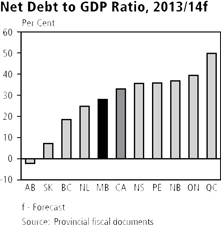
Measurable Outcome – Net Debt to GDP Ratio
Net debt is an important indicator of a government’s financial position as this highlights how government services will remain affordable in the future.
Summary net debt is financial assets (such as cash or investments) minus total liabilities (such as loans or financing). It is the remaining liability that must be financed by future revenues.
Net debt may grow as needed investments in capital assets – like highway infrastructure, water control structures, hospitals and schools are made. These forward-looking investments help support Manitoba’s economy, attract investment, increase trade, and create jobs and new opportunities for young people. Therefore, it is important to measure changes in net debt against the growth of the economy, as measured by the nominal GDP.
Manitoba’s net debt to GDP has fluctuated over the past 14 years resulting from the effects of the economic downturn, the impact of the 2011 flood and the continued commitment to invest in capital assets that will benefit Manitobans in the years to come. While the new five-year core infrastructure plan is anticipated to increase the net debt to GDP ratio in the short term, this increase must be considered in relation to the resulting benefits to the economy overall. According to the Conference Board of Canada’s Report entitled “The Economic Impact of Manitoba’s Infrastructure Investment Program”, the government’s five-year core infrastructure plan will boost overall real GDP by $6.3 billion or 2% over 2014 to 2018. Manitoba will also benefit from additional positive impacts resulting from increased productivity due to the elevated productive capacity from this investment. Further studies will be undertaken to assess the additional impact resulting from these productivity gains.
Manitoba is committed to maintaining its net debt to GDP ratio in line with the average for Canadian provinces, which was 30.9% in 2013/14. In Budget 2014, the net debt to GDP ratio is forecast to be 29.8%.
1 6 / B U D G E T 2 0 1 4
n PRIORITY AREA – FIVE-YEAR CORE INFRASTRUCTURE PLAN
Building and upgrading Manitoba’s infrastructure has been a priority for the government since 1999. The government announced an economic stimulus investment plan in November 2008 to fund key infrastructure projects across the province. Manitoba has also dedicated revenue raised through fuel taxes to fund infrastructure, participated in the national stimulus program that began in 2009 and, in 2011, committed to providing the equivalent of 1/7th of the provincial sales tax to support investment in municipal infrastructure and public transit.
Budget 2014 reinforces the commitment to infrastructure by introducing a new five year, $5.5 billion core infrastructure plan to focus investments on:
| • | | roads, highways and bridges; |
| • | | municipal infrastructure including roads and clean water. |
To meet these important infrastructure needs, the government has committed that it will invest more than the revenue raised from the additional point of PST introduced last year into new investments in core infrastructure, over and above existing spending levels. In 2012/13, prior to the increase in the PST, the base level of investment in core infrastructure totaled $729 million. From 2014/15 to 2018/19 revenues associated with the one-point increase in the PST are estimated at $1.5 billion. As shown in the following table, beginning in 2014/15, core infrastructure investment projected for the five-year plan will reach over $5.5 billion, exceeding the government’s PST commitment by $420 million.
| | | | | | | | | | | | | | | | | | | | | | | | | | | | | | | | | | | | | | | | |
| | | | | | | Five-Year Core Infrastructure Plan |
| | | 2012/13 | | 2013/14 | | 2014/15 | | 2015/16 | | 2016/17 | | 2017/18 | | 2018/19 | | |
| | | Base | | Forecast | | Budget | �� | Planned | | Planned | | Planned | | Planned | | Total |
| | | | | | | | | (Millions of Dollars) | | | | |
| | | | | | | | |
Roads, Highways and Bridges | | | | 478 | | | | | 532 | | | | | 707 | | | | | 746 | | | | | 755 | | | | | 762 | | | | | 771 | | | | | 3,741 | |
Flood Protection | | | | 21 | | | | | 64 | | | | | 42 | | | | | 49 | | | | | 54 | | | | | 68 | | | | | 107 | | | | | 320 | |
Municipal Infrastructure* | | | | 230 | | | | | 258 | | | | | 277 | | | | | 288 | | | | | 299 | | | | | 315 | | | | | 327 | | | | | 1,506 | |
| | | | | | | | | | | | | | | | | | | | | | | | | | | | | | | | | | | | | | | | |
Planned Investment | | | | 729 | | | | | 854 | | | | | 1,026 | | | | | 1,083 | | | | | 1,108 | | | | | 1,145 | | | | | 1,205 | | | | | 5,567 | |
| | | | | | | | | | | | | | | | | | | | | | | | | | | | | | | | | | | | | | | | |
Base Funding Level | | | | 729 | | | | | 729 | | | | | 729 | | | | | 729 | | | | | 729 | | | | | 729 | | | | | 729 | | | | | 3,645 | |
1 point PST commitment | | | | | | | | | 196 | | | | | 276 | | | | | 288 | | | | | 300 | | | | | 313 | | | | | 325 | | | | | 1,502 | |
| | | | | | | | | | | | | | | | | | | | | | | | | | | | | | | | | | | | | | | | |
Investment Commitment | | | | | | | | | 925 | | | | | 1,005 | | | | | 1,017 | | | | | 1,029 | | | | | 1,042 | | | | | 1,054 | | | | | 5,147 | |
| | | | | | | | | | | | | | | | | | | | | | | | | | | | | | | | | | | | | | | | |
Investment Over/(Under) Commitment | | | | | | | | | (71) | | | | | 21 | | | | | 66 | | | | | 79 | | | | | 103 | | | | | 151 | | | | | 420 | |
| | | | | | | | | | | | | | | | | | | | | | | | | | | | | | | | | | | | | | | | |
| * | Building Manitoba Fund net of transit operating grants. |
While the 2013/14 fiscal year is outside of the plan, the $5.5 billion level of investment is enough to offset the projected underinvestment in 2013/14, and is flexible enough to accommodate any potential revenue offsets that may be received under the Building Canada Plan or other federal cost-sharing initiatives.
The core infrastructure plan will be reviewed and rebased each year to recognize any variances in the PST revenues and investments.
B U D G E T 2 0 1 4 / 1 7
Measurable Outcome – Core Infrastructure Investment
The 2014/15 budget for core infrastructure of $1,026 million exceeds the investment commitment of $1,005 million which represents the base funding level of $729 million and the equivalent of one percentage point of PST revenue, estimated at $276 million in 2014/15. The investment in 2014/15 includes $16.9 million of support from the federal government.
Details of the 2014/15 investment for the construction of new, or maintenance and preservation of existing, assets in the departments of Infrastructure and Transportation and Municipal Government are as follows:
Five-Year Core Infrastructure Plan
| | | | | |
| | | 2014/15 |
| | | Budget |
| | | | $000s | |
Roads, Highways and Bridges | | | | | |
Highways Infrastructure | | | | 548,510 | |
Transportation Capital | | | | 14,105 | |
Airport Runways | | | | 2,000 | |
Maintenance and Preservation | | | | 142,093 | |
| | | | | |
Subtotal Highways and Bridges | | | | 706,708 | |
| |
Flood Protection | | | | | |
Water Control Capital | | | | 32,800 | |
Maintenance | | | | 9,640 | |
| | | | | |
Subtotal Flood Protection | | | | 42,440 | |
| |
Municipal Infrastructure | | | | | |
Building Manitoba Fund * | | | | 276,642 | |
| | | | | |
Planned Investment | | | | 1,025,790 | |
| | | | | |
| * | Net of transit operating grants. |
Planned projects for the year are highlighted in the five-year plan released by government.
Year-end information on the 2014/15 core infrastructure plan investment and projects will be provided as part of the FMS report on outcomes, scheduled to be released in the fall of 2015.
1 8 / B U D G E T 2 0 1 4
B U D G E T 2 0 1 4 / 1 9
Appendix 1:
MANITOBA SUMMARY FINANCIAL STATISTICS
2 0 / B U D G E T 2 0 1 4
Manitoba Summary Financial Statistics
| | | | | | | | | | | | | | | | | | | | | | | | | | | | | | |
| | | 2014/15 | | 2013/14 | | 2012/13 | | 2011/12 | | 2010/11 | | 2009/10 |
| | | Budget | | Forecast | | Actual | | Actual | | Actual | | Actual |
| SUMMARY FINANCIAL STATEMENTS | | (Millions of Dollars) |
Revenue | | | | | | | | | | | | | | | | | | | | | | | | | | | | | | |
Income Taxes | | | | 3,632 | | | | | 3,460 | | | | | 3,302 | | | | | 3,138 | | | | | 2,938 | | | | | 2,674 | |
Other Taxes | | | | 4,232 | | | | | 3,961 | | | | | 3,572 | | | | | 3,350 | | | | | 3,219 | | | | | 3,103 | |
Fees and Other Revenue | | | | 2,039 | | | | | 2,119 | | | | | 1,998 | | | | | 1,906 | | | | | 1,828 | | | | | 1,792 | |
Federal Transfers | | | | 3,793 | | | | | 3,823 | | | | | 3,953 | | | | | 4,332 | | | | | 4,047 | | | | | 3,924 | |
Net Income of Government Business Enterprises | | | | 692 | | | | | 863 | | | | | 719 | | | | | 713 | | | | | 807 | | | | | 789 | |
Sinking Funds and Other Earnings | | | | 242 | | | | | 238 | | | | | 242 | | | | | 249 | | | | | 230 | | | | | 220 | |
| | | | | | | | | | | | | | | | | | | | | | | | | | | | | | |
Total Revenue | | | | 14,630 | | | | | 14,464 | | | | | 13,786 | | | | | 13,688 | | | | | 13,069 | | | | | 12,502 | |
| | | | | | | | | | | | | | | | | | | | | | | | | | | | | | |
Expenditure | | | | | | | | | | | | | | | | | | | | | | | | | | | | | | |
Health | | | | 5,791 | | | | | 5,684 | | | | | 5,487 | | | | | 5,328 | | | | | 5,044 | | | | | 4,831 | |
Education | | | | 3,895 | | | | | 3,802 | | | | | 3,569 | | | | | 3,389 | | | | | 3,218 | | | | | 3,125 | |
Family Services | | | | 1,115 | | | | | 1,094 | | | | | 1,062 | | | | | 1,013 | | | | | 978 | | | | | 1,295 | |
Community, Economic and Resource Development | | | | 2,477 | | | | | 2,341 | | | | | 2,405 | | | | | 2,734 | | | | | 2,367 | | | | | 1,780 | |
Justice and Other Expenditures | | | | 987 | | | | | 1,056 | | | | | 1,004 | | | | | 1,410 | | | | | 870 | | | | | 900 | |
Debt Servicing Costs | | | | 872 | | | | | 836 | | | | | 839 | | | | | 815 | | | | | 773 | | | | | 756 | |
| | | | | | | | | | | | | | | | | | | | | | | | | | | | | | |
Subtotal Expenditure | | | | 15,137 | | | | | 14,813 | | | | | 14,366 | | | | | 14,689 | | | | | 13,250 | | | | | 12,687 | |
Extraordinary Item | | | | | | | | | | | | | | | | | | | | | | | | | | | | | | |
First Nations Flood Contingency | | | | - | | | | | 100 | | | | | - | | | | | - | | | | | - | | | | | - | |
| | | | | | | | | | | | | | | | | | | | | | | | | | | | | | |
Total Expenditure | | | | 15,137 | | | | | 14,913 | | | | | 14,366 | | | | | 14,689 | | | | | 13,250 | | | | | 12,687 | |
In-Year Adjustments/Lapse | | | | (150) | | | | | (17) | | | | | - | | | | | - | | | | | - | | | | | - | |
| | | | | | | | | | | | | | | | | | | | | | | | | | | | | | |
Net Income (Loss) | | | | (357) | | | | | (432) | | | | | (580) | | | | | (1,001) | | | | | (181) | | | | | (185) | |
| | | | | | | | | | | | | | | | | | | | | | | | | | | | | | |
Provincial Borrowings, Guarantees & Obligations | | | | | | | | | | | | | | | | | | | | | | | | | | | | | | |
General Government Programs | | | | 9,244 | | | | | 8,920 | | | | | 8,289 | | | | | 7,803 | | | | | 6,955 | | | | | 6,863 | |
General Government Programs - Federal Flood Relief | | | | - | | | | | 75 | | | | | 276 | | | | | 326 | | | | | - | | | | | - | |
General Government Programs - Pension Liability | | | | 2,595 | | | | | 2,595 | | | | | 2,595 | | | | | 2,595 | | | | | 2,355 | | | | | 2,175 | |
The Manitoba Hydro-Electric Board | | | | 12,390 | | | | | 11,010 | | | | | 9,609 | | | | | 8,999 | | | | | 8,362 | | | | | 7,730 | |
Other Crown Organizations | | | | 2,583 | | | | | 2,457 | | | | | 2,246 | | | | | 1,926 | | | | | 1,641 | | | | | 1,478 | |
Health Facilities | | | | 1,477 | | | | | 1,225 | | | | | 1,149 | | | | | 1,094 | | | | | 1,015 | | | | | 949 | |
Other | | | | 5 | | | | | 17 | | | | | 23 | | | | | 37 | | | | | 51 | | | | | 65 | |
Capital Investments | | | | 4,431 | | | | | 4,013 | | | | | 3,668 | | | | | 3,195 | | | | | 2,546 | | | | | 1,846 | |
| | | | | | | | | | | | | | | | | | | | | | | | | | | | | | |
Subtotal | | | | 32,725 | | | | | 30,312 | | | | | 27,855 | | | | | 25,975 | | | | | 22,925 | | | | | 21,106 | |
Other Obligations | | | | | | | | | | | | | | | | | | | | | | | | | | | | | | |
Pension Liability | | | | 7,761 | | | | | 7,379 | | | | | 6,940 | | | | | 6,697 | | | | | 6,545 | | | | | 6,392 | |
Pension Assets | | | | (5,500) | | | | | (5,322) | | | | | (5,112) | | | | | (5,063) | | | | | (4,814) | | | | | (4,624) | |
| | | | | | | | | | | | | | | | | | | | | | | | | | | | | | |
Net Pension Liability | | | | 2,261 | | | | | 2,057 | | | | | 1,828 | | | | | 1,634 | | | | | 1,731 | | | | | 1,768 | |
Debt incurred for and repayable by the Manitoba Hydro-Electric Board | | | | (12,145) | | | | | (10,745) | | | | | (9,443) | | | | | (8,742) | | | | | (8,199) | | | | | (7,479) | |
Education and Health Debt held by Government Enterprises | | | | 598 | | | | | 569 | | | | | 547 | | | | | 505 | | | | | 471 | | | | | 443 | |
Other Debt of Crown Organizations | | | | 266 | | | | | 266 | | | | | 264 | | | | | 266 | | | | | 263 | | | | | 255 | |
| | | | | | | | | | | | | | | | | | | | | | | | | | | | | | |
Subtotal | | | | (9,020) | | | | | (7,853) | | | | | (6,804) | | | | | (6,337) | | | | | (5,734) | | | | | (5,013) | |
| | | | | | | | | | | | | | | | | | | | | | | | | | | | | | |
Total Summary Borrowings, Guarantees & Obligations | | | | 23,705 | | | | | 22,459 | | | | | 21,051 | | | | | 19,638 | | | | | 17,191 | | | | | 16,093 | |
| | | | | | | | | | | | | | | | | | | | | | | | | | | | | | |
Adjustments to Arrive at Summary Net Debt | | | | | | | | | | | | | | | | | | | | | | | | | | | | | | |
Guarantees | | | | (245) | | | | | (265) | | | | | (166) | | | | | (257) | | | | | (165) | | | | | (255) | |
Net Financial Assets | | | | (4,842) | | | | | (4,906) | | | | | (4,992) | | | | | (4,831) | | | | | (4,464) | | | | | (4,196) | |
| | | | | | | | | | | | | | | | | | | | | | | | | | | | | | |
Summary Net Debt | | | | 18,618 | | | | | 17,288 | | | | | 15,893 | | | | | 14,550 | | | | | 12,562 | | | | | 11,642 | |
| | | | | | | | | | | | | | | | | | | | | | | | | | | | | | |
NOTES:
| • | | The 2013/14 Budget numbers originally presented in the 2013 Budget Address and the 2013/14 forecast from the Third Quarter Financial Report have been re-stated to be consistent with the current presentation for the GRE. |
| • | | Details of Expenditure and Revenue for Fiscal Year 2014/15, and a reconciliation to the amounts reported for core government are found in Schedules 1 and 2. |
| • | | In-Year Adjustments/Lapse could be an increase in revenue and/or decrease in expenditures. |
| • | | Numbers may not add due to rounding. |
B U D G E T 2 0 1 4 / 2 1
Manitoba Summary Financial Statistics
| | | | | | | | | | | | | | | | | | | | | | | | |
| | | 2014/15 | | | 2013/14 | | | 2012/13 | | | 2011/12 | | | 2010/11 | | | 2009/10 | |
| | | Budget | | | Forecast | | | Actual | | | Actual | | | Actual | | | Actual | |
| |
| | | (Percentage Change) | |
| | | | | | |
Annual Change | | | | | | | | | | | | | | | | | | | | | | | | |
Income Taxes | | | 5.0 | | | | 4.8 | | | | 5.2 | | | | 6.8 | | | | 9.9 | | | | (6.4) | |
Other Taxes | | | 6.8 | | | | 10.9 | | | | 6.6 | | | | 4.1 | | | | 3.7 | | | | (0.1) | |
Fees and Other Revenue | | | (3.8) | | | | 6.1 | | | | 4.8 | | | | 4.3 | | | | 2.0 | | | | 4.1 | |
Federal Transfers | | | (0.8) | | | | (3.3) | | | | (8.7) | | | | 7.0 | | | | 3.1 | | | | 1.5 | |
Total Revenue | | | 1.1 | | | | 4.9 | | | | 0.7 | | | | 4.7 | | | | 4.5 | | | | (0.9) | |
Health | | | 1.9 | | | | 3.6 | | | | 3.0�� | | | | 5.6 | | | | 4.4 | | | | 5.3 | |
Education | | | 2.4 | | | | 6.5 | | | | 5.3 | | | | 5.3 | | | | 3.0 | | | | 4.6 | |
Debt Servicing Costs | | | 4.3 | | | | (0.4) | | | | 2.9 | | | | 5.4 | | | | 2.2 | | | | (8.9) | |
Total Expenditure | | | 1.5 | | | | 3.8 | | | | (2.2) | | | | 10.9 | | | | 4.4 | | | | 4.3 | |
Summary Net Debt | | | 7.7 | | | | 8.8 | | | | 9.2 | | | | 15.8 | | | | 7.9 | | | | 2.0 | |
| |
| | | (Per Cent) | |
Per Cent of GDP | | | | | | | | | | | | | | | | | | | | | | | | |
Income Taxes | | | 5.8 | | | | 5.7 | | | | 5.7 | | | | 5.7 | | | | 5.6 | | | | 5.3 | |
Other Taxes | | | 6.8 | | | | 6.6 | | | | 6.1 | | | | 6.1 | | | | 6.1 | | | | 6.1 | |
Fees and Other Revenue | | | 3.3 | | | | 3.5 | | | | 3.4 | | | | 3.5 | | | | 3.5 | | | | 3.5 | |
Federal Transfers | | | 6.1 | | | | 6.3 | | | | 6.8 | | | | 7.8 | | | | 7.6 | | | | 7.7 | |
Total Revenue | | | 23.4 | | | | 24.0 | | | | 23.7 | | | | 24.8 | | | | 24.7 | | | | 24.7 | |
Health | | | 9.3 | | | | 9.4 | | | | 9.4 | | | | 9.6 | | | | 9.5 | | | | 9.5 | |
Education | | | 6.2 | | | | 6.3 | | | | 6.1 | | | | 6.1 | | | | 6.1 | | | | 6.2 | |
Debt Servicing Costs | | | 1.4 | | | | 1.4 | | | | 1.4 | | | | 1.5 | | | | 1.5 | | | | 1.5 | |
Total Expenditure | | | 24.2 | | | | 24.7 | | | | 24.7 | | | | 26.6 | | | | 25.0 | | | | 25.0 | |
Summary Net Debt | | | 29.8 | | | | 28.7 | | | | 27.3 | | | | 26.4 | | | | 23.7 | | | | 23.0 | |
| | | | | | |
Per Cent of Revenue | | | | | | | | | | | | | | | | | | | | | | | | |
Income Taxes | | | 24.8 | | | | 23.9 | | | | 23.9 | | | | 22.9 | | | | 22.5 | | | | 21.4 | |
Other Taxes | | | 28.9 | | | | 27.4 | | | | 25.9 | | | | 24.5 | | | | 24.6 | | | | 24.8 | |
Fees and Other Revenue | | | 13.9 | | | | 14.7 | | | | 14.5 | | | | 13.9 | | | | 14.0 | | | | 14.3 | |
Federal Transfers | | | 26.0 | | | | 26.4 | | | | 28.7 | | | | 31.7 | | | | 31.0 | | | | 31.4 | |
Net Income of Government | | | | | | | | | | | | | | | | | | | | | | | | |
Business Enterprises | | | 4.7 | | | | 6.0 | | | | 5.2 | | | | 5.2 | | | | 6.2 | | | | 6.3 | |
Sinking Funds and Other Earnings | | | 1.7 | | | | 1.6 | | | | 1.8 | | | | 1.8 | | | | 1.7 | | | | 1.8 | |
| |
| | | (Dollars) | |
Dollars Per Capita | | | | | | | | | | | | | | | | | | | | | | | | |
| | | | | | |
Total Revenue | | | 11,427 | | | | 11,434 | | | | 11,029 | | | | 11,095 | | | | 10,704 | | | | 10,344 | |
Total Expenditure | | | 11,823 | | | | 11,789 | | | | 11,493 | | | | 11,906 | | | | 10,853 | | | | 10,497 | |
Debt Servicing Costs | | | 681 | | | | 661 | | | | 671 | | | | 661 | | | | 633 | | | | 626 | |
Summary Net Debt | | | 14,542 | | | | 13,666 | | | | 12,714 | | | | 11,794 | | | | 10,289 | | | | 9,633 | |
| | | | | | |
Memorandum Items | | | | | | | | | | | | | | | | | | | | | | | | |
| | | | | | |
Population (000’s) * | | | 1,280.3f | | | | 1,265.0 | | | | 1,250.0 | | | | 1,233.7 | | | | 1,220.9 | | | | 1,208.6 | |
GDP at Market Prices | | | 62,426f | | | | 60,315 | | | | 58,156 | | | | 55,214 | | | | 52,934 | | | | 50,683 | |
Source: Manitoba Finance * Official population July 1. f - Forecast | | | | | | | | | | | | | | | | | | | | | | | | |
2 2 / B U D G E T 2 0 1 4
n INTERPROVINCIAL COMPARISONS
B U D G E T 2 0 1 4 / 2 3
2 4 / B U D G E T 2 0 1 4
Budget Paper A
ECONOMIC REVIEW AND OUTLOOK
| | |
Available in alternate formats upon request. | |  |
| | | | |
ECONOMIC REVIEW AND OUTLOOK | | | | |
| |
CONTENTS | | | | |
| |
INTRODUCTION | | | 1 | |
| |
INTERNATIONAL AND CANADIAN ECONOMIC DEVELOPMENTS | | | 1 | |
| |
MANITOBA ECONOMY | | | 3 | |
| |
ECONOMIC OUTLOOK | | | 11 | |
B U D G E T 2 0 1 4 E c o n o m i c R e v i e w a n d O u t l o o k / A 1
| | |
n INTRODUCTION | | 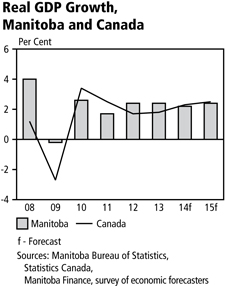
|
| |
Steady Economic Growth in an Uncertain Global Environment The Manitoba economy has remained steady in an uncertain global economic climate. Through the post-recession period, the high level of industrial diversity, and a balance between domestic demand and export sales have provided Manitoba with modest and stable economic growth. In 2013, the provincial economic growth was supported by strength in agriculture, housing construction and oil extraction, and offset by moderation in manufacturing. Jobs and capital investments in the private sector have supported consistent growth in the economy. Global economic growth, on the other hand, has now entered a new phase. Fiscal stimulus and accommodative monetary policies in advanced economies are being unwound. Households, businesses and governments are mending balance sheets and thereby moderating demand for goods and services. This transition has kept the euro area in recession over the past two years. Growth is slower than anticipated in the U.S. and China. This transition has also raised caution and lowered the near-term outlook for global growth. | |
Downside risks posed by Asia’s slowing growth will be balanced by upside risks associated with an improving U.S. economy. Manitoba’s real Gross Domestic Product (GDP) is expected to expand by 2.2% in 2014, largely unchanged from the Budget 2013 forecast of 2.3%. Growth is expected to improve to 2.4% in 2015.
n INTERNATIONAL AND CANADIAN ECONOMIC DEVELOPMENTS
Five years after the Great Recession, global economic conditions remain tenuous with emerging market economies slowing and advanced economies gradually improving. As a result, the dynamics of co-ordinated low-interest rate policy among Central Banks that supported the world economy for the past six years continues in most countries, including Canada.
The U.S. economy has been experiencing the slowest post-recessionary recovery since World War II. Fiscal consolidation by federal and state legislators continues to dampen near-term growth. Over the last four years, government investments and expenditures have declined in 12 of the last 16 quarters.
| | | | | | | | | | | | | | | | |
Real GDP Growth, 2008 to 2015f |
| | | | | | | | | | | | | | | | | | | | | | | | | | | | | | | | | | | | | | | | |
| | | 2008 | | 2009 | | 2010 | | 2011 | | 2012 | | 2013f | | 2014f | | 2015f |
| | | | Annual Percentage Change | |
Canada | | | | 1.2 | | | | | -2.7 | | | | | 3.4 | | | | | 2.5 | | | | | 1.7 | | | | | 2.0 | | | | | 2.3 | | | | | 2.5 | |
U.S. | | | | -0.3 | | | | | -2.8 | | | | | 2.5 | | | | | 1.8 | | | | | 2.8 | | | | | 1.9 | | | | | 2.8 | | | | | 3.0 | |
China | | | | 9.6 | | | | | 9.2 | | | | | 10.4 | | | | | 9.3 | | | | | 7.7 | | | | | 7.7 | | | | | 7.5 | | | | | 7.3 | |
Euro Area | | | | 0.4 | | | | | -4.4 | | | | | 2.0 | | | | | 1.5 | | | | | -0.7 | | | | | -0.4 | | | | | 1.0 | | | | | 1.4 | |
World | | | | 2.7 | | | | | -0.4 | | | | | 5.2 | | | | | 3.9 | | | | | 3.1 | | | | | 3.0 | | | | | 3.7 | | | | | 3.9 | |
f - Forecast | | | | | | | | | | | | | | | | | | | | | | | | | | | | | | | | | | | | | | | | |
Sources: International Monetary Fund, Manitoba Finance, survey of economic forecasters | |
A 2 / E c o n o m i c R e v i e w a n d O u t l o o k B U D G E T 2 0 1 4
In spite of the decline, the U.S. employment situation has improved, with three years of consecutive monthly gains in jobs. The unemployment rate fell to 6.6% in January 2014, the lowest in five years. The gain in the labour market has strengthened household finances and is supporting a recovery in housing and auto sales. The energy sector is also adding to the positive momentum. The rapid increase in North Dakota oil extraction has propelled the U.S. into a major oil producer. At its current pace of growth, by 2015 the U.S. could become the world’s largest oil producer, surpassing Russia. The International Monetary Fund (IMF) is projecting 2.8% growth for the U.S. economy in 2014 and 3.0% growth in 2015.
The consistent gradual improvement in the economy has prompted the U.S. Federal Reserve to wind down some of its stimulus monetary policy action. The Federal Reserve has reduced its monthly injection of capital into the economy (bond-buying program termed Quantitative Easing III) from $85 billion to $65 billion, and will continue to reduce it in a measured fashion over the medium term. Given the precarious nature of the economic recovery, the Federal Reserve is proceeding cautiously on any changes to the trend setting interest rate.
The U.S. is Manitoba’s largest international trading partner, accounting for 67% of foreign sales. Despite the slow recovery of the U.S. economy, Manitoba’s exports to the U.S. increased by 11.4% in 2013, the second highest among provinces. This increase followed 7.9% growth in 2012.
| | |
| | China, the world’s second-largest economy, and Manitoba’s second-largest foreign trading partner is in a transition. From primarily being driven by the export sector over the last decade, China is increasingly being driven by an expansion of its domestic sector (household, business and government spending). Since the rebalancing phase is gradual, economic growth is expected to continue to moderate over the long term. Partly due to the transition, China is experiencing the slowest level of growth since 1999. The IMF estimated 7.7% real GDP growth in 2013 and is projecting 7.5% growth in 2014. Currently, China’s local government debt and increasing property values pose a downside risk for economic and financial market stability. The euro area continues to be mired in anemic economic conditions. Fiscal consolidation, tight credit markets, extended household and corporate balance sheets, and declining labour markets have kept the area in recession over the last two years. However, growth did resume |
in the second quarter of 2013 and confidence is building in the core countries (Germany and France), and stabilizing in the periphery (Greece, Portugal and Spain). Economic activity in the region is expected to proceed slowly, with the unemployment rate still climbing in 2013. According to the IMF, real GDP in the euro area contracted 0.7% in 2012 and 0.4% in 2013, and is expected to increase by 1.0% in 2014.
Growth in Canada has softened in conjunction with global economic conditions. The export sector has progressively decelerated over the past three years as demand for commodities and manufactured products have diminished. Domestic spending is being restrained by the uncertain economic environment. Businesses, despite having strong balance sheets, are waiting for sustained growth in exports and local sales before significantly increasing capital investments and employment. Consumers and governments are held back by financial circumstances, thereby moderating expenditures. In real GDP terms, growth slowed to 1.7% in 2012 and expanded by 2.0% in 2013.
B U D G E T 2 0 1 4 E c o n o m i c R e v i e w a n d O u t l o o k / A 3
Aligned with the overall economic activity, the Canadian labour market has been steady with employment increasing 1.3% in 2013 and 1.2% in 2012. The unemployment rate declined last year, to a five-year low of 7.1%, but remains well above the pre-recession low of 6.0% (2007). Commodity prices stayed relatively flat in 2013, but remain at historically elevated levels. According to the Bank of Canada’s commodity price index, prices increased 1.2% in 2013, supported by fish (16.9%), forestry (11.6%) and energy (5.8%) prices. Metals and minerals prices fell by 16.0%, while agriculture prices declined 4.1%.
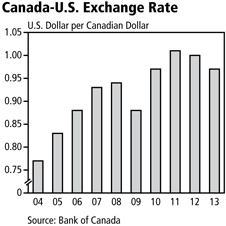
The modest growth in commodity prices coupled with slower economic growth has put downward pressure on the Canadian currency. At the same time, the U.S. dollar is strengthening as investors are attracted to the rising long-term bond yields in the U.S. The net effect has resulted in a depreciation of the Canadian dollar relative to the U.S. dollar, from $1.022 U.S. in September 2012 to $0.904 U.S. in February 2014. The increase in the U.S. dollar has a mixed outcome on the economy, it increases the cost of imported goods and services, and lowers the price of Canadian exports. The latter should benefit Canadian manufacturers as their products are becoming cheaper for international clients.
With cautious optimism in the underlying momentum in the U.S. and Europe, and sustained demand from Asia, real GDP in Canada is projected to increase by 2.3% in 2014 and by 2.5% in 2015. The labour market is expected to remain stable, while the unemployment rate is forecast to gradually fall to 6.6% by 2015. Excess capacity in the Canadian economy should constrain consumer price increases to 1.6% in 2014 and 1.9% in 2015, compared to 0.9% in 2013. With subdued inflationary pressure and modest economic growth, the Bank of Canada has announced it expects to keep its interest rate policy unchanged in 2014.
| | |
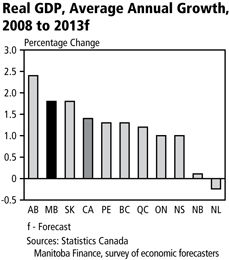
n MANITOBA ECONOMY Manitoba is among the most diversified economies in Canada. It has a broad industrial base dominated by medium-sized industries all contributing relatively equally to the overall economy. The province has 11 industries each accounting for over 5% of the economic production, with manufacturing the largest at 10%. The balance in industrial production has provided a stable and sustainable environment over the long term. Manitoba has averaged 2.4% annual growth in real GDP terms in the past 20 years. Measured by annual fluctuation in economic activity, the province is the most stable in Canada. During the last recession, for example, the economy remained virtually flat, contracting 0.2% in 2009, compared to the national decline of 2.7%. Since 2008, and in the face of global economic uncertainty, Manitoba has averaged 1.8% growth, the second highest among provinces. According to the preliminary estimates from Manitoba Bureau of Statistics, the province’s real GDP expanded by 2.4% in 2013. Supported by increased business investments in residential and non-residential construction, and an increase in consumer spending, domestic demand accelerated to 2.8% in 2013. The recovery in crop production in 2012 and the record harvest last summer contributed to a sharp rebound in exports. | | 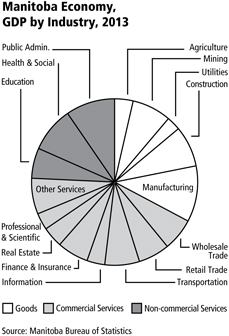
|
A 4 ��/ E c o n o m i c R e v i e w a n d O u t l o o k B U D G E T 2 0 1 4
| | |
| | Manitoba’s labour market is balanced with employment, and the number of new workers joining the labour force growing at about the same level. This has resulted in very little movement in the unemployment rate over the last five years. The rate averaged 5.4% in 2013, the third lowest among provinces and matching the annual rate in three of the last four years. Consumer prices in Manitoba increased by 2.2% in 2013, following a 1.6% increase in 2012. Manitoba’s inflation rate, like other jurisdictions, is well within the Bank of Canada’s inflation-control target range of 1% to 3%. In 2013, tobacco and alcohol, energy, shelter, food and household operations boosted overall consumer prices, while health and personal care, recreation, clothing and footwear, and transportation costs eased pressure on prices. Manitoba has significantly increased its reach into the rapidly growing regions of the world by broadening its export base to Asia, underpinning economic growth. Among all provinces, Manitoba has the second-highest share of foreign exports to Asia. |
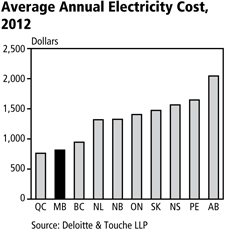
Manitoba also has among the most affordable business and household-living costs in Canada, and among the lowest electricity rates in North America. The mid-continent location provides access to cost-effective transportation links and intermodal facilities for shipping commodities by road, rail, air and sea. In addition, Manitoba’s manufacturing and transportation logistics are being enhanced by CentrePort Canada, the country’s first foreign trade zone and inland port. CentrePort Canada offers investment opportunities supported by tax incentives and related services for a wide variety of business models.
Labour Market
Despite the challenging global economic situation, Manitoba’s labour market remains stable, generating a steady increase in new jobs. On an average annual basis, there were a record 633,200 workers in Manitoba in 2013. As has been the case for each of the past three years, the private sector, which accounts for 75% of all jobs in the province, was responsible for all of the gains in employment, with 6,400 new jobs created in 2013. Over the last five years, private sector employment has increased by 4.8% in Manitoba compared to 3.2% nationally. Manitoba’s private sector employment growth has also been the most stable among provinces over the past decade. In 2013, public sector employment declined by 3,300 jobs.
| | |
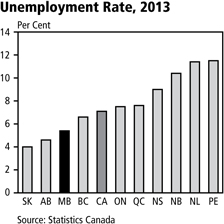
| | Growth in Manitoba’s labour force was largely matched by an expansion in jobs, resulting in a small increase in the unemployment rate to 5.4% in 2013 from 5.3% in 2012. That placed Manitoba third best among provinces and well below the Canadian average of 7.1%. Since the Great Recession, Manitoba has had the second or third lowest unemployment rate in Canada, reflecting the stability of the labour market, regardless of global conditions. While a number of industries saw sizeable employment gains in 2013, several of Manitoba’s largest sectors experienced a softening in the number of persons employed. The greatest gains were in agriculture (14.6%); information, culture and recreation (5.0%); and forestry, fishing, mining, oil and gas (5.9%). |
B U D G E T 2 0 1 4 E c o n o m i c R e v i e w a n d O u t l o o k / A 5
Employment in Manitoba’s manufacturing sector increased by 1.1%, the third highest among provinces and contrasting the 2.9% national decline.
Manitoba’s two largest industries by employment are health care and social assistance (15.0% of employment), and trade (14.5% of employment). These industries saw employment growth decline by 0.1% and 2.3%, respectively over the course of 2013. In addition, employment in public administration fell by 3.4%.
Manufacturing
Manufacturing is Manitoba’s largest industry, accounting for 10% of Manitoba’s GDP. Reflecting the overall contribution to personal incomes in the economy, Manitoba has the third-highest manufacturing employment share among provinces at 10%, following Quebec and Ontario. Manitoba exports a large percentage of manufacturing output, and manufacturing sales account for just under 60% of total foreign merchandise exports.
| | |
A diverse mix of industrial and consumer products make up Manitoba’s manufacturing base including food products, such as meat and potato products; transportation equipment, mainly aerospace and buses; machinery, including tractors and agricultural implements; chemicals, including fertilizers and pharmaceuticals; and wood products, mostly lumber, cabinets, windows and doors. Due to the uneven demand for Manitoba’s exports, manufacturing shipments were mixed in 2013. Overall, shipments of non-durable goods increased 1.3%, while shipments of durable goods declined 1.6%. As a result, the value of manufacturing sales decreased 0.4% in 2013. The strength in the Canadian and U.S. housing markets has driven up the sales of building materials from Manitoba. The rebound in agriculture has fueled demand for chemicals, and agricultural machinery and equipment. However, a number of larger sectors have seen declines in 2013. Transportation (13.7% of sales) decreased 0.6%, while food products (21.5% of sales) were down 0.6% and fabricated metals (5.4% of sales) sales were down 9.8%. | | 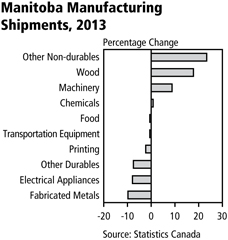
|
As the U.S. economy continues to recover, the pent-up demand for investment in infrastructure, including public and private transportation, will add to the demand for energy efficient buses and lighter aircrafts. This bodes well for Manitoba’s bus manufacturers, as well as the aerospace and advanced composite materials industry. The depreciation of the Canadian dollar should also buoy the sector as manufactured product prices become increasingly competitive in U.S. dollar terms.
Mining and Oil Production
Mineral production has long been a major contributor to Manitoba’s economic growth. While it employs just under 1% of Manitoba’s workforce, it is responsible for nearly 7% of total economic activity, making it one of Manitoba’s most productive industries.
A 6 / E c o n o m i c R e v i e w a n d O u t l o o k B U D G E T 2 0 1 4
Traditionally, Manitoba’s primary mineral commodities have been nickel, copper, zinc and gold. However, oil production has grown rapidly over the last few years to become a significant component as well. Over the last 10 years, the contribution of the oil sector to overall economic activity has almost quadrupled from 0.6% of GDP in 2002 to 2.5% in 2012.
The Manitoba oil and gas industry was a very strong performer in 2013 with 530 new wells drilled in the province. Over the last five years, the total number of wells in the province has increased by 57% and oil investment has totalled $5.3 billion, while the value of oil production over that period was $6 billion. Oil production for 2013 is estimated to reach over 18.4 million barrels with a value of $1.6 billion. Capital investment in 2013 has been estimated at $1.4 billion.
Generally weak global economic conditions have reduced demand for many base metals produced in Manitoba. This has driven up world inventories, forcing prices downward. Nickel, Manitoba’s largest mineral product, has seen its price fall by 14.5% since 2012. Copper prices are down 8.0%, while gold has declined by 15.4%.
Due to weak commodity demand and prices, production quantities in Manitoba have varied. Copper production fell 26.0%, while gold production fell 12.2%. Zinc production saw a marginal increase in 2013 at 0.6% and nickel production increased by 4.6%.
As a result, in 2013, the total value of all metal production in Manitoba has been lower than it was in 2012. The value of silver (-32.4%), copper (-28.3%) and gold (-19.7%) production have all fallen significantly, while the value of nickel production has declined more modestly (-7.4%). Zinc is the only major commodity to enjoy both price and volume gains (for a 5.4% increase in the value of production) over the same period.
Agriculture
The agriculture sector represents 3.3% of the economy and 3.9% of employment. Agriculture is an important sector of the Manitoba economy with linkages to other industries, including food processing, manufacturing, transportation and financing. Primary production of crop and livestock combined with related food-processing businesses represent over 25% of total provincial exports.
| | |
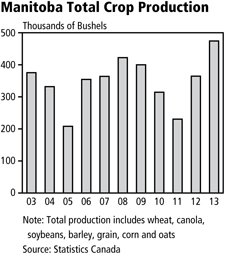
| | Manitoba’s agriculture sector is relatively balanced between crop and livestock market receipts, at 59% and 41% respectively. Farm cash receipts were strong, gaining 14.7% in the first three quarters of 2013, compared to the same period in 2012. Crop receipts were up 28.7%, while livestock receipts increased 2.9%. Reflecting an excellent crop, direct payments to agricultural producers, which include insurance and various types of income supports, declined 15.3% in 2013. Crop production in 2013 reached record levels as ideal weather conditions resulted in the largest volume (bushels) of production in the past decade. Wheat harvest increased 31.5%, canola gained 36.7%, corn increased 49.5%, soybeans were up 38.7%, barley added 14.1%, and oats were lower in 2013 by 1.8%. Corresponding to a bumper crop nationally and internationally, prices for major grains fell. Both wheat and canola prices were down 9% in 2013. In addition, transportation constraints of moving the record harvest to market further exacerbated the challenges for Manitoba producers. With terminals across the country full to capacity, farmers are struggling to find storage options for crops. Producers who were able to sell early capitalized on the high prices, while others have to incur carrying costs. |
B U D G E T 2 0 1 4 E c o n o m i c R e v i e w a n d O u t l o o k / A 7
Manitoba livestock producers are generally benefiting from improved market conditions. Over the last few years, livestock supply has diminished for both cattle and hogs. Manitoba cattle herds were reduced due to lower prices and higher production costs. Hog supply fell due to higher costs and a sharp decrease in demand from the U.S. created by the Country of Origin Labeling (COOL) legislation. With gradual improvements in the U.S., market demand for meat has increased. As a result, Manitoba producers saw higher sales, resulting in a 8.9% increase in cattle receipts and a 1.8% increase in hog receipts. It is anticipated that market conditions will favour continued improvement in demand in 2014.
In 2013, the U.S. tightened the COOL legislation by requiring a tracking of beef and pork from birth through the meat processing and distribution channels. While the new regulations are now enforced, both Canadian and American livestock and packer organizations are challenging COOL, and the Canadian and Mexican governments have stated that they are preparing retaliatory action, which could include retaliatory tariffs, through the World Trade Organization. The Manitoba government supports the federal efforts in opposition to COOL legislation.
Electricity Generation
Manitoba Hydro is responsible for electricity generation, transmission and distribution within the province. More than 98% of the electricity produced in Manitoba comes from clean, renewable sources. The vast majority of that comes from 14
hydro-electric generation stations, primarily on the Winnipeg, Saskatchewan and Nelson River systems. In total, these stations are capable of producing in excess of 5,200 megawatts (MW) of power.
With both domestic and export demand increasing, electricity production turned around in 2013. Total generation at Manitoba Hydro jumped 10% last year, following a 6.7% decline in 2012. Generation for export sales increased 21.2%, while generation for domestic sales increased by 5.1%. As prices firmed, the total receipts from electricity increased by 16.7% to a record $1.8 billion. Receipts from export sales were up 21.3% with U.S. receipts increasing 28.9% to $362 million, the highest level since 2008.
With the completion and activation of the final generator at Wuskwatim in October 2012, Manitoba Hydro is moving to consider a number of new capital projects to help meet future energy demands and safeguard service supply. In addition to the requirement to service increases in domestic demand, Manitoba Hydro has signed more than $9 billion of export contracts since 2010 that will support and require the expansion of generating capacity. The Keeyask station would be a 695 MW facility on the Nelson River projected to commence producing power in 2019. The Conawapa
generation station, potentially Manitoba’s largest hydro facility at 1,485 MW, is also being evaluated with a view to commencing production in 2025.
| | | | |
Manitoba Hydro Generating Stations, 2013 | |
Station | | | MW | |
| |
Limestone | | | 1,340 | |
Kettle Rapids | | | 1,220 | |
Long Spruce | | | 1,010 | |
Grand Rapids | | | 479 | |
Kelsey | | | 250 | |
Wuskwatim | | | 200 | |
Seven Sisters Falls | | | 165 | |
Great Falls | | | 129 | |
Jenpeg | | | 129 | |
Pine Falls | | | 88 | |
Pointe du Bois | | | 75 | |
Slave Falls | | | 67 | |
McArthur Falls | | | 55 | |
Laurie River 1 & 2 | | | 10 | |
| | | | |
| |
Total | | | 5,217 | |
Source: Manitoba Hydro | | | | |
To transmit new capacity and ease the risk of service disruptions, Manitoba Hydro is proposing to build Bipole III. Its projected in-service date is 2017.
A 8 / E c o n o m i c R e v i e w a n d O u t l o o k B U D G E T 2 0 1 4
| | |
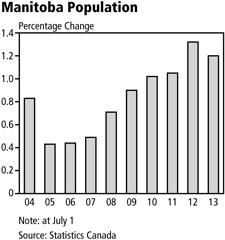
| | Population |
| | Following the new National Household Survey 2011 Census, Statistics Canada has provided historically revised estimates of population for Canada and all provinces. Based on the revised information, Manitoba’s population in 2013 is estimated at 1,265,015 persons (July 1, 2013). Manitoba’s population is fifth largest among provinces and increased by 14,983 persons in 2013 (second largest year-over-year increase in 41 years) or 1.20 % annual growth. Relative to other provinces, Manitoba’s population growth was the third highest and above Canada’s increase of 1.16%. Over the last three years, Manitoba’s annual growth in population has surpassed the national increase. Over a 12-month period ending in July 2013, there were 16,026 births and 10,565 deaths in the province, resulting in a net natural population increase of 5,461 persons, the sixth consecutive increase above 5,000 persons. Manitoba gained |
10,968 persons through net international migration. The province also gained a record 2,775 persons through “other net” migration, which includes non-permanent residents and returning emigrants less temporary emigrants. Net interprovincial outmigration remained stable at 4,221 persons last year compared to 4,212 persons in the previous year.
In 2013, Statistics Canada revised down Manitoba’s population for 2011 by 18,000 persons. The revised estimate has been contested by Manitoba’s Chief Statistician. See the Update on Fiscal Arrangements Budget Paper D for more details. The population growth rates since 2011, however, are not in dispute.
Manitoba Finance’s survey of demographic forecasters highlights a continuing positive trend in Manitoba’s population growth, increasing by 1.2% in 2014 and 1.1% in 2015. These increases are above or match the recent five-year average of 1.1%, and are almost four times the average annual increase of 0.3% in the 1990s.
| | |
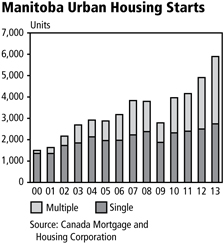
| | Housing |
| | Manitoba’s housing market had another strong year in 2013. Enumerated single-detached starts in urban areas, the best measure of real housing demand, were up 9.6% over 2012, compared to a decline of 6.0% nationally. Meanwhile, all areas starts in Manitoba were up 3.1% versus a 12.5% reduction in the Canadian housing market. Province-wide, more than 7,400 starts were recorded, the highest number since 1987. The pace of new home construction has been driven by the multiple-family sector, with 48.0% of all starts in this sector in 2013, as compared to just over 21.5% in 2004. The apartment vacancy rate in Manitoba, long a source of concern, moved up to 2.0% in the fall of 2013, reflecting a more balanced market between tenants and landlords. Both government and market incentives have spurred rental construction activity in recent years. There were more than 800 new rental units started in 2013, which is consistent with the average of more than 900 starts in each of the last three years. |
B U D G E T 2 0 1 4 E c o n o m i c R e v i e w a n d O u t l o o k / A 9
Growth in the resale market remained robust, although not as heated as has been the case in recent years. While unit sales dropped less than 1% from historically high levels, the average price of a resale home in Winnipeg grew by 5.7% to $259,981.
| | |
Despite the strong price growth in both the new and resale markets, Manitoba remains one of the most affordable jurisdictions in Canada and only slightly above long-term affordability measures, according to the Royal Bank’s Housing Trends and Affordability Report. Canada Mortgage and Housing Corporation is forecasting a small moderation in both new and resale markets as both move towards more balanced market conditions in 2014, with 6,800 starts across the province. Real demand, coupled with relative economic and demographic strength, means Manitoba is expected to remain somewhat insulated in the event of a national housing downturn. Retail Trade In Manitoba, activity in the retail trade sector makes up 5.7% of the economy and 11.5% of all jobs. Supported by economic and demographic fundamentals, retail | | 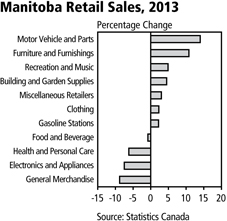
|
trade has expanded in all but one of the last 20 years, placing third among provinces in average annual growth over that time.
In 2013, retail sales grew by 2.0% an improvement from the 1.6% growth in 2012. Among the sectors responsible for the expansion in overall sales were motor vehicles, which were up by 14.0% growth in 2013. This has been fueled by the used car market, which is up 25.1%, and a 14.6% gain in new car sales, good for the second-largest increase among provinces.
| | |
Furniture and home furnishing stores, which are up 10.8% thus far in 2013 (driven by a 22.5% gain in home furnishing sales), have helped support the expansion in retail sales. These gains were offset by general merchandise sales, which were down 8.8%. Retail trade has been boosted in recent years by the arrival of a number of major international chains, including IKEA, Target and Marshall’s. Further expansion of a number of retail sites around the province, coupled with continued economic expansion, should continue to support growth in the sector. Capital Investment Capital investment plays a vital role in virtually every facet of economic development. Investment in industrial and commercial projects provides the means for economic activity, while machinery and equipment, intellectual property products, and other technology also enhance efficiency and productivity. Every bit as important, is investment in transportation, health care, and flood protection infrastructure that facilitates the flow of business, and the safety and well-being of Manitobans. | | 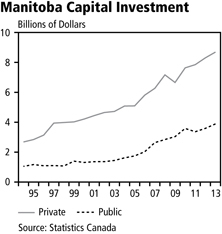
|
Capital investment growth in Manitoba has been among the most consistent in the country over the last 20 years, recording only one year of decline in that time. Last year was no exception, as capital spending in the province grew by 5.8%, easily
A 1 0 / E c o n o m i c R e v i e w a n d O u t l o o k B U D G E T 2 0 1 4
outpacing the 1.5% growth in the rest of the country. This level of growth has become normal in Manitoba, as the 10-year average annual gain is 7.4%.
Manitoba’s economy has benefitted from a sharp increase in business capital spending on residential and non-residential projects. From 2008 to 2013, Manitoba’s private sector capital investment increased by 21.3% compared to a 11.6% national increase. Manitoba’s growth was ranked third highest among provinces. Among industrial sectors, waste management and remedial services nearly doubled. Finance and insurance (83.1%), manufacturing (32.3%), and utilities (30.1%) are also expected to see significant gains in investment.
While the value of building permits advanced 3.9% in 2013, this was the second best performance among provinces and followed on the heels of a 34.9% increase in 2012. Non-residential construction advanced 15% in 2013, led by a 36% increase in the value of industrial investment, the highest such increase among provinces.
Foreign Merchandise Exports
With the onset of the Great Recession in 2008, Manitoba’s exports slipped in both 2009 and 2010. As in Canada, foreign exports have not fully recovered to pre-recession levels. The slow recovery in the U.S. has kept total nominal export receipts 2.2% and 2.8% below the 2008 level in Manitoba and Canada, respectively.
| | |
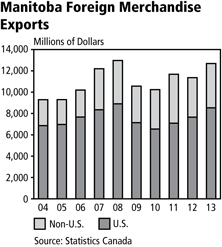
| | With two years of solid growth in crop production, coupled with record oil production, Manitoba’s export commodity inventory was significantly replenished in 2013. As a result, merchandise exports jumped 11.7% to $12.7 billion in 2013, following a 2.7% decline in 2012. Manitoba’s export sales were the strongest among provinces in 2013 and above the national average of 3.5%. Foreign export sales growth was equally balanced last year, increasing 11.4% to the U.S. and 12.1% to other markets. The U.S. recovery, although slow, has been uneven across states. Manitoba has benefited from having, as its largest trading partners, those states with some of the most robust growth in the U.S. The top three U.S. markets for Manitoba are Minnesota (14.9% of U.S. exports), Illinois (14.5% of U.S. exports) and North Dakota (7.9% of U.S. exports). Minnesota and North Dakota have done well through the recovery. The Minnesota economy expanded 3.5% in real terms in 2012 while North Dakota, spurred by the oil and gas industry, has been the fastest growing state in over three years. In 2012, North Dakota’s real GDP increased 13.4%. Manitoba’s |
| |
export sales to North Dakota and Minnesota increased 25.2% and 18.6% in 2013, respectively. The Chinese economy has been expanding at a rapid pace over the last decade and is now the world’s second-largest economy. This rapid expansion has led to a significant increase in bilateral trade. Over the past decade, Manitoba’s export receipts to China have increased from $158 million to over $1 billion, while its share of exports to China has grown from 1.7% in 2003 to 8.1% in 2013. Relative to other provinces, Manitoba has the second-largest share of exports to China, including a broad range of commodities but somewhat concentrated on primary goods (agricultural and mining). |
B U D G E T 2 0 1 4 E c o n o m i c R e v i e w a n d O u t l o o k / A 1 1
| | |
| Green Economy and Green Jobs | | |
| |
According to the United Nations Environment Programme, the green economy is defined as “one that results in improved human well-being and social equity, while significantly reducing environmental risks and ecological scarcities”. Expenditures in new and emerging renewable and energy efficient technologies, and other business ventures that promote sustainable long-term economic prosperity could be considered as green economy investments. Green jobs are defined as employment in any sector of the economy that “contributes to preserving or restoring the quality of the environment”. Green jobs help reduce energy and raw material use through high efficiency strategies and technology. Given the considerable interest and attention green products and services are gaining, and the pace of economic development in emerging markets, opportunities from “green” investments are massive. The green economy is already growing faster than the overall global economy with a global market value currently estimated at over $5 trillion U.S. | | 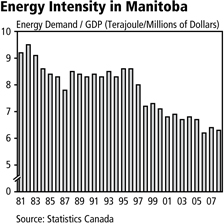
|
The Manitoba economy already benefits from green investments and green jobs in electricity production, transportation, manufacturing, waste management, and bio-products among other sectors. There are more than 30 companies in Manitoba that currently provide a wide range of products from renewable agricultural and forestry resources. The province has a strong commitment to develop renewable energy sources from new-generation hydro, geothermal, ethanol and wind power.
To seize further opportunities in this rapidly expanding sector, Manitoba businesses, academics and government are collaborating to establish and expand on a variety of policies and programs. The goal is to enhance enabling conditions that will generate a positive business environment, build climate resilience, ensure sustained green economic development, and create green jobs for Manitobans. It is part of an eight-year environment plan termed “TomorrowNow”. The collaborative effort will feed into the development of the province’s first Green Economy and Green Jobs Action Plan.
n ECONOMIC OUTLOOK
Uncertainty about medium-term economic conditions has recently been elevated as global growth continued to soften through 2012 and 2013. Although the euro area has resumed growth after two years of contraction, the momentum in two of the world’s largest economies, China and in the U.S., is slower than previously anticipated. As a result, the IMF revised its world growth forecast to 3.0% in 2013 and 3.7% in 2014, representing a downward revision from their July 2013 outlook.
Given the forecast for the external environment, Manitoba is expected to post modest but increasing growth over the next two years. Manitoba Finance surveys several independent forecasting agencies regarding their economic projections for Manitoba and Canada. The survey is used to establish a consensus for the medium-term economic outlook. The current forecast calls 2.2% growth in 2014 before increasing to 2.4% in 2015.
Nominal GDP is projected to increase by 3.5% in 2014 and by 4.4% in 2015. With continued weak overall demand conditions, Manitoba consumer price inflation is expected to average 1.8% in 2014 and 1.9% in 2015. The labour market is expected to improve with the unemployment rate falling to 5.0% by 2015.
A 1 2 / E c o n o m i c R e v i e w a n d O u t l o o k B U D G E T 2 0 1 4
Manitoba Outlook at a Glance
| | | | | | |
| | | 2013 | | 2014f | | 2015f |
| | |
| | | | | (per cent change unless noted) | | |
Gross Domestic Product | | | | | | |
Real | | 2.4 | | 2.2 | | 2.4 |
Nominal | | 3.7 | | 3.5 | | 4.4 |
Employment | | 0.5 | | 1.0 | | 1.3 |
Unemployment Rate (%) | | 5.4 | | 5.2 | | 5.0 |
Consumer Price Index | | 2.2 | | 1.8 | | 1.9 |
Population | | 1.2 | | 1.2 | | 1.1 |
f = Forecast
Sources: 2013 Statistics Canada and Manitoba Bureau of Statistics. 2014f and 2015f Manitoba Finance survey of economic forecasters.
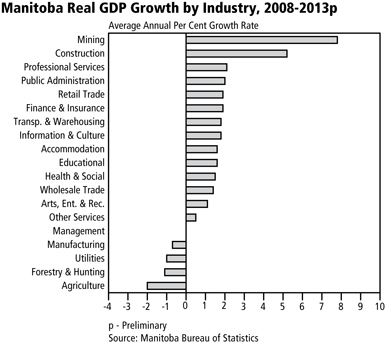
B U D G E T 2 0 1 4 E c o n o m i c Re v i e w a n d O u t l o o k / A 1 3
A 1 4 / E c o n o m i c R e v i e w a n d O u t l o o k B U D G E T 2 0 1 4
MANITOBA ECONOMIC STATISTICS, 2009 TO 2013
| | | | | | | | | | | | | | | | | | | | |
| | | 2009 | | | 2010 | | | 2011 | | | 2012 | | | 2013 | |
| | | | | | Millions of Dollars | | | | |
POPULATION | | | | | | | | | | | | | | | | | | | | |
July 1 (000’s) | | | 1,209 | | | | 1,221 | | | | 1,234 | | | | 1,250 | | | | 1,265 | |
| | | | | |
GROSS DOMESTIC PRODUCT1 | | | | | | | | | | | | | | | | | | | | |
Nominal | | | 50,683 | | | | 52,934 | | | | 55,214 | | | | 58,156 | | | | 60,315 | |
Real ($2007) | | | 51,076 | | | | 52,378 | | | | 53,287 | | | | 54,548 | | | | 55,847 | |
| | | | | |
SECTORS | | | | | | | | | | | | | | | | | | | | |
Farm Cash Receipts | | | 4,853 | | | | 4,781 | | | | 4,970 | | | | 5,178 | | | | n/a | |
Crops | | | 2,816 | | | | 2,683 | | | | 2,550 | | | | 2,749 | | | | n/a | |
Livestock | | | 1,651 | | | | 1,748 | | | | 1,920 | | | | 1,934 | | | | n/a | |
Direct Payments | | | 386 | | | | 349 | | | | 500 | | | | 496 | | | | n/a | |
Manufacturing Shipments | | | 14,753 | | | | 14,434 | | | | 15,401 | | | | 15,611 | | | | 15,550 | |
Mining | | | 1,971 | | | | 2,582 | | | | 3,188 | | | | 3,026 | | | | n/a | |
Electric Power Sales | | | 1,560 | | | | 1,569 | | | | 1,592 | | | | 1,547 | | | | 1,805 | |
Export Sales | | | 399 | | | | 410 | | | | 354 | | | | 321 | | | | 389 | |
Housing Starts (no. of units) | | | 4,174 | | | | 5,888 | | | | 6,083 | | | | 7,242 | | | | 7,465 | |
Retail Trade | | | 15,127 | | | | 16,029 | | | | 16,758 | | | | 17,018 | | | | 17,355 | |
New Car Sales (no. of units) | | | 43,995 | | | | 45,355 | | | | 48,546 | | | | 52,236 | | | | 56,275 | |
| | | | | |
FOREIGN EXPORTS | | | | | | | | | | | | | | | | | | | | |
Total Exports | | | 10,567 | | | | 10,238 | | | | 11,678 | | | | 11,363 | | | | 12,687 | |
U.S. | | | 7,138 | | | | 6,545 | | | | 7,096 | | | | 7,655 | | | | 8,530 | |
| | | | | |
LABOUR MARKET | | | | | | | | | | | | | | | | | | | | |
Labour Force (000’s) | | | 641.8 | | | | 654.9 | | | | 660.2 | | | | 665.4 | | | | 669.0 | |
Employment (000’s) | | | 608.3 | | | | 619.8 | | | | 624.5 | | | | 630.1 | | | | 633.2 | |
Participation Rate (%) | | | 69.1 | | | | 69.6 | | | | 69.3 | | | | 69.1 | | | | 68.7 | |
Unemployment Rate (%) | | | 5.2 | | | | 5.4 | | | | 5.4 | | | | 5.3 | | | | 5.4 | |
Average Weekly Earnings ($) | | | 770.87 | | | | 785.92 | | | | 807.46 | | | | 829.50 | | | | 835.79 | |
| | | | | |
INVESTMENT | | | | | | | | | | | | | | | | | | | | |
Total | | | 9,694 | | | | 11,218 | | | | 11,213 | | | | 11,894 | | | | 12,578 | |
Private | | | 6,657 | | | | 7,635 | | | | 7,850 | | | | 8,305 | | | | 8,691 | |
Public | | | 3,037 | | | | 3,582 | | | | 3,363 | | | | 3,589 | | | | 3,887 | |
Non-residential | | | 7,448 | | | | 8,567 | | | | 8,381 | | | | 8,745 | | | | 9,446 | |
Housing | | | 2,246 | | | | 2,651 | | | | 2,832 | | | | 3,149 | | | | 3,132 | |
| | | | | |
CONSUMER PRICE INDEX | | | | | | | | | | | | | | | | | | | | |
(Index, 2002 = 100) | | | 114.1 | | | | 115.0 | | | | 118.4 | | | | 120.3 | | | | 123.0 | |
| | | | | |
BANKRUPTCIES | | | | | | | | | | | | | | | | | | | | |
Business | | | 65 | | | | 68 | | | | 60 | | | | 36 | | | | n/a | |
Farm | | | 17 | | | | 6 | | | | 5 | | | | 7 | | | | n/a | |
Personal | | | 2,443 | | | | 1,994 | | | | 1,514 | | | | 1,276 | | | | n/a | |
1 2013 are preliminary estimates by Manitoba Bureau of Statistics.
Sources: Statistics Canada, Manitoba Bureau of Statistics and Manitoba Finance.
Totals may not add due to rounding
B U D G E T 2 0 1 4 E c o n o m i c R e v i e w a n d O u t l o o k / A 1 5
| | | | | | | | | | | | | | | | | | | | | | | | | |
| 2009 | | 2010 | | 2011 | | 2012 | | 2013 | | |
| | | Annual Percentage Change | | | | |
| | | | | | | | | | | | | | | | | | | | | | | | | | POPULATION |
| | | 0.9 | | | | | 1.0 | | | | | 1.0 | | | | | 1.3 | | | | | 1.2 | | | July 1 (000’s) |
| | | | | |
| | | | | | | | | | | | | | | | | | | | | | | | | | GROSS DOMESTIC PRODUCT1 |
| | | -2.5 | | | | | 4.4 | | | | | 4.3 | | | | | 5.3 | | | | | 3.7 | | | Nominal |
| | | -0.2 | | | | | 2.6 | | | | | 1.7 | | | | | 2.4 | | | | | 2.4 | | | Real ($2007) |
| | | | | |
| | | | | | | | | | | | | | | | | | | | | | | | | | SECTORS |
| | | 0.2 | | | | | -1.5 | | | | | 4.0 | | | | | 4.2 | | | | | n/a | | | Farm Cash Receipts |
| | | 1.4 | | | | | -4.7 | | | | | -5.0 | | | | | 7.8 | | | | | n/a | | | Crops |
| | | -3.8 | | | | | 5.8 | | | | | 9.9 | | | | | 0.7 | | | | | n/a | | | Livestock |
| | | 10.2 | | | | | -9.6 | | | | | 43.0 | | | | | -0.8 | | | | | n/a | | | Direct Payments |
| | | -9.9 | | | | | -2.2 | | | | | 6.7 | | | | | 1.4 | | | | | -0.4 | | | Manufacturing Shipments |
| | | -21.8 | | | | | 31.0 | | | | | 23.5 | | | | | -5.1 | | | |
| n/
a |
| | Mining |
| | | -10.2 | | | | | 0.5 | | | | | 1.5 | | | | | -2.8 | | | | | 16.7 | | | Electric Power Sales |
| | | -37.0 | | | | | 2.6 | | | | | -13.6 | | | | | -9.3 | | | | | 21.3 | | | Export Sales |
| | | -24.6 | | | | | 41.1 | | | | | 3.3 | | | | | 19.1 | | | | | 3.1 | | | Housing Starts (no. of units) |
| | | -0.1 | | | | | 6.0 | | | | | 4.5 | | | | | 1.6 | | | | | 2.0 | | | Retail Trade |
| | | -8.4 | | | | | 3.1 | | | | | 7.0 | | | | | 7.6 | | | | | 7.7 | | | New Car Sales (no. of units) |
| | | | | |
| | | | | | | | | | | | | | | | | | | | | | | | | | FOREIGN EXPORTS |
| | | -18.5 | | | | | -3.1 | | | | | 14.1 | | | | | -2.7 | | | | | 11.7 | | | Total Exports |
| | | -19.8 | | | | | -8.3 | | | | | 8.4 | | | | | 7.9 | | | | | 11.4 | | | U.S. |
| | | | | |
| | | | | | | | | | | | | | | | | | | | | | | | | | LABOUR MARKET |
| | | 1.1 | | | | | 2.0 | | | | | 0.8 | | | | | 0.8 | | | | | 0.5 | | | Labour Force (000’s) |
| | | 0.0 | | | | | 1.9 | | | | | 0.8 | | | | | 0.9 | | | | | 0.5 | | | Employment (000’s) |
| | | - | | | | | - | | | | | - | | | | | - | | | | | - | | | Participation Rate (%) |
| | | - | | | | | - | | | | | - | | | | | - | | | | | - | | | Unemployment Rate (%) |
| | | 2.9 | | | | | 2.0 | | | | | 2.7 | | | | | 2.7 | | | | | 0.8 | | | Average Weekly Earnings ($) |
| | | | | |
| | | | | | | | | | | | | | | | | | | | | | | | | | INVESTMENT |
| | | -3.1 | | | | | 15.7 | | | | | 0.0 | | | | | 6.1 | | | | | 5.8 | | | Total |
| | | -7.1 | | | | | 14.7 | | | | | 2.8 | | | | | 5.8 | | | | | 4.6 | | | Private |
| | | 6.9 | | | | | 18.0 | | | | | -6.1 | | | | | 6.7 | | | | | 8.3 | | | Public |
| | | -3.2 | | | | | 15.0 | | | | | -2.2 | | | | | 4.3 | | | | | 8.0 | | | Non-residential |
| | | -2.8 | | | | | 18.0 | | | | | 6.8 | | | | | 11.2 | | | | | -0.5 | | | Housing |
| | | | | |
| | | | | | | | | | | | | | | | | | | | | | | | | | CONSUMER PRICE INDEX |
| | | 0.6 | | | | | 0.8 | | | | | 3.0 | | | | | 1.6 | | | | | 2.2 | | | (Index, 2002 = 100) |
| | | | | |
| | | | | | | | | | | | | | | | | | | | | | | | | | BANKRUPTCIES |
| | | -36.9 | | | | | 4.6 | | | | | -11.8 | | | | | -40.0 | | | | | n/a | | | Business |
| | | -22.7 | | | | | -64.7 | | | | | -16.7 | | | | | 40.0 | | | | | n/a | | | Farm |
| | | 20.6 | | | | | -18.4 | | | | | -24.1 | | | | | -15.7 | | | | | n/a | | | Personal |
Budget Paper B
SUPPLEMENTARY
FINANCIAL INFORMATION
| | |
Available in alternate formats upon request. | | |
SUPPLEMENTARY FINANCIAL INFORMATION
| | | | |
CONTENTS | | | | |
| |
SPECIAL ACCOUNTS | | | 1 | |
Fiscal Stabilization Account | | | 1 | |
Pension Asset Fund | | | 2 | |
| |
CAPITAL INVESTMENT | | | 4 | |
| |
CAPITAL INVESTMENT – CORE GOVERNMENT | | | 4 | |
| |
CAPITAL INVESTMENT – OTHER | | | 5 | |
| |
LOAN REQUIREMENTS | | | 6 | |
| |
BORROWING REQUIREMENTS | | | 8 | |
| |
SUMMARY NET DEBT | | | 9 | |
B U D G E T 2 0 1 4 S u p p l e m e n t a r y F i n a n c i a l I n f o r m a t i o n / B 1
n SPECIAL ACCOUNTS
Fiscal Stabilization Account
The Fiscal Stabilization Account (FSA) is projected to have a balance of $275 million as at March 31, 2014, after a draw of $100 million to retire a portion of the borrowings incurred during the period of recovery to support core government programs.
The budgeted draw in 2014/15 of $55 million is to retire a portion of the borrowings of the core government.
Fiscal Stabilization Account
Revenue, Expenditure and Balance
Projection to March 31, 2014
| | | | | | | | | | |
| | | 2014/15 | | | | | 2013/14 | |
| | | |
| | | Budget | | | | | Forecast | |
| | | | | | (Millions of Dollars) | | | |
Balance, Beginning of Year | | | 275 | | | | | | 375 | |
| | | |
Transfers to the Core Government | | | | | | | | | | |
Debt Repayment | | | (55) | | | | | | (100) | |
| | | | | | | | | | |
| | | |
Balance, End of Year | | | 220 | | | | | | 275 | |
| | | | | | | | | | |
B 2 / S u p p l e m e n t a r y F i n a n c i a l I n f o r m a t i o n B U D G E T 2 0 1 4
Pension Asset Fund
The trust conditions of the funds held in the Pension Asset Fund are irrevocably restricted for pension purposes only. Net investment earnings of pension assets include the expected rate of return during the year as well as adjustments to market-related value. Market fluctuations of pension assets are not recorded in the year in which they occur, but are recognized over the employee average remaining service life.
The fund is expected to have a balance of $3,705 million by the end of the 2014/15 fiscal year.
Pension Asset Fund
Projection as at March 31, 2015 and March 31, 2014
| | | | | | | | | | | | |
| | | 2014/15 | | | | 2013/14 |
| | | Budget | | | | Forecast |
| | | | | | | (Millions of Dollars) | | | | | |
Balance, Beginning of Year | | | | 3,606 | | | | | | | 3,485 | |
| | | | | | | | | | | | |
| | | |
Contributions and Revenue | | | | | | | | | | | | |
Net Investment Earnings | | | | 226 | | | | | | | 258 | |
Departments and Crown Corporations | | | | 191 | | | | | | | 174 | |
| | | | | | | | | | | | |
| | | | 417 | | | | | | | 432 | |
| | | | | | | | | | | | |
Transfers | | | | | | | | | | | | |
Teachers’ Retirement Allowances Fund (TRAF) and | | | | | | | | | | | | |
Civil Service Superannuation Fund (CSSF) payments | | | | (318) | | | | | | | (311) | |
| | | | | | | | | | | | |
| | | |
Balance, End of Year | | | | 3,705 | | | | | | | 3,606 | |
| | | | | | | | | | | | |
B U D G E T 2 0 1 4 S u p p l e m e n t a r y F i n a n c i a l I n f o r m a t i o n / B 3
SUMMARY OF ACCOUNT/FUND ACTIVITY
| | | | | | | | | | | | | | | | | | | | | | | | | | | | | | | | | | | | | | | | | | | | | | | | | | | | | | | | | | | | | | | | |
| | | 14/15 | | | 13/14 | | | 12/13 | | | 11/12 | | | 10/11 | | | 09/10 | | | 08/09 | | | 07/08 | | | 06/07 | | | 05/06 | | | 04/05 | | | 03/04 | | | 02/03 | | | 01/02 | | | 00/01 | | | 99/00 | |
| | | | | | | | | | | | | | | | |
| | | Budget | | | Forecast | | | Actual | | | Actual | | | Actual | | | Actual | | | Actual | | | Actual | | | Actual | | | Actual | | | Actual | | | Actual | | | Actual | | | Actual | | | Actual | | | Actual | |
| | | | | | | | | | | | | | | | | | | | | (Millions of Dollars) | | | | | | | | | | | | | | | | | | | |
Fiscal Stabilization Account | | | | | | | | | | | | | | | | | | | | | | | | | | | | | | | | | | | | | | | | | | | | | | | | | | | | | | | | | | | | | | | | |
Transfers to Account | | | - | | | | - | | | | - | | | | - | | | | - | | | | - | | | | 30 | | | | 128 | | | | 110 | | | | 31 | | | | 405 | | | | 13 | | | | 4 | | | | 63 | | | | 40 | | | | 11 | |
Transfers from Account | | | (55 | ) | | | (100 | ) | | | (152 | ) | | | (155 | ) | | | (125 | ) | | | (57 | ) | | | - | | | | - | | | | - | | | | - | | | | - | | | | (171 | ) | | | (22 | ) | | | (150 | ) | | | - | | | | (185 | ) |
Investment Revenue | | | - | | | | - | | | | - | | | | - | | | | - | | | | - | | | | 16 | | | | 27 | | | | 21 | | | | 15 | | | | 2 | | | | 1 | | | | 7 | | | | 14 | | | | 15 | | | | 12 | |
Balance, End of Year | | | 220 | | | | 275 | | | | 375 | | | | 527 | | | | 682 | | | | 807 | | | | 864 | | | | 818 | | | | 663 | | | | 532 | | | | 486 | | | | 79 | | | | 236 | | | | 247 | | | | 320 | | | | 265 | |
Pension Asset Fund | | | | | | | | | | | | | | | | | | | | | | | | | | | | | | | | | | | | | | | | | | | | | | | | | | | | | | | | | | | | | | | | |
Transfers from Debt Retirement Account | | | - | | | | - | | | | - | | | | - | | | | - | | | | 10 | | | | 55 | | | | 85 | | | | 85 | | | | 85 | | | | 79 | | | | 75 | | | | 48 | | | | 75 | | | | 21 | | | | - | |
Net Investment Earnings | | | 226 | | | | 258 | | | | 295 | | | | 40 | | | | 100 | | | | 160 | | | | 41 | | | | 16 | | | | 67 | | | | 61 | | | | 31 | | | | 38 | | | | (6 | ) | | | 2 | | | | - | | | | - | |
Net Current Service Contributions | | | (127 | ) | | | (137 | ) | | | (134 | ) | | | (130 | ) | | | (114 | ) | | | (100 | ) | | | (80 | ) | | | (60 | ) | | | 10 | | | | 8 | | | | 6 | | | | 3 | | | | 2 | | | | 9 | | | | - | | | | - | |
TRAF/CSSF Funding | | | - | | | | - | | | | - | | | | 240 | | | | 180 | | | | 330 | | | | 350 | | | | 1,502 | | | | - | | | | - | | | | - | | | | - | | | | - | | | | - | | | | - | | | | - | |
Balance, End of Year | | | 3,705 | | | | 3,606 | | | | 3,485 | | | | 3,324 | | | | 3,174 | | | | 3,008 | | | | 2,608 | | | | 2,242 | | | | 699 | | | | 537 | | | | 383 | | | | 267 | | | | 151 | | | | 107 | | | | 21 | | | | - | |
B 4 / S u p p l e m e n t a r y F i n a n c i a l I n f o r m a t i o n B U D G E T 2 0 1 4
n CAPITAL INVESTMENT
Capital investment, both in core government and the Other Reporting Entities (OREs), continues to be a priority for the government. An investment made to construct or enhance capital assets is a major benefit to government in providing the services Manitobans need into the future.
The investment in tangible capital assets is projected to be $19.7 billion as at March 31, 2015, with $8.0 billion of related debt having been retired through accumulated amortization. Core government will have a total of $8.1 billion in capital asset investments as at March 31, 2015 and $2.7 billion of related debt will have been retired through accumulated amortization.
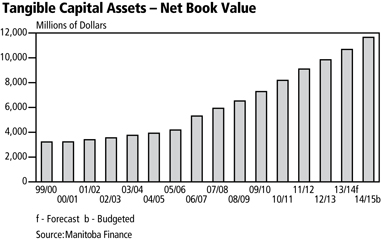
n CAPITAL INVESTMENT – CORE GOVERNMENT
Government-owned capital assets such as highways, waterways, buildings, machinery and computer systems are amortized over their useful life based on established guidelines for amortization (see Appendix B of the 2014/15 Estimates of Expenditure). The amortization and interest costs are borne by departments that are responsible for each asset and are reflected as annual costs related to capital assets. In total, costs related to capital assets are estimated at $437 million in 2014/15, an increase of $24 million from 2013/14. In 2014/15, departmental appropriations include $225 million for amortization and $212 million for allocation of interest.
B U D G E T 2 0 1 4 S u p p l e m e n t a r y F i n a n c i a l I n f o r m a t i o n / B 5
Authority for the annual cost to acquire government-owned assets is reflected as Part B – Capital Investment which totals $742 million in 2014/15, an increase of $46 million from 2013/14.
Capital Investment, 2014/15
(Thousands of Dollars)
| | | | | | | | | | |
| | | 2014/15 | | 2013/14 |
| | | Budget | | Budget |
General Assets | | | | | | | | | | |
Government Services Capital Projects | | | | 80,000 | | | | | 112,000 | |
Transportation Equipment and Aircraft | | | | 16,310 | | | | | 16,920 | |
Information Technology Projects | | | | | | | | | | |
Corporate Information Technology Projects | | | | 21,431 | | | | | 21,904 | |
Education and Advanced Learning | | | | 100 | | | | | 100 | |
Conservation and Water Stewardship | | | | 300 | | | | | 405 | |
Family Services | | | | 500 | | | | | - | |
Finance | | | | 500 | | | | | 500 | |
Health | | | | - | | | | | 665 | |
Infrastructure and Transportation | | | | 100 | | | | | - | |
Justice | | | | 200 | | | | | 325 | |
Other Equipment and Buildings | | | | 17,015 | | | | | 19,427 | |
| | | | | | | | | | |
| | | | 136,456 | | | | | 172,246 | |
| | | | | | | | | | |
Infrastructure Assets | | | | | | | | | | |
Provincial Roads, Highways and Airport Infrastructure | | | | 550,510 | | | | | 470,510 | |
Water Related Infrastructure | | | | 36,000 | | | | | 37,100 | |
Parks, Cottage and Camping Projects | | | | 18,613 | | | | | 15,839 | |
| | | | | | | | | | |
| | | | 605,123 | | | | | 523,449 | |
| | | | | | | | | | |
Total Capital Investment | | | | 741,579 | | | | | 695,695 | |
| | | | | | | | | | |
n CAPITAL INVESTMENT – OTHER
Government continues to support capital assets held for public use within the OREs. These assets include hospitals, universities, colleges, public schools and housing, with an investment of $751 million included in Budget 2014.
B 6 / S u p p l e m e n t a r y F i n a n c i a l I n f o r m a t i o n B U D G E T 2 0 1 4
n LOAN REQUIREMENTS
The Loan Act, 2014 provides borrowing and expenditure authority and, in some cases, guarantee authority for the government and its agencies to undertake self-sustaining programs, where self-sustaining means having the ability for repayment. This authority is in addition to that voted in the printed estimates review.
Incremental Capital Authority Requirements for Non-Budgetary Programs, 2014/15
(Thousands of Dollars)
| | | | |
The Loan Act, 2014 | | | | |
The Manitoba Hydro-Electric Board | | $ | 1,287,000 | |
Manitoba Liquor and Lotteries Corporation | | | 57,700 | |
Communities Economic Development Fund | | | 9,800 | |
Health Capital Program | | | 290,973 | |
Manitoba Housing and Renewal Corporation | | | 266,199 | |
Manitoba Agricultural Services Corporation | | | 99,116 | |
Manitoba Opportunities Fund | | | 71,167 | |
Manitoba Student Aid Program | | | 35,036 | |
Special Operating Agencies Financing Authority - Vehicles and Equipment Management Agency | | | 24,000 | |
Manitoba Water Services Board | | | 22,195 | |
Post-Secondary Institutions | | | 14,825 | |
Sport Manitoba Inc. | | | 6,000 | |
Business Support | | | 5,383 | |
Diagnostic Services Manitoba | | | 1,993 | |
Leaf Rapids Town Properties Ltd. | | | 500 | |
Manitoba Film Guarantee Program | | | 360 | |
| | | | |
| | $ | 2,192,247 | |
| | | | |
B U D G E T 2 0 1 4 S u p p l e m e n t a r y F i n a n c i a l I n f or m a t i o n / B 7
| | | | |
| Non-Budgetary Capital Program, 2014/15 | | | | |
| (Thousands of Dollars) | | | |
| |
The Manitoba Hydro-Electric Board | | | $2,237,000 | |
Manitoba Liquor and Lotteries Corporation | | | 182,000 | |
Communities Economic Development Fund | | | 9,000 | |
Health Capital Program | | | 420,924 | |
Manitoba Housing and Renewal Corporation | | | 295,315 | |
Manitoba Agricultural Services Corporation | | | 192,330 | |
Business Support (including Manitoba Industrial Opportunities Program) | | | 62,650 | |
Manitoba Opportunities Fund | | | 58,848 | |
The Manitoba Water Services Board | | | 53,026 | |
Special Operating Agencies Financing Authority - Vehicles and Equipment Management Agency | | | 39,350 | |
Manitoba Student Aid Program | | | 36,512 | |
Post-Secondary Institutions | | | 33,515 | |
Diagnostic Services Manitoba | | | 20,901 | |
Northern Affairs Communities | | | 8,934 | |
Cottage Lots Development | | | 6,971 | |
Special Operating Agencies Financing Authority - Crown Lands and Property Agency | | | 4,500 | |
Miscellaneous Corporations, Agencies and Other Programs | | | 11,480 | |
| | | | |
| | | $3,673,256 | |
| | | | |
B 8 / S u p p l e m e n t a r y F i n a n c i a l I n f o r m a t i o n B U D G E T 2 0 1 4
n BORROWING REQUIREMENTS
Manitoba’s borrowing requirements with respect to both general and self-sustaining borrowings is estimated to total $4.8 billion in 2014/15, of which $2.4 billion is required for refinancing purposes. New cash requirements, net of estimated repayments, are $2.4 billion, which includes requirements for general government purposes, capital investments by departments and The Manitoba Hydro-Electric Board. Estimated repayments are for capital investment assets, health facilities and lotteries. The Loan Act, 2014, will provide incremental capital authority of $2.2 billion.
Borrowing Requirements 2014/15
(Thousands of Dollars)
| | | | | | | | | | | | | | | | | | | | |
| | | Refinancing | | New Cash
Requirements | | Estimated
Repayments | | Borrowing
Requirements |
Government Business Enterprises | | | | | | | | | | | | | | | | | | | | |
The Manitoba Hydro-Electric Board | | | | 900,000 | | | | | 1,500,000 | | | | | - | | | | | 2,400,000 | |
Manitoba Liquor and Lotteries Corporation | | | | - | | | | | 50,000 | | | | | 24,313 | | | | | 25,687 | |
| | | | | | | | | | | | | | | | | | | | |
Subtotal | | | | 900,000 | | | | | 1,550,000 | | | | | 24,313 | | | | | 2,425,687 | |
| | | | | | | | | | | | | | | | | | | | |
Other Borrowings | | | | | | | | | | | | | | | | | | | | |
General Purpose Borrowings | | | | 926,158 | | | | | 324,000 | | | | | - | | | | | 1,250,158 | |
Capital Investment Assets | | | | 475,856 | | | | | 639,579 | | | | | 221,902 | | | | | 893,533 | |
Health Facilities | | | | - | | | | | 120,000 | | | | | 119,287 | | | | | 713 | |
Other Crowns and Organizations | | | | 95,600 | | | | | 100,000 | | | | | - | | | | | 195,600 | |
| | | | | | | | | | | | | | | | | | | | |
Subtotal | | | | 1,497,614 | | | | | 1,183,579 | | | | | 341,189 | | | | | 2,340,004 | |
| | | | | | | | | | | | | | | | | | | | |
Total Borrowing Requirements | | | | 2,397,614 | | | | | 2,733,579 | | | | | 365,502 | | | | | 4,765,691 | |
| | | | | | | | | | | | | | | | | | | | |
B U D G E T 2 0 1 4 S u p p l e m e n t a r y F i n a n c i a l I n f o r m a t i o n / B 9
n SUMMARY NET DEBT
| | | | | | |
| Changes in Summary Net Debt | | | | | |
| (Millions of Dollars) | | | | | |
| | |
2013/14 Summary Net Debt (Forecast) | | | 17,288 | | | |
| | |
Net Investment in Tangible Capital Assets | | | | | | |
Core Government | | | 516 | | | |
Other Reporting Entities | | | 457 | | | |
| | | | | | |
| | | 973 | | | |
| | | | | | |
Plus: Projected (Income) Loss for the Year | | | | | | |
Core Government | | | 324 | | | |
Other Reporting Entities | | | 33 | | | |
| | | | | | |
| | | 357 | | | |
| | | | | | |
Change in Net Debt | | | 1,330 | | | |
| | | | | | |
2014/15 Summary Net Debt (Budget) | | | 18,618 | | | |
| | | | | | |
In Budget 2014, the net debt to GDP ratio is forecast to be 29.8%. Net debt is an important indicator of a government’s financial position as this highlights the affordability of future government service. Summary net debt represents the difference between the Government Reporting Entities total liabilities, such as borrowing and financing, less its financial assets* – it reflects the residual liability that must be financed by future revenues. Net debt may grow in absolute terms from time to time, as needed investments in capital assets are made. These investments underpin and support Manitoba’s economic performance. It is important to measure changes in net debt against the growth of the economy, as measured by the nominal GDP.
* Financial assets are liquid assets such as cash, investments, loans and accounts receivable that could be readily converted to cash.
B 1 0 / S u p p l e m e n t a r y F i n a n c i a l I n f o r m a t i o n B U D G E T 2 0 1 4