Exhibit 99.1

PROVINCE OF MANITOBA
| | |
| | This description of Province of Manitoba is dated as of October 23, 2014 and appears as Exhibit 99.1 to Province of Manitoba’s Annual Report on Form 18-K to the U.S. Securities and Exchange Commission for the fiscal year ended March 31, 2014. |
4
This document (otherwise than as part of a prospectus contained in a registration statement filed under the Securities Act of 1933) does not constitute an offer to sell or the solicitation of an offer to buy any securities of the Province. The delivery of this document at any time does not imply that the information herein is correct as of any time subsequent to its date.
TABLE OF CONTENTS
| | | | |
| | | Page | |
Further Information | | | 6 | |
Summary | | | 7 | |
Map of Province of Manitoba | | | 9 | |
Province of Manitoba | | | 10 | |
General Information | | | 10 | |
Constitutional Framework | | | 10 | |
Provincial Government | | | 10 | |
Economy | | | 11 | |
General | | | 11 | |
Economic Structure | | | 13 | |
Total Exports and Imports | | | 19 | |
Foreign Merchandise Exports | | | 20 | |
Capital Investment | | | 21 | |
Labour Force | | | 22 | |
Energy | | | 23 | |
Government Finances | | | 23 | |
Budget | | | 25 | |
Core Government Revenue | | | 27 | |
Core Government Expenses | | | 29 | |
Crown Organizations and Government Business Enterprises | | | 30 | |
Public Debt | | | 31 | |
Borrowing Record | | | 31 | |
Direct Funded Borrowings | | | 32 | |
Guaranteed Borrowings | | | 33 | |
Maturity Schedule | | | 33 | |
Sinking Funds | | | 34 | |
Unfunded Debt | | | 34 | |
Consolidated Funded Borrowings of the Manitoba Public Sector | | | 34 | |
Selected Borrowings Information | | | 35 | |
Pension Liability | | | 37 | |
The Manitoba Hydro-Electric Board | | | 38 | |
Operations | | | 39 | |
Rate Matters | | | 39 | |
Statistical Information | | | 40 | |
Construction Program | | | 41 | |
Export Power Sales | | | 43 | |
Canadian Foreign Exchange | | | 46 | |
Tables of Supplementary Information | | | 47 | |
5
FURTHER INFORMATION
This document appears as an exhibit to Manitoba’s Annual Report to the U.S. Securities and Exchange Commission on Form 18-K for the fiscal year ended March 31, 2014. Additional information with respect to Manitoba is available in that Annual Report, in the other exhibits to that Annual Report and in amendments thereto. The Annual Report exhibits and amendments can be inspected and copied at the public reference facilities maintained by the Commission at: 100 F Street, N.E., Washington, D.C. 20549. Copies of those documents may also be obtained at prescribed rates from the Public Reference Section of the Commission at its Washington address or from Province of Manitoba, Department of Finance, Treasury Division, 350-363 Broadway, Winnipeg, Manitoba R3C 3N9, Canada.
The Province files annual reports, amendments to annual reports and other information with the Commission. These reports and amendments include certain financial, statistical and other information about the Province, and may be accompanied by exhibits. You may read and copy any document the Province files with the Commission at the Commission’s public reference room in Washington, D.C. You may also obtain copies of the same documents from the public reference room in Washington, D.C. by paying a fee. Please call the Commission at 1-800-SEC-0330 for further information on the public reference room. The Commission also maintains a web site at http://www.sec.gov, which contains reports and other information regarding issuers that file electronically with the Commission.
The fiscal year of Manitoba ends March 31. Fiscal 2014 and 2013-2014 refer to the fiscal year ended March 31, 2014 and, unless otherwise indicated, 2013 means the calendar year ended December 31, 2013. Other fiscal years and calendar years are referred to in a corresponding manner.
In this document, unless otherwise specified or the context otherwise requires, all dollar amounts are expressed in Canadian dollars ($ or C$) and all references to dollars are to Canadian dollars. See “Canadian Foreign Exchange” for information regarding the rates of conversion of U.S. dollars into Canadian dollars.
At October 22, 2014, the noon spot exchange rate for U.S. dollars as reported by Bank of Canada, expressed in Canadian dollars, was $1.1219.
Totals in the statistical tables set forth in this document may not add due to rounding.
6
SUMMARY
The following information is qualified in its entirety by the more
detailed information in this document.
PROVINCE OF MANITOBA
Economy
| | | | | | | | | | | | | | | | | | | | | | | | |
| | | Year Ended December 31, | | | Compound Annual Growth Rate | |
| | | 2009 | | | 2010 | | | 2011 | | | 2012 | | | 2013 | | | 2009-2013 | |
| | | (In millions of dollars, unless otherwise indicated) | |
Nominal Gross Domestic Product | | $ | 50,683 | | | $ | 52,934 | | | $ | 55,214 | | | $ | 58,156 | | | $ | 60,315 | | | | 4.4 | % |
Change in Real Gross Domestic Product | | | | | | | | | | | | | | | | | | | | | | | | |
Manitoba | | | -0.2 | % | | | 2.6 | % | | | 1.7 | % | | | 2.4 | % | | | 2.4 | % | | | | |
Canada | | | -2.7 | % | | | 3.4 | % | | | 2.5 | % | | | 1.7 | % | | | 2.0 | % | | | | |
Manufacturing Shipments | | $ | 14,669 | | | $ | 14,367 | | | $ | 15,229 | | | $ | 15,398 | | | $ | 15,428 | | | | 1.3 | |
Farm Cash Receipts | | | 4,853 | | | | 4,781 | | | | 4,971 | | | | 5,169 | | | | 5,797 | | | | 4.5 | |
Capital Investment | | | 9,694 | | | | 11,218 | | | | 11,213 | | | | 11,894 | | | | 12,578 | | | | 6.7 | |
Primary Household Income | | | 34,186 | | | | 35,072 | | | | 36,701 | | | | 38,561 | | | | 39,755 | | | | 3.8 | |
Population at July 1 (in thousands) | | | 1,209 | | | | 1,221 | | | | 1,234 | | | | 1,251 | | | | 1,265 | | | | 1.2 | |
Average Unemployment Rate | | | 5.2 | % | | | 5.4 | % | | | 5.4 | % | | | 5.3 | % | | | 5.4 | % | | | | |
Change in Consumer Price Index (Manitoba) | | | 0.6 | % | | | 0.8 | % | | | 3.0 | % | | | 1.6 | % | | | 2.2 | % | | | | |
Average Exchange Rate (C$ per U.S.$) | | | 1.1420 | | | | 1.0299 | | | | 0.9891 | | | | 0.9996 | | | | 1.0299 | | | | | |
Revenue and Expense of the Government Reporting Entity (1)
| | | | | | | | | | | | | | | | | | | | |
| | | Year Ended March 31, | |
| | | 2010 | | | 2011 | | | 2012 | | | 2013 | | | 2014 | |
| | | (In millions of dollars) | |
Total Revenue | | $ | 12,502 | | | $ | 13,069 | | | $ | 13,688 | | | $ | 13,614 | | | $ | 14,214 | |
Total Expense | | | (12,687 | ) | | | (13,250 | ) | | | (14,689 | ) | | | (14,174 | ) | | | (14,736 | ) |
| | | | | | | | | | | | | | | | | | | | |
Summary Net Income (Loss) | | $ | (185 | ) | | $ | (181 | ) | | $ | (1,001 | ) | | $ | (560 | ) | | $ | (522 | ) |
| | | | | | | | | | | | | | | | | | | | |
| (1) | See “Statement of Revenue and Expense of the Government Reporting Entity” on page 25. |
Net Direct Funded and Guaranteed Borrowings
| | | | | | | | | | | | | | | | | | | | |
| | | As of March 31, | |
| | | 2010 | | | 2011 | | | 2012 | | | 2013 | | | 2014 | |
| | | (In millions of dollars, unless otherwise indicated) | |
Consisting of | | | | | | | | | | | | | | | | | | | | |
Net Direct Funded Borrowings | | $ | 20,861 | | | $ | 22,770 | | | $ | 25,728 | | | $ | 27,699 | | | $ | 30,074 | |
Net Guaranteed Borrowings | | | 255 | | | | 165 | | | | 257 | | | | 166 | | | | 265 | |
| | | | | | | | | | | | | | | | | | | | |
| | $ | 21,116 | | | $ | 22,935 | | | $ | 25,985 | | | $ | 27,865 | | | $ | 30,339 | |
Issued for | | | | | | | | | | | | | | | | | | | | |
General Government Programs (1) | | $ | 10,884 | | | $ | 11,856 | | | $ | 13,919 | | | $ | 14,828 | | | $ | 15,720 | |
Self-Sustaining Purposes | | | 10,157 | | | | 11,018 | | | | 12,019 | | | | 13,004 | | | | 14,599 | |
Loans Payable to the Government of Canada and Government Business Enterprises (2) | | | 75 | | | | 61 | | | | 47 | | | | 33 | | | | 19 | |
| | | | | | | | | | | | | | | | | | | | |
| | $ | 21,116 | | | $ | 22,935 | | | $ | 25,985 | | | $ | 27,865 | | | $ | 30,339 | |
General Government Programs Borrowings as a Percentage of Nominal Gross Domestic Product | | | 21.5 | % | | | 22.4 | % | | | 25.2 | % | | | 25.5 | % | | | 26.1 | % |
| (1) | Total borrowings issued for General Government Programs includes borrowings for Capital Assets, Teacher’s Retirement Allowance Fund and Civil Service Superannuation Fund. |
| (2) | Canadian generally accepted accounting principles (GAAP) for the public sector as recommended by the Public Sector Accounting Board (PSAB) of the Canadian Institute of Chartered Accountants (CICA) require certain amounts owing to the Federal Government and Government Business Enterprises be recorded as loans payable. |
7
Summary Net Debt
| | | | | | | | | | | | | | | | | | | | |
| | | As of March 31, | |
| | | 2010 | | | 2011 | | | 2012 | | | 2013 | | | 2014 | |
| | | (In millions of dollars, unless otherwise indicated) | |
Total Financial Assets (1) | | $ | 9,813 | | | $ | 9,904 | | | $ | 10,623 | | | $ | 10,585 | | | $ | 10,683 | |
| | | | | | | | | | | | | | | | | | | | |
Liabilities: | | | | | | | | | | | | | | | | | | | | |
Borrowings (2) | | | 16,142 | | | | 17,150 | | | | 19,603 | | | | 20,788 | | | | 21,946 | |
Accounts Payable, accrued charges, provisions and unearned revenue | | | 3,546 | | | | 3,585 | | | | 3,936 | | | | 3,862 | | | | 4,043 | |
Pension Liability | | | 1,768 | | | | 1,731 | | | | 1,634 | | | | 1,828 | | | | 2,038 | |
| | | | | | | | | | | | | | | | | | | | |
Total Liabilities | | | 21,456 | | | | 22,466 | | | | 25,173 | | | | 26,478 | | | | 28,027 | |
| | | | | | | | | | | | | | | | | | | | |
Summary Net Debt | | $ | 11,643 | | | $ | 12,562 | | | $ | 14,550 | | | $ | 15,893 | | | $ | 17,344 | |
| | | | | | | | | | | | | | | | | | | | |
Summary Net Debt as a Percentage of Nominal Gross Domestic Product | | | 23.0 | % | | | 23.7 | % | | | 26.4 | % | | | 27.3 | % | | | 28.8 | % |
| (1) | Includes cash, accounts receivable, loans and investments, equity in Government Business Enterprises and other financial assets. |
| (2) | Excludes borrowings incurred for and repayable by The Manitoba Hydro-Electric Board. Also includes unamortized currency fluctuations. |
8
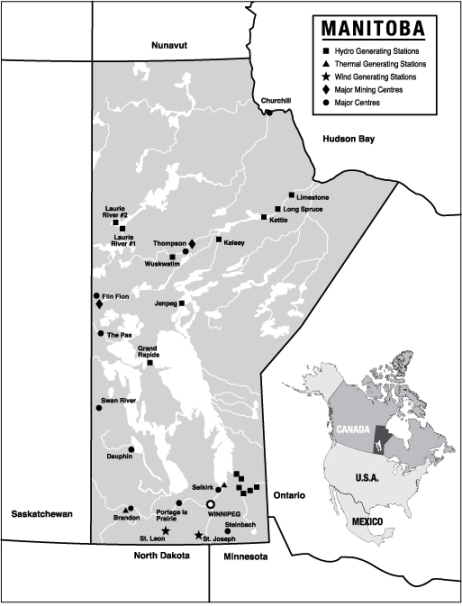
MAP OF PROVINCE OF MANITOBA
9
PROVINCE OF MANITOBA
General Information
The Province of Manitoba is located in the centre of Canada, north of the States of Minnesota and North Dakota. It is the most easterly of the three Provinces of Manitoba, Saskatchewan and Alberta, which together constitute the Prairie Region of Canada. Manitoba is bounded on the east by the Province of Ontario, on the north by Hudson Bay and the Territory of Nunavut, and on the west by the Province of Saskatchewan. The Province has 400 miles of northern coastline bordering on Hudson Bay. The only seaport in the Prairie Region is located at Churchill on Hudson Bay.
Of Manitoba’s total area of 251,000 square miles, 39,000 square miles are lakes and rivers and 163,000 square miles are lands owned by the Province. Cultivated land comprises 30,000 square miles in the southern part of the Province. The northern part of the Province, which is part of the Canadian Shield, is composed largely of timberlands and extensive areas of mineralized rock structure.
The estimated population of Manitoba on July 1, 2014 was 1,282,043, an increase of 1.3% over the prior year. Winnipeg Census Metropolitan Area had an estimated population of 771,221 in 2013. Winnipeg, the capital of the Province, has a diversified economic base with significant activity in a variety of manufacturing and service sectors. The City is also a major air, rail and truck transportation hub by virtue of its geographical position in the centre of the continent.
The second-largest city in the Province is Brandon, with an estimated population of 50,654 in 2013. Brandon, in western Manitoba, is a major supply centre for the agriculture industry, as well as an agriculture-related manufacturing centre.
Constitutional Framework
Canada consists of a federation of Provinces and Territories. A constitutional division of powers between the Federal and Provincial governments was established by the British North America Act, 1867, an Act of the Parliament of the United Kingdom. By later enactments, including the Constitution Act, 1982, the power to amend the constitution of Canada (the Constitution) was transferred to Canada.
Under the Constitution, the Provinces are assigned jurisdiction over education, municipal institutions, property and civil rights, natural resources and other matters of purely provincial or local concern. The Legislature of each Province has exclusive jurisdiction over the borrowing of money on the sole credit of that Province. The Parliament of Canada has jurisdiction over areas not assigned to the Provincial Legislatures, including such matters as aboriginal persons’ civil rights, the Federal public debt and property, the regulation of trade and commerce, currency and coinage, banks and banking, national defence, foreign affairs, postal services, interprovincial transportation and communications undertakings. The Provinces and the Parliament of Canada have shared jurisdiction over immigration, health care, environment and agriculture.
Various constitutional issues have been under discussion in Canada for a number of years. On August 20, 1998, in response to a reference from the Federal Government, the Supreme Court of Canada ruled that under the Constitution of Canada and international law, Quebec may not secede unilaterally from Canada, but that if the people of Quebec voted to secede by a clear majority vote on a clear question, the other Provinces and the Federal Government would be obliged to enter into negotiations with Quebec with respect to secession; such negotiations to be guided by constitutional principles, including federalism, democracy, constitutionalism and the rule of law, and the protection of minorities.
Provincial Government
The Provincial Government has general responsibility for the administration of all governmental activities and functions within Manitoba, other than those which are under the jurisdiction of the Federal Government. It carries out certain of these responsibilities through Provincial agencies, boards, commissions and Crown organizations. Certain other responsibilities have been delegated to cities, municipalities and semi-autonomous bodies such as school boards and regional health authorities.
The executive power in Manitoba is vested in the Lieutenant Governor acting on the advice of the Executive Council, which is responsible to the Legislative Assembly. The Lieutenant Governor is appointed by the Governor General in Council on the advice of the Prime Minister of Canada.
10
The Executive Council, which includes the Premier and Ministers of Departments of the Provincial Government, is appointed by the Lieutenant Governor, usually on the nomination of the leader of the party with the largest number of members in the Legislative Assembly. Members of the Executive Council are usually members of the Legislative Assembly.
The Legislative Assembly has 57 members who are elected for terms of four years, subject to earlier dissolution of the Assembly by the Lieutenant Governor, usually on the recommendation of the Executive Council. In the last general election of members of the Legislative Assembly, held on October 4, 2011, the New Democratic Party was elected to a majority of seats. In accordance with the Manitoba Elections Act, the next election must take place no later than October 6, 2015. However, in the event of a Federal election in the fall of 2015, the Act states that the Manitoba general election would take place on April 19, 2016.
The following table sets forth the results of the three most recent elections of the Province and the current standing of the Legislative Assembly.
| | | | | | | | | | | | | | | | |
| | | Number of Members | |
| | | 2003 | | | 2007 | | | 2011 | | | Current | |
New Democratic Party of Manitoba | | | 35 | | | | 36 | | | | 37 | | | | 35 | |
The Progressive Conservative Party of Manitoba | | | 20 | | | | 19 | | | | 19 | | | | 19 | |
Manitoba Liberal Party | | | 2 | | | | 2 | | | | 1 | | | | 1 | |
Independent | | | — | | | | — | | | | — | | | | 1 | |
Vacant | | | — | | | | — | | | | — | | | | 1 | |
| | | | | | | | | | | | | | | | |
Total | | | 57 | | | | 57 | | | | 57 | | | | 57 | |
| | | | | | | | | | | | | | | | |
ECONOMY
General
The Manitoba economy is among the most diversified economies in Canada, with 11 industries each making up more than 5% of Gross Domestic Product (GDP). Its major industries are: manufacturing; finance, insurance and real estate; construction; mining (includes oil production); transportation and storage; wholesale trade; retail trade; agriculture; information and culture; professional and scientific services; and utilities. Manitoba is also a major transportation hub, with air and rail cargo linkages and a substantial trucking industry.
Economic growth in Manitoba has been among the most stable in Canada, reflecting some of the Province’s structural characteristics, including a broad industrial base, balanced exports to interprovincial and international markets, relatively healthy household balance sheets and a stable labour market. Over the period from 2008 to 2013, Manitoba’s average annual real GDP growth rate was 1.8%, third among the Provinces and above Canada’s overall rate of 1.4%.
In 2013, economic growth remained steady despite increased uncertainty in the global environment. Manitoba’s economy remained stable and grew on strong agricultural production, business investment and consumer spending. The Manitoba Bureau of Statistics estimated that Manitoba’s real GDP expanded 2.4% in 2013, unchanged from 2012 and fourth best among the Provinces.
The following table sets forth growth rates in 2013 for key economic indicators and selected sectors of the economy for Manitoba and Canada, as well as the unemployment rate for 2013.
| | | | | | | | |
| | | Manitoba | | | Canada | |
Housing Starts | | | 3.1 | % | | | -12.5 | % |
Retail Sales | | | 3.9 | | | | 3.2 | |
Manufacturing Sales | | | 0.2 | | | | 0.3 | |
Gross Domestic Product | | | 3.7 | | | | 3.4 | |
Real Gross Domestic Product | | | 2.4 | | | | 2.0 | |
Capital Investment | | | 5.8 | | | | 1.5 | |
Foreign Merchandise Exports | | | 10.4 | | | | 3.7 | |
Farm Cash Receipts | | | 12.1 | | | | 1.1 | |
Value of Mining Production | | | 2.4 | | | | N/A | |
Consumer Price Index | | | 2.2 | | | | 0.9 | |
Employment | | | 0.5 | | | | 1.3 | |
Average Unemployment Rate | | | 5.4 | | | | 7.1 | |
11
Reflecting national and global trends, the survey of private sector forecasts, published in the fiscal 2014 Manitoba budget (the Manitoba Budget 2014) indicated that Manitoba’s real GDP was expected to expand by 2.2% in 2014. Nominal GDP is projected to increase by 3.4%, while Manitoba’s consumer price inflation is expected to average 1.8% in 2014.
With several major capital projects completed in 2013, the Statistics Canada Private and Public Investment in Canada, Intentions survey, published in February 2014 indicated that capital investment in Manitoba is expected to decrease by 1.5% to $12.4 billion in 2014, with a public capital investment decrease of 0.5% and a private capital investment decrease of 1.9%.
The following table sets forth the year-to-date growth rates, where available, for 2014 for key economic indicators and selected sectors of the economy for Manitoba and Canada, as well as the year-to-date unemployment rate.
| | | | | | | | |
| | | Manitoba | | | Canada | |
Housing Starts (June) | | | -21.2 | % | | | 2.9 | % |
Retail Sales (July) | | | 3.7 | | | | 4.9 | |
Manufacturing Sales (July) | | | 3.7 | | | | 5.5 | |
Foreign Merchandise Exports (August) | | | 10.5 | | | | 10.7 | |
Farm Cash Receipts (March) | | | -5.2 | | | | -9.6 | |
Consumer Price Index (August) | | | 2.1 | | | | 1.9 | |
Employment (September) | | | -0.5 | | | | 0.7 | |
Unemployment Rate (September) | | | 5.5 | | | | 7.0 | |
Population (July) | | | 1.3 | | | | 1.1 | |
12
The following table sets forth selected indicators of economic activity and the compound annual growth rates for Manitoba and Canada for the calendar years 2009 through 2013. In this table and throughout this document, compound annual growth rates are calculated by distributing the aggregate amount of growth during the period on the basis of a constant annual rate of growth compounded annually.
SELECTED ECONOMIC INDICATORS
| | | | | | | | | | | | | | | | | | | | | | | | |
| | | Year Ended December 31, | | | Compound Annual Growth Rate | |
| | | 2009 | | | 2010 | | | 2011 | | | 2012 | | | 2013 | | | 2009-2013 | |
| | | (In millions of dollars, unless otherwise indicated) | |
Nominal Gross Domestic Product (1) | | | | | | | | | | | | | | | | | | | | | | | | |
Manitoba | | $ | 50,683 | | | $ | 52,934 | | | $ | 55,214 | | | $ | 58,156 | | | $ | 60,315 | | | | 4.4 | % |
Canada | | | 1,567,007 | | | | 1,662,757 | | | | 1,760,011 | | | | 1,819,967 | | | | 1,881,200 | | | | 4.7 | |
Real Gross Domestic Product (2) | | | | | | | | | | | | | | | | | | | | | | | | |
Manitoba | | $ | 51,076 | | | $ | 52,378 | | | $ | 53,287 | | | $ | 54,548 | | | $ | 55,847 | | | | 2.3 | |
Change | | | -0.2 | % | | | 2.6 | % | | | 1.7 | % | | | 2.4 | % | | | 2.4 | % | | | | |
Canada | | $ | 1,541,348 | | | $ | 1,593,356 | | | $ | 1,633,604 | | | $ | 1,661,559 | | | $ | 1,695,156 | | | | 2.4 | |
Change | | | -2.7 | % | | | 3.4 | % | | | 2.5 | % | | | 1.7 | % | | | 2.0 | % | | | | |
Primary Household Income | | $ | 34,186 | | | $ | 35,072 | | | $ | 36,701 | | | $ | 38,561 | | | $ | 39,755 | | | | 3.8 | |
Primary Household Income Per Capita (Dollars) | | | 28,286 | | | | 28,726 | | | | 29,749 | | | | 30,836 | | | | 31,417 | | | | 2.7 | |
Retail Sales | | | 14,920 | | | | 15,770 | | | | 16,443 | | | | 16,652 | | | | 17,297 | | | | 3.8 | |
Capital Investment | | | 9,694 | | | | 11,218 | | | | 11,213 | | | | 11,894 | | | | 12,578 | | | | 6.7 | |
Housing Starts (Units) | | | 4,174 | | | | 5,888 | | | | 6,083 | | | | 7,242 | | | | 7,465 | | | | 15.6 | |
Change in Consumer Price Index | | | | | | | | | | | | | | | | | | | | | | | | |
Manitoba | | | 0.6 | % | | | 0.8 | % | | | 3.0 | % | | | 1.6 | % | | | 2.2 | % | | | | |
Canada | | | 0.3 | % | | | 1.8 | % | | | 2.9 | % | | | 1.5 | % | | | 0.9 | % | | | | |
Population (July 1) (in thousands) | | | | | | | | | | | | | | | | | | | | | | | | |
Manitoba | | | 1,209 | | | | 1,221 | | | | 1,234 | | | | 1,251 | | | | 1,265 | | | | 1.2 | |
Canada | | | 33,629 | | | | 34,005 | | | | 34,343 | | | | 34,752 | | | | 35,154 | | | | 1.1 | |
Employment (in thousands) | | | 608.3 | | | | 619.8 | | | | 624.5 | | | | 630.1 | | | | 633.2 | | | | 1.0 | |
Average Unemployment Rate | | | 5.2 | % | | | 5.4 | % | | | 5.4 | % | | | 5.3 | % | | | 5.4 | % | | | | |
Average exchange rate (C$ per U.S.$) | | $ | 1.1420 | | | $ | 1.0299 | | | $ | 0.9891 | | | $ | 0.9996 | | | $ | 1.0299 | | | | | |
| (2) | Expressed at market prices in 2007 chained dollars. |
Sources: Statistics Canada, Manitoba Bureau of Statistics and Manitoba Department of Finance.
Economic Structure
The Province has a balanced and diversified economy. In 2013, goods producing industries accounted for 29.8% of real GDP at basic prices. Manufacturing accounted for 9.8% of real GDP at basic prices, construction for 7.4%, mining for 6.2%, and agriculture for 3.6%. The commercial service sector accounted for 48.0% of real GDP at basic prices, and the non-commercial service sector accounted for 22.2%.
13
The following table sets forth the real gross domestic product by industry at basic prices and the compound annual growth rates for the calendar years 2009 through 2013.
REAL GROSS DOMESTIC PRODUCT AT BASIC PRICES BY INDUSTRY (1)
| | | | | | | | | | | | | | | | | | | | | | | | |
| | | Year Ended December 31, | | | Compound Annual Growth Rate | |
| | | 2009 | | | 2010 | | | 2011 | | | 2012 | | | 2013 | | | 2009-2013 | |
| | | (In millions of 2007 chained dollars) | |
Goods Producing Industries | | | | | | | | | | | | | | | | | | | | | | | | |
Manufacturing | | $ | 4,963 | | | $ | 4,912 | | | $ | 5,189 | | | $ | 5,136 | | | $ | 5,125 | | | | 0.8 | % |
Construction | | | 3,133 | | | | 3,579 | | | | 3,410 | | | | 3,726 | | | | 3,860 | | | | 5.4 | |
Mining | | | 2,501 | | | | 2,783 | | | | 3,071 | | | | 3,591 | | | | 3,214 | | | | 6.5 | |
Agriculture | | | 1,766 | | | | 1,566 | | | | 1,335 | | | | 1,571 | | | | 1,869 | | | | 1.4 | |
Utilities | | | 1,327 | | | | 1,335 | | | | 1,374 | | | | 1,307 | | | | 1,418 | | | | 1.7 | |
Forestry, Fishing and Trapping | | | 125 | | | | 116 | | | | 117 | | | | 114 | | | | 125 | | | | 0.1 | |
| | | | | | | | | | | | | | | | | | | | | | | | |
Total Goods Producing Industries | | | 13,790 | | | | 14,162 | | | | 14,297 | | | | 15,168 | | | | 15,513 | | | | 3.0 | |
| | | | | | | | | | | | | | | | | | | | | | | | |
Service Producing Industries | | | | | | | | | | | | | | | | | | | | | | | | |
Commercial Services | | | | | | | | | | | | | | | | | | | | | | | | |
Finance, Insurance and Real Estate | | | 4,451 | | | | 4,578 | | | | 4,675 | | | | 4,767 | | | | 4,943 | | | | 2.7 | |
Owner-Occupied Dwellings (2) | | | 3,743 | | | | 3,885 | | | | 4,008 | | | | 4,141 | | | | 4,281 | | | | 3.4 | |
Transportation and Storage | | | 2,883 | | | | 3,001 | | | | 3,130 | | | | 3,197 | | | | 3,255 | | | | 3.1 | |
Wholesale Trade | | | 2,766 | | | | 2,890 | | | | 2,969 | | | | 2,995 | | | | 3,053 | | | | 2.5 | |
Retail Trade | | | 2,704 | | | | 2,748 | | | | 2,823 | | | | 2,864 | | | | 2,951 | | | | 2.2 | |
Information and Culture | | | 1,529 | | | | 1,589 | | | | 1,620 | | | | 1,631 | | | | 1,635 | | | | 1.7 | |
Professional and Scientific | | | 1,388 | | | | 1,433 | | | | 1,480 | | | | 1,515 | | | | 1,534 | | | | 2.5 | |
Business Services | | | 1,075 | | | | 1,076 | | | | 1,087 | | | | 1,090 | | | | 1,125 | | | | 1.1 | |
Accommodation, Food and Beverage | | | 905 | | | | 893 | | | | 902 | | | | 930 | | | | 946 | | | | 1.1 | |
Arts, Entertainment and Recreation | | | 327 | | | | 328 | | | | 329 | | | | 324 | | | | 336 | | | | 0.7 | |
Other Services | | | 919 | | | | 909 | | | | 916 | | | | 918 | | | | 964 | | | | 1.2 | |
| | | | | | | | | | | | | | | | | | | | | | | | |
Total Commercial Services Industries | | | 22,689 | | | | 23,331 | | | | 23,939 | | | | 24,371 | | | | 25,023 | | | | 2.5 | |
| | | | | | | | | | | | | | | | | | | | | | | | |
Non-commercial Services | | | | | | | | | | | | | | | | | | | | | | | | |
Health and Social Services | | | 3,970 | | | | 4,002 | | | | 4,080 | | | | 4,138 | | | | 4,207 | | | | 1.5 | |
Education | | | 2,643 | | | | 2,682 | | | | 2,716 | | | | 2,777 | | | | 2,858 | | | | 2.0 | |
Municipal Administration | | | 1,485 | | | | 1,549 | | | | 1,586 | | | | 1,626 | | | | 1,634 | | | | 2.4 | |
Federal Administration | | | 1,544 | | | | 1,604 | | | | 1,656 | | | | 1,656 | | | | 1,627 | | | | 1.3 | |
Provincial Administration | | | 1,115 | | | | 1,159 | | | | 1,194 | | | | 1,228 | | | | 1,240 | | | | 2.7 | |
| | | | | | | | | | | | | | | | | | | | | | | | |
Total Non-commercial Services Industries | | | 10,757 | | | | 10,994 | | | | 11,231 | | | | 11,425 | | | | 11,566 | | | | 1.8 | |
| | | | | | | | | | | | | | | | | | | | | | | | |
Total Service Producing Industries | | | 33,460 | | | | 34,331 | | | | 35,171 | | | | 35,794 | | | | 36,586 | | | | 2.3 | |
| | | | | | | | | | | | | | | | | | | | | | | | |
Real Gross Domestic Product at Basic Prices (3) | | $ | 47,272 | | | $ | 48,515 | | | $ | 49,505 | | | $ | 50,955 | | | $ | 52,091 | | | | 2.5 | |
| | | | | | | | | | | | | | | | | | | | | | | | |
| (1) | Real GDP measures value added and therefore differs from the value of production or the value of shipments by industry. Real GDP at basic prices is the sum of all factor incomes from production in the Province. Real GDP at basic prices plus indirect taxes, minus subsidies, equals real GDP at market prices. Amounts in the table are expressed in 2007 chained dollars. Chained dollars is a method of adjusting real dollar amounts for inflation over time, so as to allow comparison of figures from different years. |
| (2) | Imputed rent value of Owner-Occupied Dwellings. |
| (3) | Total real GDP at basic prices does not equal the sum of real GDP by industry due to the chaining of dollars. |
Source: Statistics Canada.
14
Manufacturing. Manufacturing is the largest industrial sector of the Manitoba economy and is well-diversified, producing a wide range of consumer and industrial goods. In 2013, manufacturing accounted for 9.8% of Manitoba’s real GDP and 10.1% of employment.
The largest manufacturing industry is food manufacturing, which produces a broad range of non-durable consumer products such as processed meat and potato products, grain and oilseed milling, dairy products and industrial agricultural feed products.
The second-largest manufacturing industry is transportation equipment which comprises aerospace products and parts manufacturing and motor vehicle body and trailer manufacturing. The aerospace industry is led by three multinational firms: Boeing Canada Technology, StandardAero, and Magellan Aerospace, as well as a number of established regional and national firms. The motor vehicle body and trailer manufacturing sector specializes in the production of urban and intercity buses, fire trucks, motor homes, recreational vehicles, and trailers. A significant amount of the motor vehicle body manufacturing sector is concentrated in the two large bus manufacturers (Motor Coach Industries Int’l Inc., and New Flyer Industries Inc.); which produce coach and transit buses for the North American market.
Other notable industries within manufacturing include machinery, mainly agricultural implements; primary metals; chemicals, primarily pharmaceuticals and agricultural products; fabricated metal products, including structural steel; wood products, ranging from lumber to cabinets and millwork; printing; and electrical equipment, including industrial transformers and electronic components.
Uneven demand for Manitoba’s manufactured products kept the overall shipment receipts relatively unchanged in 2013. Total manufacturing sales from the Province increased by 0.2% to $15.4 billion in 2013, after increasing 1.1% in 2012 and by 6.0% in 2011. Overall, in 2013, Manitoba sales of durable goods declined 0.8%, while sales of non-durables advanced 1.7%.
In 2013, Manitoba manufacturing sales increased in four of seven subsectors — wood (13.4%), machinery equipment (9.9%), food (0.5%) and chemicals (0.4%) — while fabricated metals (-7.7%), printing (-2.3%) and transportation equipment (-0.8%) sales decreased.
The following table sets forth the gross value of manufacturing sales and the compound annual growth rates of the principal manufacturing industries for the calendar years 2009 through 2013.
GROSS VALUE OF MANUFACTURING SALES
| | | | | | | | | | | | | | | | | | | | | | | | |
| | | Year Ended December 31, | | | Compound Annual Growth Rate | |
| | | 2009 | | | 2010 | | | 2011 | | | 2012 | | | 2013 | | | 2009-2013 | |
| | | (In millions of dollars) | |
Non-durables | | | | | | | | | | | | | | | | | | | | | | | | |
Food | | $ | 3,748.1 | | | $ | 3,639.7 | | | $ | 3,524.4 | | | $ | 3,261.1 | | | $ | 3,277.8 | | | | -3.3 | % |
of which meat processing | | | 1,380.0 | | | | 1,383.6 | | | | 1,210.6 | | | | 890.9 | | | | 806.0 | | | | -12.6 | |
Chemicals | | | 1,035.4 | | | | 924.9 | | | | 1,221.8 | | | | 1,201.8 | | | | 1,206.7 | | | | 3.9 | |
of which pharmaceuticals | | | 329.2 | | | | 308.4 | | | | 287.3 | | | | 288.1 | | | | 300.6 | | | | -2.2 | |
Printing | | | 491.0 | | | | 442.4 | | | | 411.9 | | | | 407.2 | | | | 398.0 | | | | -5.1 | |
Other Non-durables | | | 1,465.4 | | | | 1,409.9 | | | | 1,441.8 | | | | 1,452.8 | | | | 1,545.4 | | | | 1.3 | |
Durables | | | | | | | | | | | | | | | | | | | | | | | | |
Total Transportation Equipment | | | 1,824.4 | | | | 1,811.0 | | | | 1,914.4 | | | | 2,136.3 | | | | 2,119.3 | | | | 3.8 | |
Machinery | | | 1,511.1 | | | | 1,373.5 | | | | 1,652.3 | | | | 1,796.8 | | | | 1,974.1 | | | | 6.9 | |
of which agricultural equipment | | | 985.8 | | | | 856.2 | | | | 1,029.6 | | | | 1,139.8 | | | | 1,355.8 | | | | 8.3 | |
Fabricated Metals | | | 838.9 | | | | 810.7 | | | | 867.4 | | | | 914.9 | | | | 844.1 | | | | 0.2 | |
of which architectural products | | | 316.6 | | | | 325.5 | | | | 346.9 | | | | 390.8 | | | | 401.6 | | | | 6.1 | |
Wood Products | | | 355.1 | | | | 363.2 | | | | 337.3 | | | | 398.3 | | | | 451.5 | | | | 6.2 | |
Other Durables | | | 3,400.0 | | | | 3,591.6 | | | | 3,857.2 | | | | 3,829.1 | | | | 3,611.2 | | | | 1.5 | |
| | | | | | | | | | | | | | | | | | | | | | | | |
Total | | $ | 14,669.3 | | | $ | 14,366.8 | | | $ | 15,228.7 | | | $ | 15,398.4 | | | $ | 15,428.0 | | | | 1.3 | |
| | | | | | | | | | | | | | | | | | | | | | | | |
Source: Statistics Canada.
Manufacturing shipments are strengthening in 2014. The value of manufacturing sales increased 3.7% in the first seven months of 2014 compared to the same period last year. For this period in 2014, the principal increases were a 6.5% increase in transportation equipment, an 8.9% increase in machinery, a 5.9% increase in fabricated metals and a 1.1% increase in chemicals. Decreases were in wood (-15.7%) and food (-3.1%).
15
Agriculture. Located in the Canadian Prairies, agriculture is an important contributor to the Manitoba economy. Crop and livestock agri-businesses produce a variety of commodities and have strong linkages to food manufacturing, transportation and warehousing, retail and wholesale trade, as well as finance, insurance and real estate. In 2013, the primary agriculture sector represented 3.6% of the economy, but the crop, livestock and processed food product sales represented roughly 41% of total Provincial exports. Marketed farm cash receipts were divided into 63% crops and 37% livestock and are well diversified within these major categories of production.
In 2013, crop production reached record levels due to favorable growing conditions, resulting in the largest volume of production in Manitoba’s history. Wheat production increased 31.5% and canola increased 36.7% in 2013, compared to the 2012 harvest. Corn increased 49.5% and soybeans gained 38.7%, barley added 14.1% and only oats decreased in 2013 by 1.8%.
Despite slightly lower prices and some transportation constraints on moving the record harvest to market, sales receipts from crops rose sharply in 2013. Wheat and oilseeds receipts were up in 2013, increasing 41.1% and 16.2%, respectively and barley receipts gained 37.7%. As a result, total crop receipts increased 24.8%. Manitoba’s livestock sector also showed gains in 2013, as limited supply of meat products in North America increased demand and prices. In 2013, Manitoba’s overall livestock receipts increased 3.8%.
Canadian agriculture benefits from a number of support programs designed to stabilize farm incomes and offset specific adverse conditions affecting products. Payments under these programs are reflected as direct payments. Due to increased production and improved market conditions, direct payments decreased by 25.0% in 2013 following a 1.2% decrease in 2012.
In 2013, the U.S. tightened the Country of Origin Labeling (COOL) legislation by requiring a tracking of beef and pork from birth through the meat processing and distribution channels. This new rule required segregation of livestock and product throughout the supply chain, causing increased costs and further discrimination against Canadian livestock. While the new regulations are now enforced, both Canadian and American livestock and packer organizations are challenging COOL, and the Canadian and Mexican governments have stated that they are preparing retaliatory action, which could include retaliatory tariffs, through the World Trade Organization (WTO). The Manitoba government supports the federal efforts in opposition to COOL legislation. The WTO recently ruled in favor of Canada but no remedial measures have been implemented.
The following table sets forth farm cash receipts and the compound annual growth rates for the calendar years 2009 through 2013.
FARM CASH RECEIPTS
| | | | | | | | | | | | | | | | | | | | | | | | |
| | | Year Ended December 31, | | | Compound
Annual Growth Rate | |
| | | 2009 | | | 2010 | | | 2011 | | | 2012 | | | 2013 | | | 2009-2013 | |
| | | (In millions of dollars) | |
Crops | | | | | | | | | | | | | | | | | | | | | | | | |
Oilseeds | | $ | 1,180.5 | | | $ | 1,222.9 | | | $ | 1,290.3 | | | $ | 1,267.7 | | | $ | 1,472.5 | | | | 5.7 | % |
Wheat | | | 807.2 | | | | 732.2 | | | | 780.2 | | | | 774.8 | | | | 1,092.9 | | | | 7.9 | |
Specialty and Forage | | | 205.4 | | | | 176.2 | | | | 196.2 | | | | 262.5 | | | | 317.4 | | | | 11.5 | |
Vegetables | | | 289.2 | | | | 238.1 | | | | 204.0 | | | | 213.2 | | | | 221.9 | | | | -6.4 | |
Other Grains | | | 222.2 | | | | 196.6 | | | | 187.4 | | | | 170.8 | | | | 228.6 | | | | 0.7 | |
Other (1) | | | 111.4 | | | | 117.5 | | | | -108.4 | | | | 50.7 | | | | 84.7 | | | | -6.6 | |
| | | | | | | | | | | | | | | | | | | | | | | | |
Total Crops | | | 2,815.9 | | | | 2,683.4 | | | | 2,549.7 | | | | 2,739.8 | | | | 3,418.1 | | | | 5.0 | |
| | | | | | | | | | | | | | | | | | | | | | | | |
Livestock | | | | | | | | | | | | | | | | | | | | | | | | |
Hogs | | | 718.0 | | | | 817.3 | | | | 925.8 | | | | 915.8 | | | | 952.7 | | | | 7.3 | |
Cattle and Calves | | | 438.4 | | | | 437.6 | | | | 453.3 | | | | 450.3 | | | | 487.6 | | | | 2.7 | |
Poultry and Eggs | | | 203.8 | | | | 198.0 | | | | 225.1 | | | | 245.8 | | | | 253.1 | | | | 5.6 | |
Dairy | | | 228.6 | | | | 228.1 | | | | 243.5 | | | | 248.8 | | | | 240.5 | | | | 1.3 | |
Other Livestock | | | 62.4 | | | | 66.8 | | | | 72.8 | | | | 74.2 | | | | 73.6 | | | | 4.2 | |
| | | | | | | | | | | | | | | | | | | | | | | | |
Total Livestock | | | 1,651.1 | | | | 1,747.7 | | | | 1,920.5 | | | | 1,934.9 | | | | 2,007.5 | | | | 5.0 | |
| | | | | | | | | | | | | | | | | | | | | | | | |
Direct Payments | | | 386.3 | | | | 349.4 | | | | 500.6 | | | | 494.6 | | | | 370.9 | | | | -1.0 | |
| | | | | | | | | | | | | | | | | | | | | | | | |
Total | | $ | 4,853.4 | | | $ | 4,780.5 | | | $ | 4,970.8 | | | $ | 5,169.3 | | | $ | 5,796.5 | | | | 4.5 | |
| | | | | | | | | | | | | | | | | | | | | | | | |
Net Cash Income (2) | | $ | 984.7 | | | $ | 1,004.3 | | | $ | 1,019.5 | | | $ | 865.5 | | | $ | 1,255.4 | | | | 6.3 | |
| (1) | Includes other crops and, as a negative amount, deferred payments on all crops. |
| (2) | Represents farm cash receipts less operating expenses. |
Source: Manitoba Agriculture, Food and Rural Development and Statistics Canada.
16
Overall crop production volumes are expected to decrease in 2014 from the record high 2013 levels. A late and wet spring generally delayed seeding and increased unseeded acreage in 2014. The wet and cooler weather in the fall of 2013 delayed harvest and maturation of many crops and lead to a decline in quality. Statistics Canada estimates that, as of September 2014, production of Manitoba barley (-41%), corn (-41%), wheat (-35%) and canola (-26%) will decline relative to 2013. Producers who were fortunate enough to have carryover stock from last year’s bumper crop will be able to blend and sell off premium crops, supporting overall farm cash receipts.
Manitoba’s livestock sector cash receipts are expected to increase in 2014 due to strong prices. Cattle prices were up 32% in the first half of 2014 compared to the first half of 2013, and international exports were up 15%. Hog prices were approximately 28% higher in the first half of 2014. Supply shortages of livestock in major markets should also support cash receipts for livestock producers in Manitoba.
Mining. The mining and petroleum industries make up the largest primary resource industry of Manitoba’s economy. The principal metals produced in Manitoba are nickel, copper, zinc, and gold. Other metals include silver, platinum, cobalt, selenium, cesium and tellurium. Industrial mining consists principally of sand and gravel, stone, peat moss and lime.
In 2013, capital expenditures on mining and petroleum development totaled an estimated $1.4 billion, and the industries accounted for 6.2% of provincial GDP and about 8.2% of total merchandise exports. Manitoba’s mining and petroleum industries directly employ an average of 6,300 people annually. Last year, Manitoba produced 19.3% of Canada’s zinc output, 12.6% of nickel, 5% of copper, 4% of gold and 100% of cesium.
The mining sector has been the fastest growing industrial sector in Manitoba over the last five years. From 2008 to 2013, real GDP in this sector increased 5.6% on an average annual basis. Crude oil production has more than doubled from 2008 to 2013 to $1.3 billion in real GDP, representing a 16.5% average annual gain. During the same period, metal ore production had an annual decline of 2.9% of real GDP. The expansion of the petroleum industry in the Province has broadened diversity in Manitoba’s mining sector.
In 2013, the value of mining production in Manitoba increased 2.4% to $3.1 billion, comprised of petroleum ($1.76 billion or 56.8%), metallic minerals ($1.11 billion or 35.8%) and industrial minerals ($226.8 million or 7.3%). Within the total value of metallic minerals, nickel accounts for 38.1%, gold 21.2%, copper 20.7%, zinc 14.1%, silver 2.1% and other metals 3.8%.
The value of petroleum production increased by 15% in 2013 following an 8.5% gain in 2012. In part due to lower global demand for metallic commodities, Manitoba metals production decreased by 13.6% in 2013. The value of nickel production fell by 7.4% while value of copper production fell by 28.3% in 2013. The value of zinc production increased 5.4% and industrial mining increased by 10.2%.
The following table sets forth the gross value of mining production and the compound annual growth rates for the calendar years 2009 through 2013.
GROSS VALUE OF MINING PRODUCTION
| | | | | | | | | | | | | | | | | | | | | | | | |
| | | Year Ended December 31, | | | Compound Annual Growth Rate | |
| | | 2009 | | | 2010 | | | 2011 | | | 2012 | | | 2013 | | | 2009-2013 | |
| | | (In millions of dollars) | |
Metals | | | | | | | | | | | | | | | | | | | | | | | | |
Nickel | | $ | 532.0 | | | $ | 661.7 | | | $ | 580.1 | | | $ | 457.4 | | | $ | 423.4 | | | | -5.5 | % |
Gold | | | 142.3 | | | | 177.4 | | | | 269.0 | | | | 293.8 | | | | 235.7 | | | | 13.5 | |
Copper | | | 289.7 | | | | 413.3 | | | | 476.5 | | | | 320.5 | | | | 229.7 | | | | -5.6 | |
Zinc | | | 144.2 | | | | 166.4 | | | | 160.0 | | | | 148.0 | | | | 156.0 | | | | 2.0 | |
Other Metals | | | 71.1 | | | | 55.7 | | | | 110.6 | | | | 66.1 | | | | 65.5 | | | | -2.0 | |
| | | | | | | | | | | | | | | | | | | | | | | | |
Total Metals | | | 1,179.2 | | | | 1,474.5 | | | | 1,596.1 | | | | 1,285.7 | | | | 1,110.4 | | | | -1.5 | |
Petroleum | | | 630.0 | | | | 907.9 | | | | 1,394.7 | | | | 1,513.2 | | | | 1,740.0 | | | | 28.9 | |
Industrial Mining | | | 162.2 | | | | 200.1 | | | | 197.8 | | | | 205.9 | | | | 226.8 | | | | 8.7 | |
| | | | | | | | | | | | | | | | | | | | | | | | |
Total | | $ | 1,971.4 | | | $ | 2,582.5 | | | $ | 3,188.4 | | | $ | 3,004.7 | | | $ | 3,077.2 | | | | 11.8 | |
| | | | | | | | | | | | | | | | | | | | | | | | |
Sources: Natural Resources Canada and Manitoba Department of Mineral Resources
17
Slower global demand for the commodities continues to set the tone for mining production in 2014. Through the first seven months of 2014, Manitoba’s nickel, gold and zinc production was down 5.7%, 23.3% and 12%, respectively. Over the same period, copper production was up 18.9%.
HudBay Minerals Inc. (Hudbay) officially opened two mines in Manitoba in September, 2014: Lalor Mine and Reed Lake Mine. Lalor Mine, which is located 13 kilometres west of Snow Lake, contains gold, zinc, copper and silver. The total mine construction budget was $441 million. Ore from the Lalor Mine will be processed at the refurbished Snow Lake concentrator, where capacity has been doubled to 2,700 tonnes per day (tpd).
The Reed Copper Mine, located 45 kilometres west-southwest of Snow Lake, is a joint venture between Hudbay and VMS Ventures Inc. Copper reserves associated with this mine have an estimated value of $800 million. The copper-gold mine will produce 1,300 tpd at full production, with the ore being trucked to Flin Flon for processing.
Services. Manitoba’s geographical central location in North America has been an important element in developing a diverse services producing sector. Manitoba’s location provides direct access to markets in Ontario, Western provinces and the North. To the south, the mid-continental trade corridor provides markets and development opportunities with U.S. and Mexico. To the north, the port of Churchill provides shipping lanes to Europe, the Mediterranean, Africa and Asia.
Manitoba’s service sector comprises a wide range of activities including transportation and warehousing, wholesale and retail trade, finance, tourism and personal services. These industries have expanded to account for approximately 70% of total GDP in Manitoba. From 2009 through 2013, commercial service industries accounted for 48.4% of total employment in Manitoba, and non-commercial (primarily publicly funded) services accounted for 28.5%.
Manitoba is located at the geographic centre of North America, which allows for effective service to all North American time zones. This has helped Winnipeg develop a far-reaching air, rail and truck transportation network. The transportation network is supplemented by the Winnipeg James Armstrong Richardson International Airport (the Winnipeg Airport), one of only a few 24-hour unrestricted airport terminals in Canada. As a result, the transportation and warehousing industry has grown to account for 6.2% of total economic activity and the largest commercial service industry in Manitoba.
Winnipeg is home to one of the largest trucking centres in North America, with six of Canada’s largest trucking firms headquartered in Manitoba. Winnipeg is also a major rail operations hub for both of Canada’s national railways, with intermodal marshalling yards. Three rail links to the United States allow shipments throughout North America.
Established in 2008, CentrePort Canada, an 8,000 hectare inland port, has been designated Canada’s first Foreign Trade Zone. Located next to the Winnipeg Airport, CentrePort Canada offers investment opportunities that are supported by tax incentives and other related services for a wide variety of business operations, and more than 30 companies have built new or expanded operations there. CentrePort Canada also offers direct access to tri-modal transportation, including an international trucking hub, three continental Class 1 railways, and air cargo operations.
18
Commodity trading and financial services are important components of Winnipeg’s economy. In particular, the City is the centre of Canada’s grain trade. ICE Futures Canada, located in Winnipeg, is the only commodity exchange and the second-largest futures exchange in Canada. Seven grain companies have their head office or Canadian head office in Winnipeg. Winnipeg is also the headquarters of Investors Group, one of Canada’s largest mutual fund companies, and The Great-West Life Assurance Company, one of Canada’s largest life insurance companies.
Manitoba also serves as a regional wholesale centre for retailers and primary producers distributing agricultural products, machinery and equipment, retail goods and energy-related products.
The Province has a well-developed tourism industry. As a result of Manitoba’s central location, the Province attracts national and international convention activity. Winnipeg serves as a regional entertainment centre for portions of North Dakota, Minnesota and northwestern Ontario. Manitoba also offers excellent opportunities for outdoor recreational activities and has many public and private tourism facilities. In September 2014, the opening of The Canadian Museum for Human Rights, the first national museum to be built in nearly 50 years, and the first outside of the National Capital Region (approximate cost of $351 million) added significant destination point for tourists visiting Manitoba. Tourists visiting Manitoba contributed $596 million to the Manitoba economy in 2012.
Total Exports and Imports
In 2013, total exports of Manitoba goods and services to foreign markets and other Provinces increased 4.9% to $33.4 billion. Total imports increased 3.6% to $40.9 billion. The trade deficit was $7.4 billion. Total exports were equal to 55.4% of nominal GDP, while total imports were equal to 67.7% of nominal GDP.
The following table sets forth categories of selected trade indicators for the calendar years 2009 through 2013.
SELECTED TRADE INDICATORS
| | | | | | | | | | | | | | | | | | | | |
| | | Year Ended December 31, | |
| | | 2009 | | | 2010 | | | 2011 | | | 2012 | | | 2013 | |
| | | (In millions of dollars, unless otherwise indicated) | |
Exports of Goods and Services | | | | | | | | | | | | | | | | | | | | |
International | | $ | 13,596 | | | $ | 13,774 | | | $ | 15,669 | | | $ | 15,461 | | | $ | 16,481 | |
Interprovincial | | | 15,147 | | | | 15,382 | | | | 16,161 | | | | 16,369 | | | | 16,920 | |
| | | | | | | | | | | | | | | | | | | | |
Total Exports of Goods and Services | | | 28,743 | | | | 29,156 | | | | 31,830 | | | | 31,830 | | | | 33,401 | |
| | | | | | | | | | | | | | | | | | | | |
Ratio of Total Exports to Nominal Gross Domestic Product | | | 56.7 | % | | | 55.1 | % | | | 57.6 | % | | | 54.7 | % | | | 55.4 | % |
Imports of Goods and Services | | | | | | | | | | | | | | | | | | | | |
International | | $ | 13,498 | | | $ | 14,488 | | | $ | 15,540 | | | $ | 16,403 | | | $ | 16,418 | |
Interprovincial | | | 19,353 | | | | 20,539 | | | | 22,440 | | | | 23,024 | | | | 24,432 | |
| | | | | | | | | | | | | | | | | | | | |
Total Imports of Goods and Services | | | 32,851 | | | | 35,027 | | | | 37,980 | | | | 39,427 | | | | 40,850 | |
Ratio of Total Imports to Nominal Gross Domestic Product | | | 64.8 | % | | | 66.2 | % | | | 68.8 | % | | | 67.8 | % | | | 67.7 | % |
| | | | | | | | | | | | | | | | | | | | |
Trade Balance | | $ | (4,108 | ) | | $ | (5,871 | ) | | $ | (6,150 | ) | | $ | (7,597 | ) | | $ | (7,449 | ) |
| | | | | | | | | | | | | | | | | | | | |
Sources: Statistics Canada and Manitoba Bureau of Statistics.
Goods exports accounted for 90.4% of all international exports in 2013 (90.0% in 2012), while services accounted for 9.6% in 2013 (10.0% in 2012).
Goods exports accounted for 48.4% of all interprovincial exports in 2013 (47.6% in 2012), while services accounted for 51.6% in 2013 (52.4% in 2012).
Goods imports accounted for 87.1% of all international imports in 2013 (87.3% in 2012), while services accounted for 12.9% in 2013 (12.7% in 2012).
Goods imports accounted for 48.8% of all interprovincial imports in 2013 (48.9% in 2012), while services accounted for 51.2% in 2013 (51.1% in 2012).
19
Foreign Merchandise Exports
Foreign merchandise exports from Manitoba amounted to $12.5 billion in 2013. Manufactured products accounted for 60% of the total exports while agriculture commodities accounted for 25%. Mining commodities and electricity sales accounted for 8% and 3% of total foreign merchandise exports in Manitoba, respectively. In 2013, of the total foreign merchandise exports, 67.0% were to the United States, 18.0% to Asia, 3.0% to Europe and 2.4% to Mexico.
From 2009 to 2013, total exports increased by 18.7% (representing a compound annual growth rate of 4.4%). Exports to the United States increased by 17.6% (representing a compound annual growth rate of 4.1%) and exports to all other countries increased by 20.9% (representing a compound annual growth rate of 4.9%).
A rebound in crop production helped boost total exports in 2013. A sharp increase in wheat (up 74% to $963 million) and oilseeds exports (up 52% to $1.4 billion) lifted total agricultural commodity exports by 47% in 2013 to $3.2 billion. Improvement in demand from the U.S. economy lifted manufacturing exports by 3.3% in 2013 to $7.5 billion. Generally weak demand for metal commodities lowered primary metal commodity exports by 7.4% in 2013.
The following table sets forth foreign exports by commodity and the compound annual growth rates for the calendar years 2009 through 2013.
FOREIGN EXPORTS BY COMMODITY (1)
| | | | | | | | | | | | | | | | | | | | | | | | |
| | | Year Ended December 31, | | | Compound
Annual Growth Rate | |
| | | 2009 | | | 2010 | | | 2011 | | | 2012 | | | 2013 | | | 2009-2013 | |
| | | (In millions of dollars) | |
Manufacturing | | | | | | | | | | | | | | | | | | | | |
Food | | $ | 1,385.3 | | | $ | 1,366.8 | | | $ | 1,530.0 | | | $ | 1,751.0 | | | $ | 1,907.1 | | | | 8.3 | % |
Machinery | | | 946.3 | | | | 884.1 | | | | 1,106.6 | | | | 1,132.3 | | | | 1,157.4 | | | | 5.2 | |
Transportation Equipment | | | 993.2 | | | | 836.5 | | | | 906.6 | | | | 1,060.3 | | | | 1,132.8 | | | | 3.3 | |
Primary Metals | | | 1,088.5 | | | | 1,232.8 | | | | 1,101.4 | | | | 1,054.8 | | | | 976.7 | | | | -2.7 | |
Chemicals | | | 673.1 | | | | 611.8 | | | | 908.7 | | | | 837.0 | | | | 837.1 | | | | 5.6 | |
Plastics | | | 287.5 | | | | 283.0 | | | | 277.5 | | | | 283.2 | | | | 275.9 | | | | -1.0 | |
Paper and Allied | | | 209.4 | | | | 180.7 | | | | 207.9 | | | | 215.2 | | | | 215.0 | | | | 0.7 | |
Fabricated Metal | | | 128.9 | | | | 142.6 | | | | 160.2 | | | | 176.5 | | | | 164.7 | | | | 6.3 | |
Computers and Electronics | | | 98.1 | | | | 117.7 | | | | 137.7 | | | | 151.0 | | | | 138.7 | | | | 9.0 | |
Electrical Equipment | | | 153.7 | | | | 142.5 | | | | 141.7 | | | | 139.4 | | | | 131.6 | | | | -3.8 | |
Wood Products | | | 109.6 | | | | 90.0 | | | | 92.0 | | | | 116.9 | | | | 143.5 | | | | 7.0 | |
Furniture and Fixtures | | | 99.7 | | | | 98.1 | | | | 92.7 | | | | 106.9 | | | | 120.2 | | | | 4.8 | |
Petroleum and Coal | | | 114.6 | | | | 91.7 | | | | 79.1 | | | | 84.9 | | | | 131.4 | | | | 3.5 | |
Printing and Publishing | | | 93.6 | | | | 92.4 | | | | 86.6 | | | | 81.8 | | | | 88.5 | | | | -1.4 | |
Other | | | 118.5 | | | | 105.9 | | | | 100.4 | | | | 95.8 | | | | 107.3 | | | | -2.5 | |
| | | | | | | | | | | | | | | | | | | | | | | | |
Total Manufacturing | | | 6,500.1 | | | | 6,276.9 | | | | 6,929.0 | | | | 7,287.0 | | | | 7,527.7 | | | | 3.7 | |
| | | | | | | | | | | | | | | | | | | | | | | | |
Agriculture | | | | | | | | | | | | | | | | | | | | |
Oilseeds | | | 975.3 | | | | 979.1 | | | | 1,032.2 | | | | 887.1 | | | | 1,351.7 | | | | 8.5 | |
Wheat | | | 984.8 | | | | 886.7 | | | | 921.3 | | | | 554.5 | | | | 963.2 | | | | -0.6 | |
Hogs | | | 193.0 | | | | 225.0 | | | | 226.0 | | | | 207.0 | | | | 197.7 | | | | 0.6 | |
Cattle | | | 187.9 | | | | 167.2 | | | | 101.8 | | | | 111.6 | | | | 182.8 | | | | -0.7 | |
Vegetables | | | 143.0 | | | | 173.2 | | | | 186.8 | | | | 172.6 | | | | 165.9 | | | | 3.8 | |
Other Grains | | | 191.9 | | | | 184.7 | | | | 207.6 | | | | 141.0 | | | | 220.9 | | | | 3.6 | |
Other Agriculture | | | 65.0 | | | | 55.7 | | | | 68.6 | | | | 93.4 | | | | 107.4 | | | | 13.4 | |
| | | | | | | | | | | | | | | | | | | | | | | | |
Total Agriculture | | | 2,740.9 | | | | 2,671.6 | | | | 2,744.2 | | | | 2,167.2 | | | | 3,189.6 | | | | 3.9 | |
| | | | | | | | | | | | | | | | | | | | | | | | |
Mining | | | 484.2 | | | | 521.1 | | | | 1,302.9 | | | | 1,210.8 | | | | 1,025.1 | | | | 20.6 | |
Electricity | | | 320.5 | | | | 320.4 | | | | 288.8 | | | | 267.5 | | | | 342.6 | | | | 1.7 | |
Other Primary | | | 3.7 | | | | 3.1 | | | | 4.0 | | | | 3.4 | | | | 3.5 | | | | -1.6 | |
Other | | | 517.2 | | | | 444.7 | | | | 409.2 | | | | 426.7 | | | | 452.3 | | | | -3.3 | |
| | | | | | | | | | | | | | | | | | | | | | | | |
Total | | $ | 10,566.6 | | | $ | 10,237.8 | | | $ | 11,678.1 | | | $ | 11,362.6 | | | $ | 12,540.8 | | | | 4.4 | |
| | | | | | | | | | | | | | | | | | | | | | | | |
| (1) | Most export data, except for some principal grains, are based on port-of-exit information; consequently, data for several categories do not reflect the true value of Provincial foreign exports. |
Source: Statistics Canada.
20
Total foreign exports for the first eight months of 2014 were up 10.5% compared to the first eight months of 2013. On a year-to-date basis, exports to the United States have increased by 8.4% and exports to other countries have increased by 15.0%.
Capital Investment
Manitoba has a strong profile in private and public sector capital investments. Over the last twenty years, capital spending has consistently increased in all but two years, representing the steadiest growth among the Provinces. Over the last two decades, private sector capital investment increased by 6.8% annually in Manitoba compared to 6.1% annual growth in Canada.
In 2013, capital investment increased 5.8%. The largest percentage increases in capital investment occurred in administration, support and waste management services; finance and insurance; manufacturing; utilities; other capital (including forestry, management services and information and culture); education services; retail trade; construction; agriculture; public administration; wholesale trade; and transportation and storage. The decreases in capital investment occurred in real estate; health care and social services; arts, entertainment and recreation; professional and scientific services; accommodation and food services; mining; and housing.
The following table sets forth categories of capital investment and the compound annual growth rates for the calendar years 2009 through 2013.
CAPITAL INVESTMENT
| | | | | | | | | | | | | | | | | | | | | | | | |
| | | Year Ended December 31, | | | Compound
Annual Growth Rate | |
| | | 2009 | | | 2010 | | | 2011 | | | 2012 | | | 2013 | | | 2009-2013 | |
| | | (In millions of dollars) | |
Housing | | $ | 2,246.1 | | | $ | 2,650.9 | | | $ | 2,832.2 | | | $ | 3,148.8 | | | $ | 3,131.5 | | | | 8.7 | % |
Utilities | | | 959.7 | | | | 1,633.9 | | | | 1,112.3 | | | | 1,157.0 | | | | 1,504.8 | | | | 11.9 | |
Public Administration | | | 1,400.2 | | | | 1,422.8 | | | | 1,480.7 | | | | 1,414.5 | | | | 1,493.2 | | | | 1.6 | |
Mining | | | 568.2 | | | | 1,190.4 | | | | 1,373.5 | | | | 1,497.9 | | | | 1,392.9 | | | | 25.1 | |
Transportation and Storage | | | 1,230.1 | | | | 741.3 | | | | 895.6 | | | | 713.5 | | | | 721.9 | | | | -12.5 | |
Manufacturing | | | 381.5 | | | | 357.6 | | | | 479.2 | | | | 519.6 | | | | 687.4 | | | | 15.9 | |
Agriculture | | | 555.1 | | | | 555.1 | | | | 490.6 | | | | 514.2 | | | | 554.8 | | | | 0.0 | |
Finance and Insurance | | | 396.6 | | | | 312.7 | | | | 242.0 | | | | 277.4 | | | | 507.9 | | | | 6.4 | |
Health Care and Social Services | | | 285.4 | | | | 289.6 | | | | 307.2 | | | | 478.1 | | | | 336.9 | | | | 4.2 | |
Retail Trade | | | 285.3 | | | | 263.7 | | | | 276.2 | | | | 288.8 | | | | 333.4 | | | | 4.0 | |
Education | | | 216.2 | | | | 375.6 | | | | 300.8 | | | | 241.3 | | | | 281.9 | | | | 6.9 | |
Construction | | | 131.7 | | | | 195.7 | | | | 196.9 | | | | 233.0 | | | | 260.9 | | | | 18.6 | |
Wholesale Trade | | | 165.7 | | | | 222.8 | | | | 175.9 | | | | 244.6 | | | | 258.1 | | | | 11.7 | |
Arts, Entertainment and Recreation | | | 98.1 | | | | 129.4 | | | | 164.5 | | | | 238.9 | | | | 183.3 | | | | 16.9 | |
Real Estate | | | 232.5 | | | | 267.3 | | | | 260.0 | | | | 251.5 | | | | 166.6 | | | | -8.0 | |
Accommodation and Food Services | | | 75.6 | | | | 63.9 | | | | 96.0 | | | | 139.1 | | | | 114.8 | | | | 11.0 | |
Professional and Scientific | | | 73.9 | | | | 80.4 | | | | 91.0 | | | | 96.5 | | | | 77.0 | | | | 1.0 | |
Administration, Support, and Waste Management Services | | | 44.4 | | | | 45.2 | | | | 42.0 | | | | 29.5 | | | | 57.1 | | | | 6.5 | |
Other | | | 347.9 | | | | 419.3 | | | | 396.7 | | | | 409.3 | | | | 513.2 | | | | 10.2 | |
| | | | | | | | | | | | | | | | | | | | | | | | |
Total | | $ | 9,694.3 | | | $ | 11,217.6 | | | $ | 11,213.3 | | | $ | 11,893.5 | | | $ | 12,577.6 | | | | 6.7 | |
| | | | | | | | | | | | | | | | | | | | | | | | |
Private | | $ | 6,657.4 | | | $ | 7,635.2 | | | $ | 7,849.8 | | | $ | 8,304.9 | | | $ | 8,690.7 | | | | 6.9 | |
Public | | $ | 3,036.9 | | | $ | 3,582.3 | | | $ | 3,363.4 | | | $ | 3,588.6 | | | $ | 3,886.8 | | | | 6.4 | |
Source: Statistics Canada.
21
The Statistics Canada Private and Public Investment in Canada, Intentions survey, published in February 2014, indicated that capital investment in Manitoba was expected to decrease by 1.5% in 2014. Private capital investment was expected to decrease by 1.9% and public investment to decrease by 0.5%. The largest increases were expected to occur in administration, support and waste management services; real estate; other capital (including forestry, management services and information and culture); professional and scientific services; wholesale trade; public administration; construction; and agriculture. The largest decreases were expected to occur in finance and insurance; arts, entertainment and recreation; health care and social services; accommodation and food services; housing; mining; education services; transportation and storage; retail trade; and utilities.
Labour Force
In 2013, employment increased 0.5% compared to 2012, with growth occurring in: agriculture; forestry, fishing, mining, oil and gas; information, culture and recreation; utilities; construction; transportation and warehousing; accommodation and food services; educational services; other services; and manufacturing. Declines were recorded in business, building and other support services; finance, insurance, real estate and leasing; public administration; professional, scientific and technical services; trade; and health care and social assistance. In 2013, the average unemployment rate in Manitoba was 5.4%, the third-lowest of any Province in Canada and significantly lower than Canada’s rate of 7.1%.
The following table sets forth selected labour force statistics for Manitoba and Canada for the calendar years 2009 through 2013.
LABOUR FORCE
| | | | | | | | | | | | | | | | | | | | |
| | | Annual Averages | |
| | | 2009 | | | 2010 | | | 2011 | | | 2012 | | | 2013 | |
Labour Force (in thousands) | | | 641.8 | | | | 654.9 | | | | 660.2 | | | | 665.4 | | | | 669.0 | |
Employment (in thousands) | | | 608.3 | | | | 619.8 | | | | 624.5 | | | | 630.1 | | | | 633.2 | |
Participation Rate (%) | | | 69.1 | | | | 69.6 | | | | 69.3 | | | | 69.1 | | | | 68.7 | |
Participation Rate (Canada) (%) | | | 67.1 | | | | 67.0 | | | | 66.8 | | | | 66.7 | | | | 66.5 | |
Unemployment Rate (%) | | | 5.2 | | | | 5.4 | | | | 5.4 | | | | 5.3 | | | | 5.4 | |
Unemployment Rate (Canada) (%) | | | 8.3 | | | | 8.0 | | | | 7.4 | | | | 7.2 | | | | 7.1 | |
Source: Statistics Canada.
In the first nine months of 2014, seasonally adjusted employment in Manitoba decreased 0.5% compared to the same period for 2013, averaging 631,300 jobs. Employment increases were recorded in utilities; educational services; health care and social assistance; finance, insurance, real estate and leasing; trade; manufacturing; and public administration. Declines were recorded in agriculture; information, culture and recreation; professional, scientific and other technical services; forestry, fishing, mining, oil and gas; accommodation and food services; other services; construction; business building and other support services; and transportation and warehousing.
In the first nine months of 2014, the seasonally adjusted unemployment rate in Manitoba averaged 5.5%, up from 5.3% in the same period in 2013. In the first nine months of 2014, the seasonally adjusted unemployment rate in Canada averaged 7.0%. Manitoba’s seasonally adjusted labour force participation rate over the first nine months of 2014 averaged 67.8%, down from 68.9% in the same period in 2013.
22
Energy
Refined petroleum and natural gas provided 46% and 25%, respectively, of the Province’s total energy needs in 2012, while 28% was provided by hydro-electric energy generated in the Province. For more information on hydro-electric energy generated in the Province, see “The Manitoba Hydro-Electric Board.”
GOVERNMENT FINANCES
Under the Constitution, the Province has the power to impose direct taxation within the Province in order to raise revenue for Provincial purposes. It also has exclusive jurisdiction over the borrowing of money on the sole credit of the Province.
Under the statutes of the Province, all public money is paid to the credit of the Minister of Finance and deposited into one Consolidated Fund of the Province. Money necessary to carry out the operations of the Province in each fiscal year is voted by the Legislative Assembly, with the exception of those expenses for which provision has already been made by special legislation, such as amounts required to service the debt of the Province and to fulfill guarantees made by the Province. In addition, the Lieutenant Governor in Council may, when the Legislative Assembly is not in session, authorize expenditures that are urgently and immediately required for the public good through the issuance of special warrants.
The Summary Financial Statements have been prepared in accordance with Canadian public sector accounting standards. The accounts and financial statements of the Province are audited by the Auditor General who is responsible to the Legislative Assembly and is required to make a report to the Legislative Assembly with respect to each fiscal year.
The Summary Financial Statements reflect the financial results of the Government Reporting Entity (GRE), which consists of the Consolidated Fund plus Crown Organizations and GBEs. GBEs are entities whose principal activity is carrying on a business, including The Manitoba Hydro-Electric Board (Manitoba Hydro), Deposit Guarantee Corporation of Manitoba, Manitoba Public Insurance Corporation, Workers Compensation Board, Manitoba Liquor & Lotteries Corporation. These financial statements consolidate the financial statements of all of the organizations comprising the GRE, except for GBEs, which are accounted for by the modified equity method of accounting. The purpose of the Summary Financial Statements is to report fully the nature and extent of the financial affairs and resources for which the Government is ultimately responsible.
23
In order to be considered a part of the GRE for the Summary Financial Statements, an organization must be controlled by the Government. Control, as defined by the Public Sector Accounting Board (PSAB), is the power to govern the financial and operating policies of another organization with expected benefits or the risk of loss from the other organization’s activities. Crown organizations are consolidated after adjusting their accounting policies to a basis consistent with the accounting policies of the GRE. Inter-entity accounts and transactions are eliminated upon consolidation, except for retail sales tax. Where the fiscal year-end dates of Crown organizations are not the same as that of the GRE and their transactions significantly affect the financial statements, their financial results are updated to March 31.
GBEs maintain their accounts in accordance with accounting principles which are generally accepted for business enterprises and which are considered appropriate to their individual objectives and circumstances. Effective January 1, 2011 all Government Business Enterprises (GBEs), except Manitoba Hydro, adopted International Financial Reporting Standards (IFRS), as issued by the International Accounting Standards Board. IFRS standards are not required to be adopted by senior governments. As an entity reporting their operation under rate regulated accounting, Manitoba Hydro was eligible for an extension to January 1, 2015 for the adoption of IFRS.
GBEs derive the majority of their revenue from sources outside the GRE. They are reported in the Summary Financial Statements using the modified equity method of accounting. Under the modified equity method, the original investment of the Province in GBEs is initially recorded at cost and adjusted annually to include the net income or losses and other net equity changes of these enterprises, without adjusting their accounting policies to a basis consistent with that of the GRE. Inter-entity accounts and transactions with GBEs are not eliminated. Supplementary financial information describing the financial position and results of operations of these enterprises is presented in Table II of Supplementary Information.
The Consolidated Fund of the Province reflects, on a combined basis, the transactions and balances of the Core Government (which records the operations of government departments and programs), the Trust Fund (which records the trust administration function) and other special funds of the Province, such as the Fiscal Stabilization Account. This account was formerly known as the Fiscal Stabilization Fund. The Fiscal Stabilization Account serves to assist in stabilizing the fiscal position by supporting core government operations in a fiscal year or to repay debt. It is also available for special initiatives. Transfers to and from the Fiscal Stabilization Account are determined by the Minister of Finance, subject to approval by the Lieutenant Governor in Council. At March 31, 2014, the Fiscal Stabilization Account had $274.5 million in liquid assets (2013 —$374.5 million).
The revenues and expenses of the Provincial Government are recorded in the Summary Financial Statements on an accrual basis with the following specific accounting policies:
| | a) | Government of Canada Receipts — Transfer payments from the Government of Canada include all accruals determined for current year entitlements that have been authorized by March 31, for which any eligibility criteria have been met and that can be reasonably estimated. |
| | b) | Taxes — Revenues from individual and corporation income tax are accrued in the year earned based upon estimates made by the Government of Canada using statistical models. These revenues are recorded at estimated amounts after considering adjustments for tax concessions and other adjustments from the Government of Canada. Transfers made through the tax system are recognized as an expense. |
Revenues from other taxes are accrued in the year earned and are recorded net of tax concessions and other adjustments. Transfers made through the tax system are recognized as an expense.
| | c) | Other Revenue — all other revenues are recorded on an accrual basis, except when the accruals cannot be determined with a reasonable degree of certainty or when their estimation is impracticable. |
| | d) | Expenses — all expenses incurred for goods and services received are recorded on an accrual basis. |
Expenses include provisional amounts recorded in anticipation of costs which are quantifiable and have been identified as obligations.
Government transfers are recognized as expenses in the period in which the transaction is authorized and any eligibility criteria are met and the amounts can be reasonably estimated.
The Summary Financial Statements do not include revenue and expenses of local government bodies such as municipalities which carry out certain responsibilities delegated by the Province, except that Provincial assistance provided to those entities is included in the accounts of the Province as an expense.
24
STATEMENT OF REVENUE AND EXPENSE
OF THE GOVERNMENT REPORTING ENTITY (1)
| | | | | | | | | | | | | | | | | | | | |
| | | Year Ended March 31, | |
| | | 2010 | | | 2011 | | | 2012 | | | 2013 | | | 2014 | |
| | | (In millions of dollars) | |
Revenue | | | | | | | | | | | | | | | | | | | | |
Income taxes: | | | | | | | | | | | | | | | | | | | | |
Corporation income tax | | $ | 274 | | | $ | 349 | | | $ | 441 | | | $ | 456 | | | $ | 468 | |
Individual income tax | | | 2,400 | | | | 2,589 | | | | 2,697 | | | | 2,846 | | | | 2,978 | |
Other taxes: | | | | | | | | | | | | | | | | | | | | |
Retail sales tax | | | 1,527 | | | | 1,576 | | | | 1,658 | | | | 1,767 | | | | 2,028 | |
Fuel taxes | | | 255 | | | | 256 | | | | 269 | | | | 332 | | | | 329 | |
Levy for health and education | | | 264 | | | | 269 | | | | 292 | | | | 296 | | | | 315 | |
Mining Tax | | | 10 | | | | 42 | | | | 62 | | | | 38 | | | | 8 | |
Education property tax | | | 533 | | | | 545 | | | | 554 | | | | 380 | | | | 434 | |
Other taxes | | | 514 | | | | 531 | | | | 515 | | | | 552 | | | | 609 | |
Fees and other revenue | | | 1,792 | | | | 1,828 | | | | 1,906 | | | | 2,013 | | | | 2,178 | |
Federal transfers: | | | | | | | | | | | | | | | | | | | | |
Equalization | | | 2,063 | | | | 2,001 | | | | 1,942 | | | | 1,872 | | | | 1,799 | |
Canada Health and Canada Social Transfers | | | 1,302 | | | | 1,365 | | | | 1,417 | | | | 1,487 | | | | 1,524 | |
Shared cost and other | | | 559 | | | | 681 | | | | 973 | | | | 594 | | | | 519 | |
Net income from GBEs | | | 789 | | | | 807 | | | | 713 | | | | 739 | | | | 783 | |
Sinking funds and other investments earnings | | | 220 | | | | 230 | | | | 249 | | | | 242 | | | | 242 | |
| | | | | | | | | | | | | | | | | | | | |
Total Revenue | | | 12,502 | | | | 13,069 | | | | 13,688 | | | | 13,614 | | | | 14,214 | |
| | | | | | | | | | | | | | | | | | | | |
Expense (2) | | | | | | | | | | | | | | | | | | | | |
Health | | | 4,831 | | | | 5,044 | | | | 5,328 | | | | 5,454 | | | | 5,706 | |
Education | | | 3,125 | | | | 3,218 | | | | 3,389 | | | | 3,339 | | | | 3,562 | |
Family Services | | | 1,295 | | | | 978 | | | | 1,013 | | | | 1,035 | | | | 1,074 | |
Community, Economic and Resource Development | | | 1,780 | | | | 2,367 | | | | 2,734 | | | | 2,423 | | | | 2,415 | |
Justice and Other Government | | | 900 | | | | 870 | | | | 1,410 | | | | 1,084 | | | | 1,158 | |
Debt Servicing | | | 756 | | | | 773 | | | | 815 | | | | 839 | | | | 821 | |
| | | | | | | | | | | | | | | | | | | | |
Total Expense | | | 12,687 | | | | 13,250 | | | | 14,689 | | | | 14,174 | | | | 14,736 | |
| | | | | | | | | | | | | | | | | | | | |
Net Income for the year | | $ | (185 | ) | | $ | (181 | ) | | $ | (1,001 | ) | | $ | (560 | ) | | $ | (522 | ) |
| | | | | | | | | | | | | | | | | | | | |
| (1) | Certain comparative amounts are restated to conform to the 2014 presentation. |
| (2) | Expenses prior to 2012/13 have not been restated to reflect a reorganization undertaken during the fiscal year 2014. |
Budget
The Provincial Government prepares a budget each fiscal year, which estimates revenue and expenses for both Core Government operations and on a summary financial basis. In October 2008, the Province enacted The Balanced Budget, Fiscal Management and Taxpayer Accountability Act (the Balanced Budget Act), which reflected the shift to summary budgets and financial reporting.
Under the Balanced Budget Act, each year the Government is required to achieve a positive balance on a four-year moving average basis, calculated as follows:
| | • | | net income or loss as shown in the audited summary financial statements for the GRE for the fiscal year; and |
| | • | | plus the net income or less the net loss for each of the three preceding fiscal years as shown in the audited summary financial statements for the GRE for those years. |
25
Adjustments affecting the calculation of balance are permitted in a fiscal year in the case of war, disaster, unusual weather or climate conditions, or certain unanticipated actions taken by other levels of government or regulatory bodies. Proceeds from the sale of a Crown corporation may not be used in determining whether there is a positive or negative balance for a fiscal year. Transfers to and from the Fiscal Stabilization Account do not affect the calculation of balance.
The Balanced Budget Act required a minimum annual payment to the Debt Retirement Account starting in fiscal year 2012, of $110.5 million plus 7% of all debt repayments made after 2011, for the purpose of retiring the net general purpose debt and pension liability of the Province. The Balanced Budget Act also limits tax increases by requiring the approval of voters in a referendum before the rates of four major taxes (individual income tax, corporation income tax, retail sales tax, and the levy for health and education) may be increased. In the fiscal year ended March 31, 2009, these four taxes accounted for 46% of Core Government revenue; 72% of total summary own-source revenue; and 36% of total summary revenue. Exceptions are allowed for revenue-neutral rebalancing of Provincial tax rates, and for offsetting changes in Federal and Provincial taxes.
In December 2013, the Balanced Budget Act was amended to suspend, until after March 31, 2016, the requirement that the Minister table a budget that projects a positive balance, as defined under the Balanced Budget Act, and to suspend annual transfers to the Debt Retirement Account until fiscal 2016.
The tax rate under The Retail Sales Tax Act has been temporarily increased from 7% to 8% for the 10-year period from July 1, 2013, to June 30, 2023 to maximize the potential of the 10-year Building Canada Plan announced in the 2013 Federal budget. The Balanced Budget Act (as amended) exempts from referendum requirement this increase in rate of tax under the Retail Sales Tax.
The Balanced Budget Act requires that the Government release a summary budget for the GRE by April 30 of each year, except in unusual circumstances or, if at any time in March or April, the legislature is dissolved. Moreover, when the budget is released, it must be accompanied by a financial management strategy that includes:
| | • | | The Government’s objectives for measurable outcomes for that fiscal year and future years; and |
| | • | | A summary of the Government’s projected revenue and expenditures as set out in the main estimates. |
After the end of the fiscal year, the Minister of Finance must release a report that compares the results for the year with the objectives for that year.
The Financial Management Strategy included in the fiscal 2015 budget sets out the Government’s priorities for fiscal management, as well as measurable outcomes, as follows:
| | | | |
Financial Management Priority | | | | Measurable Outcomes |
Transparency, Accountability and Fiscal Discipline | | • | | Summary Budget Outlook |
| | |
| | • | | Maintaining accountability for Core Government program expenditure and revenue |
| | |
Stable and Affordable Government | | • | | Credit Ratings |
| | |
| | • | | Expenditure as a percentage of Gross Domestic Product (GDP) |
| | |
| | • | | Sustainable Management of Public Resources |
| | |
Managing Debt | | • | | Debt retirement |
| | |
| | • | | Net Debt to GDP ratio |
| | |
Five-Year Core Infrastructure Plan | | • | | Core Infrastructure Investment |
These priorities will be reported on at the time the Public Accounts for the year are released.
26
The following table sets forth the budgeted financing requirement for the GRE for fiscal year 2015:
BUDGETED FINANCING REQUIREMENT
(In millions of dollars)
| | | | |
Refinancing: | | | | |
General Government Programs | | $ | 926 | |
Manitoba Hydro | | | 900 | |
General Government Capital Investments | | | 476 | |
Other Self-Sustaining Programs | | | 96 | |
New Cash Requirements: | | | | |
Manitoba Hydro | | | 1,500 | |
General Government Capital Investments | | | 418 | |
General Government Programs | | | 324 | |
Other Self-Sustaining Programs | | | 126 | |
| | | | |
Total Provincial Financing Requirement | | $ | 4,766 | |
| | | | |
In the fiscal year 2013, the Province recorded a net loss of $522 million, which was $4 million greater than anticipated by the fiscal 2013 budget.
The total summary revenue was $14,214 million, or $5 million higher than the budget estimate of $14,209 million.
Summary expenses were $14,736 million, an increase of $9 million from the budget estimate of $14,727 million.
The Summary Budget for the fiscal year ending March 31, 2015 was presented to the Legislative Assembly on March 6, 2014.
The following discussion of Core Government Revenues and Expenses reflects budgeted and actual amounts used in the budgetary process of the Legislative Assembly, which may differ from corresponding amounts reflected in the Summary Financial Statements.
Core Government Revenue
Provincial Source Revenues. Of its Total Revenue budgeted for the fiscal year ending March 31, 2015 of $11,944.7 million, the Province expects to derive $8,415.3 million, or about 70.5%, from Provincial sources. In the fiscal year ending March 31, 2014, Total Revenue was $11,555.1 million, of which $8,030.1 million, or about 69.5%, was derived from Provincial sources.
Taxation in Canada is constitutionally divided between the Federal and Provincial Governments. The Federal Government collects taxes partly for its own expenditures and partly for distribution to the Provinces. The Federal Government has authority to apply both direct and indirect taxes while Provinces may apply direct taxes only. Local governments derive their taxing powers from the Provinces.
27
Personal income taxes are levied by both the Federal and Provincial Governments. The Province has a personal income tax with 3 brackets and rates ranging up to 17.4% applied directly to taxable income, subject to certain tax credits. The personal income tax is collected on the Province’s behalf by the Federal Government. Personal income tax revenue in the fiscal year ending March 31, 2015 is budgeted at $3,101.9 million, up from $2,978.3 million received in the previous fiscal year.
The Province levies a tax on the taxable income of corporations. The tax rate on taxable income of small businesses (with active business income of less than $425,000 in 2014) is 0.0%. The rate for large businesses is 12.0%. Corporation income tax revenue for the fiscal year ending March 31, 2015 is budgeted at $530.1 million, up from $467.8 million received in the previous fiscal year.
The Province applies a tax at a general rate of 8% (increased from 7% on July 1, 2013) on retail sales of most tangible personal property and some services, with major exemptions in respect of food for home consumption, domestic heating, children’s clothing under $150 per item, custom software, most farm machinery and prescription drugs. Retail sales tax revenue in the fiscal year ending March 31, 2015 is budgeted at $2,207.0 million, up from $2,025.0 million received in the previous fiscal year.
The Province levies a tax of 14.0¢ per litre on gasoline and motive fuels. For the fiscal year ending March 31, 2015, the revenues from gasoline and motive fuel taxes are budgeted at $326.1 million, up from $322.3 million received in the previous fiscal year. There is also a tobacco tax of 29.0¢ per cigarette and 28.0¢ per gram of fine-cut tobacco. Total tobacco tax revenue for the fiscal year ending March 31, 2015 is budgeted at $286.3 million, up from $272.1 million received in the previous fiscal year.
A levy for financing health and post-secondary education is applied to total compensation paid to employees by Manitoba employers. Employers with annual payrolls under $1.25 million are exempt and those with payrolls between $1.25 million and $2.5 million are subject to reduced rates. The tax rate on taxable payroll is 2.15%. For the fiscal year ending March 31, 2015, the levy is budgeted to yield $446.9 million, up from $426.9 million received in the previous fiscal year.
Federal Government Transfers: Total transfer payments from the Government of Canada are budgeted to provide $3,529.4 million, or approximately 29.5%, of the Province’s total core revenue in the fiscal year ending March 31, 2015. This compares to $3,525.0 million, or approximately 30.5%, received in the previous fiscal year.
Unconditional transfers, primarily grants under a Federally-funded Provincial fiscal equalization formula and cash payments under the Canada Health Transfer (CHT) and Canada Social Transfer (CST), are budgeted to account for $3,359.4 million, or approximately 28.1% of total core revenue in 2014/15. This compares to $3,324.5 million or 28.8% received in the previous fiscal year (including $6.9 million in Federal Total Transfer Protection (TTP) payments paid through the Equalization Program). Conditional transfers, consisting mainly of Federal payments in respect of cost-shared programs for social and economic development, account for the remainder of the Government of Canada transfers.
Manitoba’s combined 2013/14 CHT and CST transfers were down $38.3 million from budget due to an unanticipated Statistics Canada Census 2011-based revision to previous population estimates for 2010/11, 2011/12, 2012/13 and 2013/14.
Equalization and the CHT and CST, the “major transfers,” are authorized by the Federal-Provincial Fiscal Arrangements Act. TTP ensured no Province received less in combined major transfers than it did in the prior year. It was implemented as a temporary measure in 2010/11 to assist Provinces in dealing with the challenges of the recession and was extended for 2011/12, 2012/13 and again for 2013/14 to help Provinces transition through current economic challenges. TTP was not extended into 2014/15.
The Government of Canada’s Equalization Program is intended to ensure Provincial Governments have sufficient revenue to offer reasonably comparable public services at reasonably comparable levels of taxation. Formula-driven, it determines how much revenue each Province could raise on its own at typical levels of taxation and any shortfall relative to a 10-Province “standard” is paid out in Equalization. Entitlements are announced in advance of the fiscal payment year and are not subject to revision. The Province budgeted $1,749.9 million in Equalization revenue in the fiscal year ending March 31, 2015, down from $1,799.2 million (including TTP) received in the previous fiscal year.
28
The Equalization program includes a growth ceiling in 2009/10 to ensure annual growth in total program payments does not exceed that of the economy as measured by a three-year moving average of national nominal Gross Domestic Product. The ceiling, combined with a relative strengthening in the Provincial economy, has reduced Manitoba’s Equalization entitlement in recent years, from $2,063.4 million in 2009/10 to $1,749.9 million in 2014/15.
The CHT is the primary Federal Transfer to Provinces and Territories in support of health care. Total CHT cash support for all Provinces and Territories will reach $32.1 billion in 2014/15. A 6% annual escalator had applied to the CHT, ensuring predictable and growing support for health care. The CHT moved to an equal per capita cash allocation in 2014/15. Previously, the CHT was allocated to Provinces and Territories using a formula that took into account legislated cash levels, population and the equalized value of transferred tax points. The Province has budgeted $1,156.3 million in CHT revenue in 2014/15, up from $1,089.9 million received in the previous fiscal year.
The CST supports Provinces and Territories in the provision of post-secondary education, social assistance and social services, including early childhood development and childcare. CST is based on an equal per capita cash allocation across all Provinces and Territories and includes a 3% annual escalator. The Province has budgeted $453.2 million in CST revenue in 2014/15, up from $435.4 million received in the previous fiscal year.
The Federal-Provincial Fiscal Arrangements Act has a Provincial revenue stabilization provision that provides for Federal grants and interest-free loans if revenue from a Province’s own source revenues plus Equalization falls below 95% of the previous year’s level, excluding variations in natural resource revenue. The Province is not expected to receive stabilization funding in 2014/15.
Core Government Expenses
Health. For the fiscal year ending March 31, 2015, expenditure for Health and Healthy Living is budgeted at $5,382.1 million, an increase of 2.1% over the prior year’s budget. This is the largest single expense category and represents 38.3% of the Province’s total budgeted Expenditure Estimate. Health includes the Universal Health Benefits Plan under which hospital and medical care is available to Manitoba residents without charge. Under this Plan, the Province pays all the operating costs as well as the debt servicing costs of approved capital construction for hospitals and personal care institutions.
Education. Education expenditure for the fiscal year ending March 31, 2015 is budgeted at $2,430.3 million, an increase of 2.6% over the prior year, and represents 25.7% of Manitoba’s total budgeted Expenditure Estimate. The major portion of this expense, amounting to $1,775.3 million, is for providing direct financial support to local school divisions for the approved cost of public schools in the Province, as well as the debt servicing costs of approved capital construction for schools. The additional funds required to operate the public schools, plus any special projects undertaken by the school divisions, are derived from a property tax on the residents of the divisions.
This expenditure also includes financial support for the four universities and the three community colleges in the Province, which is budgeted to amount to $655.0 million for the fiscal year ending March 31, 2015.
Family Services. The Province’s social security program provides income security, financial assistance to the elderly, rehabilitation services for physically and mentally handicapped persons and child welfare services. This category represents 7.4% of the Province’s total budgeted Expenditure Estimate. For the fiscal year ending March 31, 2015, expenditure for Family Services is budgeted at $1,173.0 million, an increase of 3.9% over the prior year’s budget.
Community, Economic and Resource Development. Expenditure on Community, Economic and Resource Development is budgeted at $2,231.1 million for the fiscal year ending March 31, 2015, an increase of 2.3% over the prior year’s budget. This represents 16.3% of Manitoba’s total budgeted Expenditure Estimate. The largest item in this category is Infrastructure and Transportation, amounting to $660.8 million.
29
Expenditure for Provincial assistance to municipal governments is budgeted at $423.3 million for the fiscal year ending March 31, 2015 and includes $313.4 million to The City of Winnipeg and $16.6 million for grants in lieu of taxes to municipalities.
Justice and Other Government. Expenditure for Justice and Other Government is budgeted at $892.6 million, a decrease of 2.8% over the prior year’s budget and represents 6.5% of the Province’s total budgeted Expenditure Estimate.
The Province also provides property and cost-of-living tax credits to residents of Manitoba. These credits are reflected as expenditure under Justice and Other Expenditures, and are budgeted at $371.4 million for the fiscal year ending March 31, 2015.
Debt Servicing. The net cost of servicing total direct public borrowings after deducting recoveries from Crown organizations and GBEs, investment earnings and interest recovery on departments’ capital asset purchases is budgeted at $230.0 million. For the fiscal year ending March 31, 2015, the gross interest expense for the Province’s direct funded borrowings is estimated to be $1,428.8 million, which is reduced by $58.2 million of interest income, $854.7 million on borrowings in respect of which interest is recovered from Crown organizations and other government entities and $285.9 million in interest recovery from other Provincial departments in respect of teachers’ pension funding and departments’ capital asset purchases.
CROWN ORGANIZATIONS AND GOVERNMENT BUSINESS ENTERPRISES
The Province provides certain services and promotes certain types of social and economic development through Crown organizations and GBEs (collectively, Crown organizations) which have access to financial assistance from the Province through advances, equity investments, guaranteed borrowings, loans and grants. Crown organizations such as Manitoba Hydro are intended to operate on a commercial basis, rather than being subsidized by the Province. The Province also operates other Crown organizations, such as The Manitoba Agricultural Services Corporation and The Manitoba Housing and Renewal Corporation, on a partially subsidized basis with funds provided from departmental appropriations. With the exception of the Manitoba Liquor & Lotteries Corporation, the profits of which are transferred to the Province, Crown organizations generally retain their profits for their own requirements. Loans, advances, investments and grants are made as required for the operations of the organizations pursuant to appropriations in the Provincial Budget or through specific enactment by the Legislative Assembly.
A valuation allowance is provided in the accounts of the Province for decreases in the values of loans and advances made to Crown organizations, and is adjusted annually for changes that occur in the estimated realizable value of these assets, based on financial results applicable to the most recent fiscal year completed prior to April 1. The allowance is intended to provide for any accumulated operating and capital deficits of Crown organizations. This allowance as at March 31, 2014, was $247.6 million in respect of the Province’s total loans and advances to its Crown organizations in the amount of $13,148 million at such date.
The following table summarizes the loans and advances of the Province’s principal Crown organizations for the years 2010 through 2014 and the allowance for losses on realization of assets as at March 31, 2014:
LOANS AND ADVANCES TO
CROWN ORGANIZATIONS AND GOVERNMENT BUSINESS ENTERPRISES (1)
| | | | | | | | | | | | | | | | | | | | | | | | |
| | | As at March 31, | |
| | | 2010 | | | 2011 | | | 2012 | | | 2013 | | | 2014 | | | 2014
Valuation
Allowance | |
| | | (In thousands of dollars) | |
The Manitoba Hydro-Electric Board (2) | | $ | 8,288,456 | | | $ | 8,467,534 | | | $ | 9,095,362 | | | $ | 9,775,351 | | | $ | 10,683,355 | | | $ | — | |
The Manitoba Housing and Renewal Corporation | | | 378,678 | | | | 423,169 | | | | 517,123 | | | | 632,577 | | | | 846,426 | | | | 183,699 | |
The Manitoba Agricultural Services Corporation | | | 339,372 | | | | 334,748 | | | | 345,109 | | | | 387,071 | | | | 438,108 | | | | 21,158 | |
Manitoba Liquor & Lotteries Corporation | | | 159,851 | | | | 152,229 | | | | 176,949 | | | | 241,321 | | | | 283,310 | | | | — | |
Manitoba Development Corporation | | | 125,525 | | | | 119,460 | | | | 133,871 | | | | 114,442 | | | | 102,894 | | | | 35,158 | |
Other (3) | | | 459,870 | | | | 573,663 | | | | 722,444 | | | | 827,130 | | | | 893,955 | | | | 7,620 | |
| | | | | | | | | | | | | | | | | | | | | | | | |
Total | | $ | 9,751,752 | | | $ | 10,070,803 | | | $ | 10,990,858 | | | $ | 11,977,892 | | | $ | 13,148,049 | | | $ | 247,635 | |
| | | | | | | | | | | | | | | | | | | | | | | | |
| (1) | Crown organizations also have debt not guaranteed by the Province which consists of $119.6 million held by Canada Mortgage and Housing Corporation, an agency of the Federal Government, $65.0 million held by various First Nations Bands and $0.42 million of assumed mortgages on existing property. |
| (2) | Provincial advances have been adjusted by the foreign currency fluctuation on the direct borrowings of the Province for which Manitoba Hydro is responsible. |
| (3) | Includes post-secondary education institutions. |
30
The Manitoba Hydro-Electric Board provides for a supply of electrical power adequate for the needs of Manitoba, and promotes economy and efficiency in the generation, distribution, supply and use of electrical power within Manitoba. See “The Manitoba Hydro-Electric Board.” Pursuant to legislation enacted in 2001, the Government may not privatize Manitoba Hydro unless approved by the voters of Manitoba in a referendum.
The Manitoba Housing and Renewal Corporation undertakes the construction of housing projects and administers various Provincially subsidized housing programs, including rental subsidies for low income families, housing grants for elderly persons and housing improvement programs. At March 31, 2014, the Corporation had total assets of $864.3 million, represented by $260.1 million of projects completed or under construction, owned land held for development and/or sale having a book value of $68.2 million, loans and mortgages receivable of $143.2 million and other assets of $528.5 million.
The Manitoba Agricultural Services Corporation (MASC) provides credit for farmers principally through direct loans for capital purposes secured by first mortgages held by MASC and through guarantees of loans by chartered banks. MASC also provides crop insurance to farmers. At March 31, 2014, MASC had total assets of $758.4 million, of which $410.5 million represented receivables secured by first mortgages on farm land and buildings. For the fiscal year ended March 31, 2014, MASC’s operating income was $132.5 million, after Provincial operating grants of $100.6 million. As at March 31, 2014, the accumulated surplus of MASC was $253.4 million.
PUBLIC DEBT
Borrowing Record
The Province has always paid the full face amount of the principal of and premium and interest on (a) every direct obligation issued by it and (b) every indirect obligation on which it has been required to implement its guarantee, all promptly when due in the currency in which and country where payable at the time of payment thereof, subject during wartime to any applicable laws and regulations forbidding trading with the enemy.
31
Direct Funded Borrowings of the Province
The Province borrows to fund its net cash requirement. The following table summarizes the direct funded borrowings of the Province by currency exposure as at March 31 for the years 2010 through 2014.
DIRECT FUNDED BORROWINGS (1)
| | | | | | | | | | | | | | | | | | | | |
| | | As at March 31, | |
| | | 2010 | | | 2011 | | | 2012 | | | 2013 | | | 2014 | |
| | | (In thousands of dollars) | |
Direct Funded Borrowings Payable in: | | | | | | | | | | | | | | | | | | | | |
Canadian Dollars (2) | | $ | 18,234,304 | | | $ | 19,383,999 | | | $ | 21,649,550 | | | $ | 21,828,560 | | | $ | 24,229,040 | |
Issues hedged to Canadian Dollars | | | 3,768,323 | | | | 4,288,423 | | | | 4,849,937 | | | | 6,371,980 | | | | 6,154,381 | |
U.S. Dollars | | | 2,034,298 | | | | 1,554,880 | | | | 1,698,470 | | | | 1,726,520 | | | | 1,879,010 | |
Issues hedged to U.S. Dollars | | | 391,348 | | | | 328,844 | | | | 338,082 | | | | 343,666 | | | | — | |
| | | | | | | | | | | | | | | | | | | | |
Total Direct Funded Borrowings | | | 24,428,273 | | | | 25,556,146 | | | | 28,536,039 | | | | 30,270,726 | | | | 32,262,431 | |
Less: Sinking Funds | | | (3,568,399 | ) | | | (2,786,165 | ) | | | (2,808,029 | ) | | | (2,571,940 | ) | | | (2,188,735 | ) |
| | | | | | | | | | | | | | | | | | | | |
Net Direct Funded Borrowings | | $ | 20,859,874 | | | $ | 22,769,981 | | | $ | 25,728,010 | | | $ | 27,698,786 | | | $ | 30,073,696 | |
| | | | | | | | | | | | | | | | | | | | |
Raised for the purpose of: | | | | | | | | | | | | | | | | | | | | |
General Government Programs (3) | | $ | 10,878,400 | | | $ | 11,856,203 | | | $ | 13,917,856 | | | $ | 14,828,248 | | | $ | 15,720,219 | |
The Manitoba Hydro-Electric Board | | | 7,479,086 | | | | 8,195,792 | | | | 8,745,701 | | | | 9,443,408 | | | | 10,573,003 | |
Other Self-Sustaining Borrowings | | | 2,427,776 | | | | 2,657,167 | | | | 3,017,427 | | | | 3,393,897 | | | | 3,761,075 | |
Loans Payable to GBEs and Other | | | 74,612 | | | | 60,819 | | | | 47,026 | | | | 33,233 | | | | 19,399 | |
| | | | | | | | | | | | | | | | | | | | |
Net Direct Funded Borrowings | | $ | 20,859,874 | | | $ | 22,769,981 | | | $ | 25,728,010 | | | $ | 27,698,786 | | | $ | 30,073,696 | |
| | | | | | | | | | | | | | | | | | | | |
| (1) | Debentures payable in U.S. dollars and other foreign currencies are stated at the Canadian dollar equivalent using the exchange rates in effect on March 31 each year adjusted for any foreign currency contracts entered into for settlement after those dates. All U.S. dollar borrowing has either been hedged to Canadian dollars or is the responsibility of Manitoba Hydro, which has significant U.S. dollar revenues. |
| (2) | Direct funded borrowings payable in Canadian dollars includes debentures held by the Canada Pension Plan Investment Fund. Such securities are not negotiable, transferable or assignable, but are redeemable in whole or in part before maturity at the option of the Minister of Finance of Canada, on six months’ prior notice, when he deems it necessary in order to meet the requirements of the Canada Pension Plan. At March 31, 2013 and 2014, the total amount of such debentures was $492 million. |
| (3) | Borrowings for general government programs, including capital assets and pension funding, consist of the total direct funded borrowings of the Province less borrowing issued for self-sustaining purposes. |
For additional information as to the direct funded borrowings of the Province, see “Tables of Supplementary Information — Table III.” Subsequent to March 31, 2014, the Province issued funded borrowings of $3,320.72 million in Canadian dollars, which was issued to finance maturing issues and to provide funding for The Manitoba Hydro-Electric Board and for self-sustaining programs.
32
Guaranteed Borrowings of the Province
The following table summarizes the guaranteed borrowings of the Province by currency and purpose of issue as at March 31 for the years 2010 through 2014.
GUARANTEED BORROWINGS
| | | | | | | | | | | | | | | | | | | | |
| | | As at March 31, | |
| | | 2010 | | | 2011 | | | 2012 | | | 2013 | | | 2014 | |
| | | (In thousands of dollars) | |
Net Guaranteed Borrowings: | | | | | | | | | | | | | | | | | | | | |
Payable in Canadian Dollars (1) | | $ | 254,701 | | | $ | 165,101 | | | $ | 256,600 | | | $ | 165,657 | | | $ | 262,458 | |
| | | | | | | | | | | | | | | | | | | | |
Issued by: | | | | | | | | | | | | | | | | | | | | |
The Manitoba Hydro-Electric Board | | $ | 251,051 | | | $ | 162,301 | | | $ | 254,100 | | | $ | 163,157 | | | $ | 262,458 | |
Other | | | 3,650 | | | | 2,500 | | | | 2,500 | | | | 2,500 | | | | 2,500 | |
| | | | | | | | | | | | | | | | | | | | |
Net Guaranteed Borrowings (1) | | $ | 254,701 | | | $ | 165,101 | | | $ | 256,600 | | | $ | 165,657 | | | $ | 264,958 | |
| | | | | | | | | | | | | | | | | | | | |
| (1) | The table does not include guarantees of the Province totaling $25.7 million as at March 31, 2014. |
For additional information as to guaranteed borrowings, see “Tables of Supplementary Information — Table IV.”
Maturity Schedule
The following table sets forth the maturity schedule by currency of the direct funded and guaranteed borrowings of the Province as at March 31, 2014:
MATURITY SCHEDULE
DIRECT AND GUARANTEED BORROWINGS (1)
| | | | | | | | | | | | | | | | | | | | |
Years Ending March 31, | | Canadian
Dollars(2) | | | U.S .
Dollars(3) | | | Gross
Maturities | | | Estimated
Sinking Funds
Withdrawal | | | Net
Maturities | |
| | | (In millions of dollars) | |
Short-Term Borrowings (4) | | $ | 1,675 | | | $ | — | | | $ | 1,675 | | | $ | — | | | $ | 1,675 | |
2015 (4) | | | 2,435 | | | | 111 | | | | 2,545 | | | | 232 | | | | 2,313 | |
2016 | | | 2,061 | | | | — | | | | 2,061 | | | | 148 | | | | 1,913 | |
2017 | | | 2,048 | | | | 553 | | | | 2,600 | | | | 225 | | | | 2,376 | |
2018 | | | 2,512 | | | | — | | | | 2,512 | | | | 257 | | | | 2,255 | |
2019 | | | 1,827 | | | | 884 | | | | 2,711 | | | | 419 | | | | 2,292 | |
| | | | | | | | | | | | | | | | | | | | |
| | | 12,558 | | | | 1,547 | | | | 14,105 | | | | 1,281 | | | | 12,824 | |
2020-2024 | | | 6,089 | | | | 332 | | | | 6,421 | | | | 765 | | | | 5,655 | |
2025-2034 | | | 3, 191 | | | | — | | | | 3,191 | | | | 38 | | | | 3,153 | |
2035-2064 | | | 8,404 | | | | — | | | | 8,404 | | | | 104 | | | | 8,301 | |
2015-2044 GBEs | | | 10 | | | | — | | | | 10 | | | | — | | | | 10 | |
2015-2044 Health Care Facilities | | | 387 | | | | — | | | | 387 | | | | — | | | | 387 | |
2015-2016 Government of Canada | | | 9 | | | | — | | | | 9 | | | | — | | | | 9 | |
| | | | | | | | | | | | | | | | | | | | |
| | $ | 30,649 | | | $ | 1,879 | | | $ | 32,528 | | | $ | 2,188 | | | $ | 30,340 | |
| | | | | | | | | | | | | | | | | | | | |
| (1) | The table does not include guarantees of the Province totaling $25.7 million as at March 31, 2014. |
| (2) | Borrowings payable in Canadian dollars include borrowings swapped from other currencies. |
| (3) | Borrowings payable in U.S. dollars (U.S. $1.7 billion) are stated at the Canadian dollar equivalent as at March 31, 2014. |
| (4) | Short-Term Borrowings represent 90-day Treasury Bills and Promissory Notes outstanding. Short-Term Borrowings, together with the 2015 maturities, represent the total direct and guaranteed borrowings with a residual maturity of less than one year. |
33
Sinking Funds
The Minister of Finance may provide for the creation and management of sinking funds for the orderly retirement of borrowings. The Minister of Finance may authorize, by directive, the amount, if any, to be allocated to the Province’s sinking fund. The amount allocated to the sinking fund by the Province for the fiscal year ended March 31, 2014, was nil. Currently, the Province’s sinking fund is invested principally in securities issued or guaranteed by the Government of Canada or the Canadian Provinces.
Manitoba Hydro is required by statute to provide, prior to its fiscal year end in each year, amounts for sinking funds which are not less than the sum of (a) 1% of the borrowings of, and Provincial advances to, Manitoba Hydro outstanding at the preceding fiscal year end and (b) 4% of the balance of cash and book value of securities in the sinking fund at such date. Interest earned on money and securities in the sinking fund is paid to Manitoba Hydro.
Unfunded Debt
The unfunded debt of the Province as at March 31, 2014 amounted to $2,467.5 million, including $855.1 million of accounts payable, $174.0 million of accrued interest and $1,438.4 million of other accrued charges. This unfunded debt was offset by current assets of the Province in the amount of $1,763.1 million, represented by $526.1 million of March 2014 tax revenue receivables, $281.6 million of other receivables, $11.3 million of interest receivable and $441.0 million of accounts receivable from the Federal and other governments and $684.9 million in cash and equivalents, less a valuation allowance of $181.7 million.
Consolidated Funded Borrowings of the Manitoba Public Sector
The Province supervises all financial activities of the Manitoba public sector. Certain public sector entities issue debt in their own names, which is not guaranteed by the Province. Accordingly, not all funding within the public sector is reflected in the Province’s financial statements. The following table sets forth the consolidated funded borrowings of the Manitoba public sector as at March 31 for each of the years 2010 through 2014.
CONSOLIDATED FUNDED BORROWINGS OF THE MANITOBA PUBLIC SECTOR
| | | | | | | | | | | | | | | | | | | | |
| | | As at March 31, | |
| | | 2010 | | | 2011 | | | 2012 | | | 2013 | | | 2014 | |
| | | (In millions of dollars) | |
Issued for the purpose of: | | | | | | | | | | | | | | | | | | | | |
General Government Programs | | $ | 13,456 | | | $ | 14,323 | | | $ | 16,376 | | | $ | 17,068 | | | $ | 17,799 | |
Less Sinking Funds | | | (2,603 | ) | | | (2,458 | ) | | | (2,458 | ) | | | (2,240 | ) | | | (2,078 | ) |
| | | | | | | | | | | | | | | | | | | | |
Net General Government Programs | | | 10,853 | | | | 11,865 | | | | 13,918 | | | | 14,828 | | | | 15,720 | |
| | | | | | | | | | | | | | | | | | | | |
The Manitoba Hydro-Electric Board | | | 8,546 | | | | 8,635 | | | | 9,352 | | | | 9,941 | | | | 10,947 | |
Less Sinking Funds | | | (809 | ) | | | (269 | ) | | | (350 | ) | | | (332 | ) | | | (110 | ) |
| | | | | | | | | | | | | | | | | | | | |
Net The Manitoba Hydro-Electric Board | | | 7,737 | | | | 8,366 | | | | 9,003 | | | | 9,609 | | | | 10,836 | |
| | | | | | | | | | | | | | | | | | | | |
Other Crown Organizations, Public Sector Entities and Loans Payable | | | 3,611 | | | | 3,828 | | | | 4,179 | | | | 4,724 | | | | 5,615 | |
Less Sinking Funds | | | (366 | ) | | | (292 | ) | | | (243 | ) | | | (264 | ) | | | (195 | ) |
| | | | | | | | | | | | | | | | | | | | |
Net Other Crown Organizations, Public Sector Entities and Loans Payable | | | 3,244 | | | | 3,536 | | | | 3,938 | | | | 4,461 | | | | 5,421 | |
| | | | | | | | | | | | | | | | | | | | |
Net Public Sector Debt | | $ | 21,832 | | | $ | 23,767 | | | $ | 26,859 | | | $ | 28,898 | | | $ | 31,978 | |
| | | | | | | | | | | | | | | | | | | | |
Consisting of: | | | | | | | | | | | | | | | | | | | | |
Direct Debt of the Province (1) | | $ | 23,159 | | | $ | 24,217 | | | $ | 27,029 | | | $ | 28,630 | | | $ | 30,502 | |
Guaranteed Debt of the Province (1) | | | 255 | | | | 165 | | | | 257 | | | | 166 | | | | 265 | |
Non-Guaranteed Debt of Crown Organizations, Other Public Sector Entities and Loans Payable | | | 2,198 | | | | 2,405 | | | | 2,622 | | | | 2,937 | | | | 3,594 | |
| | | | | | | | | | | | | | | | | | | | |
Total Public Sector Debt | | | 25,612 | | | | 26,786 | | | | 29,908 | | | | 31,733 | | | | 34,360 | |
Less: Accumulated Sinking Funds | | | (3,778 | ) | | | (3,020 | ) | | | (3,051 | ) | | | (2,836 | ) | | | (2,384 | ) |
| | | | | | | | | | | | | | | | | | | | |
Net Public Sector Debt | | $ | 21,832 | | | $ | 23,767 | | | $ | 26,859 | | | $ | 28,898 | | | $ | 31,978 | |
| | | | | | | | | | | | | | | | | | | | |
| (1) | U.S. and other foreign currency borrowings included in the direct borrowings of the Province and the guaranteed borrowings of the Province are stated at the Canadian dollar equivalent using the exchange rates in effect on March 31 each year. |
34
Selected Borrowings Information
The following table sets forth certain information as to the funded borrowings of the Manitoba Public Sector and of the Province, as well as borrowings issued for General Government programs, including capital assets and pension funding (all net of accumulated sinking funds) as at March 31 for the years 2010 through 2014, including per capita data based upon population at July 1 of the preceding calendar year.
PUBLIC SECTOR BORROWINGS INFORMATION
| | | | | | | | | | | | | | | | | | | | |
| | | As at March 31, | |
| | | 2010 | | | 2011 | | | 2012 | | | 2013 | | | 2014 | |
Total Net Consolidated Funded Borrowings of the Manitoba Public Sector (in millions) | | $ | 21,832 | | | $ | 23,767 | | | $ | 26,859 | | | $ | 28,898 | | | $ | 31,978 | |
Per Capita | | | 18,058 | | | | 19,465 | | | | 21,765 | | | | 23,100 | | | | 25,279 | |
As a Percent of Primary Household Income | | | 64.0 | % | | | 67.9 | % | | | 73.0 | % | | | 74.9 | % | | | 80.4 | % |
As a Percent of Nominal Gross Domestic Product | | | 42.3 | | | | 43.8 | | | | 47.1 | | | | 49.7 | | | | 53.0 | |
Total Net Direct Funded Borrowings of the Province (in millions) | | $ | 20,860 | | | $ | 22,770 | | | $ | 25,728 | | | $ | 27,699 | | | $ | 30,074 | |
Per Capita | | | 17,254 | | | | 18,649 | | | | 20,849 | | | | 22,141 | | | | 23,774 | |
As a Percent of Primary Household Income | | | 61.1 | % | | | 65.1 | % | | | 69.9 | % | | | 71.8 | % | | | 75.6 | % |
As a Percent of Nominal Gross Domestic Product | | | 40.5 | | | | 42.0 | | | | 45.2 | | | | 47.6 | | | | 49.9 | |
Net Borrowings Issued for General Government Programs (in millions) | | $ | 10,853 | | | $ | 11,865 | | | $ | 13,918 | | | $ | 14,828 | | | $ | 15,720 | |
Per Capita | | | 8,976 | | | | 9,717 | | | | 11,279 | | | | 11,853 | | | | 12,427 | |
As a Percent of Primary Household Income | | | 31.8 | % | | | 33.9 | % | | | 37.8 | % | | | 38.5 | % | | | 39.5 | % |
As a Percent of Nominal Gross Domestic Product | | | 21.0 | | | | 21.9 | | | | 24.4 | | | | 25.5 | | | | 26.1 | |
Net Cost of Servicing General Government Program Borrowings | | | 2.4 | % | | | 2.2 | % | | | 2.1 | % | | | 2.1 | % | | | 1.8 | % |
As a Percent of Provincial Revenue | | | | | | | | | | | | | | | | | | | | |
Starting in 2007, the Province has borrowed to fund a portion of its unfunded pension liabilities. These borrowings increase total net funded borrowings. As the proceeds are invested in pension assets, they do not increase Summary Net Debt of the Province.
35
SUMMARY NET DEBT
| | | | | | | | | | | | | | | | | | | | |
| | | As of March 31, | |
| | | 2010 | | | 2011 | | | 2012 | | | 2013 | | | 2014 | |
| | | (In millions of dollars, unless otherwise indicated) | |
Total Financial Assets (1) | | $ | 9,813 | | | $ | 9,904 | | | $ | 10,623 | | | $ | 10,585 | | | $ | 10,683 | |
| | | | | | | | | | | | | | | | | | | | |
Liabilities: | | | | | | | | | | | | | | | | | | | | |
Borrowings (2) | | | 16,142 | | | | 17,150 | | | | 19,603 | | | | 20,788 | | | | 21,946 | |
Accounts Payable, accrued charges, provisions and unearned revenue | | | 3,546 | | | | 3,585 | | | | 3,936 | | | | 3,862 | | | | 4,043 | |
Pension Liability | | | 1,768 | | | | 1,731 | | | | 1,634 | | | | 1,828 | | | | 2,038 | |
| | | | | | | | | | | | | | | | | | | | |
Total Liabilities | | | 21,456 | | | | 22,466 | | | | 25,173 | | | | 26,478 | | | | 28,027 | |
| | | | | | | | | | | | | | | | | | | | |
Summary Net Debt | | $ | 11,643 | | | $ | 12,562 | | | $ | 14,550 | | | $ | 15,893 | | | $ | 17,344 | |
| | | | | | | | | | | | | | | | | | | | |
Summary Net Debt as a Percentage of Nominal Gross Domestic Product | | | 23.0 | % | | | 23.7 | % | | | 26.4 | % | | | 27.3 | % | | | 28.8 | % |
| (1) | Includes cash, accounts receivable, loans and investments, equity in GBEs and other financial assets. |
| (2) | Excludes borrowings incurred for and repayable by The Manitoba Hydro-Electric Board. Includes unamortized currency fluctuations. |
36
Pension Liability
The Government participates in various pension plans. The two primary plans, in which the Government directly participates, are the Civil Service Superannuation Plan and the Teachers’ Pension Plan. As per the Acts that administer these plans, the Government is responsible for 50% of pension benefits earned by employees. These plans are joint trusteed plans. The Government’s pension liability reflects its share of the actuarial present values of pension benefits attributed to services rendered by employees and former employees, net of any plan assets which are set aside by the Government in an irrevocable trust.
Other pension plans in which the Government participates include the Members of the Legislative Assembly Plan, the Legislative Assembly Pension Plan, the Judges’ Supplemental Pension Plan and the Winnipeg Child and Family Services Employee Benefits Retirement Plan. The Government is responsible for any excess of accrued pension benefits over pension fund assets for these plans.
The Government also includes several other pension plans in its pension liability. These other plans include post-secondary education pension plans and public school divisions’ pension plans. Post-secondary education pension plans include the University of Manitoba Pension Plans, the University of Winnipeg Pension Plan and the Brandon University Retirement Plan. Public school divisions’ pension plans include the Winnipeg School Division Pension Fund for Employees Other Than Teachers, Retirement Plan for Non-Teaching Employees of the St. James-Assiniboia School Division and Retirement Plan for Employees of Frontier School Division. The Government is responsible for any excess of accrued pension benefits over pension fund assets for these plans.
Employees in the health sector are members of the Health Care Employees Pension Plan, a multi-employer defined benefit pension plan established between employees and participating boards. Because the Government does not sponsor this plan, the accrued benefit liability of this plan is not recognized in the Summary Financial Statements. The annual net benefit plan expense is the amount of required contributions provided for employees’ services rendered during the year. In the year ended March 31, 2014, the Government expensed contributions to this plan of $132 million (2013 — $132 million). At December 31, 2013, the Plan had a deficiency of net assets available for benefits over pension obligations of $259 million. The Plan is addressing this deficiency through increased employer and employee contributions and exercising due diligence in evaluating investment and other management decisions.
As at March 31, 2014, the Province’s total gross pension obligation for all these plans (except health) was $8,010 million (2013 — $7,686 million) or $2,038 million net of plan assets (2013 — $1,828 million). The components of this obligation are set forth below.
An actuarial valuation and report of the Province’s liability to the Civil Service Superannuation Fund (CSSF) was completed as at December 31, 2012. The report also provided a formula to update the liability on an annual basis. In accordance with this formula, the Province’s actuarial liability to the CSSF has been calculated at $2,619 million on an indexed basis as at March 31, 2014 (2013 — $2,524 million) or at $726 million net of plan assets as at March 31, 2014 (2013 — $670 million).
An actuarial report for Teachers Retirement Allowances Fund (TRAF) was completed as of January 1, 2012 and provides a formula to update the Province’s pension liability, resulting in a pension liability of $3,480 million on an indexed basis at March 31, 2014 (2013 — $3,315 million) or $1,272 million net of plan assets at March 31, 2014 (2013 — $1,131 million).
An actuarial valuation and report of the Province’s liability to other pension plans was calculated at $1,911 million on an indexed basis at March 31, 2014 (2013 — $1,847 million) or at $40 million net of plan assets at March 31, 2014 (2013 — $27 million).
37
The following table summarizes the estimated actuarial pension liability for the Province and Crown organizations excluding GBEs such as Manitoba Hydro. The balances are net of the Pension Assets Fund (described below).
| | | | | | | | |
| | | As at
March 31, | |
| | | 2013 | | | 2014 | |
| | | (In millions of dollars) | |
Civil Service Superannuation Fund | | $ | 670 | | | $ | 726 | |
Teachers’ Retirement Allowances Fund | | | 1,131 | | | | 1,272 | |
Other Pension Plans | | | 27 | | | | 40 | |
| | | | | | | | |
Pension Liability (1) | | $ | 1,828 | | | $ | 2,038 | |
| | | | | | | | |
| (1) | Includes unamortized actuarial gains and losses. |
Pension fund assets are held in the Pensions Assets Fund, which includes separately invested trust accounts for CSSF and TRAF.
The Province has set aside funds to address the Province’s unfunded pension liability. The Province transferred a total of $1,100 million from the Operating Fund to the CSSF during the fiscal years from 2009 to 2012. In addition, the Province provided funding of $1,502 million to the TRAF during the fiscal year 2008 to reduce its unfunded pension liability level.
Manitoba Hydro employees are eligible for pensions under The Civil Service Superannuation Act, which requires Manitoba Hydro to contribute 50% of the pension disbursements made to retired employees. As at March 31, 2014, Manitoba Hydro and its subsidiaries had an accrued benefit asset of $90 million (2013 — $122 million), which consisted of an accrued benefit obligation of $1,398 million (2013 — $1,365 million), pension assets of $1,015 million (2013 — $903 million), and unamortized actuarial loss of $473 million (2013 — $584 million). These amounts are not reflected in the above totals in respect of the Province’s pension liability.
THE MANITOBA HYDRO-ELECTRIC BOARD
The Manitoba Hydro-Electric Board (Manitoba Hydro) was established in 1949 by an Act of the Legislature of the Province as an agent of the Crown of the Province to provide for a supply of electrical power adequate for the needs of Manitoba, and to promote economy and efficiency in the generation, distribution, supply and use of electrical power within Manitoba.
In 1997, amendments were made to The Manitoba Hydro Act to allow wholesale competition and transmission access in the Manitoba electrical market and allow Manitoba Hydro to offer new products and services, create subsidiaries and enter into joint ventures and business alliances. The amendments also provided Manitoba Hydro with explicit authority to build new generation for export.
Manitoba Hydro currently provides electricity to approximately 556,000 customers and natural gas service to approximately 272,000 customers within the Province. In addition, Manitoba Hydro currently has 23 active counterparties for electricity exports in the U.S., Ontario and Saskatchewan.
At March 31, 2014, Manitoba Hydro’s total generating capability was 5,725 megawatts. Of this generating capability, hydro-electric stations represented 91.7%, thermal-electric stations 8.2% (6.5% natural gas and 1.7% coal) and diesel-electric stations 0.1%. The diesel electric stations serve four isolated communities in northern Manitoba that are too remote to be served from the integrated system.
38
For the fiscal year ended March 31, 2014, 92.2% of the total energy supply of 38.2 billion kilowatt-hours was provided by self-renewing hydro-electric generation. The portion of total supply provided by thermal generation was 0.3%, by imports 5.0% and by wind purchase 2.4%.
Operations
Net income from consolidated operations for the fiscal year ended March 31, 2014 was $174 million, compared to net income of $92 million in the previous fiscal year. The increase in net income of $82 million was largely attributable to increased revenues from domestic and extra provincial electricity sales partially offset by higher expenses. Manitoba Hydro’s debt/equity ratio of 76:24 was slightly lower than the 75:25 target at March 31, 2014.
Electricity
As at March 31, 2014, Manitoba Hydro owned and operated 15 hydro-electric generating stations having a total installed electric generating capability of 5,248 megawatts, including five stations with a total capability of 3,967 megawatts located on the Nelson River. Manitoba Hydro also owned and operated two thermal-electric generating stations having a total installed capability of 467 megawatts and four isolated diesel sites having an installed capacity of 10 megawatts.
As at March 31, 2014, the high voltage transmission facilities of Manitoba Hydro consisted of approximately 12,261 circuit kilometers.
For purposes of exporting surplus energy, Manitoba Hydro maintains interconnections with power facilities in the Provinces of Saskatchewan and Ontario, and in the States of North Dakota and Minnesota. Manitoba Hydro’s interconnections with Ontario have a firm export transfer capability of 200,000 kilowatts and a firm import capability of 0 kilowatts. The interconnections with Saskatchewan have a firm export transfer capability of 150,000 kilowatts and a firm import transfer capability of 0 kilowatts. The interconnections with the United States have a firm export transfer capability of 2,100,000 kilowatts and a firm import transfer capability of 700,000 kilowatts. Additional non-firm import and export transfer capability may be available from time to time on all three interfaces depending on the operating conditions.
During the fiscal year ended March 31, 2014, Manitoba Hydro sold a total of 33.0 billion kilowatt-hours of electricity, representing an increase of 8% from the fiscal year ended March 31, 2013. Extraprovincial sales accounted for 10.7 billion kilowatt-hours, an increase of 17.5% from the prior year, or 32.3% of total electricity sales for the fiscal year ended March 31, 2014. Imports accounted for 1.9 billion kilowatt-hours, an increase of 24.7% from the fiscal year ended March 31, 2013. Wind purchases, all from sources within the Province, accounted for 0.9 billion kilowatt-hours.
Natural Gas
Manitoba Hydro’s subsidiary, Centra Gas, provides natural gas distribution and related energy services to approximately 272,000 customers that are located in nearly 100 communities throughout southern Manitoba. Centra Gas owns a network of transmission (1,876 kilometers) and distribution (7,944 kilometers) mains to meet the natural gas requirements of its customers.
For the year ended March 31, 2014, Centra Gas had total gas deliveries of 80.4 billion cubic feet, an increase of 11.3% from the prior year. These gas deliveries were comprised of 23.4 billion cubic feet to residential customers, 34.0 billion cubic feet to commercial and industrial customers, and 23.0 billion cubic feet of transportation deliveries.
Rate Matters
Manitoba Hydro’s rates for electricity sales within the Province are set on an embedded cost of service basis and are subject to review and approval by The Public Utilities Board of Manitoba (PUB). On April 26, 2013, the PUB issued Order 43/13 which approved a 3.5% increase in electricity rates effective May 1, 2013. The PUB directed that 2.0% of the 3.5% increase be included in general revenues and that 1.5% of the approved rate increase be set aside to be utilized to mitigate rate increases when Bipole III is placed in-service. On May 6, 2014 the PUB issued Order 49/14 which approved an interim 2.75% across-the-board rate increase for all customer classes effective May 1, 2014, with 0.75% of the increase to be deferred until Bipole III is placed in-service. Manitoba Hydro’s electricity customers continue to enjoy one of the lowest rate structures in North America.
39
Centra Gas files quarterly rate applications with the PUB based on the twelve-month forward price for Western Canadian gas supplies, which are designed to pass through to customers the impact of primary gas price changes. Centra Gas also makes periodic rate applications for changes in non-commodity costs and other gas costs.
Centra Gas also offers a fixed rate service for primary natural gas supply which allows customers to fix their natural gas rates for terms of up to five years. The fixed rate service is offered to residential and commercial customers.
Statistical Information
The following table sets forth certain statistical information for the last five years.
| | | | | | | | | | | | | | | | | | | | |
| | | Year Ended March 31, | |
| | | 2010 | | | 2011 | | | 2012 | | | 2013 | | | 2014 | |
Electricity | | | | | | | | | | | | | | | | | | | | |
Installed Generating Capability (in megawatts) | | | 5,511 | | | | 5,499 | | | | 5,485 | | | | 5,685 | | | | 5,725 | |
Manitoba Firm Peak Demand (in megawatts) | | | 4,359 | | | | 4,261 | | | | 4,343 | | | | 4,535 | | | | 4,720 | |
Energy Supply (in millions of kilowatt-hours) | | | | | | | | | | | | | | | | | | | | |
Generated | | | 33,974 | | | | 34,115 | | | | 33,249 | | | | 33,244 | | | | 35,406 | |
Purchased (scheduled energy) | | | 1,788 | | | | 1,755 | | | | 2,588 | | | | 2,380 | | | | 2,840 | |
| | | | | | | | | | | | | | | | | | | | |
Total | | | 35.762 | | | | 35,870 | | | | 35,837 | | | | 35,624 | | | | 38,246 | |
| | | | | | | | | | | | | | | | | | | | |
Electric Energy Sales (in millions of kilowatt-hours) | | | | | | | | | | | | | | | | | | | | |
Manitoba | | | 20,486 | | | | 20,787 | | | | 20,770 | | | | 21,477 | | | | 22,356 | |
Extraprovincial (scheduled energy deliveries) | | | 11,149 | | | | 10,578 | | | | 10,321 | | | | 9,081 | | | | 10,674 | |
| | | | | | | | | | | | | | | | | | | | |
Total | | | 31,635 | | | | 31,365 | | | | 31,091 | | | | 30,558 | | | | 33,030 | |
| | | | | | | | | | | | | | | | | | | | |
Revenue from Sale of Power (in thousands of dollars) | | | | | | | | | | | | | | | | | | | | |
Manitoba | | $ | 1,144,891 | | | $ | 1,200,381 | | | $ | 1,191,117 | | | $ | 1,341,011 | | | $ | 1,405,301 | |
Extraprovincial | | | 426,641 | | | | 398,307 | | | | 363,044 | | | | 352,633 | | | | 439,182 | |
| | | | | | | | | | | | | | | | | | | | |
Total | | $ | 1,571,532 | | | $ | 1,598,688 | | | $ | 1,554,161 | | | $ | 1,693,644 | | | $ | 1,844,483 | |
| | | | | | | | | | | | | | | | | | | | |
Number of Customers | | | 532,359 | | | | 537,299 | | | | 542,681 | | | | 548,774 | | | | 555,760 | |
Average Revenue per kilowatt-hour | | | | | | | | | | | | | | | | | | | | |
Manitoba | | | 5.59 | ¢ | | | 5.77 | ¢ | | | 5.73 | ¢ | | | 6.24 | ¢ | | | 6.29 | ¢ |
Extraprovincial | | | 3.83 | ¢ | | | 3.77 | ¢ | | | 3.52 | ¢ | | | 3.88 | ¢ | | | 4.11 | ¢ |
Average Cost per kilowatt-hour of Electric Energy Sold (excluding finance expense) | | | 3.34 | ¢ | | | 3.43 | ¢ | | | 3.58 | ¢ | | | 3.96 | ¢ | | | 4.08 | ¢ |
Natural Gas | | | | | | | | | | | | | | | | | | | | |
Gas Deliveries (in billions of cubic feet) | | | | | | | | | | | | | | | | | | | | |
Residential | | | 23.6 | | | | 20.9 | | | | 18.0 | | | | 21.2 | | | | 23.4 | |
Commercial/Industrial | | | 25.3 | | | | 29.0 | | | | 25.7 | | | | 30.0 | | | | 34.0 | |
Transportation | | | 21.8 | | | | 20.6 | | | | 22.2 | | | | 21.1 | | | | 23.0 | |
| | | | | | | | | | | | | | | | | | | | |
Total | | | 70.7 | | | | 70.5 | | | | 65.9 | | | | 72.3 | | | | 80.4 | |
| | | | | | | | | | | | | | | | | | | | |
Number of Customers | | | 264,301 | | | | 265,961 | | | | 267,699 | | | | 269,786 | | | | 272,228 | |
Revenue from Sale of Natural Gas (in thousands of dollars) | | | | | | | | | | | | | | | | | | | | |
Residential | | $ | 253,240 | | | $ | 233,847 | | | $ | 195,338 | | | $ | 199,210 | | | $ | 238,416 | |
Commercial/Industrial | | | 193,399 | | | | 163,822 | | | | 127,774 | | | | 123,701 | | | | 170,298 | |
Transportation | | | 5,246 | | | | 4,994 | | | | 4,602 | | | | 4,813 | | | | 3,945 | |
Other | | | 1,924 | | | | 1,394 | | | | 990 | | | | 1,296 | | | | 2,567 | |
| | | | | | | | | | | | | | | | | | | | |
Total | | $ | 453,809 | | | $ | 404,057 | | | $ | 328,704 | | | $ | 329,020 | | | $ | 415,226 | |
| | | | | | | | | | | | | | | | | | | | |
40
For information with respect to the operating financial results, balance sheet, statement of cash flows and comprehensive income of Manitoba Hydro, see “Tables of Supplementary Information — Table V.”
Construction Program
The following table summarizes Manitoba Hydro’s capital expenditures for improvements and expansion of its facilities during the four-year period ended March 31, 2014, and the estimated capital expenditures during the five-year period ending March 31, 2019.
CAPITAL EXPENDITURES
| | | | | | | | | | | | | | | | | | | | | | | | | | | | |
| | | Year Ending March 31, (in thousands of dollars) | |
| | | | | | | | | | | | | | | Estimated | |
| | | 2011 | | | 2012 | | | 2013 | | | 2014 | | | 2015 | | | 2016 | | | 2017-2019 | |
Electricity | | | | | | | | | | | | | | | | | | | | | | | | | | | | |
Major New Generation & Transmission | | $ | 657,469 | | | $ | 567,780 | | | $ | 600,271 | | | $ | 983,713 | | | $ | 1,376,488 | | | $ | 1,790,173 | | | $ | 5,278,500 | |
Generation Upgrades | | | 113,745 | | | | 105,495 | | | | 92,332 | | | | 115,901 | | | | 136,345 | | | | 127,851 | | | | 436,907 | |
Transmission & Stations | | | 108,718 | | | | 114,253 | | | | 98,481 | | | | 102,832 | | | | 185,946 | | | | 204,529 | | | | 392,815 | |
Distribution & Other | | | 220,183 | | | | 245,474 | | | | 241,877 | | | | 251,377 | | | | 314,578 | | | | 299,061 | | | | 744,071 | |
Natural Gas | | | | | | | | | | | | | | | | | | | | | | | | | | | | |
Distribution & Other | | | 33,916 | | | | 37,676 | | | | 38,880 | | | | 40,740 | | | | 48,337 | | | | 61,333 | | | | 109,953 | |
| | | | | | | | | | | | | | | | | | | | | | | | | | | | |
Total | | $ | 1,134,031 | | | $ | 1,070,678 | | | $ | 1,071,841 | | | $ | 1,494,563 | | | $ | 2,061,694 | | | $ | 2,482,947 | | | $ | 6,962,246 | |
| | | | | | | | | | | | | | | | | | | | | | | | | | | | |
Capital expenditures, excluding major new generation and transmission expenditures, are estimated to total $3,062 million for the five-year period ending March 31, 2019. Manitoba Hydro expects internally generated funds to be sufficient to fund the majority of these capital expenditures.
Manitoba Hydro has recently revised the cost estimates for two of its major capital projects. The Bipole III revised cost estimate is $4.6 billion ($1.3 billion increase) and the Keeyask revised estimate is $6.5 billion ($0.3 billion increase).
Manitoba Hydro has received required approvals and is proceeding with construction of Bipole III transmission and Keeyask generating station in order to further improve electrical system reliability, to meet the future energy requirements of the Province, and to take advantage of export market opportunities outside of the Province. This plan also includes a new 500kV interconnection to the U.S. which facilitates access to that power market and provides increased transfer capability for both export and import purposes. Manitoba Hydro’s development plan includes enhanced demand side management (DSM) options targeted to realize electricity savings of 1,136 MW and 3,978 GW.h, natural gas savings of 108 million cubic meters, and combined global greenhouse gas emission reductions of 2.9 million tonnes by 2028/29. These projects and the DSM plan involve investment of approximately C$12 billion and are expected to generate returns for Manitobans following the in-service date of these projects. Manitoba Hydro’s development plan includes Conawapa generating station, but most activity on the project has been suspended at this time pending securing additional firm export contracts.
Bipole III is a new high voltage direct current (HVDC) transmission project required to improve overall system reliability and dependability, as well as to provide additional capacity for delivery of existing and proposed hydroelectric generation to southern markets. The proposed Bipole III route, which is planned to be 1,384 km in length, will originate at the new Keewatinohk Converter Station near Gillam, travel south and west of Lakes Winnipegosis and Manitoba, and terminate at the new Riel Converter Station on the east side of Winnipeg. Construction and right-of-way clearing began in early 2014. The projected in-service date is 2018.
41
The 695-megawatt Keeyask Generating Station is being developed on the Nelson River approximately 175 km northeast of Thompson in partnership with the Keeyask Cree Nations (KCN) — Tataskweyak Cree Nation, War Lake First Nation, Fox Lake Cree Nation and York Factory First Nation. The Joint Keeyask Development Agreement formalizing the Keeyask Hydropower Limited Partnership (KHLP) between Manitoba Hydro and the four KCN was signed in 2009 and provides the KCN with a right to own up to 25 per cent of the partnership. The Keeyask Infrastructure Project (KIP) began in early 2012 and enabled an early start to the construction of the access road, Looking Back Creek Bridge, the start-up camp and various work areas. The KIP was constructed by a joint venture between Cree Nation Partners (Tataskweyak Cree Nation and War Lake First Nation) and Sigfusson Northern Ltd. On July 2, 2014 the Province of Manitoba issued the environmental license to construct the Keeyask generating station upon recommendation of the Clean Environment Commission and Public Utilities Board. Construction commenced on the Keeyask Generating Station on July 16, 2014. The projected in-service date for the first unit is 2019.
On July 2, 2014, the Manitoba Government also authorized Manitoba Hydro to proceed with the Manitoba-Minnesota Transmission Project, the new 500 kV interconnection to the U.S. This project still requires approval from federal, state, and provincial regulatory authorities to begin construction. A preferred route for the Project along with the environmental assessment will be submitted to regulators in 2015.
The planned 1,485-megawatt Conawapa generating station would be built approximately 90 kilometres downstream of Gillam and 28 kilometres downstream of Limestone Generating Station, in the Fox Lake Resource Management Area on the lower Nelson River. Manitoba Hydro’s current plan is to defer the decision on Conawapa to a later than 2018 date subject to additional firm export sale commitments over the next two years sufficient to meet Manitoba Hydro’s business and financial requirements. Construction of this generation project will only proceed once firm export sales contracts are secured, extensive consultations with stakeholders and First Nations are concluded, and environmental and regulatory approvals are received.
42
The following table summarizes the location and net winter capability of Manitoba Hydro’s integrated system existing and potential generating stations.
MANITOBA HYDRO INTEGRATED SYSTEM
EXISTING AND POTENTIAL GENERATING STATIONS
EXISTING GENERATING STATIONS
| | | | | | |
Generating Station | | River | | Net Winter
Capability | |
| | | (in megawatts) | |
Jenpeg | | Nelson | | | 125 | |
Kelsey | | Nelson | | | 292 | |
Kettle | | Nelson | | | 1,220 | |
Long Spruce | | Nelson | | | 980 | |
Limestone | | Nelson | | | 1,350 | |
Pine Falls | | Winnipeg | | | 87 | |
Great Falls | | Winnipeg | | | 129 | |
McArthur Falls | | Winnipeg | | | 55 | |
Seven Sisters | | Winnipeg | | | 165 | |
Slave Falls | | Winnipeg | | | 67 | |
Pointe Du Bois | | Winnipeg | | | 75 | |
Grand Rapids | | Saskatchewan | | | 479 | |
Laurie River I and II | | Laurie | | | 10 | |
Wuskwatim | | Burntwood | | | 214 | |
| | | | | | |
Total Hydraulic Capability | | | | | 5,248 | |
Brandon & Selkirk Thermal | | | | | 467 | |
| | | | | | |
Total Integrated System Capability | | | | | 5,715 | |
| | | | | | |
POTENTIAL GENERATING STATIONS (1)
| | | | | | |
Conawapa | | Nelson | | | 1,300 | |
Gillam Island | | Nelson | | | 850 | |
Keeyask | | Nelson | | | 630 | |
Birthday Rapids | | Nelson | | | 295 | |
Whitemud | | Nelson | | | 290 | |
Manasan | | Burntwood | | | 250 | |
Red Rock | | Nelson | | | 230 | |
First Rapids | | Burntwood | | | 195 | |
Granville Falls | | Churchill | | | 120 | |
Bonald | | Churchill | | | 110 | |
Notigi | | Burntwood | | | 100 | |
Early Morning | | Burntwood | | | 60 | |
| | | | | | |
| | | | | 4,430 | |
| | | | | | |
Total | | | | | 10,145 | |
| | | | | | |
| (1) | Net capacity addition to the integrated system. |
Export Power Sales
Manitoba Hydro enters into short-term and long-term power sales on an on-going basis to numerous utilities and markets in the upper mid-west United States and in Canada. Manitoba Hydro monitors the creditworthiness of, and exposures to, export sales customers in order to minimize credit risk.
43
Manitoba Hydro has a Coordination Agreement with the Midcontinent Independent System Operator, Inc. (MISO) which allows Manitoba Hydro to participate in the MISO. The agreement provides Manitoba Hydro with non-discriminatory transmission access to the membership base of the MISO. From its headquarters in central Indiana, the MISO serves as the regional transmission organization for its transmission-owning members, and with the inclusion of committed operations, controls an interconnected transmission grid encompassing more than 175,000 megawatts of generation capacity over 65,000 miles of high voltage transmission lines in all or parts of 15 states. This market operates similarly to other trading exchanges where power sales and purchases are transacted directly with the exchange rather than utilities transacting directly with one another. The market offers a broad range of electricity products, thereby providing additional sales opportunities to Manitoba Hydro.
44
The following table summarizes Manitoba Hydro’s current and future export power contracts.
| | | | | | | | |
Executed Contracts | | Date Signed | | Capacity
(MW) | | Type | | Term |
Northern States Power Company 200 MW Diversity Exchange | | Nov. 16, 1987 | | 200 | | Diversity Exchange | | Nov. 1, 1996 –
April 30, 2015 |
Northern States Power Company 150 MW Diversity Exchange | | Mar. 5, 1991 | | 150 | | Diversity Exchange | | May 1, 1995 –
April 30, 2015 |
Northern States Power Company 350 MW Diversity Exchange | | May 27, 2010 | | 350 | | Diversity Exchange | | May 1, 2015 –
April 30, 2025 |
Northern States Power Company 500 MW System Participation Power Sale | | Aug. 1, 2002 | | 500 | | System Participation
Power | | May 1, 2005 –
April 30, 2015 |
Northern States Power Company 375 (S)/325 (W) MW System Power Sale | | May 27, 2010 | | 375(S)
325(W) | | System Participation
Power | | May 1, 2015 –
April 30, 2025 |
Northern States Power Company 125 MW System Power Sale | | May 27, 2010 | | 125 | | System Participation
Power | | May 1, 2021 –
April 30, 2025 |
| | | | |
UPA/Great River Energy 150 MW Diversity Exchange | | Mar. 5, 1991 | | 150 | | Diversity Exchange | | May 1, 1995 –
Oct. 31, 2014 |
| | | | |
Great River Energy 50 MW Energy Sale | | May 1, 2012 | | 0 | | Surplus Energy | | May 1, 2012 –
Oct. 31, 2014 |
Great River Energy 200 MW Diversity Exchange | | Jul. 26, 2013 | | 200 | | Diversity Exchange | | Nov. 1, 2014 –
April 30, 2030 |
| | | | |
Minnesota Power 50 MW System Participation Power Sale | | Jun. 28, 2006 | | 50 | | System Participation
Power | | May 1, 2009 –
May 31, 2015 |
Minnesota Power 50 MW System Power Sale | | Dec. 19, 2013 | | 50 | | System Participation
Power | | June 1, 2015 –
May 31, 2020 |
Minnesota Power 3.3 TWh Non-Firm Energy Sale | | Apr. 30, 2010 | | 0 | | Energy | | May 1, 2011 –
April 30, 2022 |
Minnesota Power 250 MWh System Power Sale | | May 19, 2011 | | 250 | | System Participation
Power | | June 1, 2020 –
May 31, 2035 |
| | | | |
Minnesota Municipal Power Agency 30 MW Energy Sale | | Feb. 29, 2012 | | 0 | | Energy | | May 1, 2012 –
April 30, 2017 |
Minnesota Municipal Power Agency 30 MW Surplus Energy Sale | | Sept. 1, 2012 | | 0 | | Surplus Energy | | Sept. 1, 2012 –
April 30, 2017 |
| | | | |
Wisconsin Public Service 100 MW System Power Sale | | May 19, 2011 | | 100 | | System Participation
Power | | June 1, 2021 –
May 31, 2029 |
Wisconsin Public Service 108 MW Surplus Energy Sale | | May 19, 2011 | | 0 | | Energy | | June 1, 2012 –
May 31, 2016 |
Wisconsin Public Service 108 MW System Power Sale | | Feb. 26, 2014 | | 108 | | System Participation
Power | | June 1, 2016 –
May 31, 2021 |
Wisconsin Public Service 8 MW Energy Sale | | Feb. 26, 2014 | | 0 | | Energy | | June 1, 2023 –
May 31, 2029 |
Wisconsin Public Service 308 MW System Power Sale | | Feb. 26, 2014 | | 308 | | System Participation
Power | | Jan. 1, 2030 –
May 31, 2036 |
| | | | |
SaskPower 25 MW System Power Sale | | Jun. 30, 2014 | | 25 | | System Participation
Power | | Nov. 1, 2015 –
May 31, 2022 |
45
Definitions:
System Power Sale: Annual sales of both Capacity and Firm Energy.
Diversity Exchange: Seasonal swap of Capacity and Firm Energy.
Surplus Energy Sale/Energy Sale: Long-term surplus energy sale contracts with customers whereby Manitoba Hydro will offer energy under the contract when it has energy that is surplus to domestic customer and dependable export customer requirements.
(S): Summer season.
(W): Winter season.
CANADIAN FOREIGN EXCHANGE
Canada maintains a floating exchange rate. Average noon spot exchange rates against the U.S. dollar are shown in the table below for the calendar years 2009 through 2013.
| | | | | | | | | | | | | | | | | | | | |
| | | Average Noon Spot Rates | |
Foreign Currency | | 2009 | | | 2010 | | | 2011 | | | 2012 | | | 2013 | |
| | | (Canadian dollars per unit of foreign currency) | |
United States Dollars (1) | | $ | 1.1420 | | | $ | 1.0299 | | | $ | 0.9891 | | | $ | 0.9996 | | | $ | 1.0299 | |
| (1) | The high and low spot rates for the U.S. dollar expressed in Canadian dollars are as follows: |
| | | | | | | | | | | | | | | | | | | | |
| | | 2009 | | | 2010 | | | 2011 | | | 2012 | | | 2013 | |
High | | $ | 1.3066 | | | $ | 1.0778 | | | $ | 1.0604 | | | $ | 1.0418 | | | $ | 1.1107 | |
Low | | | 0.9755 | | | | 0.9961 | | | | 0.9449 | | | | 0.9710 | | | | 1.0187 | |
Source: Bank of Canada.
At March 31, 2014, the noon spot exchange rate for U.S. dollars as reported by Bank of Canada, expressed in Canadian dollars, was $1.1053.
46
TABLES OF SUPPLEMENTARY INFORMATION
| | | | | | |
| | | | | Page | |
| I. | | Summary Financial Statements of the Province | | | | |
| | |
| | — Consolidated Statement of Financial Position | | | 48 | |
| | |
| | — Consolidated Statement of Revenue and Expense | | | 49 | |
| | |
| | — Consolidated Statement of Accumulated Deficit | | | 50 | |
| | |
| | — Consolidated Statement of Cash Flow | | | 51 | |
| | |
| II. | | Summary Financial Statements — Government Business Enterprises | | | | |
| | |
| | — Consolidated Operating Results and Financial Position | | | 52 | |
| | |
| III. | | Statement of Direct Funded Borrowings of the Province | | | 53 | |
| | |
| IV. | | Statement of Securities Guaranteed by the Province | | | 58 | |
| | |
| V. | | The Manitoba Hydro-Electric Board Financial Statements | | | | |
| | |
| | — Consolidated Statement of Operations | | | 59 | |
| | |
| | — Consolidated Balance Sheet | | | 60 | |
| | |
| | — Consolidated Statement of Cash Flows | | | 61 | |
| | |
| | — Consolidated Statement of Comprehensive Income | | | 62 | |
47
I. SUMMARY FINANCIAL STATEMENTS
CONSOLIDATED STATEMENT OF FINANCIAL POSITION (1)
AS AT MARCH 31, 2014
(with comparative figures for 2013)
| | | | | | | | |
| | | 2013 | | | 2014 | |
| | | (In millions of dollars) | |
FINANCIAL ASSETS | | | | | | | | |
Cash and cash equivalents | | $ | 1,293 | | | $ | 1,600 | |
Temporary investments | | | 229 | | | | 202 | |
Amounts receivable | | | 1,661 | | | | 1,548 | |
Inventories for resale | | | 74 | | | | 75 | |
Portfolio investments | | | 2,466 | | | | 2,293 | |
Loans and advances | | | 1,096 | | | | 1,145 | |
Equity in GBEs | | | 3,766 | | | | 3,820 | |
| | | | | | | | |
TOTAL FINANCIAL ASSETS | | $ | 10,585 | | | $ | 10,683 | |
| | | | | | | | |
LIABILITIES | | | | | | | | |
Borrowings | | $ | 20,788 | | | $ | 21,946 | |
Accounts payable, accrued charges, provisions and unearned revenue | | | 3,862 | | | | 4,043 | |
Pension liability | | | 1,828 | | | | 2,038 | |
| | | | | | | | |
TOTAL LIABILITIES | | | 26,478 | | | | 28,027 | |
| | | | | | | | |
NET DEBT | | | (15,893 | ) | | | (17,344 | ) |
| | | | | | | | |
NON-FINANCIAL ASSETS | | | | | | | | |
Inventories held for use | | | 55 | | | | 62 | |
Prepaid expense | | | 60 | | | | 58 | |
Tangible capital assets | | | 9,842 | | | | 10,599 | |
| | | | | | | | |
| | | 9,957 | | | | 10,719 | |
| | | | | | | | |
ACCUMULATED DEFICIT | | $ | (5,936 | ) | | $ | (6,625 | ) |
| | | | | | | | |
| (1) | Certain comparative figures are restated to reflect prior period restatements and to conform with the 2014 presentation. |
48
I. SUMMARY FINANCIAL STATEMENTS
CONSOLIDATED STATEMENT OF REVENUE AND EXPENSE (1)
FOR THE YEAR ENDED MARCH 31, 2014
(with comparative figures for 2013)
| | | | | | | | |
| | | 2013 | | | 2014 | |
| | | (In millions of dollars) | |
REVENUE | | | | | | | | |
Income taxes: | | | | | | | | |
Corporate income tax | | $ | 456 | | | $ | 468 | |
Individual income tax | | | 2,846 | | | | 2,978 | |
Other taxes: | | | | | | | | |
Retail sales tax | | | 1,767 | | | | 2,028 | |
Fuel taxes | | | 332 | | | | 329 | |
Levy for health and education | | | 296 | | | | 315 | |
Mining tax | | | 38 | | | | 8 | |
Education property tax | | | 380 | | | | 434 | |
Other taxes | | | 552 | | | | 609 | |
Fees and other revenue | | | 2,013 | | | | 2,178 | |
Federal transfers: | | | | | | | | |
Equalization | | | 1,872 | | | | 1,799 | |
Canada Health and Canada Social Transfers | | | 1,487 | | | | 1,524 | |
Shared cost and other | | | 594 | | | | 519 | |
Net income from GBEs | | | 739 | | | | 783 | |
Sinking funds and other investment earnings | | | 242 | | | | 242 | |
| | | | | | | | |
TOTAL REVENUE | | | 13,614 | | | | 14,214 | |
| | | | | | | | |
EXPENSE | | | | | | | | |
Health | | | 5,454 | | | | 5,706 | |
Education | | | 3,339 | | | | 3,562 | |
Family Services | | | 1,035 | | | | 1,074 | |
Community, Economic and Resource Development | | | 2,423 | | | | 2,415 | |
Justice and Other Expenditures | | | 1,084 | | | | 1,158 | |
Debt Servicing | | | 839 | | | | 821 | |
| | | | | | | | |
TOTAL EXPENSE | | | 14,174 | | | | 14,736 | |
| | | | | | | | |
NET LOSS FOR THE YEAR | | $ | (560 | ) | | $ | (522 | ) |
| | | | | | | | |
| (1) | Certain comparative figures are restated to reflect prior period restatements and to conform with 2014 presentation. |
49
I. SUMMARY FINANCIAL STATEMENTS
CONSOLIDATED STATEMENT OF ACCUMULATED DEFICIT
FOR THE YEAR ENDED MARCH 31, 2014
(with comparative figures for 2013)
| | | | | | | | |
| | | 2013 | | | 2014 | |
| | | (In millions of dollars) | |
Opening accumulated deficit | | $ | (5,344 | ) | | $ | (5,936 | ) |
Other Comprehensive Income | | | (32 | ) | | | (167 | ) |
Net Loss for the year | | | (560 | ) | | | (522 | ) |
| | | | | | | | |
Closing accumulated deficit, as restated | | $ | (5,936 | ) | | $ | (6,625 | ) |
| | | | | | | | |
Note:
During 2014, all GBE’s except Manitoba Hydro applied IAS 19 [revised] — Employee Benefits retrospectively in accordance with the transitional provisions set out in the revised standard. The adoption of IAS 19 [revised] resulted in a decrease to equity and an increase to other comprehensive income (OCI) of $20 million. There is no impact to the overall equity reported for the Government.
50
I. SUMMARY FINANCIAL STATEMENTS
CONSOLIDATED STATEMENT OF CASH FLOW (1)
FOR THE YEAR ENDED MARCH 31, 2014
(with comparative figures for 2013)
| | | | | | | | |
| | | 2013 | | | 2014 | |
| | | (In millions of dollars) | |
Cash and cash equivalents provided by (used in) | | | | | | | | |
Operating activities | | | | | | | | |
Net loss for the year | | $ | (560 | ) | | $ | (522 | ) |
Changes in non-cash items: | | | | | | | | |
Temporary investments | | | 12 | | | | 27 | |
Amounts receivable | | | (45 | ) | | | 94 | |
Valuation allowance | | | 32 | | | | 55 | |
Inventories | | | (5 | ) | | | (8 | ) |
Prepaids | | | (10 | ) | | | 2 | |
Accounts payable, accrued charges, provisions and deferrals | | | (74 | ) | | | 181 | |
Pension liability | | | 194 | | | | 210 | |
Amortization of foreign currency fluctuation | | | 5 | | | | 6 | |
Amortization of debt discount | | | 1 | | | | (42 | ) |
Unamortized losses on derivative contracts | | | 53 | | | | 12 | |
Loss on disposal of tangible capital assets | | | 17 | | | | 22 | |
Amortization of tangible capital assets | | | 511 | | | | 554 | |
| | | | | | | | |
| | | 131 | | | | 591 | |
Other Comprehensive Income | | | (32 | ) | | | (167 | ) |
Changes in equity in GBEs | | | (149 | ) | | | (54 | ) |
| | | | | | | | |
Cash provided by (used in) operating activities | | | (50 | ) | | | 370 | |
| | | | | | | | |
Capital Activities | | | | | | | | |
Acquisition of tangible capital assets | | | (1,273 | ) | | | (1,333 | ) |
| | | | | | | | |
Cash used in capital activities | | | (1,273 | ) | | | (1,333 | ) |
| | | | | | | | |
Investing activities | | | | | | | | |
Investments purchased | | | (1,833 | ) | | | (2,758 | ) |
Investments sold or matured | | | 1,369 | | | | 2,276 | |
| | | | | | | | |
Cash used in investing activities | | | (464 | ) | | | (482 | ) |
| | | | | | | | |
Financing activities | | | | | | | | |
Debt issued | | | 4,060 | | | | 4,735 | |
Debt redeemed | | | (2,318 | ) | | | (2,983 | ) |
| | | | | | | | |
Cash provided by financing activities | | | 1,742 | | | | 1,752 | |
| | | | | | | | |
Increase (Decrease) in cash and cash equivalents | | | (45 | ) | | | 307 | |
Cash and cash equivalents, beginning of year | | | 1,338 | | | | 1,293 | |
| | | | | | | | |
Cash and cash equivalents, end of year | | $ | 1,293 | | | $ | 1,600 | |
| | | | | | | | |
| (1) | Certain comparative figures are restated to reflect prior period restatements and to conform with 2014 presentation. |
51
II. SUMMARY FINANCIAL STATEMENTS — GOVERNMENT BUSINESS ENTERPRISES (1)
CONSOLIDATED OPERATING RESULTS AND FINANCIAL POSITION
FOR THE YEAR ENDED MARCH 31, 2014 (2)
(with comparative figures for 2013)
| | | | | | | | | | | | | | | | | | | | |
| | | Utilities | | | Insurance | | | Finance | | | Total
2014 | | | Total
2013
(Note) | |
| | | (In millions of dollars) | |
Changes in Equity | | | | | | | | | | | | | | | | | | | | |
Results of Operations | | | | | | | | | | | | | | | | | | | | |
Revenue from Operations | | $ | 2,329 | | | $ | 1,637 | | | $ | 1,463 | | | $ | 5,429 | | | $ | 5,000 | |
| | | | | | | | | | | | | | | | | | | | |
Expenses: | | | | | | | | | | | | | | | | | | | | |
Operations | | | 1,684 | | | | 1,582 | | | | 900 | | | | 4,166 | | | | 3,765 | |
Debt servicing | | | 471 | | | | — | | | | 9 | | | | 480 | | | | 496 | |
| | | | | | | | | | | | | | | | | | | | |
Total Expenses | | | 2,155 | | | | 1,582 | | | | 909 | | | | 4,646 | | | | 4,261 | |
| | | | | | | | | | | | | | | | | | | | |
Net Income | | | 174 | | | | 55 | | | | 554 | | | | 783 | | | | 739 | |
Other comprehensive income (loss) | | | (203 | ) | | | 28 | | | | 8 | | | | (167 | ) | | | (32 | ) |
| | | | | | | | | | | | | | | | | | | | |
Total comprehensive income (loss) | | | (29 | ) | | | 83 | | | | 562 | | | | 616 | | | | 707 | |
Transfers to the Government | | | — | | | | — | | | | (562 | ) | | | (562 | ) | | | (558 | ) |
| | | | | | | | | | | | | | | | | | | | |
Net increase in equity in GBEs | | $ | (29 | ) | | $ | 83 | | | $ | — | | | $ | 54 | | | $ | 149 | |
| | | | | | | | | | | | | | | | | | | | |
| (1) | GBEs consist of the following as at March 31, 2014: |
Utilities:
The Manitoba Hydro-Electric Board
Insurance:
The Deposit Guarantee Corporation of Manitoba
The Manitoba Public Insurance Corporation
The Workers Compensation Board
Finance:
Manitoba Liquor & Lotteries Corporation
| (2) | For enterprises whose fiscal year is prior to March 31, the amounts reflected are as at their fiscal year end. |
| (3) | During 2014, all GBE’s except Manitoba Hydro applied IAS 19 [revised] – Employee Benefits retrospectively in accordance with the transitional provisions set out in the revised standard. The adoption of IAS 19 [revised] resulted in a decrease to equity and an increase to other comprehensive income (OCI) of $20 million. There is no impact to the overall equity reported for the Government. |
52
III. STATEMENT OF DIRECT FUNDED BORROWINGS OF THE PROVINCE
AS AT MARCH 31, 2014
| | | | | | | | | | | | | | |
Series | | Date of Maturity | | Year of Issue | | | InterestRate (%) | | Amount Outstanding | | | Ref |
| | | | | | | | | | (In thousands of dollars) | | | |
(A) Payable in Canadian Dollars: | | | | | | | | | | | | | | |
Debenture Loans | | | | | | | | | | | | | | |
FM | | 1-Sep-14 | | | 2009 | | | 3.05 | | | 250,000 | | | (1) |
FC | | 3-Dec-14 | | | 2004 | | | 4.80 | | | 600,000 | | | (1) |
EY | | 3-Dec-15 | | | 2003 | | | 5.20 | | | 450,000 | | | (1) |
FF | | 1-Mar-16 | | | 2005 | | | 4.30 | | | 500,000 | | | (1) |
FW | | 1-Dec-16 | | | 2011 | | | 2.05 | | | 600,000 | | | (1) |
FX | | 1-Jun-17 | | | 2012 | | | 1.85 | | | 300,000 | | | (1) |
FJ | | 22-Sep-17 | | | 2007 | | | 4.70 | | | 250,000 | | | (1) |
PC | | 5-Mar-18 | | | 2007 | | | 4.25 | | | 250,000 | | | (1) |
GD | | 5-Sep-18 | | | 2013 | | | 1.85 | | | 300,000 | | | (1) |
FP | | 3-Jun-20 | | | 2010 | | | 4.15 | | | 800,000 | | | (1) |
FV | | 1-Dec-21 | | | 2011 | | | 3.85 | | | 600,000 | | | (1) |
GF | | 2-Jun-23 | | | 2013 | | | 2.55 | | | 900,000 | | | (1) |
GH | | 2-Jun-24 | | | 2014 | | | 3.30 | | | 300,000 | | | (1) |
DT | | 22-Dec-25 | | | 1995 | | | 7.75 | | | 300,000 | | | (1)(3) |
CL | | 5-Mar-31 | | | 1991 | | | 10.5 | | | 599,945 | | | (1) |
FA | | 5-Mar-37 | | | 2004 | | | 5.70 | | | 700,000 | | | (1) |
PB | | 5-Mar-38 | | | 2007 | | | 4.60 | | | 950,000 | | | (1) |
FK | | 5-Mar-40 | | | 2008 | | | 4.65 | | | 800,000 | | | (1) |
FR | | 5-Mar-41 | | | 2010 | | | 4.10 | | | 950,000 | | | (1) |
FT | | 5-Mar-42 | | | 2011 | | | 4.40 | | | 400,000 | | | (1) |
GA | | 5-Mar-43 | | | 2012 | | | 3.35 | | | 550,000 | | | (1) |
GG | | 5-Mar-45 | | | 2013 | | | 4.05 | | | 550,000 | | | (1) |
FN | | 5-Mar-50 | | | 2009 | | | 4.70 | | | 350,000 | | | (1) |
| | | | | | | | | | | | | | |
Total Debenture Loans | | | | | | | | | | | 12,249,945 | | | |
| | | | | | | | | | | | | | |
Medium-Term Notes | | | | | | | | | | | | | | |
C111-MTN | | 17-Apr-14 | | | 2010 | | | Floating | | | 145,000 | | | (1) |
C131-MTN | | 3-Dec-14 | | | 2012 | | | 1.40 | | | 25,000 | | | (1) |
C115-MTN | | 4-May-15 | | | 2010 | | | Floating Step | | | 100,000 | | | (1) |
C121-MTN | | 19-Apr-16 | | | 2011 | | | Floating | | | 430,000 | | | (1) |
C123-MTN | | 15-Sept-16 | | | 2011 | | | Floating | | | 350,000 | | | (1) |
S001-MTN | | 15-Sep-16 | | | 2011 | | | Floating | | | 75,000 | | | (1) |
C126-MTN | | 3-Apr-17 | | | 2012 | | | Floating | | | 300,000 | | | (1) |
C011-MTN | | 22-Sep-17 | | | 1997 | | | 6.50 | | | 280,454 | | | (1) |
C012-MTN | | 22-Sep-17 | | | 1997 | | | 6.50 | | | 100,000 | | | (1) |
C132-MTN | | 2-Apr-18 | | | 2012 | | | Floating | | | 404,000 | | | (1) |
C023-MTN | | 15-Nov-18 | | | 1998 | | | 5.50 | | | 250,000 | | | (1) |
C084-MTN/RRB | | 1-Dec-18 | | | 2006 | | | 1.738 | | | 96,767 | | | (1) |
C135-MTN | | 11-Feb-19 | | | 2013 | | | Floating | | | 720,000 | | | (1) |
C077-MTN | | 11-Feb-20 | | | 2005 | | | STEP | | | 625,000 | | | (5) |
C133-MTN | | 13-Feb-23 | | | 2013 | | | STEP | | | 13,000 | | | (1) |
C119-MTN | | 5-Sep-25 | | | 2010 | | | 4.40 | | | 715,000 | | | (1) |
C127-MTN | | 3-May-27 | | | 2012 | | | STEP | | | 22,000 | | | (6) |
C136-MTN | | 5-Sep-29 | | | 2013 | | | 3.25 | | | 225,000 | | | (1) |
C074-MTN | | 3-Dec-29 | | | 2004 | | | STEP | | | 100,000 | | | (6) |
C116-MTN | | 5-Mar-31 | | | 2010 | | | 6.30 | | | 100,000 | | | (5) |
53
| | | | | | | | | | | | | | |
Series | | Date of Maturity | | Year of Issue | | | Interest
Rate (%) | | Amount Outstanding | | | Ref |
| | | | | | | | | | (In thousands of dollars) | | | |
C134-MTN | | 6-May-31 | | | 2013 | | | 3.05 | | | 25,000 | | | (1) |
C049-MTN | | 26-Jul-32 | | | 2002 | | | 4.31 | | | 50,000 | | | (1) |
C052-MTN | | 29-Oct-32 | | | 2002 | | | 5.975 | | | 30,000 | | | (1) |
C076-MTN | | 19-Jan-35 | | | 2005 | | | STEP | | | 75,000 | | | (5) |
C086-MTN | | 30-Jun-36 | | | 2006 | | | STEP | | | 50,000 | | | (6) |
C087-MTN/RRB | | 1-Dec-36 | | | 2006 | | | 2.00 | | | 111,868 | | | (1) |
C124-MTN | | 5-Mar-39 | | | 2011 | | | 4.25 | | | 210,000 | | | (1) |
C091-MTN | | 16-Jul-39 | | | 2007 | | | STEP | | | 100,000 | | | (10) |
C031-MTN | | 5-Mar-40 | | | 2001 | | | 6.20 | | | 276,000 | | | (1) |
C040-MTN | | 5-Mar-42 | | | 2002 | | | 6.00 | | | 350,000 | | | (1) |
C068-MTN | | 5-Mar-44 | | | 2004 | | | 5.80 | | | 120,000 | | | (1) |
C092-MTN | | 5-Mar-44 | | | 2007 | | | 5.00 | | | 157,035 | | | (1) |
C129-MTN | | 5-Sept-52 | | | 2012 | | | 3.15 | | | 345,000 | | | (1) |
C110-MTN | | 5-Mar-60 | | | 2009 | | | 5.20 | | | 325,000 | | | (1) |
C109-MTN | | 5-Mar-63 | | | 2009 | | | 4.625 | | | 105,000 | | | (1) |
C137-MTN | | 5-Mar-63 | | | 2013 | | | 3.45 | | | 222,000 | | | (1) |
| | | | | | | | | | | | | | |
| | | | | | | | | | | 7,628,124 | | | |
| | | | | | | | | | | | | | |
L004-MTN | | 22-Sep-17 | | | 2000 | | | 6.50 | | | 25,000 | | | (1) |
L003-MTN | | 15-Nov-18 | | | 2000 | | | 5.50 | | | 75,000 | | | (1) |
| | | | | | | | | | | | | | |
| | | | | | | | | | | 100,000 | | | |
| | | | | | | | | | | | | | |
H053 | | 19-Apr-16 | | | 2011 | | | Floating | | | 50,000 | | | (1) |
H033 | | 15-Nov-18 | | | 2007 | | | 5.50 | | | 80,000 | | | (1) |
H058 | | 15-May-20 | | | 2013 | | | Floating | | | 100,000 | | | (1) |
H056 | | 06-Sep-22 | | | 2012 | | | Step-up | | | 20,000 | | | (5) |
H060 | | 5-Sep-29 | | | 2014 | | | 3.25 | | | 100,000 | | | (1) |
H061 | | 5-Sep-33 | | | 2014 | | | 3.75 | | | 50,000 | | | (1) |
| | | | | | | | | | | | | | |
| | | | | | | | | | | 400,000 | | | |
| | | | | | | | | | | | | | |
D165-MTN | | 15-Sep-16 | | | 2011 | | | Floating | | | 200,000 | | | (1) |
D147-MTN | | 15-Nov-18 | | | 2005 | | | 5.50 | | | 50,000 | | | (1) |
D152-MTN | | 15-Nov-18 | | | 2007 | | | 5.50 | | | 45,000 | | | (1) |
D150-MTN/RRB | | 1-Dec-18 | | | 2006 | | | 1.738 | | | 96,767 | | | (1) |
D025-MTN | | 5-Mar-31 | | | 2000 | | | 6.30 | | | 310,000 | | | (1) |
D129-MTN | | 5-Mar-31 | | | 2005 | | | STEP | | | 100,000 | | | (5) |
| | | | | | | | | | | | | | |
| | | | | | | | | | | 801,767 | | | |
| | | | | | | | | | | | | | |
Total Medium Term Notes | | | 8,929,890 | | | |
| | | | | | | | | | | | | | |
Foreign Issues Swapped to Canadian Dollars: | | | | | | | | | | | | | | |
FS | | 28-Apr-14 | | | 2011 | | | N/A | | | 620,250 | | | |
C106 | | 30-Apr-14 | | | 2009 | | | N/A | | | 95,600 | | | |
FL | | 5-May-14 | | | 2009 | | | N/A | | | 330,000 | | | |
FI | | 17-Sep-14 | | | 2007 | | | N/A | | | 255,000 | | | |
FQ | | 15-Jul-15 | | | 2010 | | | N/A | | | 628,800 | | | |
FE | | 1-Sep-15 | | | 2005 | | | N/A | | | 255,000 | | | |
AZ | | 17-Jul-16 | | | 1986 | | | N/A | | | 200,631 | | | |
C037 | | 1-Nov-16 | | | 2001 | | | N/A | | | 13,110 | | | |
C036 | | 21-Nov-16 | | | 2001 | | | N/A | | | 39,340 | | | |
FY | | 3-Apr-17 | | | 2012 | | | N/A | | | 593,400 | | | |
BM | | 15-Jan-18 | | | 1988 | | | N/A | | | 254,960 | | | |
GE | | 1-Jun-18 | | | 2013 | | | N/A | | | 102,470 | | | |
54
| | | | | | | | | | | | | | |
Series | | Date of Maturity | | Year of Issue | | | Interest
Rate (%) | | Amount Outstanding | | | Ref |
| | | | | | | | | | (In thousands of dollars) | | | |
BU | | 1-Dec-18 | | | 1988 | | | N/A | | | 136,375 | | | |
FZ | | 30-May-19 | | | 2019 | | | N/A | | | 615,750 | | | |
CB | | 15-Jan-20 | | | 1990 | | | N/A | | | 369,400 | | | |
CD | | 1-Apr-20 | | | 1990 | | | N/A | | | 412,815 | | | |
GB | | 8-Aug-22 | | | 2012 | | | N/A | | | 209,700 | | | |
GC | | 6-Sep-22 | | | 2012 | | | N/A | | | 592,710 | | | |
H059 | | 13-Sep-23 | | | 2013 | | | N/A | | | 96,100 | | | |
C113 | | 29-Mar-30 | | | 2010 | | | N/A | | | 102,923 | | | |
S002 | | 31-Oct-40 | | | 2011 | | | N/A | | | 55,864 | | | |
H057 | | 17-Nov-42 | | | 2012 | | | N/A | | | 39,463 | | | |
C120 | | 14-Oct-50 | | | 2010 | | | N/A | | | 70,300 | | | |
C128 | | 25-Jun-52 | | | 2012 | | | N/A | | | 64,420 | | | |
| | | | | | | | | | | | | | |
| | | | | | | | | | | 6,154,381 | | | |
| | | | | | | | | | | | | | |
Total Canadian Dollars | | | 27,334,216 | | | |
| | | | | | | | | | | | | | |
(B) Payable in U.S. Dollars: | | | | | | | | | | | | | | |
FS | | 28-Apr-14 | | | 2011 | | | 1.375 | | | 730,780 | | | (1)(2) |
FQ | | 15-Jul-15 | | | 2010 | | | 2.625 | | | 628,800 | | | (1)(2) |
AZ | | 17-Jul-16 | | | 1986 | | | 7.75 | | | 165,121 | | | (1)(2) |
FH | | 6-Dec-16 | | | 2006 | | | 4.90 | | | 552,650 | | | (1) |
FY | | 3-Apr-17 | | | 2012 | | | 1.30 | | | 593,400 | | | (1)(2) |
BM | | 15-Jan-18 | | | 1988 | | | 9.125 | | | 221,060 | | | (1)(2) |
GE | | 1-Jun-18 | | | 2013 | | | 1.125 | | | 544,590 | | | (1)(2) |
EE | | 15-Sep-18 | | | 1988 | | | 9.50 | | | 221,060 | | | (1) |
BU | | 1-Dec-18 | | | 1988 | | | 9.625 | | | 331,590 | | | (1)(2) |
FZ | | 30-May-19 | | | 2012 | | | 1.750 | | | 663,180 | | | (1)(2) |
CB | | 15-Jan-20 | | | 1990 | | | 8.80 | | | 276,325 | | | (1)(2) |
CD | | 1-Apr-20 | | | 1990 | | | 9.25 | | | 331,590 | | | (1)(2) |
CO | | 15-Sep-21 | | | 1991 | | | 8.875 | | | 331,590 | | | (1) |
GC | | 06-Sep-22 | | | 2012 | | | 2.100 | | | 663,180 | | | (1)(2) |
| | | | | | | | | | | | | | |
| | | | | | | | | | | 6,254,916 | | | |
| | | | | | | | | | | | | | |
Swapped to Canadian Dollars: | | | | | | | | | | | | | | |
FS | | 28-Apr-14 | | | 2011 | | | N/A | | | (620,250 | ) | | |
FQ | | 15-Jul-15 | | | 2010 | | | N/A | | | (628,800 | ) | | |
AZ | | 17-Jul-16 | | | 1986 | | | N/A | | | (165,121 | ) | | |
FY | | 3-Apr-17 | | | 2012 | | | N/A | | | (593,400 | ) | | |
BM | | 15-Jan-18 | | | 1988 | | | N/A | | | (221,060 | ) | | |
GE | | 1-Jun-18 | | | 2013 | | | N/A | | | (102,470 | ) | | |
BU | | 1-Dec-18 | | | 1988 | | | N/A | | | (110,530 | ) | | |
FZ | | 30-May-19 | | | 2012 | | | N/A | | | (663,180 | ) | | |
CB | | 15-Jan-20 | | | 1990 | | | N/A | | | (276,325 | ) | | |
CD | | 1-Apr-20 | | | 1990 | | | N/A | | | (331,590 | ) | | |
GC | | 6-Sep-22 | | | 2012 | | | N/A | | | (663,180 | ) | | |
| | | | | | | | | | | | | | |
| | | | | | | | | | | (4,375,906 | ) | | |
| | | | | | | | | | | | | | |
Total US Dollars | | | | | | | | | | | 1,879,010 | | | |
| | | | | | | | | | | | | | |
55
| | | | | | | | | | | | | | |
Series | | Date of Maturity | | Year of Issue | | | Interest
Rate (%) | | Amount Outstanding | | | Ref |
| | | | | | | | | | (In thousands of dollars) | | | |
(C) Payable in Swiss Francs: | | | | | | | | | | | | | | |
FI | | 17-Sep-14 | | | 2007 | | | 2.625 | | | 337,527 | | | (1)(2) |
FL | | 5-May-14 | | | 2009 | | | 2.26 | | | 375,030 | | | (1)(2) |
| | | | | | | | | | | | | | |
| | | | | | | | | | | 712,557 | | | |
| | | | | | | | | | | | | | |
Swapped to Canadian Dollars: | | | | | | | | | | | | | | |
FI | | 17-Sep-14 | | | 2007 | | | 2.632 | | | (337,527 | ) | | |
FL | | 5-May-14 | | | 2009 | | | 2.26 | | | (375,030 | ) | | |
| | | | | | | | | | | | | | |
| | | | | | | | | | | (712,557 | ) | | |
| | | | | | | | | | | | | | |
Total Swiss Francs | | | | | | | | | | | 0 | | | |
| | | | | | | | | | | | | | |
(D) Payable in Japanese Yen: | | | | | | | | | | | | | | |
C036 | | 21-Nov-16 | | | 2001 | | | 2.00 | | | 32,190 | | | (1)(2) |
C037 | | 21-Nov-16 | | | 2001 | | | 2.03 | | | 10,730 | | | (1)(2) |
| | | | | | | | | | | | | | |
| | | | | | | | | | | 42,920 | | | |
| | | | | | | | | | | | | | |
Japanese Yen Issues swapped to Canadian Dollars: | | | | | | | | | | | | | | |
C036 | | 21-Nov-16 | | | 2001 | | | 2.00 | | | (32,190 | ) | | |
C037 | | 21-Nov-16 | | | 2001 | | | 2.03 | | | (10,730 | ) | | |
| | | | | | | | | | | | | | |
| | | | | | | | | | | (42,920 | ) | | |
| | | | | | | | | | | | | | |
Total Japanese Yen | | | | | | | | | | | 0 | | | |
| | | | | | | | | | | | | | |
(E) Payable in New Zealand Dollars: | | | | | | | | | | | | | | |
FE | | 1-Sep-15 | | | 2005 | | | 6.38 | | | 287,910 | | | (1)(2) |
| | | | | | | | | | | | | | |
| | | | | | | | | | | 287,910 | | | |
| | | | | | | | | | | | | | |
Swapped to Canadian Dollars: | | | | | | | | | | | | | | |
FE | | 1-Sep-15 | | | 2005 | | | Floating | | | (287,910 | ) | | |
| | | | | | | | | | | | | | |
| | | | | | | | | | | (287,910 | ) | | |
| | | | | | | | | | | | | | |
Total New Zealand Dollars | | | | | | | | | | | 0 | | | |
| | | | | | | | | | | | | | |
(F) Payable in Hong Kong Dollars: | | | | | | | | | | | | | | |
C106 | | 1-Sep-15 | | | 2009 | | | 3.00 | | | 85,496 | | | (1)(2) |
| | | | | | | | | | | | | | |
| | | | | | | | | | | 85,496 | | | |
| | | | | | | | | | | | | | |
Swapped to Canadian Dollars: | | | | | | | | | | | | | | |
C106 | | 1-Sep-15 | | | 2009 | | | Floating | | | (85,496 | ) | | |
| | | | | | | | | | | | | | |
| | | | | | | | | | | (85,496 | ) | | |
| | | | | | | | | | | | | | |
Total Hong Kong Dollars | | | | | | | | | | | 0 | | | |
| | | | | | | | | | | | | | |
(H) Australian Dollar: | | | | | | | | | | | | | | |
GB | | 8-Aug-22 | | | 2012 | | | 4.25 | | | 205,000 | | | |
H059 | | 13-Sep-23 | | | 2013 | | | 5.25 | | | 102,500 | | | (1)(2) |
| | | | | | | | | | | | | | |
| | | | | | | | | | | 307,500 | | | |
Swapped to Canadian Dollars: | | | | | | | | | | | | | | |
GB | | 8-Aug-22 | | | 2012 | | | 4.25 | | | (205,000 | ) | | |
H059 | | 13-Sep-23 | | | 2013 | | | 5.25 | | | (102,500 | ) | | |
| | | | | | | | | | | | | | |
| | | | | | | | | | | (307,500 | ) | | |
| | | | | | | | | | | | | | |
Total Australian Dollars | | | | | | | | | | | 0 | | | |
| | | | | | | | | | | | | | |
56
| | | | | | | | | | | | | | |
Series | | Date of Maturity | | Year of Issue | | | Interest
Rate (%) | | Amount Outstanding | | | Ref |
| | | | | | | | | | (In thousands of dollars) | | | |
(G) Payable in Euros: | | | | | | | | | | | | | | |
C113 | | 29-Mar-30 | | | 2010 | | | 4.00 | | | 114,203 | | | (1)(2) |
C120 | | 14-Oct-50 | | | 2010 | | | 3.15 | | | 76,135 | | | (1)(2) |
S002 | | 31-Oct-40 | | | 2011 | | | 3.24 | | | 60,908 | | | (1)(2) |
C128 | | 25-Jun-52 | | | 2012 | | | 2.78 | | | 76,135 | | | (1)(2) |
H057 | | 17-Nov-42 | | | 2012 | | | 2.67 | | | 47,204 | | | (1)(2) |
| | | | | | | | | | | | | | |
| | | | | | | | | | | 374,584 | | | |
| | | | | | | | | | | | | | |
Swapped to Canadian Dollars: | | | | | | | | | | | | | | |
C113 | | 29-Mar-30 | | | 2010 | | | 4.00 | | | (114,203 | ) | | |
C120 | | 14-Oct-50 | | | 2010 | | | 3.15 | | | (76,135 | ) | | |
S002 | | 31-Oct-40 | | | 2011 | | | 3.24 | | | (60,908 | ) | | |
C128 | | 25-Jun-52 | | | 2012 | | | 2.78 | | | (76,135 | ) | | |
H057 | | 17-Nov-42 | | | 2012 | | | 2.67 | | | (47,204 | ) | | |
| | | | | | | | | | | | | | |
| | | | | | | | | | | (374,584 | ) | | |
| | | | | | | | | | | | | | |
Total Euros | | | 0 | | | |
| | | | | | | | | | | | | | |
Builder Bonds (Payable in Canadian Dollars) | | | | | | | | | | | | | | |
BB # 11 | | 15-Jun-14 | | | 2009 | | | Floating | | | 38,927 | | | (6) |
| | 15-Jun-14 | | | 2009 | | | Fixed | | | 2,129 | | | (1) |
| | 15-Jun-14 | | | 2009 | | | Fixed | | | 2,647 | | | (1) |
BB # 12 | | 15-Jun-15 | | | 2010 | | | Floating | | | 35,641 | | | (6) |
| | 15-Jun-15 | | | 2010 | | | Fixed | | | 2,752 | | | (1) |
| | 15-Jun-15 | | | 2010 | | | Fixed | | | 5,861 | | | (1) |
BB # 13 | | 15-Jun-17 | | | 2012 | | | Floating | | | 100,476 | | | (6) |
| | 15-Jun-15 | | | 2012 | | | Fixed | | | 4,555 | | | (1) |
| | 15-Jun-17 | | | 2012 | | | Fixed | | | 276 | | | (1) |
| | 15-Jun-17 | | | 2012 | | | Fixed | | | 918 | | | (1) |
| | | | | | | | | | | | | | |
| | | | | | | | | | | 194,181 | | | |
| | | | | | | | | | | | | | |
Total Bonds and Debentures | | | 29,407,407 | | | |
| | | | | | | | | | | | | | |
Canada Pension Plan (Payable in Canadian Dollars) | | | | | | | | | | | | | | |
CPP237 | | 1-May-19 | | | 1999 | | | 5.67 | | | 14,639 | | | (9) |
CPPIB-001-MTN | | 7-Aug-37 | | | 2007 | | | 5.04 | | | 81,158 | | | (1) |
CPPIB-002-MTN | | 1-Dec-38 | | | 2009 | | | 4.67 | | | 102,577 | | | (1) |
CPPIB-003-MTN | | 3-Dec-40 | | | 2010 | | | 4.38 | | | 115,790 | | | (1) |
CPPIB-004-MTN | | 16-Jan-42 | | | 2012 | | | 3.42 | | | 104,459 | | | (1) |
CPPIB-005-MTN | | 3-Jul-42 | | | 2012 | | | 3.33 | | | 73,373 | | | (1) |
| | | | | | | | | | | | | | |
| | | | | | | | | | | 491,996 | | | |
| | | | | | | | | | | | | | |
Health Care Facilities | | | | | | | | | | | | | | |
| | | | | | | | | | | 386,438 | | | |
| | | | | | | | | | | | | | |
Government Business Enterprises | | | | | | | | | | | | | | |
| | | | | | | | | | | 10,000 | | | |
| | | | | | | | | | | | | | |
Government of Canada | | | | | | | | | | | | | | |
| | | | | | | | | | | 9,399 | | | |
| | | | | | | | | | | | | | |
Province of Manitoba Promissory Notes | | | | | | | | | | | | | | |
| | 2014 | | | | | | | | | 50,000 | | | |
| | | | | | | | | | | | | | |
Immigrant Investor Program (IIP) | | | | | | | | | | | | | | |
| | 2014-2019 | | | Various | | | 1.546-3.058 | | | 282,195 | | | |
| | | | | | | | | | | | | | |
Treasury Bills Payable in Canadian Dollars | | | | | | | | | | | | | | |
| | 2014 | | | Various | | | | | | 1,625,000 | | | (7) |
| | | | | | | | | | | | | | |
Total Borrowings | | | 32,262,436 | | | |
| | | | | | | | | | | | | | |
57
IV. STATEMENT OF SECURITIES GUARANTEED BY THE PROVINCE
AS AT MARCH 31, 2014
| | | | | | | | | | | | | | | | | | |
Series | | Date of
Maturity | | | Year of Issue | | | Interest
Rate (%) | | | Outstanding
Amount | | | Ref. |
| | | | | | | | | | | | (In thousands of dollars) | | | |
BORROWINGS OF SELF-SUPPORTING UTILITIES: | | | | | | | | | | | | | | | | | | |
The Manitoba Hydro-Electric Board | | | | | | | | | | | | | | | | | | |
Savings Bonds: (Payable in Canadian Dollars) | | | | | | | | | | | | | | | | | | |
Series 1 | | | 15-Jun-92 | | | | 1989 | | | | Matured | | | $ | 74 | | | |
Series 2 | | | 15-Jun-93 | | | | 1990 | | | | Matured | | | | 25 | | | |
Series 3 | | | 15-Jun-96 | | | | 1991 | | | | Matured | | | | 105 | | | |
Series 4 | | | 15-Jun-97 | | | | 1992 | | | | Matured | | | | 368 | | | |
Series 5 | | | 15-Jun-01 | | | | 1996 | | | | Matured | | | | 463 | | | |
Series 6 | | | 15-Jun-02 | | | | 1997 | | | | Matured | | | | 110 | | | |
| | | 15-Jun-00 | | | | 1997 | | | | Matured | | | | 152 | | | |
| | | 15-Jun-02 | | | | 1997 | | | | Matured | | | | 131 | | | |
Series 11 | | | | | | | | | | | | | | | | | | |
5 yr floating | | | 15-Jun-16 | | | | 2011 | | | | Floating | | | | 24,336 | | | (6) |
3 yr fixed annual | | | 15-Jun-14 | | | | 2011 | | | | 2.50 | | | | 8,633 | | | (1) |
5 yr fixed annual | | | 15-Jun-16 | | | | 2011 | | | | 3.15 | | | | 1,439 | | | (1) |
5 yr fixed compound | | | 15-Jun-16 | | | | 2011 | | | | 3.15 | | | | 5,856 | | | (1) |
Series 12 | | | | | | | | | | | | | | | | | | |
5 yr floating | | | 15-Jun-18 | | | | 2013 | | | | Floating | | | | 124,909 | | | (6) |
3 yr fixed annual | | | 15-Jun-16 | | | | 2013 | | | | 1.65 | | | | 3,153 | | | (1) |
5 yr fixed annual | | | 15-Jun-18 | | | | 2013 | | | | 1.75 | | | | 467 | | | (1) |
5 yr fixed compound | | | 15-Jun-18 | | | | 2013 | | | | 1.75 | | | | 236 | | | (1) |
| | | | | | | | | | | | | | | | | | |
| | | | | | | | | | | | | | | 170,458 | | | |
| | | | | | | | | | | | | | | | | | |
Manitoba Hydro Promissory Notes | | | | | | | | | | | | | | | 0 | | | |
City of Winnipeg Hydro Bonds | | | | | | | | | | | | | | | 92,000 | | | (1) |
| | | | | | | | | | | | | | | | | | |
Total Self-Supporting Guaranteed Debt | | | | | | | | | | | | | | | 262,458 | | | |
| | | | | | | | | | | | | | | | | | |
Grow Bonds | | | | | | | | | | | | | | | 2,500 | | | (8) |
| | | | | | | | | | | | | | | | | | |
Total Securities Guaranteed | | | | | | | | | | | | | | | $264,958 | | | |
| | | | | | | | | | | | | | | | | | |
References:
| 1. | Non-callable/redeemable. |
| 2. | All or part swapped into Canadian dollars. |
| 3. | All or part swapped to U.S. dollars. |
| 5. | Extendable as per terms. |
| 6. | Redeemable at holder’s option, prior to maturity. |
| 7. | 91-day Treasury Bills issued by tender in the amount of $125,000,000 weekly. |
| 8. | The Province has only guaranteed the principal portion of the issue. |
| 9. | Held by and callable at par at the option of the Minister of Finance of Canada on 6 months’ notice, subject to the requirements of the Canada Pension Plan. |
| 10. | Puttable at the holder’s option. |
58
V. THE MANITOBA HYDRO — ELECTRIC BOARD
CONSOLIDATED STATEMENT OF OPERATIONS
FOR THE YEAR ENDED MARCH 31,
| | | | | | | | | | | | | | | | | | | | |
| | | 2010 | | | 2011 | | | 2012 | | | 2013 | | | 2014 | |
| | | (In thousands of dollars) | |
Revenues | | | | | | | | | | | | | | | | | | | | |
Electric | | | | | | | | | | | | | | | | | | | | |
Manitoba | | $ | 1,144,891 | | | $ | 1,200,381 | | | $ | 1,192,797 | | | $ | 1,341,011 | | | $ | 1,405,301 | |
Extraprovincial | | | 426,641 | | | | 398,307 | | | | 363,044 | | | | 352,633 | | | | 439,182 | |
Other revenue | | | 27,894 | | | | 40,846 | | | | 45,322 | | | | 68,673 | | | | 69,850 | |
Natural gas | | | 453,809 | | | | 404,058 | | | | 329,274 | | | | 329,020 | | | | 414,272 | |
| | | | | | | | | | | | | | | | | | | | |
| | | 2,053,235 | | | | 2,043,592 | | | | 1,930,437 | | | | 2,091,337 | | | | 2,328,605 | |
| | | | | | | | | | | | | | | | | | | | |
Expenses | | | | | | | | | | | | | | | | | | | | |
Operating and administrative | | | 439,538 | | | | 463,712 | | | | 482,059 | | | | 533,201 | | | | 556,863 | |
Depreciation and amortization | | | 384,356 | | | | 392,749 | | | | 381,324 | | | | 422,571 | | | | 442,119 | |
Water rentals and assessments | | | 121,033 | | | | 120,163 | | | | 119,301 | | | | 117,864 | | | | 125,517 | |
Fuel and power purchased | | | 103,974 | | | | 106,169 | | | | 145,632 | | | | 133,292 | | | | 177,113 | |
Capital and other taxes | | | 99,491 | | | | 102,172 | | | | 102,609 | | | | 105,117 | | | | 117,020 | |
Cost of gas sold | | | 315,641 | | | | 260,637 | | | | 196,900 | | | | 181,438 | | | | 251,535 | |
Other expenses | | | 16,124 | | | | 22,747 | | | | 19,457 | | | | 29,973 | | | | 35,617 | |
| | | | | | | | | | | | | | | | | | | | |
| | | 1,480,157 | | | | 1,468,349 | | | | 1,447,282 | | | | 1,523,456 | | | | 1,705,784 | |
| | | | | | | | | | | | | | | | | | | | |
Net Income before Finance Expense | | | 573,078 | | | | 575,243 | | | | 483,155 | | | | 567,881 | | | | 622,821 | |
| | | | | | | | | | | | | | | | | | | | |
Finance Expense | | | | | | | | | | | | | | | | | | | | |
Interest on debt | | | 576,014 | | | | 574,613 | | | | 603,231 | | | | 638,061 | | | | 634,242 | |
Amortization of debt discount and expense | | | (10,624 | ) | | | 3,170 | | | | 573 | | | | 288 | | | | 1,752 | |
Interest applied to construction | | | (101,105 | ) | | | (138,363 | ) | | | (170,173 | ) | | | (140,565 | ) | | | (142,147 | ) |
Investment income | | | (24,100 | ) | | | (18,189 | ) | | | (13,870 | ) | | | (11,367 | ) | | | (25,664 | ) |
Dual Currency Bonds | | | (30,101 | ) | | | 3,820 | | | | 2,910 | | | | 2,984 | | | | 2,372 | |
| | | | | | | | | | | | | | | | | | | | |
| | | 410,084 | | | | 425,051 | | | | 422,671 | | | | 489,401 | | | | 470,555 | |
| | | | | | | | | | | | | | | | | | | | |
Net Income before Non-Controlling Interest | | | 162,994 | | | | 150,192 | | | | 60,484 | | | | 78,480 | | | | 152,266 | |
| | | | | | | | | | | | | | | | | | | | |
Non-Controlling Interest | | | — | | | | — | | | | — | | | | 13,160 | | | | 22,005 | |
| | | | | | | | | | | | | | | | | | | | |
Net Income | | $ | 162,994 | | | $ | 150,192 | | | $ | 60,484 | | | $ | 91,640 | | | $ | 174,272 | |
| | | | | | | | | | | | | | | | | | | | |
59
V. THE MANITOBA HYDRO — ELECTRIC BOARD
CONSOLIDATED BALANCE SHEET
AS AT MARCH 31,
| | | | | | | | |
| | | 2013 | | | 2014 | |
| | | (In thousands of dollars) | |
| ASSETS | | | | | | | | |
Property, Plant and Equipment | |
In service | | $ | 15,791,881 | | | $ | 16,189,989 | |
Less accumulated depreciation | | | 5,251,799 | | | | 5,506,283 | |
| | | | | | | | |
| | | 10,540,082 | | | | 10,683,706 | |
Construction in progress | | | 1,967,261 | | | | 2,943,333 | |
| | | | | | | | |
| | | 12,507,343 | | | | 13,627,039 | |
| | | | | | | | |
Current Assets | | | | | | | | |
Cash and cash equivalents | | | 32,454 | | | | 141,909 | |
Accounts receivable and accrued revenue | | | 420,909 | | | | 519,713 | |
Interest receivable | | | 3,687 | | | | 23 | |
Materials and supplies, at average cost | | | 93,021 | | | | 81,431 | |
| | | | | | | | |
| | | 550,071 | | | | 743,076 | |
| | | | | | | | |
Other Assets | | | | | | | | |
Other long-term assets | | | 826,003 | | | | 798,642 | |
Regulated assets | | | 306,131 | | | | 359,788 | |
Sinking fund investments | | | 352,118 | | | | 110,541 | |
| | | | | | | | |
| | | 1,484,252 | | | | 1,268,971 | |
| | | | | | | | |
| | $ | 14,541,666 | | | $ | 15,639,086 | |
| | | | | | | | |
| LIABILITIES AND RETAINED EARNINGS | | | | | | | | |
Long-Term Debt | | | | | | | | |
Long-term debt net of sinking fund investments | | $ | 8,999,378 | | | $ | 10,445,463 | |
Deferred debt costs | | | (22,007 | ) | | | (96,118 | ) |
Sinking fund investments shown as assets | | | 352,118 | | | | 110,541 | |
| | | | | | | | |
| | | 9,329,489 | | | | 10,459,886 | |
| | | | | | | | |
Current Liabilities | | | | | | | | |
Accounts payable and accrued liabilities | | | 396,778 | | | | 560,251 | |
Notes payable | | | — | | | | — | |
Accrued Interest | | | 102,470 | | | | 100,231 | |
Current portion of long-term debt | | | 656,156 | | | | 408,408 | |
| | | | | | | | |
| | | 1,155,404 | | | | 1,068,890 | |
| | | | | | | | |
Other Liabilities | | | | | | | | |
Other long-term liabilities | | | 549,757 | | | | 614,806 | |
Regulated liabilities | | | 24,484 | | | | 21,700 | |
Asset purchase obligation | | | 206,765 | | | | 206,765 | |
| | | | | | | | |
| | | 781,006 | | | | 843,271 | |
| | | | | | | | |
Contributions in Aid of Construction | | | 339,951 | | | | 381,562 | |
| | | | | | | | |
Non-Controlling Interest | | | 94,669 | | | | 73,296 | |
| | | | | | | | |
Retained Earnings | | | 2,541,678 | | | | 2,715,951 | |
| | | | | | | | |
Accumulated Other Comprehensive Income | | | 299,469 | | | | 96,230 | |
| | | | | | | | |
| | $ | 14,541,666 | | | $ | 15,639,086 | |
| | | | | | | | |
60
V. THE MANITOBA HYDRO — ELECTRIC BOARD
CONSOLIDATED STATEMENT OF CASH FLOWS
FOR THE YEAR ENDED MARCH 31,
| | | | | | | | |
| | | 2013 | | | 2014 | |
| | | (In thousands of dollars) | |
Cash Provided From (Used For) Operations | | | | | | | | |
Cash receipts from customers | | $ | 2,014,680 | | | $ | 2,198,039 | |
Cash paid to suppliers and employees | | | (980,965 | ) | | | (1,069,971 | ) |
Interest paid | | | (488,534 | ) | | | (509,974 | ) |
Interest received | | | 43,775 | | | | 72,120 | |
| | | | | | | | |
| | | 588,956 | | | | 690,214 | |
| | | | | | | | |
Cash Provided From (Used For) Financing | | | | | | | | |
Proceeds from long-term debt | | | 807,135 | | | | 1,320,326 | |
Proceeds from issues of units of Wuskwatim Power Limited Partnership | | | 7,892 | | | | 632 | |
Retirement of long-term debt | | | (242,193 | ) | | | (612,963 | ) |
Premium (Discount) on long-term debt | | | (10,000 | ) | | | — | |
Sinking fund withdrawals | | | 128,919 | | | | 415,237 | |
Mitigation liability | | | (36,403 | ) | | | (24,534 | ) |
Notes payable | | | — | | | | — | |
Advances to Taskinigahp Power Corporation/ St. Joseph Wind Farm | | | 2,203 | | | | 1,489 | |
Other | | | (22,139 | ) | | | 530 | |
| | | | | | | | |
| | | 635,414 | | | | 1,100,717 | |
| | | | | | | | |
Cash Used For Investment | | | | | | | | |
Property, plant and equipment, net of contributions | | | (1,037,267 | ) | | | (1,383,190 | ) |
Sinking fund payments and deposits Investment in subsidiaries | |
| (106,602
— | )
| |
| (209,172
— | )
|
Net obligation to the City of Winnipeg | | | (16,000 | ) | | | (16,000 | ) |
Other | | | (82,223 | ) | | | (73,115 | ) |
| | | | | | | | |
| | | (1,242,092 | ) | | | (1,681,477 | ) |
| | | | | | | | |
Net decrease in cash and cash equivalents | | | (17,722 | ) | | | 109,454 | |
Cash and cash equivalents, beginning of year | | | 50,177 | | | | 32,455 | |
| | | | | | | | |
Cash and cash equivalents, end of year | | $ | 32,455 | | | $ | 141,909 | |
| | | | | | | | |
61
V. THE MANITOBA HYDRO — ELECTRIC BOARD
CONSOLIDATED STATEMENT OF COMPREHENSIVE INCOME
FOR THE YEAR ENDED MARCH 31,
| | | | | | | | |
| | | 2013 | | | 2014 | |
| | | (In thousands of dollars) | |
Net Income | | $ | 91,640 | | | $ | 174,272 | |
Other Comprehensive Income | | | | | | | | |
Unrealized foreign exchange losses on debt in cash flow hedges | | | (30,626 | ) | | | (154,824 | ) |
Realized foreign exchange (gains) losses on debt in cash flow hedges reclassified to income | | | 1,970 | | | | (19,065 | ) |
Realized gains on early redemption of sinking funds recognized in net income | | | — | | | | (19,212 | ) |
Unrealized fair value gains (losses) on available-for-sale U.S. sinking fund investments | | | 1,157 | | | | (10,137 | ) |
| | | | | | | | |
| | | (27,499 | ) | | | (203,238 | ) |
| | | | | | | | |
Comprehensive Income | | $ | 64,141 | | | $ | (28,966 | ) |
| | | | | | | | |
CONSOLIDATED STATEMENT OF ACCUMULATED OTHER COMPREHENSIVE INCOME
FOR THE YEAR ENDED MARCH 31,
| | | | | | | | |
| | | 2013 | | | 2014 | |
| | | (In thousands of dollars) | |
Balance, beginning of year | | $ | 326,967 | | | $ | 299,468 | |
Other comprehensive loss | | | (27,499 | ) | | | (203,238 | ) |
| | | | | | | | |
Balance, end of year | | $ | 299,468 | | | $ | 96,230 | |
| | | | | | | | |
62