Exhibit 99.1
B U D G E T 2 0 1 5 / 1
SUMMARY BUDGET 2015/16
2 / B U D G E T 2 0 1 5
SUMMARY BUDGET
For the Fiscal Year Ending March 31, 2016
With Comparative Data for the Year Ending March 31, 2015
| | | | | | | | | | | | | | | | | | | | |
| | | | | | | | | | | | Per Cent Change | |
| | | | | | | | | | | | 2015/16 Budget from | |
| | | 2015/16 | | | 2014/15 | | | 2014/15 | | | 2014/15 | | | 2014/15 | |
| | | Budget | | | Forecast | | | Budget | | | Forecast | | | Budget | |
| | | (Millions of Dollars) | | | | | | | |
REVENUE SOURCE | | | | | | | | | | | | | | | | | | | | |
Income Taxes | | | 3,852 | | | | 3,674 | | | | 3,632 | | | | 4.8 | | | | 6.1 | |
Other Taxes | | | 4,121 | | | | 3,978 | | | | 4,232 | | | | 3.6 | | | | (2.6) | |
Fees and Other Revenue | | | 2,140 | | | | 2,131 | | | | 2,039 | | | | 0.4 | | | | 5.0 | |
Federal Transfers | | | 3,881 | | | | 3,912 | | | | 3,793 | | | | (0.8) | | | | 2.3 | |
Net Income of Government Business Enterprises | | | 759 | | | | 855 | | | | 692 | | | | (11.2) | | | | 9.7 | |
Sinking Funds and Other Earnings | | | 210 | | | | 234 | | | | 242 | | | | (10.3) | | | | (13.2) | |
| | | | | | | | | | | | | | | | | | | | |
TOTAL REVENUE | | | 14,963 | | | | 14,784 | | | | 14,630 | | | | 1.2 | | | | 2.3 | |
| | | | | | | | | | | | | | | | | | | | |
EXPENDITURE SECTORS | | | | | | | | | | | | | | | | | | | | |
Health | | | 6,088 | | | | 5,900 | | | | 5,787 | | | | 3.2 | | | | 5.2 | |
Education | | | 3,788 | | | | 3,709 | | | | 3,893 | | | | 2.1 | | | | (2.7) | |
Family Services | | | 1,151 | | | | 1,121 | | | | 1,107 | | | | 2.7 | | | | 4.0 | |
Community, Economic and Resource Development | | | 2,427 | | | | 2,352 | | | | 2,255 | | | | 3.2 | | | | 7.6 | |
Justice and Other Expenditures | | | 1,239 | | | | 1,319 | | | | 1,223 | | | | (6.1) | | | | 1.3 | |
Debt Servicing Costs | | | 842 | | | | 845 | | | | 872 | | | | (0.4) | | | | (3.4) | |
| | | | | | | | | | | | | | | | | | | | |
TOTAL EXPENDITURE | | | 15,535 | | | | 15,246 | | | | 15,137 | | | | 1.9 | | | | 2.6 | |
In-Year Adjustments/Lapse | | | (150) | | | | (38) | | | | (150) | | | | | | | | | |
| | | | | | | | | | | | | | | | | | | | |
NET INCOME (LOSS) | | | (422) | | | | (424) | | | | (357) | | | | | | | | | |
| | | | | | | | | | | | | | | | | | | | |
NOTES:
| • | | The 2014/15 budget numbers and the 2014/15 forecast from the Third Quarter Financial Report have been restated to be consistent with the current presentation for the GRE. |
| • | | Details of expenditures and revenue for fiscal year 2015/16, and a reconciliation to the amounts reported for core government are found in Schedules 1 and 2. |
| • | | In-Year Adjustments/Lapse could be an increase in revenue and/or decrease in expenditures. |
| • | | Numbers may not add due to rounding. |
B U D G E T 2 0 1 5 / 3
n SUMMARY BUDGET 2015/16
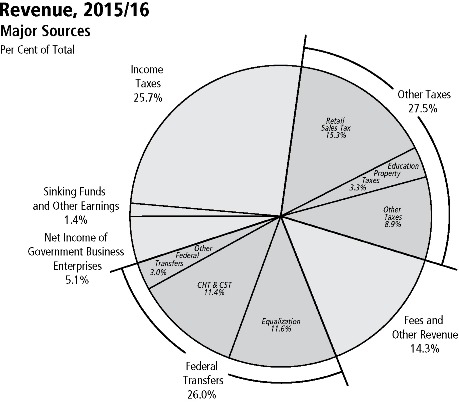
Revenue
Revenue in 2015/16 is projected to increase $179 million or 1.2% from the 2014/15 forecast.
Income tax revenue is projected to increase by $178 million, with a $148 million increase in individual income tax revenue and an increase of $30 million in corporation income tax revenue. Budget 2015 projects a $143 million, or 3.6%, increase in other tax revenue, reflecting growth in retail sales tax and fuel taxes, and an increase in capital tax on big banks, loan corporations and trust corporations, and tobacco tax. Fees and other revenue is projected to increase $9 million, or 0.4%. Net income of Government Business Enterprises (GBEs) is projected to decline $96 million, or 11.2%. Federal transfers are projected to decrease $31 million, or 0.8%.
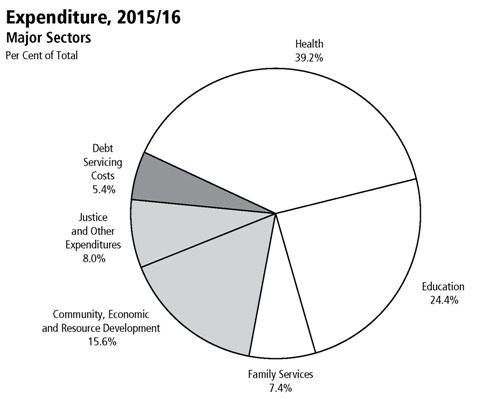
Expenditure
Total expenditure is budgeted to increase $289 million or 1.9% from the 2014/15 forecast.
The growth in health expenditure is $188 million or 3.2%. Education-related expenditure is increasing by $79 million or 2.1%. Family services is up $30 million or 2.7%. Community, economic and resource development expenditure will increase by $75 million or 3.2%. The justice and other expenditures sector will decrease by $80 million, or 6.1%. Debt servicing costs are expected to decrease by $3 million.1
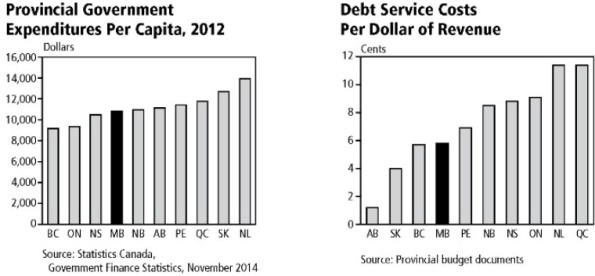
| 1 | Debt servicing costs are forecast to equal 5.6¢ of every dollar of revenue in 2015/16, down 57.6% from 13.2¢ per dollar in 1999/2000. |
4 / B U D G E T 2 0 1 5
Schedule 1
Summary Revenue Estimate: Details and Reconciliation to Core Government Estimates
Fiscal Year Ending March 31, 2016 (Thousands of Dollars)
| | | | | | | | | | | | |
| | | CORE GOVERNMENT | | | CONSOLIDATION IMPACTS | | | SUMMARY | |
| | | Revenue | | | and Revenue of Other | | | | |
| Source of Revenue | | Estimate | | | Reporting Entities | | | | |
Income Taxes | | | | | | | | | | | | |
Individual Income Tax | | | 3,261,845 | | | | - | | | | 3,261,845 | |
Corporation Income Tax | | | 590,102�� | | | | - | | | | 590,102 | |
| | | | | | | | | | | | |
Subtotal: Income Taxes | | | 3,851,947 | | | | - | | | | 3,851,947 | |
| | | | | | | | | | | | |
Other Taxes | | | | | | | | | | | | |
Corporations Taxes | | | 279,345 | | | | - | | | | 279,345 | |
Fuel Taxes | | | 335,460 | | | | 10,275 | | | | 345,735 | |
Land Transfer Tax | | | 90,000 | | | | - | | | | 90,000 | |
Levy for Health and Education | | | 466,818 | | | | (116,435) | | | | 350,383 | |
Retail Sales Tax | | | 2,289,781 | | | | 2,600 | | | | 2,292,381 | |
Tobacco Tax | | | 252,283 | | | | - | | | | 252,283 | |
Other Taxes | | | 17,854 | | | | - | | | | 17,854 | |
Education Property Taxes | | | - | | | | 493,315 | | | | 493,315 | |
| | | | | | | | | | | | |
Subtotal: Other Taxes | | | 3,731,541 | | | | 389,755 | | | | 4,121,296 | |
| | | | | | | | | | | | |
Fees and Other Revenue | | | | | | | | | | | | |
Fines and Costs and Other Legal | | | 52,090 | | | | 900 | | | | 52,990 | |
Minerals and Petroleum | | | 18,086 | | | | - | | | | 18,086 | |
Automobile and Motor Carrier Licences and Fees | | | 150,500 | | | | - | | | | 150,500 | |
Parks: Forestry and Other Conservation | | | 35,393 | | | | 300 | | | | 35,693 | |
Water Power Rentals | | | 119,026 | | | | - | | | | 119,026 | |
Service Fees and Other Miscellaneous Charges | | | 204,192 | | | | 1,282,254 | | | | 1,486,446 | |
Revenue Sharing from SOAs | | | 18,070 | | | | (18,070) | | | | - | |
Tuition Fees | | | - | | | | 277,163 | | | | 277,163 | |
| | | | | | | | | | | | |
Subtotal: Fees and Other Revenue | | | 597,357 | | | | 1,542,547 | | | | 2,139,904 | |
| | | | | | | | | | | | |
Federal Transfers | | | | | | | | | | | | |
Equalization | | | 1,738,000 | | | | - | | | | 1,738,000 | |
Canada Health Transfer (CHT) | | | 1,229,800 | | | | - | | | | 1,229,800 | |
Canada Social Transfer (CST) | | | 468,400 | | | | - | | | | 468,400 | |
Shared Cost and Other Transfers | | | 155,890 | | | | 289,410 | | | | 445,300 | |
| | | | | | | | | | | | |
Subtotal: Federal Transfers | | | 3,592,090 | | | | 289,410 | | | | 3,881,500 | |
| | | | | | | | | | | | |
Net Income of Government | | | | | | | | | | | | |
Business Enterprises (GBEs) | | | | | | | | | | | | |
Manitoba Liquor and Lotteries Corporation | | | 581,500 | | | | - | | | | 581,500 | |
Deposit Guarantee Corporation | | | - | | | | 17,155 | | | | 17,155 | |
The Manitoba Hydro-Electric Board | | | - | | | | 125,000 | | | | 125,000 | |
Workers Compensation Board | | | - | | | | 15,343 | | | | 15,343 | |
Manitoba Public Insurance Corporation | | | - | | | | 19,954 | | | | 19,954 | |
| | | | | | | | | | | | |
Subtotal: Net Income of GBEs | | | 581,500 | | | | 177,452 | | | | 758,952 | |
| | | | | | | | | | | | |
Sinking Funds and Other Earnings | | | - | | | | 209,799 | | | | 209,799 | |
| | | | | | | | | | | | |
Total Revenue Estimate | | | 12,354,435 | | | | 2,608,963 | | | | 14,963,398 | |
| | | | | | | | | | | | |
B U D G E T 2 0 1 5 / 5
Schedule 2
Summary Expenditure Estimate: Details, Reconciliation to Core Government Estimates and Summary Budget Result
Fiscal Year Ending March 31, 2016 (Thousands of Dollars)
| | | | | | | | | | | | |
| | | CORE GOVERNMENT | | | CONSOLIDATION IMPACTS | | | SUMMARY | |
| | | Expenditure | | | and Expenditures of Other | | | | |
| Sector/Department | | Estimate | | | Reporting Entities | | | | |
Health | | | | | | | | | | | | |
Health, Healthy Living and Seniors | | | 5,653,292 | | | | 434,656 | | | | 6,087,948 | |
Education | | | | | | | | | | | | |
Education and Advanced Learning | | | 2,505,431 | | | | 1,283,133 | | | | 3,788,564 | |
Family Services | | | | | | | | | | | | |
Children and Youth Opportunities | | | 49,659 | | | | (15,850) | | | | 33,809 | |
Family Services | | | 1,162,392 | | | | (45,576) | | | | 1,116,816 | |
| | | | | | | | | | | | |
Total Family Services | | | 1,212,051 | | | | (61,426) | | | | 1,150,625 | |
| | | | | | | | | | | | |
Community, Economic and Resource Development | | | | | | | | | | | | |
Aboriginal and Northern Affairs | | | 33,527 | | | | 3,249 | | | | 36,776 | |
Agriculture, Food and Rural Development | | | 203,995 | | | | 198,545 | | | | 402,540 | |
Conservation and Water Stewardship | | | 138,089 | | | | 490 | | | | 138,579 | |
Housing and Community Development | | | 88,984 | | | | 181,004 | | | | 269,988 | |
Infrastructure and Transportation | | | 607,162 | | | | (174,488) | | | | 432,674 | |
Jobs and the Economy | | | 657,874 | | | | 15,217 | | | | 673,091 | |
Mineral Resources | | | 9,835 | | | | 16,521 | | | | 26,356 | |
Municipal Government | | | 433,833 | | | | 13,088 | | | | 446,921 | |
| | | | | | | | | | | | |
Total Community, Economic and Resource Development | | | 2,173,299 | | | | 253,626 | | | | 2,426,925 | |
| | | | | | | | | | | | |
Justice and Other Expenditures | | | | | | | | | | | | |
Legislative Assembly | | | 52,021 | | | | (875) | | | | 51,146 | |
Executive Council | | | 2,679 | | | | (70) | | | | 2,609 | |
Civil Service Commission | | | 18,369 | | | | (594) | | | | 17,775 | |
Employee Pensions and Other Costs | | | 14,161 | | | | 58,759 | | | | 72,920 | |
Finance | | | 262,355 | | | | 64,346 | | | | 326,701 | |
Justice | | | 537,397 | | | | 1,449 | | | | 538,846 | |
Labour and Immigration | | | 23,062 | | | | 13,008 | | | | 36,070 | |
Multiculturalism and Literacy | | | 21,572 | | | | (8,170) | | | | 13,402 | |
Tourism, Culture, Heritage, Sport and Consumer Protection | | | 81,248 | | | | 10,191 | | | | 91,439 | |
Enabling Appropriations | | | 44,724 | | | | - | | | | 44,724 | |
Other Appropriations | | | 43,484 | | | | - | | | | 43,484 | |
| | | | | | | | | | | | |
Total Justice and Other Expenditures | | | 1,101,072 | | | | 138,044 | | | | 1,239,116 | |
| | | | | | | | | | | | |
Debt Servicing Costs | | | 220,000 | | | | 622,114 | | | | 842,114 | |
| | | | | | | | | | | | |
Total Expenditure Estimate | | | 12,865,145 | | | | 2,670,147 | | | | 15,535,292 | |
Subtract: Total Revenue Estimate (Schedule 1) | | | 12,354,435 | | | | 2,608,963 | | | | 14,963,398 | |
In-Year Adjustments/Lapse | | | (70,000) | | | | (80,000) | | | | (150,000) | |
Net Result for the Year | | | (440,710) | | | | 18,816 | | | | (421,894) | |
Transfer from Fiscal Stabilization Account | | | | | | | | | | | | |
- Principal Repayments | | | 20,000 | | | | (20,000) | | | | - | |
| | | | | | | | | | | | |
NET INCOME (LOSS) | | | (420,710) | | | | (1,184) | | | | (421,894) | |
| | | | | | | | | | | | |
NOTE: In-year adjustments/lapse could be an increase in revenue and/or decrease in expenditures.
6 / B U D G E T 2 0 1 5
B U D G E T 2 0 1 5 / 7
FINANCIAL MANAGEMENT STRATEGY
8 / B U D G E T 2 0 1 5
n FINANCIAL MANAGEMENT STRATEGY 2015/16
Throughout the recession caused by the financial crisis of 2008/09 and the global economic uncertainty that continues today, Manitoba has followed a plan that focuses on restoring balance to the province’s finances, while protecting the services that Manitobans rely on. The key to this plan is a responsible and balanced approach to stimulating the economy and driving growth through investments in both physical capital and human capital – reflected in stimulus spending to support jobs today and long-term opportunities flowing from education and training.
Strategic investments in infrastructure were a key element of the economic stimulus plan introduced in Budget 2010 that protected Manitoba from the worst effects of the recession. Budget 2014 built on that foundation by introducing a new, five-year core infrastructure investment plan that committed $5.5 billion to build and renew Manitoba’s roads, highways and bridges, improve flood protection and mitigation, and help municipalities address their infrastructure needs in areas like roads and clean water.
Investments on this scale create tremendous opportunities for skilled workers and entrepreneurial energy and government continues to invest heavily in the education and training resources required to prepare Manitobans to capitalize on these opportunities. Primary and secondary schools, colleges and universities, and apprenticeship and other skills training programs are all contributing to Manitoba’s economic success.
Manitoba’s Financial Management Strategy (FMS) is an important part of the government’s commitment to provide an open and transparent account of the ways in which government manages the finances of the province. It sets out the main priority areas for financial management each year, with measurable outcomes for each.
n PRIORITY AREAS
For 2015/16, the FMS continues to focus on priority areas identified in previous years, with some additions to reflect government’s commitment to invest responsibly to promote economic growth and protect core government services.
| | |
FINANCIAL MANAGEMENT PRIORITY | | MEASURABLE OUTCOMES |
Transparency and Accountability | | • Core Government Outlook |
| |
| | • Summary Budget Revenue and Expenditures |
| |
Growing the Economy | | • Core Infrastructure Investment |
| |
| | • Workforce Growth |
| |
Stable and Affordable Government | | • Credit Ratings |
| |
| | • Controlling the Growth of Government |
| |
Managing Debt | | • Debt Management |
| |
| | • Net Debt Ratios |
B U D G E T 2 0 1 5 / 9
n PRIORITY AREA – TRANSPARENCY AND ACCOUNTABILITY
Manitoba has implemented a number of measures to ensure financial accountability and maintain fiscal discipline, including:
| • | | implementing GAAP compliant summary financial statements as of March 31, 2005; |
| • | | implementing summary budgeting and reporting in 2007/08; |
| • | | publishing a financial management strategy as part of the annual budget and a report on outcomes within six months of the end of the fiscal year; |
| • | | implementing summary quarterly financial reporting, consistent with GAAP as of 2009/10; |
| • | | establishing a plan to reduce the unfunded pension liabilities; |
| • | | funding the employer’s share of current service pension contributions for all employees; and |
| • | | ensuring all capital investments are amortized and all related costs are included in annual appropriations for core government. |
The commitment to transparency, accountability and fiscal discipline continues in Budget 2015 with an update on the balanced financial strategy for 2015/16 and future years.
Summary budget reporting and core government reporting are both important to provide transparency and accountability with respect to the province’s financial management. For Budget 2015, the strategy focuses primarily on core government activities – the revenues and expenses of the government departments that are under the direct control of the Legislative Assembly. These are where the day-to-day decisions are made that ultimately determine the success of the government’s strategies, plans and programs.
Measurable Outcome – Core Government Outlook
Manitoba is recognized as one of Canada’s most stable provincial economies. That stability, coupled with the government’s strategic investments to stimulate the economy during and after the recession, has produced a steady growth trend that is predicted to continue for the foreseeable future. The current Manitoba Finance survey of forecasters calls for 2.5% growth in real GDP in 2015 and 2.3% in 2016, in the top three Canadian jurisdictions in both years.
Budget 2015 continues the government’s multi-year financial strategy to steadily reduce deficits while maintaining the key services that families count on. Manitoba’s balanced approach is working – the economy is growing, job growth is the best in the country, and the gap between core government revenues and expenditures is shrinking.
The following principles govern Manitoba’s financial management strategy and support the balanced approach that has been so successful:
| • | | Accountability and Transparency: Financial management plans, actions and results should be clearly described and readily available to the public. |
| • | | Flexibility: Plans must be adaptable to respond to changing circumstances. |
| • | | Economic Growth: Responsible investments will be designed to drive steady economic growth and create good jobs for the benefit of all Manitobans. |
| • | | Fiscal Responsibility: Balanced budgets and prudent debt management remain fundamental objectives. |
| • | | Stability: Core government services Manitoba families rely on will be protected from the vagaries of cyclical economic downturns. |
| • | | Equity: Impacts on different groups within the population and on future generations will be considered. |
10 / B U D G E T 2 0 1 5
Core Government Balanced Financial Strategy
| | | | | | | | | | | | | | | | | | | | |
| | | 2014/15
Forecast | | | 2015/16
Budget | | | 2016/17
Projection | | | 2017/18
Projection | | | 2018/19
Projection | |
| | | (Millions of Dollars) | |
Revenue | | | 12,078 | | | | 12,354 | | | | 12,768 | | | | 13,231 | | | | 13,770 | |
Expenditure | | | 12,546 | | | | 12,865 | | | | 13,181 | | | | 13,496 | | | | 13,816 | |
Year-End Adjustment/Lapse | | | (17) | | | | (70) | | | | (70) | | | | (70) | | | | (70) | |
| | | | | | | | | | | | | | | | | | | | |
Net Result | | | (451) | | | | (441) | | | | (343) | | | | (195) | | | | 24 | |
Fiscal Stabilization Account Draw | | | - | | | | (20) | | | | (15) | | | | (10) | | | | - | |
| | | | | | | | | | | | | | | | | | | | |
Surplus/(Deficit) | | | (451) | | | | (421) | | | | (328) | | | | (185) | | | | 24 | |
| | | | | | | | | | | | | | | | | | | | |
The core government budget outlook projects that revenue will rise by an average of 3.7% annually from 2015/16 to 2018/19, while expenditures are projected to increase by an annual average of 2.4% during the same period.
Budget 2015 demonstrates Manitoba’s balanced approach by focusing on:
| • | | supporting economic growth and the creation of new job opportunities; |
| • | | managing government spending strategically to hold expenditure growth in line with economic growth while continuing to ensure Manitobans’ priorities come first; |
| • | | reducing the deficit while continuing to invest in vital front-line services to continue to improve health care, education and training, and supports for families; |
| • | | improving the policies and processes in the monitoring and reporting of government procurement, with implementation of a new public online reporting system later this year, providing a more open and transparent approach for communicating procurement activities; |
| • | | delivering services in the most efficient way possible by expanding the use of lean processes in core government departments; and |
| • | | maintaining affordability to keep Manitoba one of the best places to live, work, raise a family and retire. |
The success of this long-term plan to strengthen the economy and create new job opportunities, while returning to balance, will make Manitoba an even better place for families.
In addition to making investments in education and training and other key services families depend on, Manitoba acknowledges the need to control increases in health care costs to ensure that high-quality universal health care continues to be available to Manitobans. This objective is shared by all provincial and territorial governments in Canada, as health care costs account for a substantial portion of their budgets and demographics suggest continued cost pressures. Manitoba has made significant investments since 1999, averaging 5.7% annually, to rebuild a strong health care system. In order to ensure future investments are sustainable, Manitoba’s doctors and nurses are engaging with the government, the health authorities and other stakeholders to create the innovations in delivery of services that will enable even better care for all Manitobans, at an affordable cost now and in the future.
In addition to core infrastructure funding, Budget 2015 also includes strategic investments in infrastructure required to support health, education and housing, while limiting spending growth to key front-line services. A modest draw from the Fiscal Stabilization Account is forecast in 2015/16 to offset the impact of investments in the capital infrastructure that support these programs. Although several risks and challenges remain for the global economy, Manitoba’s stable economic and demographic fundamentals are projected to produce steady economic growth over the next few years.
B U D G E T 2 0 1 5 / 11
Measurable Outcome – Summary Budget Revenue and Expenditures
Eight years ago, Manitoba enhanced its financial reporting by adding summary budgeting and reporting in order to present comprehensive information on the full nature of Manitoba’s financial affairs. The Summary Budget brings together the results for not just core government, but also all the Government Business Enterprises (GBEs) such as Manitoba Hydro and Manitoba Public Insurance, all the health authorities, the social service authorities, school divisions and many more entities controlled by the provincial government.
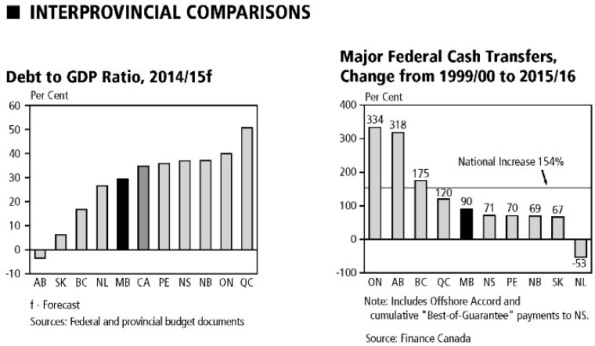
Government’s plan to grow the economy and create new employment opportunities in a period of sluggish and uneven global growth was based on fiscal stimulus, largely in the form of investments in core infrastructure. The plan is producing strong economic and employment growth. The summary deficit in Budget 2015 reflects the government’s continuation of its successful economic stimulus plan in the face of global economic uncertainty. Manitoba’s deficit to GDP ratio in Budget 2015 is (0.6)%, down from (0.7)% forecast for 2014/15. Over the last four years, this ratio has been declining. The government’s long-standing commitment to accountable public reporting and to work toward a return to a balanced fiscal position is embodied in balanced budget legislation, but a recent court decision showed current legislation is not legally effective. Moreover, other jurisdictions have repealed or modernized balanced budget legislation with a view to recognizing new economic realities. In the months ahead, the government will seek advice on more appropriate ways to reflect the current policy and economic environment, while further enhancing accountability. Manitobans are entitled to the information they need to determine that government is spending their money responsibly on the things they care about, such as jobs, roads and core services.
The government is committed to ensuring that the entire GRE is working to protect the services Manitobans rely on to ensure that delivery methods consider innovative ways to reduce the cost of government and to increase efficiency. Measures implemented in recent years include:
| • | | reducing the number of regional health authorities to 5 from 11 to streamline services; |
| • | | merging the Manitoba Liquor Control Commission and Manitoba Lotteries Corporation to reduce overhead and regulatory costs; |
| • | | reducing the number of government-appointed agencies, boards and commissions; |
| • | | establishing Entrepreneurship Manitoba to provide an integrated suite of programs and innovative service improvements for entrepreneurs and businesses; and |
| • | | undertaking a comprehensive review of office space to reduce the footprint of core government by 100,000 square feet. |
Budget 2015 will move forward with further improvements in the coming year by:
| • | | innovating within health care to control the growth of costs, improve care and continue to shift resources to the front line; |
| • | | improving service delivery by focusing on operational issues – the way in which implementation or execution is being managed to improve the effectiveness of government’s ability to deliver results; and |
| • | | focusing on core government program priorities. |
The annual Financial Management Strategy Report on Outcomes will continue to be published. In addition, in-year financial reporting will provide updates on the progress made in achieving our balanced financial strategy.
12 / B U D G E T 2 0 1 5
| | | | |
Investments in core infrastructure stimulate the provincial economy, generate employment and increase household and business incomes. In addition, infrastructure projects boost productivity over the long term. The Conference Board of Canada analysis of the Manitoba government’s five-year core infrastructure plan indicates that in the period from 2014 to 2018, it will: • lift overall real GDP by $6.3 billion, or 2%; • create a total of 58,900 person-years of employment; • add $1,100 annually to the average real income of working-age Manitobans; • boost exports by $5.4 billion; • generate $1.4 billion in retail sales; and • add over 2,000 housing units to the economy. Source: Conference Board of Canada “The Economic Impact of Manitoba’s Infrastructure Investment Program” | | | | n PRIORITY AREA –GROWING THE ECONOMY Building and upgrading Manitoba’s infrastructure has been a priority for the government since 1999. The government announced an economic stimulus investment plan in November 2008 to fund key infrastructure projects across the province. Manitoba has also dedicated revenue raised through fuel taxes to fund infrastructure, participated in the national stimulus program that began in 2009 and, in 2011, committed to providing the equivalent of one-seventh of the provincial sales tax revenue to support investment in municipal infrastructure and public transit. Last year, government introduced a five-year, $5.5 billion core infrastructure plan to focus investments on: • roads, highways and bridges; • flood protection; and • municipal infrastructure including roads and clean water. The government continues to focus on its plan to grow the economy and create good jobs by making infrastructure investment a priority. |
| |
| |
Measurable Outcome – Core Infrastructure Investment
As part of the five-year core infrastructure plan, the government committed to invest more than the revenue raised from the additional point of PST introduced in 2013, into new investments in core infrastructure, over and above existing spending levels of $729 million. From 2014/15 to 2018/19 revenues associated with one-point of PST are estimated at $1.5 billion. As shown in the following table, beginning in 2014/15, core infrastructure investment projected for the five-year plan will reach over $5.5 billion, exceeding the government’s PST commitment by $354 million.
| | | | | | | | | | | | | | | | | | | | | | | | | | | | | | | | |
| | | | | | | | | Five-year Core Infrastructure Plan | |
| | | | | | 2013/14 | | | 2014/15 | | | 2015/16 | | | 2016/17 | | | 2017/18 | | | 2018/19 | | | | |
| | | Base | | | Actual | | | Forecast | | | Budget | | | Projection | | | Projection | | | Projection | | | Total | |
| | | | | | | | | | | | (Millions of Dollars) | | | | | | | |
| | | | | | | | |
Roads, Highways and Bridges | | | 478 | | | | 533 | | | | 693 | | | | 747 | | | | 755 | | | | 762 | | | | 771 | | | | 3,728 | |
Flood Protection | | | 21 | | | | 78 | | | | 65 | | | | 48 | | | | 54 | | | | 68 | | | | 104 | | | | 339 | |
Municipal Infrastructure* | | | 230 | | | | 256 | | | | 277 | | | | 285 | | | | 300 | | | | 312 | | | | 326 | | | | 1,500 | |
| | | | | | | | | | | | | | | | | | | | | | | | | | | | | | | | |
Planned Investment | | | 729 | | | | 867 | | | | 1,035 | | | | 1,080 | | | | 1,109 | | | | 1,142 | | | | 1,201 | | | | 5,567 | |
| | | | | | | | | | | | | | | | | | | | | | | | | | | | | | | | |
Base Funding Level | | | 729 | | | | 729 | | | | 729 | | | | 729 | | | | 729 | | | | 729 | | | | 729 | | | | 3,645 | |
1 Point PST Commitment | | | | | | | 190 | | | | 276 | | | | 286 | | | | 299 | | | | 312 | | | | 326 | | | | 1,499 | |
| | | | | | | | | | | | | | | | | | | | | | | | | | | | | | | | |
Investment Commitment | | | | | | | 919 | | | | 1,005 | | | | 1,015 | | | | 1,028 | | | | 1,041 | | | | 1,055 | | | | 5,144 | |
| | | | | | | | | | | | | | | | | | | | | | | | | | | | | | | | |
Less: Federal Cost-sharing ** | | | | | | | (23) | | | | (34) | | | | (35) | | | | — | | | | — | | | | — | | | | (69) | |
| | | | | | | | | | | | | | | | | | | | | | | | | | | | | | | | |
Net Investment Over/ (Under) Commitment | | | | | | | (75) | | | | (4) | | | | 30 | | | | 81 | | | | 101 | | | | 146 | | | | 354 | |
| | | | | | | | | | | | | | | | | | | | | | | | | | | | | | | | |
| * | Building Manitoba Fund net of transit operating grants. |
| ** | The plan will be updated in future years to reflect projects approved for federal cost-sharing. |
B U D G E T 2 0 1 5 / 13
While the 2013/14 fiscal year is outside of the plan, the $5.5 billion level of investment is enough to offset the variance in 2013/14 and projected underinvestment in 2014/15, related to changes in project timing, better pricing and recognizing federal cost-sharing. The plan is also flexible enough to accommodate revenue offsets that may be received under the Building Canada Plan or other federal cost-sharing initiatives in future years of the Plan.
The core infrastructure plan will continue to be reviewed and adjusted in each of the remaining years of the plan to recognize any variances in the PST revenues and investments.
The 2015/16 budget for core infrastructure of $1,080 million exceeds the investment commitment of $1,015 million which represents the base funding level of $729 million and the equivalent of one percentage point of PST revenue, estimated at $286 million in 2015/16. The investment in 2015/16 includes $35 million of support from the federal government.
Details of the 2015/16 investment for the construction of new or maintenance and preservation of existing assets in the departments of Infrastructure and Transportation and Municipal Government are as follows:
Five-year Core Infrastructure Plan
| | | | |
| | | 2015/16
Budget | |
| | | (Thousands of Dollars) | |
Roads, Highways and Bridges | | | | |
Highways Infrastructure | | | 588,510 | |
Transportation Capital | | | 14,600 | |
Airport Runways | | | 2,000 | |
Maintenance and Preservation | | | 141,726 | |
| | | | |
Subtotal Roads, Highways and Bridges | | | 746,836 | |
| |
Flood Protection | | | | |
Water Control Capital | | | 38,800 | |
Maintenance and Preservation | | | 9,645 | |
| | | | |
Subtotal Flood Protection | | | 48,445 | |
| |
Municipal Infrastructure | | | | |
Building Manitoba Fund* | | | 284,576 | |
| | | | |
Planned Investment | | | 1,079,857 | |
| | | | |
| * | Net of transit operating grants. |
Year-end information on the 2015/16 core infrastructure plan investment and projects will be provided as part of the Financial Management Strategy Report On Outcomes, scheduled to be released in the fall of 2016.
14 / B U D G E T 2 0 1 5
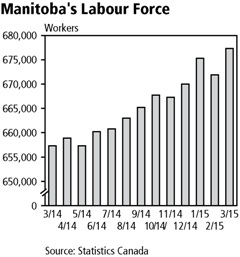
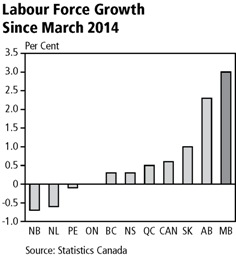
Measurable Outcome – Workforce Growth
Manitoba’s plan to drive economic growth through strategic investments in infrastructure and skills training is creating thousands of new job opportunities. To continue growing, Manitoba needs to increase its supply of skilled workers to meet that demand. Government has set a target to add 75,000 workers to the Manitoba labour force by 2020 and significant progress has been made toward that goal.
Manitoba’s labour market has attracted an additional 20,000 new workers since March 2014, lifting the year-over-year growth rate to 3.0%. Over the past year, Manitoba’s growth in the labour force has been strongest among provinces and well above the national average of 0.6%. Manitoba maintains a balanced labour market with the second-lowest unemployment rate in the country.
| | |
| | In today’s world, advanced education and training is the most reliable path to a good job. Two out of every three jobs created in the next decade will require college, university or apprenticeship training. The Manitoba government is working closely with businesses and labour and has partnered with colleges and universities to meet future needs and ensure our economy remains strong and growing. In early 2013, the Premier’s Economic Advisory Council (PEAC) hosted a skills summit to focus discussions among leaders in business, labour, and education and training around five key themes: • training more young people for the jobs of tomorrow; • connecting more Manitobans with trades training; • growing Manitoba’s successful immigration strategy; • building Manitoba’s First Nations, Metis and Inuit workforce; and • ensuring every Manitoban who faces barriers to working has access to training and good jobs. Manitoba responded to the advice coming out of the PEAC summit with the introduction of a comprehensive skills strategy to enhance the opportunities for young Manitobans to move through post-secondary education to good jobs. New initiatives were introduced to connect apprentices to employers and expand opportunities in the skilled trades. Investments in tools to bridge the path between school and career have resulted in better career planning options and co-op work placements for high school students. The commitment continues with a plan for future integrated services to be available in employment centres across the province, strengthening access for individuals and employers in rural and northern areas. In addition to the funding for education (grades K-12) which has increased by 65% since 1999, government has introduced a $30 million Skill Build Shops fund to build and expand trades and skills shops in high schools with a further $1.5 million being dedicated to the Skill Build Equipment fund to upgrade classrooms to an apprenticeship-accredited level and bring welding, electrical, |
carpentry and culinary arts equipment into schools. A $2 million career development fund has been established to ensure students leave high school with a good idea of where they want to go and how to get there, whether it is through a university, college, work
B U D G E T 2 0 1 5 / 15
placement or on-the-job training and apprenticeship. High school graduation rates have increased to 85% from 71% in just over a decade, which means that 2,000 more students are graduating every year.
Apprenticeship registrations have more than tripled since 1999. Government introduced a new bonus for employers who take on apprentices for the first time, as well as increasing the tax credit to $5,000 per year to encourage employers to take on new apprentices. A $1,000 bursary was also introduced to help apprentices finish their final year of training.
College enrollment has increased by 52% and University enrollment has increased by 42% since 1999. This growth is being encouraged by a Tuition Fee Income Tax Rebate that returns up to 60% of tuition fees to students who choose to live and work in Manitoba and the elimination of interest on student loans. Over $1 billion in post-secondary institutions capital has been invested to support this growth.
The new Rent Assist program supports the working poor and makes it easier to move from welfare to the workforce. Expanding the network of child-care centres and providing funding for 6,500 more spaces will enable parents of young children to go back to work or to pursue upgrading of their skills, education and training. Budget 2015 continues to build Manitoba’s workforce in the coming year by:
| • | | introducing a youth jobs strategy to help more young Manitobans take advantage of opportunities; |
| • | | increasing operating funding for colleges by 2% and universities by 2.5%; |
| • | | adding 18 engineering seats at the University of Manitoba; |
| • | | adding 200 apprenticeship seats at Manitoba’s three main colleges; |
| • | | expanding the apprenticeship model to certify additional occupations; |
| • | | increasing funding for Adult Literacy Centres; |
| • | | introducing the First-Year Now initiative to give more high school students the ability to take university and college courses and earn dual credits; |
| • | | increasing the Career Development initiative by $1 million to allow more students opportunities to connect with employers; |
| • | | increasing the Skills Strategy Equipment Enhancement Fund by $500,000; |
| • | | enhancing Rent Assist with $22 million to move it to 75% of median market rent; and |
| • | | funding an additional 900 new child-care spaces. |
Manitoba is committed to continuing to grow its workforce and the results of that growth will be tracked and reported annually in the Financial Management Strategy Report on Outcomes.
n PRIORITY AREA – STABLE AND AFFORDABLE GOVERNMENT
Manitoba uses public revenues effectively and efficiently to deliver affordable government programs and services. Keeping programs affordable is achieved by continuing to improve the way government operates and delivers services.
As part of the balanced financial strategy, government will continue to carefully manage programs and services to protect the priorities of Manitobans.
Measurable Outcome – Credit Ratings
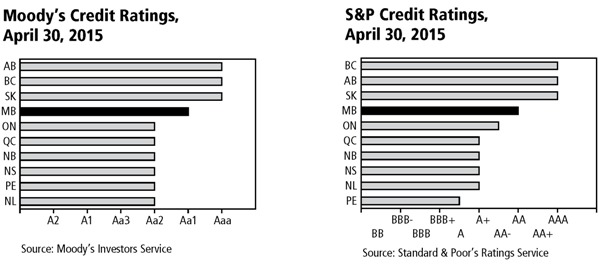
The government’s balanced approach to paying down debt and the pension liability, while maintaining core services in health care and other program areas in the context of the Great Recession, has been positively acknowledged by credit rating agencies through the reaffirmation of Manitoba’s credit rating over the last seven years.
16 / B U D G E T 2 0 1 5
Despite lingering uncertainty in the global economic environment, Manitoba’s economy continues to expand at a relatively steady pace and remains one of Canada’s most stable provincial economies. Leading bond rating agencies and economic forecasters consistently point to economic diversity as one of the province’s main assets. Manitoba’s stability, industrial diversity and commitment to a responsible, balanced financial management strategy, is anticipated to contribute to a steady credit outlook in 2015. Manitoba’s multi-year plan to focus on addressing growth and ensuring sustainability in the health sector provides the foundation for a return to balance in core government. This plan demonstrates the Manitoba government’s commitment to maintain fiscal responsibility and to achieve stable or improving credit ratings into the future.
| | | | | | | | | | | | | | |
Credit Rating
Agency | | 2009
Actual | | 2010
Actual | | 2011
Actual | | 2012
Actual | | 2013
Actual | | 2014
Actual | | 2015
Actual |
DBRS | | A(high) | | A(high) | | A(high) | | A(high) | | A(high) | | A(high) | | A(high) |
Moody’s | | Aa1 | | Aa1 | | Aa1 | | Aa1 | | Aa1 | | Aa1 | | Aa1 |
Standard & Poor’s | | AA | | AA | | AA | | AA | | AA | | AA | | AA |
NOTE: For fiscal year ending March 31.
Measurable Outcome – Controlling the Growth of Government
Maintaining stable and affordable government means managing the growth in spending to meet increasing demands for quality services. An effective measure of appropriate spending is the comparison between total government spending and the size of the provincial economy, measured as a percentage of GDP.
As the figures in the table below indicate, this measure has trended downward over the last four years and Budget 2015 projects this decline will continue for core government as well as the overall GRE.
| | | | | | | | | | | | | | | | | | | | | | | | |
| | | 2011/12 | | | 2012/13 | | | 2013/14 | | | 2014/15
Forecast | | | 2015/16
Budget | | | 2016/17
Projection | |
| | | (Per Cent) | |
Core Program Expenditure | | | 21.2 | | | | 19.7 | | | | 19.4 | | | | 19.4 | | | | 19.1 | | | | 18.8 | |
Other Reporting Entities (ORE) Expenditure | | | 3.6 | | | | 3.2 | | | | 3.1 | | | | 3.3 | | | | 3.1 | | | | 2.9 | |
Debt Servicing Costs | | | 1.5 | | | | 1.4 | | | | 1.3 | | | | 1.3 | | | | 1.3 | | | | 1.2 | |
Total Expenditure | | | 26.3 | | | | 24.4 | | | | 23.9 | | | | 24.0 | | | | 23.5 | | | | 22.9 | |
| | |
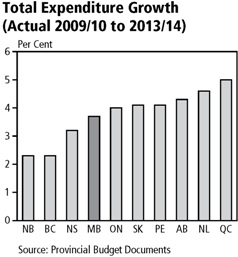 | | Manitoba government expenditure growth over the five-year period from 2009/10 to 2013/14 was 3.7%, fourth lowest among provinces and just below the 3.8% provincial average. Responsible and accountable management of public resources is key to keeping government effective, efficient and economical. This is the foundation of Manitoba’s balanced fiscal strategy to provide sustainable services, now and into the future. Government continues to explore ways to make sure that public spending remains under control and that tax dollars are used effectively and efficiently. Budget 2015 brings into effect a restructuring of internal government services to reduce duplication of effort and improve accountability and cost control |
B U D G E T 2 0 1 5 / 17
in accommodations, procurement, information technology and materials and equipment management. The mandate of the new Central Services Division is to focus on optimizing the execution of day-to-day operations to deliver the best value for money in these areas.
Since the office space reduction target was announced last year, achievements in space reduction will total over 140,000 square feet, exceeding the target by 40%. The restructuring in Budget 2015 provides for a new fiscal asset management strategy for government buildings. One of the key initiatives in the 2015/16 fiscal year will be the devolution of the Red River College buildings, previously held by core government. This transfer of assets enables the College to manage its full portfolio requirements within its overall operating structure.
Other central services priorities include leveraging information technology to support the provision of effective government programs and modernizing tendering and contracting processes to ensure that all procurement activities are streamlined and processes across government are uniform to the extent possible.
The Lean Council which was established last year will continue with its mandate to help government streamline processes while providing better services for Manitobans. Under the leadership of this council, government departments will continue to identify ways to make their operations more efficient by identifying and eliminating duplication or redundancies.
Government committed to reducing the size of the civil service by 600 over three years. At the end of March, 2015, this commitment has been met. Measures will continue to carefully review the staffing of positions while protecting the services that Manitobans need. The government will continue to emphasize reforms that improve accountability and transparency and support sustainable programs that protect the priorities of Manitobans.
n PRIORITY AREA – MANAGING DEBT
Over the years, government has continued to implement specific initiatives to ensure sound fiscal management. These include:
| • | | addressing the unfunded pension liability; |
| • | | funding the employer’s share of current service pension entitlements in 2008/09, the first time since April 1, 1961; |
| • | | ensuring all capital investments are amortized and all related costs are fully reflected in annual appropriations for core government; and |
| • | | taking a balanced approach to fiscal management to protect the services Manitobans count on. |
Addressing general purpose debt and the pension liability while making needed investments in Manitoba demonstrates solid debt management and is a fiscally responsible measure. While deficits and the increased investment in capital assets will add to the net debt in the short term, spending on core infrastructure is a priority of government because of the economic growth it creates. Increased investment in a core infrastructure plan and continuing investment in education and technology, lays the groundwork for continued economic expansion and the creation of good jobs and helps Manitoba remain competitive. Over 30% of the summary net debt is related to the investments in capital assets including core infrastructure and assets used by schools, universities and hospitals.
This investment supports the provision of services that Manitobans count on and reduces the overall maintenance requirements in future years.
18 / B U D G E T 2 0 1 5
Measurable Outcome – Debt Management
Direct action to address the unfunded pension liabilities for the Civil Service Superannuation Plan (CSSP) and the Teachers’ Retirement Allowances Fund (TRAF) began in 2007/08, with the province borrowing funds that have been invested by these two pension plans on behalf of the province.
Borrowing funds to pay down the previously unfunded pension liability is a sound fiscal decision, as over the longer term, the cost of borrowing is less than the actuarially determined expected rate of return on the plan assets and the rate of growth in the pension liability.
Budget 2015 includes a further $100 million investment in TRAF to reduce the net pension liability. This investment allows the government to take advantage of current low interest rates and reduce future pension expense through an increase in expected returns on additional plan assets. It also demonstrates Manitoba’s commitment to meet future obligations.
| | |
| | Since 2000, over $4.8 billion has been directed to pension obligations, including over $615 million in debt retirement payments, $2.6 billion in new investment provided by the government since 2007 and net investment earnings projected to be $1.6 billion by March 31, 2015. In addition, Budget 2015 includes over $200 million in core government expenditures for the employer’s share of current service pension obligations. The government continues to recognize capital investment as a priority in order to support economic growth and the related new job opportunities. The cost of these assets is amortized over a set period that represents the useful life of the asset as required by GAAP. The end result is increased infrastructure investment for Manitobans, accompanied by a fixed discipline for paying down the associated debt. Manitoba’s communities and the economy have benefited over the years from the significant investment in infrastructure assets such as roads and water-control structures and other capital assets such as health facilities, universities, colleges and schools, and parks. To meet the needs of today’s and future generations, it is necessary to continue to invest in the renewal of these assets. The public good provided by these investments is immeasurable. It is estimated that the insured or replacement value of these investments is $41.5 billion. |
| |
B U D G E T 2 0 1 5 / 19
| | |
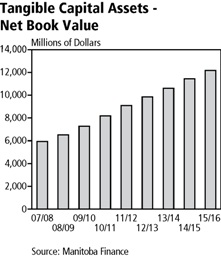
The investment in tangible capital assets has increased steadily over the last decade and with the investment in core and other capital investment of $1.3 billion in Budget 2015, is projected to total $20.6 billion at March 31, 2016 with $8.4 billion of related debt retired through accumulated amortization. The net book value of these assets (cost less accumulated amortization) has more than tripled since 1999/2000 to $12.2 billion. Based on projections, core government will have a total of $8.8 billion in capital asset investments at March 31, 2016 and $3.0 billion of related debt will have been retired through accumulated amortization. A total of $434 million has been included in core government appropriations to retire debt associated with capital investments – $249 million for amortization of department-owned assets and $185 million for principal payments for education and health-related assets. These payments are about 3% of the total summary expenditure in Budget 2015. Over time, these payments will decrease as the debt associated with the capital assets decreases. | | 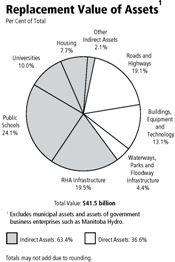
|
| | | | | | | | |
| | | 2015/16
Budget | | | 2014/15
Forecast | |
| | | (Millions of Dollars) | |
Revenue | | | 12,354 | | | | 12,078 | |
Operating Expenditures | | | 12,431 | | | | 12,162 | |
Year-end Adjustment/Lapse | | | (70) | | | | (17) | |
| | | | | | | | |
Operating Balance (prior to debt repayment) | | | (7) | | | | (67) | |
Asset Debt Repayment (amortization/principal) | | | (434) | | | | (384) | |
| | | | | | | | |
| | | (441) | | | | (451) | |
| | | | | | | | |
The net result for core government in Budget 2015 is an improvement from the 2014/15 forecast as shown above. Even with the record level of capital investments, the cost of operating government programs, including interest payments but prior to amortization and principal payments, continues to decline. These debt payments are important and significant, ensuring that Manitoba’s debt levels are manageable. Budget 2015 also includes an $85 million draw from the Fiscal Stabilization Account to retire a portion of the borrowings required to support core government programs.
Manitoba continues to provide a solid debt management plan which includes addressing the previously unfunded pension liability, budgeting for the employer’s share of current service entitlements for all employees, ensuring all capital investments are amortized and all related costs are fully reflected in annual appropriations.
The government remains committed to reducing debt over time as part of a comprehensive fiscal strategy for a balanced approach for sustainable services for all Manitobans.
20 / B U D G E T 2 0 1 5
Measurable Outcome – Net Debt Ratios
Net debt is an important indicator of a government’s financial position as this highlights how government services will remain affordable in the future.
Summary net debt is financial assets (such as cash or investments) minus total liabilities (such as loans or financing). It is the remaining liability that must be financed by future revenues.
Net debt may grow as needed investments in core capital assets – like highway infrastructure, water control structures, and hospitals and schools are made. These forward-looking investments help support Manitoba’s economy, attract investment, increase trade, and create jobs and new opportunities for young people. Therefore, it is important to measure changes in net debt against the growth of the economy, as measured by the nominal GDP and against revenue as an indication of government’s ability to repay that debt.
| | |
| | Net Debt to GDP Ratio Manitoba’s net debt to GDP has fluctuated over the past 14 years resulting from the effects of the Great Recession and lingering uncertainty, the impact of the 2011 flood and the continued commitment to invest in capital assets that will benefit Manitobans in the years to come. While the new five-year core infrastructure plan is anticipated to increase the net debt to GDP ratio in the short term, this increase must be considered in relation to the resulting benefits to the economy overall. According to the Conference Board of Canada’s Report entitled “The Economic Impact of Manitoba’s Infrastructure Investment Program”, the government’s five-year core infrastructure plan will boost overall real GDP by $6.3 billion or 2% over 2014 to 2018. Manitoba will also benefit from additional positive impacts resulting from increased productivity due to the elevated productive capacity from this investment. Further studies will be undertaken to assess the additional impact resulting from these productivity gains. |
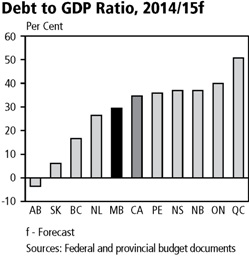
Manitoba is committed to maintaining its net debt to GDP ratio in line with the average for Canadian provinces, which was 31.0% in 2014/15. The projection for the net debt to GDP ratio in 2014/15 is 29.5%. In Budget 2015, the net debt to GDP ratio is forecast to be 30.9%.
Net Debt to Revenue Ratio
Strategic decision making has resulted in debt servicing costs as a percentage of revenue decreasing since 1999/2000, indicating that the province’s ability to pay off its debt is better today than it was then. The debt servicing cost rate has dropped by 57.6%, from 13.2¢ of every dollar of summary revenue collected to a forecasted level of 5.6¢ in Budget 2015, sixteen years later. The province estimates its ratio of net debt to revenue is the fourth lowest among provinces.
B U D G E T 2 0 1 5 / 21
Appendix 1:
MANITOBA SUMMARY FINANCIAL STATISTICS
22 / B U D G E T 2 0 1 5
Manitoba Summary Financial Statistics
| | | | | | | | | | | | | | | | | | | | | | | | |
| | | 2015/16 | | | 2014/15 | | | 2013/14 | | | 2012/13 | | | 2011/12 | | | 2010/11 | |
| | | Budget | | | Forecast | | | Actual | | | Actual | | | Actual | | | Actual | |
| SUMMARY FINANCIAL STATEMENTS | | (Millions of Dollars) | |
Revenue | | | | | | | | | | | | | | | | | | | | | | | | |
Income Taxes | | | 3,852 | | | | 3,674 | | | | 3,446 | | | | 3,302 | | | | 3,138 | | | | 2,938 | |
Other Taxes | | | 4,121 | | | | 3,978 | | | | 3,723 | | | | 3,365 | | | | 3,350 | | | | 3,219 | |
Fees and Other Revenue | | | 2,140 | | | | 2,131 | | | | 2,178 | | | | 2,013 | | | | 1,906 | | | | 1,828 | |
Federal Transfers | | | 3,881 | | | | 3,912 | | | | 3,842 | | | | 3,953 | | | | 4,332 | | | | 4,047 | |
Net Income of Government Business Enterprises | | | 759 | | | | 855 | | | | 783 | | | | 739 | | | | 713 | | | | 807 | |
Sinking Funds and Other Earnings | | | 210 | | | | 234 | | | | 242 | | | | 242 | | | | 249 | | | | 230 | |
| | | | | | | | | | | | | | | | | | | | | | | | |
Total Revenue | | | 14,963 | | | | 14,784 | | | | 14,214 | | | | 13,614 | | | | 13,688 | | | | 13,069 | |
| | | | | | | | | | | | | | | | | | | | | | | | |
Expenditure | | | | | | | | | | | | | | | | | | | | | | | | |
Health | | | 6,088 | | | | 5,900 | | | | 5,706 | | | | 5,454 | | | | 5,328 | | | | 5,044 | |
Education | | | 3,788 | | | | 3,709 | | | | 3,562 | | | | 3,339 | | | | 3,389 | | | | 3,218 | |
Family Services | | | 1,151 | | | | 1,121 | | | | 1,074 | | | | 1,035 | | | | 1,013 | | | | 978 | |
Community, Economic and Resource Development | | | 2,427 | | | | 2,352 | | | | 2,357 | | | | 2,365 | | | | 2,676 | | | | 2,309 | |
Justice and Other Expenditures | | | 1,239 | | | | 1,319 | | | | 1,216 | | | | 1,142 | | | | 1,468 | | | | 928 | |
Debt Servicing Costs | | | 842 | | | | 845 | | | | 821 | | | | 839 | | | | 815 | | | | 773 | |
| | | | | | | | | | | | | | | | | | | | | | | | |
Total Expenditure | | | 15,535 | | | | 15,246 | | | | 14,736 | | | | 14,174 �� | | | | 14,689 | | | | 13,250 | |
In-Year Adjustments/Lapse | | | (150) | | | | (38) | | | | - | | | | - | | | | - | | | | - | |
| | | | | | | | | | | | | | | | | | | | | | | | |
Net Income (Loss) | | | (422) | | | | (424) | | | | (522) | | | | (560) | | | | (1,001) | | | | (181) | |
| | | | | | | | | | | | | | | | | | | | | | | | |
Provincial Borrowings, Guarantees & Obligations | | | | | | | | | | | | | | | | | | | | | | | | |
General Government Programs | | | 9,919 | | | | 9,465 | | | | 9,105 | | | | 8,289 | | | | 7,803 | | | | 6,955 | |
General Government Programs – Federal Flood Relief | | | - | | | | - | | | | - | | | | 276 | | | | 326 | | | | - | |
General Government Programs – Pension Liability | | | 2,695 | | | | 2,595 | | | | 2,595 | | | | 2,595 | | | | 2,595 | | | | 2,355 | |
The Manitoba Hydro-Electric Board | | | 14,171 | | | | 12,588 | | | | 10,838 | | | | 9,609 | | | | 8,999 | | | | 8,362 | |
Other Crown Organizations | | | 3,034 | | | | 2,655 | | | | 2,511 | | | | 2,246 | | | | 1,926 | | | | 1,641 | |
Health Facilities | | | 1,535 | | | | 1,477 | | | | 1,252 | | | | 1,149 | | | | 1,094 | | | | 1,015 | |
Other | | | 5 | | | | 5 | | | | 9 | | | | 23 | | | | 37 | | | | 51 | |
Capital Investments | | | 4,941 | | | | 4,488 | | | | 4,020 | | | | 3,668 | | | | 3,195 | | | | 2,546 | |
| | | | | | | | | | | | | | | | | | | | | | | | |
Subtotal | | | 36,300 | | | | 33,273 | | | | 30,330 | | | | 27,855 | | | | 25,975 | | | | 22,925 | |
Other Obligations | | | | | | | | | | | | | | | | | | | | | | | | |
Pension Liability | | | 8,365 | | | | 7,761 | | | | 7,446 | | | | 6,940 | | | | 6,697 | | | | 6,545 | |
Pension Assets | | | (5,961) | | | | (5,500) | | | | (5,408) | | | | (5,112) | | | | (5,063) | | | | (4,814) | |
| | | | | | | | | | | | | | | | | | | | | | | | |
Net Pension Liability | | | 2,404 | | | | 2,261 | | | | 2,038 | | | | 1,828 | | | | 1,634 | | | | 1,731 | |
Debt Incurred for and Repayable by The Manitoba Hydro-Electric Board | | | (14,153) | | | | (12,418) | | | | (10,573) | | | | (9,443) | | | | (8,742) | | | | (8,199) | |
Education and Health Debt held by Government Enterprises | | | 720 | | | | 681 | | | | 600 | | | | 547 | | | | 505 | | | | 471 | |
Other Debt of Crown Organizations | | | 281 | | | | 266 | | | | 281 | | | | 264 | | | | 266 | | | | 263 | |
| | | | | | | | | | | | | | | | | | | | | | | | |
Subtotal | | | (10,748) | | | | (9,210) | | | | (7,654) | | | | (6,804) | | | | (6,337) | | | | (5,734) | |
| | | | | | | | | | | | | | | | | | | | | | | | |
Total Summary Borrowings, Guarantees & Obligations | | | 25,552 | | | | 24,063 | | | | 22,676 | | | | 21,051 | | | | 19,638 | | | | 17,191 | |
| | | | | | | | | | | | | | | | | | | | | | | | |
Adjustments to Arrive at Summary Net Debt | | | | | | | | | | | | | | | | | | | | | | | | |
Guarantees | | | (150) | | | | (170) | | | | (265) | | | | (166) | | | | (257) | | | | (165) | |
Adjustment Due to the Adoption of IFRS by The Manitoba Hydro-Electric Board | | | (502) | | | | - | | | | - | | | | - | | | | - | | | | - | |
Net Financial Assets | | | (4,474) | | | | (5,118) | | | | (5,067) | | | | (4,992) | | | | (4,831) | | | | (4,464) | |
| | | | | | | | | | | | | | | | | | | | | | | | |
Summary Net Debt | | | 20,426 | | | | 18,775 | | | | 17,344 | | | | 15,893 | | | | 14,550 | | | | 12,562 | |
| | | | | | | | | | | | | | | | | | | | | | | | |
NOTES:
| • | | The 2014/15 budget numbers and the 2014/15 forecast from the Third Quarter Financial Report have been re-stated to be consistent with the current presentation for the GRE. |
| • | | Details of expenditure and revenue for fiscal year 2015/16, and a reconciliation to the amounts reported for core government are found in Schedules 1 and 2. |
| • | | In-year adjustments/lapse could be an increase in revenue and/or decrease in expenditures. |
| • | | Numbers may not add due to rounding. |
B U D G E T 2 0 1 5 / 23
Manitoba Summary Financial Statistics
| | | | | | | | | | | | | | | | | | | | | | | | |
| | | 2015/16 | | | 2014/15 | | | 2013/14 | | | 2012/13 | | | 2011/12 | | | 2010/11 | |
| | | Budget | | | Forecast | | | Actual | | | Actual | | | Actual | | | Actual | |
| |
| | | (Percentage Change) | |
| | | | | | |
Annual Change | | | | | | | | | | | | | | | | | | | | | | | | |
Income Taxes | | | 4.8 | | | | 6.6 | | | | 4.4 | | | | 5.2 | | | | 6.8 | | | | 9.9 | |
Other Taxes | | | 3.6 | | | | 6.8 | | | | 10.6 | | | | 0.4 | | | | 4.1 | | | | 3.7 | |
Fees and Other Revenue | | | 0.4 | | | | (2.2) | | | | 8.2 | | | | 5.6 | | | | 4.3 | | | | 2.0 | |
Federal Transfers | | | (0.8) | | | | 1.8 | | | | (2.8) | | | | (8.7) | | | | 7.0 | | | | 3.1 | |
Total Revenue | | | 1.2 | | | | 4.0 | | | | 4.4 | | | | (0.5) | | | | 4.7 | | | | 4.5 | |
Health | | | 3.2 | | | | 3.4�� | | | | 4.6 | | | | 2.4 | | | | 5.6 | | | | 4.4 | |
Education | | | 2.1 | | | | 4.1 | | | | 6.7 | | | | (1.5) | | | | 5.3 | | | | 3.0 | |
Debt Servicing Costs | | | (0.4) | | | | 2.9 | | | | (2.1) | | | | 2.9 | | | | 5.4 | | | | 2.2 | |
Total Expenditure | | | 1.9 | | | | 3.5 | | | | 4.0 | | | | (3.5) | | | | 10.9 | | | | 4.4 | |
Summary Net Debt | | | 8.8 | | | | 8.3 | | | | 9.1 | | | | 9.2 | | | | 15.8 | | | | 7.9 | |
| |
| | | (Per Cent) | |
Per Cent of GDP | | | | | | | | | | | | | | | | | | | | | | | | |
Income Taxes | | | 5.8 | | | | 5.8 | | | | 5.6 | | | | 5.6 | | | | 5.6 | | | | 5.6 | |
Other Taxes | | | 6.2 | | | | 6.3 | | | | 6.1 | | | | 5.7 | | | | 6.0 | | | | 6.1 | |
Fees and Other Revenue | | | 3.2 | | | | 3.3 | | | | 3.6 | | | | 3.4 | | | | 3.4 | | | | 3.5 | |
Federal Transfers | | | 5.9 | | | | 6.1 | | | | 6.3 | | | | 6.7 | | | | 7.8 | | | | 7.6 | |
Total Revenue | | | 22.7 | | | | 23.2 | | | | 23.2 | | | | 23.1 | | | | 24.5 | | | | 24.7 | |
Health | | | 9.2 | | | | 9.3 | | | | 9.3 | | | | 9.3 | | | | 9.5 | | | | 9.5 | |
Education | | | 5.7 | | | | 5.8 | | | | 5.8 | | | | 5.7 | | | | 6.1 | | | | 6.1 | |
Debt Servicing Costs | | | 1.3 | | | | 1.3 | | | | 1.3 | | | | 1.4 | | | | 1.5 | | | | 1.5 | |
Total Expenditure | | | 23.5 | | | | 24.0 | | | | 24.1 | | | | 24.1 | | | | 26.3 | | | | 25.0 | |
Summary Net Debt | | | 30.9 | | | | 29.5 | | | | 28.3 | | | | 27.0 | | | | 26.1 | | | | 23.7 | |
| | | | | | |
Per Cent of Revenue | | | | | | | | | | | | | | | | | | | | | | | | |
Income Taxes | | | 25.7 | | | | 24.9 | | | | 24.2 | | | | 24.3 | | | | 22.9 | | | | 22.5 | |
Other Taxes | | | 27.5 | | | | 26.9 | | | | 26.2 | | | | 24.7 | | | | 24.5 | | | | 24.6 | |
Fees and Other Revenue | | | 14.3 | | | | 14.4 | | | | 15.3 | | | | 14.8 | | | | 13.9 | | | | 14.0 | |
Federal Transfers | | | 25.9 | | | | 26.5 | | | | 27.0 | | | | 29.0 | | | | 31.6 | | | | 31.0 | |
Net Income of Government Business Enterprises | | | 5.1 | | | | 5.8 | | | | 5.5 | | | | 5.4 | | | | 5.2 | | | | 6.2 | |
Sinking Funds and Other Earnings | | | 1.4 | | | | 1.6 | | | | 1.7 | | | | 1.8 | | | | 1.8 | | | | 1.8 | |
| |
| | | (Dollars) | |
Dollars Per Capita | | | | | | | | | | | | | | | | | | | | | | | | |
| | | | | | |
Total Revenue | | | 11,538 | | | | 11,532 | | | | 11,233 | | | | 10,887 | | | | 11,095 | | | | 10,704 | |
Total Expenditure | | | 11,979 | | | | 11,892 | | | | 11,645 | | | | 11,335 | | | | 11,906 | | | | 10,853 | |
Debt Servicing Costs | | | 649 | | | | 659 | | | | 649 | | | | 671 | | | | 661 | | | | 633 | |
Summary Net Debt | | | 15,751 | | | | 14,645 | | | | 13,706 | | | | 12,709 | | | | 11,794 | | | | 10,289 | |
| | | | | | |
Memorandum Items | | | | | | | | | | | | | | | | | | | | | | | | |
| | | | | | |
Population (000’s) * | | | 1,296.8f | | | | 1,282.0 | | | | 1,265.4 | | | | 1,250.5 | | | | 1,233.7 | | | | 1,220.9 | |
GDP at Market Prices | | | 66,051f | | | | 63,633 | | | | 61,244 | | | | 58,881 | | | | 55,829 | | | | 52,934 | |
Source: Manitoba Finance * official population July 1 f - Forecast | | | | | | | | | | | | | | | | | | | | | | | | |
24 / B U D G E T 2 0 1 5
B U D G E T 2 0 1 5 / 25
26 / B U D G E T 2 0 1 5
Budget Paper A
ECONOMIC REVIEW AND OUTLOOK
| | |
Available in alternate formats upon request. | |  |
| | | | |
ECONOMIC REVIEW AND OUTLOOK | | | | |
| |
CONTENTS | | | | |
| |
INTRODUCTION | | | 1 | |
| |
INTERNATIONAL ECONOMIC DEVELOPMENTS | | | 2 | |
| |
CANADIAN ECONOMIC DEVELOPMENTS | | | 4 | |
| |
MANITOBA ECONOMY | | | 5 | |
| |
ECONOMIC OUTLOOK | | | 15 | |
B U D G E T 2 0 1 5 E c o n o m i c R e v i e w a n d O u t l o o k / A 1
n INTRODUCTION
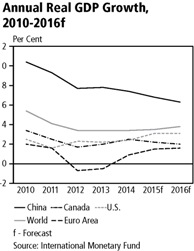
Gradual Improvements in Economic Growth, Outlook Marked by Uncertainty
The Manitoba economy continues to expand at a steady pace and remains one of Canada’s most stable provincial economies.
Following the Great Recession 2008/09 (recession), the uneven and modest pace of global growth slowed Manitoba’s average annual growth in the last five years relative to the five years preceding the recession.
Weather conditions have also affected Manitoba’s economic output, particularly for agriculture and construction. Wet weather and flooding in 2011 reduced real agriculture output to its lowest level in 14 years. Supported by core infrastructure projects, housing and private sector investments, Manitoba’s construction output increased to a record level in 2013.
| | |
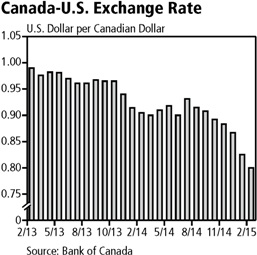
Manitoba’s industrial diversity helped balance growth in 2014. Strength in manufacturing, retail and wholesale was partially offset by reduced crop production and weakness in the oil sector. The pace and magnitude of the fall in crude oil prices has significantly elevated global economic uncertainty and has contributed to a depreciation of the Canadian dollar relative to the U.S. currency. It has also resulted in major commercial banks and other forecasters revising their economic forecasts for Canada and all provinces. Other significant risks generating global uncertainty include: a slower than expected growth in the U.S. economy, stalling of the fragile economic recovery in the euro area, and further slowing in China. Domestically, prolonged low oil prices could have larger implications on interprovincial trade. And, as in the recent past, weather and commodity price volatility can quickly change the economic and financial market outlook. | | 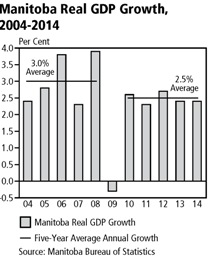 |
Depreciation of the Canadian currency by over 15% on the U.S. dollar has broad implications for Manitoba. U.S. priced products and services are directly 18% more expensive in Canadian dollar terms. This will put upward pressure on consumer prices, and for public and private sector imported machinery and equipment costs. Equally, the currency depreciation will make Manitoba’s manufactured goods more competitive in global markets.
The lower Canadian dollar could reduce cross-border shopping and at the same time increase Manitoba’s retail sales and tourism activity. Tourism in particular is benefitting from the opening of the Canadian Museum of Human Rights in September 2014, and the Investors Group Field that can now host larger entertainment and sporting events including the 2015 FIFA Women’s World Cup, the Grey Cup, and the opening ceremonies for the 2017 Canada Summer Games.
Given the opportunities and the challenges emerging from the uneven pace of global growth, oil price shock, and the dollar depreciation, on balance, Manitoba’s overall economic growth is expected to improve in 2015. The general consensus among forecasters is that Manitoba will gain from increased manufacturing sales, export sales and from the core infrastructure investment plan. The primary sector (mining and agriculture) will get a boost from the opening of two new mines in Manitoba and from increasing global demand for livestock.
Manitoba’s real GDP is expected to increase by 2.5% in 2015 and by 2.3% in 2016. Nominal GDP is expected to increase by 3.8% in 2015 and by 4.6% in 2016. Despite the upward pressure on prices from the currency depreciation, lower oil prices will keep consumer price increases well within the Bank of Canada target range, to 0.9% in 2015 and 2.3% in 2016.
A 2 / E c o n o m i c R e v i e w a n d O u t l o o k B U D G E T 2 0 1 5
n INTERNATIONAL ECONOMIC DEVELOPMENTS
Since the recession, it has been challenging for the global economy to gain any sustained footing in rebuilding aggregate demand. In the five years preceding the recession, economic growth had advanced at 4.9% annually, with growth above 5.0% in 2004, 2006 and 2007.
In the years following the recession, global growth sharply rebounded in 2010 with 5.4% growth, followed by a deceleration in growth, averaging 3.9% annually.
Deep cuts to interest rates, together with tax breaks and shovel-ready fiscal stimulus programs, provided a boost to growth in 2010. The subsequent general global slowdown is a result of restrained spending at all levels: businesses, households and governments, as balance sheets are being repaired. The euro area experienced the greatest slowdown and registered below zero growth in 2012 and 2013. Even the U.S., the world’s largest economy, averaged only 2.3% annual growth from 2011 to 2014. China has also slowed from reduced demand from Europe and the U.S. and from domestic factors.
| | |
 | | As prospects were encouraging for a sizable improvement in global growth in 2015, oil prices took a sharp turn down in late 2014, generating more economic uncertainty and risks. Mainly precipitated by over-supply conditions, West Texas Intermediate (WTI) crude oil price, for example, fell from over $105 per barrel (bbl) in July 2014 to below $50/bbl in March 2015. At prices below WTI $60/bbl, the Bank of Canada estimates that one-third of global oil production would be uneconomical. This would include production from the Canadian oil sands, U.S. shale, Brazil and Mexico. Given the scope and contribution of the oil industry to global growth through mega capital investment in innovation, exploration and jobs, an extended malaise in this industry could have broad negative implications on many sectors including finance, insurance, manufacturing, transportation, and wholesale trade. The repercussions in the oil industry have already started with cancellations of capital projects and job cuts. |
Low oil prices, on the other hand, provide a large benefit to an economy through cost savings. Lower transportation and heating costs improve personal and corporate balance sheets, and could translate into increased spending. Net energy importing regions, like the U.S., China and Europe should benefit from these savings.
While the fundamentals are different, the global economy experienced a similar decline in 2008 when WTI fell from $134/bbl to $39/bbl in seven months. At that time, prices recovered to a $70-$80/bbl range within a year and then averaged $95.8/bbl since 2011, with geopolitical events and other supply constraints occasionally increasing it above $100/bbl.
The current consensus among analysts on the outlook for oil prices is a general recovery in the second half of 2015 and into 2016 as supply is reduced by high-cost producers. The International Monetary Fund’s (IMF) initial assessment for the global economy suggests slower than previously anticipated growth. The losses in jobs and investments in energy and related sectors will outweigh the gains from lower fuel costs. As a result, the IMF lowered their medium-term global economic growth forecast by 0.3% to 3.5% in 2015 and 3.8% in 2016.
B U D G E T 2 0 1 5 E c o n o m i c R e v i e w a n d O u t l o o k / A 3
The U.S. economy, although growing at a historically slow pace, is adding a significant number of jobs. Since September 2010, the U.S. gained more than 10.8 million workers and in 2014, the economy added 2.63 million jobs, the largest annual increase since 1999. These gains are providing momentum in the overall domestic economy. Last year, real consumer spending increased to its strongest pace in eight years. Private capital spending improved with companies increasing their investments in structures, machinery and equipment. Even total federal and state government spending improved to a 0.2% contraction last year compared to the 3.0% and 2.0% contraction in 2011 and 2013, respectively.
Soft global demand and a strong currency limited U.S. export sales in 2014. Conversely, the stronger dollar and increased domestic spending pulled imports up and thereby lowered U.S. international terms of trade. Strong support from the domestic sector lifted overall real GDP in the U.S. to 2.4% in 2014.
| | |
Despite a huge increase in U.S. oil production since 2007, the U.S. economy is still a net importer of crude oil. So, the drop in prices is expected to complement the already strengthening domestic spending. As a result, the IMF has considered the U.S. as a growth leader among the G7, by projecting 3.1% real GDP growth in 2015. This bodes well for Canada and Manitoba since the U.S. is the single largest international export market for both economies. China, Manitoba’s second-largest international market, is undergoing policy reforms to rebalance the economy. Accommodative policies immediately following the recession led to a sharp increase in corporate, personal and local government debt. It fueled a housing boom to a point where it is now correcting. New reforms were introduced to mitigate the emerging risks in housing and the secondary financial markets. As these markets stabilize, real GDP growth is expected to moderate to 6.8% in 2015 down from an estimated growth of 7.4% in 2014. The economy will further slow to 6.3% in 2016. | | 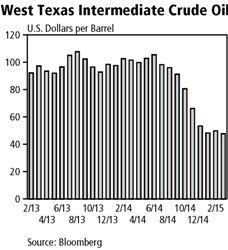
|
|
China is the world’s largest energy consumer and a net importer of oil. Lower energy prices should shore up domestic spending in the country. China also ships roughly 20% of its exports to the U.S., so the strengthening U.S. economy could recharge China’s manufacturing sector. |
High debt levels, weak export sales and low inflation continue to restrain spending in the euro area. The lack of sales growth has subdued business investment in new structures, machinery and workers. As a result, the euro area is maintaining a relatively high unemployment rate, especially in the peripheral countries.
Lower energy prices are expected to support growth in the euro area, but also elevate concerns of a deflationary cycle, where consumption is perpetually postponed in hopes for lower prices in the future. A more natural fiscal policy stance, the depreciation of the euro, and the quantitative easing action by the European Central Bank is expected to lift growth to 1.5% in 2015 and 1.6% in 2016.
A 4 / E c o n o m i c R e v i e w a n d O u t l o o k B U D G E T 2 0 1 5
n CANADIAN ECONOMIC DEVELOPMENTS
The Canadian economy, while growing slower than before the recession, has strengthened in the last three years. In 2014, real GDP increased by 2.5%, following 2.0% growth in 2013 and 1.9% in 2012. Last year, the economy was supported by solid gains in household spending and energy exports. Business capital investment expanded at a modest pace, while government investment spending decreased for the fourth consecutive year.
The Canadian labour market faced challenges in 2014, generating the smallest number of jobs in any non-recessionary period. Canada added just over 111,000 jobs compared to the historical average of 215,000 jobs per year since 1976 (including recessions). The number of hours worked declined for the first time since the recession, while growth in part-time jobs increased at a faster rate than full-time jobs. The slow labour market attracted fewer entrants and lowered the overall unemployment rate to 6.9% and the youth unemployment rate to 13.5%.
| | |
| | Commodity prices were mixed in 2014. After a number of years of consolidation in livestock production, increasing demand drove cattle and hog prices to record levels. Most base metal prices came under pressure in the second half of 2014 due to slower economic activity in China and the stronger U.S. currency. Often viewed as a hedge on inflation and a safe haven from economic and financial market uncertainty, gold saw a sharp decline in value in 2014 as U.S. economic data showed positive results. Natural gas prices got a boost during the extreme cold weather conditions last winter (“polar vortex”), while oil prices collapsed due to oversupply conditions. Canada is the fifth-largest oil producer in the world following China, the U.S., Russia and Saudi Arabia. Canadian oil is mostly extracted in Alberta, Saskatchewan and Newfoundland, with Alberta accounting for over 70% of production. In 2014, crude oil and crude bitumen exports contributed 18% or $92.6 billion to Canadian exports or 4.7% to Canada’s nominal GDP. |
Acknowledging the scope of oil production in Canada, the fall in oil prices poses a major challenge for overall growth in the near term. For example, the depreciation of the Canadian currency relative to the U.S. dollar is partially attributed to oil prices. The latest economic forecasts for Canada were revised down as they reflected an expected contraction in the energy industry and related sectors.
According to the Manitoba Finance survey of economic forecasters, Canadian real GDP will expand by 2.1% in 2015 and by 2.2% in 2016. With oil prices lowering the deflator, nominal GDP is expected to match real GDP growth at 2.1% in 2015. In 2016, nominal GDP is expected to increase by 4.7%.
Inflation in Canada is expected to average 0.9% this year and 2.3% in 2016. Canada’s unemployment rate is expected to progressively improve over the next two years, falling from 6.9% in 2014 to 6.7% in 2015 and 6.6% in 2016.
B U D G E T 2 0 1 5 E c o n o m i c R e v i e w a n d O u t l o o k / A 5
n MANITOBA ECONOMY
Economic diversity with a broad industrial base is a key attribute of the Manitoba economy. Financial industry analysts and economic forecasters consistently point to economic diversity as one of the province’s main assets.
Manitoba currently has 11 out of 16 industrial sectors, that each account for more than five per cent of overall production. The contribution from the largest sector to the smallest sector is the closest among provinces. Manitoba’s external trade is balanced with roughly half of the exports shipped to international markets and the other half shipped to other provinces. Likewise, the international market for Manitoba exports is broadening with a larger share of trade flowing into some of the fastest growing regions of the world, including China.
| | |
The province is located at the geographical centre of Canada. As a result, it has developed a well functioning distribution network with northwestern Ontario, western prairies and the northern territories. To the south, the mid-continent trade corridor provides trade and economic development links to the U.S. This natural advantage has allowed Manitoba to create the largest transportation and warehousing sector among provinces, accounting for 6.2% of Manitoba’s GDP. Over the past decade, Manitoba has been a choice destination for Canadian immigration, lifting population growth to near record levels and providing the labour market with a balanced supply of skilled workers and the broader economy with a steady flow of new consumers. These factors provide Manitoba a steady sustainable pace of economic growth, the most stable among provinces. With increased confidence, the private sector has shown the most consistent growth in capital spending in Canada. As well, durable growth in personal income allows Manitobans to be the most generous, in terms of giving to charities, and the least indebted, in terms of personal finances. | | 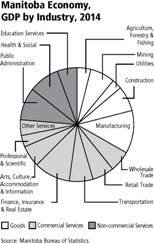 |
Globalization has introduced opportunities but it has also increased risks and uncertainty. Following the global pattern, Manitoba’s economic growth slowed since the recession, but remained relatively strong among provinces. From 2009 to 2014, Manitoba averaged 2.5% annual real GDP growth, the fourth best among provinces. In the five years prior to the recession (2004 to 2008), Manitoba averaged 3.0% annual growth.
According to Manitoba Bureau of Statistics, Manitoba’s real GDP growth rate is estimated at 2.4% in 2014. According to the Manitoba Finance survey of economic forecasters, real GDP growth is expected to improve modestly to 2.5% in 2015, and moderate to 2.3% in 2016.
Consumer price inflation has remained low and stable at 1.9% annual growth in 2014 and 2.2% in 2013. Early into 2015, prices are being pushed down by lower transportation costs and pulled up by food costs, due partially to tight meat supplies and the lower dollar. Overall, Manitoba’s inflation rate is averaging 0.9% in 2015.
A 6 / E c o n o m i c R e v i e w a n d O u t l o o k B U D G E T 2 0 1 5
Labour Market
| | |
Manitoba’s labour market benefits from a well-diversified industrial structure. This has historically provided balance, in terms of the steadiest job creation rate and among the lowest unemployment rate in Canada. During the recession, for example, several industries experienced a reduction in employment, but this was mostly offset in Manitoba by gains in other industries. This resulted |
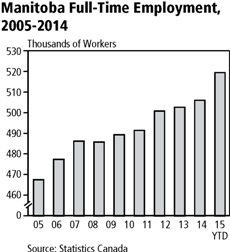
| | in employment growth contracting a mere 0.2% rate in 2009, the second best among provinces and better than the 1.7% decline in Canada. The unemployment rate was also the second lowest among provinces in 2009. Through the post-recession period and with near record population growth, Manitoba’s labour market remains well balanced with new jobs being created at about the same rate as new workers joining the labour market, thereby keeping the unemployment rate steady. Since 2009, Manitoba has generated on average 36,300 jobs, a 6% increase. Almost all of these jobs are in the private sector (33,700 jobs) and most of them are full time (30,500 jobs). This bodes well for personal income growth and household confidence in the province. In 2015, on a year-to-date basis, total employment in Manitoba has averaged a record 636,800 jobs, a 2.1% increase from 2014, the second strongest among provinces and above Canada (0.7%). The trend in full-time employment has continued with a 3.0% increase in 2015, the highest among provinces, while part-time employment is down by 1.6%. |
Compensation of Employees
The growth in full-time employment is reflected in overall wages and salaries earned in Manitoba. Over the last five years, compensation of employees (labour income) increased on average by 3.6%, the fourth strongest among provinces following Newfoundland, Alberta and Saskatchewan.
In the last five years, growth in labour income was driven by a 7.7% annual increase in the oil and gas sector, closely followed by construction at 6.9% annual growth. Other sectors with solid gains included agriculture, utilities, health care, and professional and personal services.
For the first time, labour income in Manitoba surpassed $30 billion in 2013. It increased a further 3.0% in 2014 to $31.5 billion. Total wages and salaries in professional and personal services, health care, trade (retail and wholesale trade), and manufacturing were each above $3 billion in 2014, while education, construction, finance and insurance were each above $2 billion.
Manufacturing
Manufacturing is Manitoba’s largest sector, accounting for approximately 11.2% of total real GDP output. The sector employs almost 64,000 workers, contributes over $3.2 billion in wages and salaries and generates almost $16 billion in annual sales.
The largest manufacturing industry is food manufacturing, providing a broad range of consumer products such as grain and oilseed milling, processed meat, potato products, dairy products and industrial agricultural feed products.
The second-largest manufacturing industry is transportation equipment, which is comprised mostly of aerospace products, and motor vehicle body and trailer products. The aerospace industry is led by three major firms: Boeing Canada Technology, StandardAero and Magellan Aerospace, as well as a number of established regional and national firms.
B U D G E T 2 0 1 5 E c o n o m i c R e v i e w a n d O u t l o o k / A 7
The motor vehicle body and trailer manufacturing sector specializes in the assembly of urban and intercity transit buses, fire trucks, motor homes, recreational vehicles, and trailers. Sales in the motor vehicle body manufacturing industry are concentrated in two large bus manufacturers: Motor Coach Industries International Inc. and New Flyer Industries Inc.
Other notable industries within manufacturing include machinery (mainly agricultural implements), primary metals, chemicals, fabricated metal products, wood products (cabinets and millwork), and electrical equipment such as industrial transformers.
Manitoba’s manufacturers posted a relatively strong rebound in 2014 as shipments to the U.S. improved. Total sales increased by 3.2%, compared to 0.2% growth in 2013.
| | |
Of the six major industries in Manitoba’s manufacturing sector, four posted strong gains in 2014. Strong Canadian housing investment coupled with improving U.S. demand drove furniture and related product sales by 9.2% in 2014 with sales of kitchen products increasing by 12.2%. Deliveries of aerospace and motor vehicle body products increased transportation equipment sales by 7.6% last year. High demand in the airline industry increased aircraft products and parts sales by 11.2% annually since 2011. Sales in this industry reached a record $1.4 billion in 2014. Strong non-residential construction activity increased fabricated metal product sales by 7.1% in 2014. The expansion and addition of retail, warehouse and commercial properties combined with core infrastructure investment spurred demand for architectural and structural metal products, increasing sales by 3.3% in 2014, and by 6.3% annually over the past four years. Sales in this industry are expected to surpass $1 billion in 2015. | | 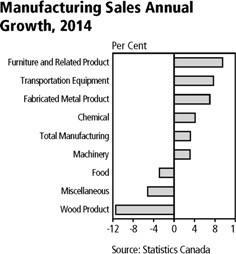
|
Growing demand for farm equipment increased Manitoba’s agricultural machinery sales by an average of 12.9% annually from 2010 to 2013. In 2014, sales of farm machinery increased by 3.1% to just over $2 billion.
Manitoba’s meat processing industry faces a number of challenges. The effect of the U.S. Country of Origin Labeling regulations, the porcine epidemic diarrhea virus and environmental regulations to protect water quality are some factors undermining livestock numbers. Labour shortages and soft global demand are also weighing on the industry. Sales from the meat processing industry have declined by 10.4% annually over the last eight years to $241 million from $580 million in 2006. Grain and oilseed milling is now Manitoba’s largest food manufacturing industry with $820 million in sales.
Employment in Manitoba’s manufacturing industries grew by 1.9% or 1,200 jobs in 2014, the third-best growth among provinces and the fourth consecutive year of manufacturing employment growth.
The outlook for manufacturing looks bright with the depreciation of the Canadian currency and strengthening U.S. demand. Near-record livestock prices should encourage a rebuilding of herds, thereby increasing supply and sales.
A 8 / E c o n o m i c R e v i e w a n d O u t l o o k B U D G E T 2 0 1 5
Agriculture
Large-scale production of grains, oilseeds, vegetables, specialty crops and livestock form the backbone of Manitoba’s agriculture sector, bringing economic development and vibrancy to rural Manitoba. The sector supports many corporations and unincorporated businesses in a wide range of areas including transportation, finance and real estate, manufacturing, wholesale merchants and retail trade.
Largely influenced by prices, farm cash receipts from Manitoba’s agriculture sector are relatively evenly balanced between crop production and livestock production.
The sector is subject to global and Canadian supply and demand conditions for food products. With growing global population and improving personal incomes in two of the world’s most populated countries, China and India, agricultural producers are optimistic about an expanding market. Manitoba is in a good position to contribute to this growing need, with over 30,000 square miles of cultivable land.
| | |
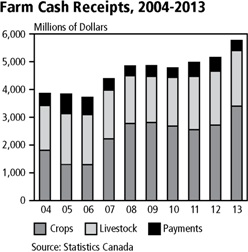
| | In 2013, Manitoba crop producers reaped a record harvest and generated $3.4 billion in crop receipts. This was a 25% increase from the previous year, the first time crop receipts rose above $3.0 billion. Wheat producers took in over $1.0 billion in receipts, the highest ever. The livestock sector benefited from high prices and also generated the highest cash receipts in history at $2.0 billion in 2013. The improvement in marketed cash receipts lowered direct program payments, which include insurance and other support programs to stabilize farm incomes, from $495 million to $371 million. Total farm cash receipts were over $5.8 billion in 2013, growing by 12.0% from the previous year and the best growth nationally. In 2014, market conditions for crop and livestock producers diverged. Crop producers encountered lower prices as grain and oilseed inventories increased from a second consecutive global bumper crop. Tight livestock numbers, on the other hand, drove up cattle and hog prices to record levels. |
In addition to low prices, Manitoba crop producers reduced the number of acres seeded in 2014 due to unusually cold and wet weather conditions. Weather conditions for the rest of the growing season were less than ideal and as a result, total volume of production was down from the record crop of 2013, although it remained above the 10-year average. Production of wheat was down by 29%, while canola was down by 19%. Barley and corn production was down by 50% and 43%, respectively.
Tolerant to wet springs, soybean harvest bucked the downward trend and production increased by 3.7% in 2014. Soybean production is a success story for Manitoba. Statistics Canada only started reporting Manitoba’s soybean harvest in 2001, when the province produced 2% of the Canadian total. By 2014, Manitoba’s contribution had jumped to 18% of the Canadian total, with production increasing by 30% annually.
Reflecting the smaller overall harvest and lower prices, farm cash receipts from crop production fell by 0.7% in the first three quarters of 2014, compared to the same period in 2013. Receipts from wheat production were down 16%, while barley receipts were down 27%. Oilseeds continue to show higher receipts in 2014, with canola increasing by 8% and flax increasing by 6%.
B U D G E T 2 0 1 5 E c o n o m i c R e v i e w a n d O u t l o o k / A 9
Cattle and hog producers in Manitoba received unprecedented prices for their product in 2014. Cattle prices at the processing level averaged $139.42 per hundred weights in 2014. Hog prices averaged $91.15 per hundred weight.
These record prices are a result of tight North American livestock supplies. Prolonged drought conditions in the U.S. have severely limited cattle supplies. The number of beef cows in the U.S., for example, is at its lowest level since 1962. The porcine epidemic diarrhea virus reduced pork production significantly in the U.S. in 2014 and poultry supplies were also restrained. Domestic and global demand for meat remained strong further supporting prices. Country of Origin Labeling legislation has reduced returns for Canadian producers.
High prices, strong demand and lower feed costs have improved margins for Manitoba livestock producers in 2014. Cash receipts from cattle and hog sales both increased by 36% in the first three quarters of 2014. Receipts from other livestock producers are up 13% in 2014.
The outlook for Manitoba agriculture looks promising for 2015. Tight supply conditions should continue to support relatively high prices for livestock. The soil moisture conditions for spring seeding are currently favourable for grain and oilseed producers, however, prices are still impacted by the large global supplies.
In addition, the Canada-Korea Free Trade Agreement and Trans-Pacific Partnership Agreement, together with the new Canada and European Union Comprehensive Economic and Trade Agreement hold new opportunities for crop and livestock producers, food processors and farm machinery manufacturers in Manitoba.
Mining and Oil Production
Mining and oil production is a key contributor to the Manitoba economy and is the province’s second-largest primary resource industry. The minerals sector directly employs 6,900 workers, mostly residing in northern and western Manitoba, and offers among the highest wages.
| | |
Output in the sector is divided into three categories: metallic mining, industrial minerals, and crude oil extraction. The largest metallic commodities in Manitoba are nickel, copper, zinc, gold and silver. Main industrial minerals are cesium, granite, gypsum, limestone, marble and peat moss. Manitoba produces light sour blend crude oil. The mining and oil production sector adds approximately 6.5% to Manitoba’s GDP. The sector generates $3 billion in value of production. Crude oil contributes $1.6 billion or 54% to the value of production, while metallic mining adds $1.2 billion or 39% and industrial minerals adds $214 million or 7%. There are approximately 40 companies active in mineral exploration and metallic mining in Manitoba. The province has eight producing mines, one operating smelter and two refineries. There are about 11 major producers active in the industrial minerals sector in Manitoba. | | 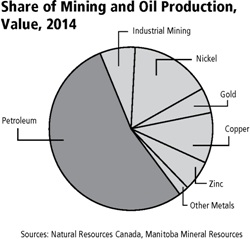 |
There are 39 companies that produce oil in Manitoba, ranging from large multinationals to small locally based producers. At the end of 2014, there were 5,077 producing oil wells in Manitoba. The crude oil that is produced in Manitoba is shipped through the Enbridge pipeline system or via Canadian National Railway to refineries in eastern Canada, and the northeast and north-central areas of the U.S.
A 10 / E c o n o m i c R e v i e w a n d O u t l o o k B U D G E T 2 0 1 5
With the price of West Texas Intermediate oil averaging over $90/bbl from 2011 to 2014, Manitoba’s oil production quickly expanded. Real output in oil production increased by 16.5% annually for the five years ending in 2013, with growth in both 2011 and 2012 at above 26%.
Crude oil production increased to 19.2 million barrels in 2013, closely matching the level in 2012.
Last year, 464 new oil wells were drilled, down from 553 in 2013. After two years of relatively high volumes, crude oil production decreased to 17.3 million barrels. Lower production and prices dropped the value of production by 8.3% in 2014.
Mining development activities, in 2014, are highlighted by the commissioning of two new mines in the Snow Lake region. The Lalor mine also officially opened on September 24, 2014. It contains gold, copper, zinc and silver, and is expected to be in production until at least 2030 and beyond. The total budget for construction of the mine is $441 million and its ore will be processed at the refurbished Snow Lake concentrator, which now has a capacity of 2,700 tonnes per day.
Reed copper mine officially opened on September 24, 2014. This mine is expected to add approximately 15,000 tonnes of annual copper production over a five-year mine life. It is located 120 kms from Flin Flon, and ore is transported to the Flin Flon concentrator for processing.
Most base metals have generally come under pressure as demand from Asia remains modest and prices are off their pre-recession peak levels. Nickel prices averaged US$7.65/lb in 2014, up 12% from the previous year but down significantly from US$16.89/lb in 2007. Copper averaged US$3.11/lb last year, down 6.3% from 2013 and from US$4.00/lb in 2011. Zinc prices increased by 12.6% in 2014 to US$0.98/lb in 2014, but are much lower from a peak of US$1.48/lb in 2006.
Manitoba produces approximately 12% of Canada’s nickel. In 2014, the value of nickel production increased by 13.9%, despite a 4.3% reduction in the volume of output. Zinc production was unchanged in 2014; however, higher prices increased the value of sales by 20%. Gold volume and value fell by 24% and 27%, respectively, and copper was the only base metal that saw a notable 24% increase in production and a 27% increase in value.
| | |
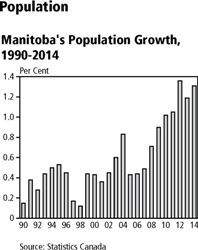 | | Manitoba is experiencing a remarkable gain in population. Over the last 10 years, the province has added close to 120,000 persons. Over the last five years, population growth has averaged 1.2% annually. These increases are among the strongest in 50 years and an important turnaround from the late 1990s when population growth averaged 0.3%. Manitoba’s population growth has been the third fastest among provinces in the last six years following Alberta and Saskatchewan. Immigration to Manitoba averaged close to 15,000 persons annually in the last five years, well above the 11,000 person average in the previous five years and a stark contrast to the 4,000 person average in the late 1990s. Young families immigrating to Manitoba and the echo boom generation maturing into adulthood are both contributing to the natural increase in population. The number of births in the province has rapidly climbed from 13,811 in 2004 to 16,392 in 2014, the highest level since 1994. |
Manitoba is experiencing a remarkable gain in population. Over the last 10 years, the province has added close to 120,000 persons. Over the last five years, population growth has averaged 1.2% annually. These increases are among the strongest in 50 years and an important turnaround from the late 1990s when population growth averaged 0.3%. Manitoba’s population growth has been the third fastest among provinces in the last six years following Alberta and Saskatchewan.
Immigration to Manitoba averaged close to 15,000 persons annually in the last five years, well above the 11,000 person average in the previous five years and a stark contrast to the 4,000 person average in the late 1990s. Young families immigrating to Manitoba and the echo boom generation maturing into adulthood are both contributing to the natural increase in population. The number of births in the province has rapidly climbed from 13,811 in 2004 to 16,392 in 2014, the highest level since 1994.
B U D G E T 2 0 1 5 E c o n o m i c R e v i e w a n d O u t l o o k / A 11
The natural growth and immigration have lowered Manitoba’s median population age to 37.7 years. It is the third lowest among provinces after Saskatchewan and Alberta. It is also opposite of the national trend where the aging baby boom generation has increased the median age.
In 2014, Manitoba’s population increased by 16,638 persons. Net international migration increased to 14,717 persons up from 11,605 persons in 2013. The natural increase in population was 5,731 persons, while the net interprovincial out migration was 6,192 persons.
Manitoba Finance’s survey of demographic forecasters highlights a continuing positive trend in Manitoba’s population growth, increasing by 1.3% in 2015 and 2016, and above the recent five-year average of 1.2%.
Housing
Investment spending from residential construction was important in supporting economic growth in Manitoba through the post-recession period. Low vacancy rates, low mortgage rates, increasing number of young adults and seniors, and strong population growth have all contributed to the surge in construction of new single and multiple units of residential properties throughout Manitoba.
Easier financing options, tax incentives and rising property values also motivated renovation investments in some of the older stock of housing in the province.
In the last five years, Manitoba added almost 33,000 new housing units, of which 19,000 were the higher-value single-family detached units and 14,000 were semi-detached or multiple units. This was a 31% increase over the previous five years, the second strongest among provinces and stands in contrast to the 6% decline in Canada. Twenty-seven per cent of all new housing units built in Manitoba were in rural areas.
| | |
Residential resale activity has stabilized in the last two years at around 13,700 units annually compared to 13,900 units in 2012. Property values in Manitoba remain affordable with the average residential resale price in 2014 at $266,329, the fourth lowest among provinces. The Housing Affordability Report, published by RBC Economics Research, ranks Manitoba as having the most affordable housing in Canada in two out of three housing categories: standard two-storey and standard condo, with Manitoba ranked fourth among provinces in the detached-bungalow category. After several years of strong growth, 2014 saw a correction in new residential construction activity. The total number of housing starts decreased 16.7%, after posting the largest number of starts in 26 years in 2013. Single-family housing starts decreased 17.6%, while multiple units declined by 15.7%. Economic and demographic fundamentals are sound for continued growth in housing in 2015. Canada Mortgage and Housing Corporation forecasts that Manitoba’s total housing starts will strengthen from 6,220 units in 2014 to 6,300 units in both 2015 and 2016. Canadian housing starts are expected to decline this year and next year. | | 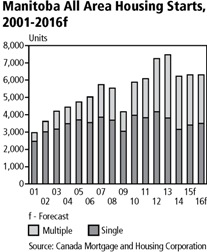
|
A 12 / E c o n o m i c R e v i e w a n d O u t l o o k B U D G E T 2 0 1 5
Property sales will continue to be supported by population growth, with total resales increasing to an expected 14,000 transactions in 2015 and 14,200 transactions in 2016. Reflecting a balanced market, the average price is expected to increase by 2.3% to $272,400 in 2015.
Retail Trade
Corresponding to strong population and labour income growth, consumer spending has been growing at a solid pace in Manitoba. Over the last 10 years, retail sales increased by 4.4% annually, tied with Newfoundland for the third strongest among provinces following Saskatchewan and Alberta. Retail trade adds approximately 5.6% to value-added production in Manitoba and employs 39,000 workers.
| | |
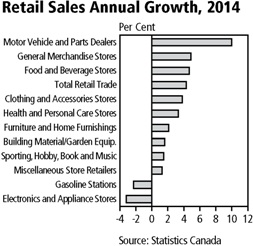
| | According to the Statistics Canada survey, total retail sales were just over $18 billion in 2014, with motor vehicle and parts dealers’ sales at $4.4 billion, the largest among all categories. Food and beverage stores reported $4.2 billion in sales and general department stores reported $2.5 billion. Gasoline stations reported $2.2 billion in sales. The largest three sectors, motor vehicle and parts dealers; food and beverage; and general and department stores, make up almost two-thirds of all Manitoba retail sales. Total retail sales increased by 4.3% in 2014, exceeding the previous year’s growth and the fifth highest among provinces, and compared favourably to the 4.6% national increase. Sales increases were broad based among all the major categories. Sales rose on the strength of motor vehicle and parts sales 10.0%, department stores 4.9%, food and beverage stores 4.7%, clothing stores 3.8% and health and personal services 3.3%. Sales declined at gasoline stations 2.3% and in electronics and appliances 3.2%. |
After three years of 7.5% average growth, the growth in the number of new motor vehicle sales slowed in 2014, increasing by 2.7% to 57,783 units, the sixth-best growth rate nationally. The sale of trucks, including SUVs and minivans, represents 69.7% of all new motor vehicles sold and continues to show strong growth, rising 7.6% in 2014 (40,256 units). This follows on a 7.1% increase in 2013. Passenger car sales declined 7.2% in 2014 (17,527 units), but this comes after increasing more than 9% average growth in the previous two years.
Wholesale Trade
As a central distribution hub for Canada, wholesale trade has always played a key role in value-added production in Manitoba. The sector currently contributes 5.5% of GDP and employs approximately 25,000 Manitobans.
Reflecting the province’s industrial diversity, there is an evenly distributed variety of wholesale merchants. The largest is machinery and equipment, accounting for 26% of activity, followed by food, beverage and tobacco products; and building material and supplies, both at 14%. Farm product merchants account for 12%, while personal and household goods, motor vehicle and parts, and petroleum products account for 8%, 7% and 6%, respectively.
B U D G E T 2 0 1 5 E c o n o m i c R e v i e w a n d O u t l o o k / A 13
| | |
The expansion of wholesale sales in Manitoba has been strong over the past decade, increasing by 5.6% annually, the fourth highest among provinces following Saskatchewan, Newfoundland and Alberta. Canadian sales over the same period increased by 3.6%. The wholesale trade sector did particularly well in 2014 with sales increasing by 8.6%, the third-highest among provinces. Wholesale merchants surpassed $17.3 billion in sales, closely rivalling retail sales that are just under $18.0 billion. Through marketing of the 2013 bumper crop, farm product sales jumped 38.7% in 2014. Sales from building material and supplies increased by 11.8%, and machinery and equipment sales rose 11.5%. Motor vehicle and parts supplies merchants saw a 4.4% increase in sales, and personal and household goods gained 1.0%. | | 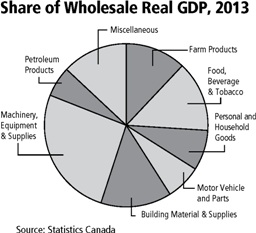 |
Capital Investment
Capital investment provides a good indication of business and household confidence. Large-scale investments are generally undertaken when there is greater assurance in the market and the economic outlook. Capital investment provides an immediate boost to the economy through jobs and spending on goods and services, and long-term benefits by lifting the productive capacity of the economy.
| | |
In Manitoba, the stable economic and labour market performance has been ideal for reassuring potential business and household investors. Private sector capital investment has increased in all but one of the last 25 years, the most consistent profile among provinces. The number of housing units being constructed are the highest since 1987. The strong and sustained pace of capital spending in Manitoba has elevated its contribution to total domestic real spending in the economy from 16% in 1993 to 23% by 2013. The business sector accounts for most of the capital spending in the province at a 78% share, while the three levels of government (federal, provincial and municipal) account for 21%, and the non-profit institutions serving households account for 1%. Over the past two decades, Manitoba has experienced significant growth in nominal capital spending, averaging 6.5% annually, fourth strongest among provinces following the three energy-rich provinces of Alberta, Saskatchewan and Newfoundland. Spending by businesses (6.6%), governments (6.2%) and non-profit institutions (6.8%), increased at a similar annual pace over this period. | | 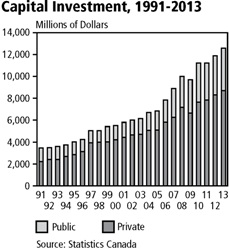
|
In the four years following the recession, cheap imports, through an appreciating Canadian dollar and strong population growth, propelled business investments up by 8.0% annually, with spending on machinery and equipment increasing by 10.1% annually and housing investments increasing by 8.9%. The three levels of government moderated investment spending to 5.9% annually from 2009 to 2013.
A 14 / E c o n o m i c R e v i e w a n d O u t l o o k B U D G E T 2 0 1 5
| | |
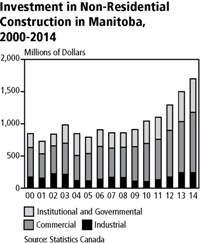
| | Statistics Canada shows continued strength in capital expenditures in Manitoba in 2014. Nominal investment in non-residential building construction increased by 13.2%. These investments were supported by an 18.5% increase in commercial building projects and an 11.3% increase in institutional building projects. Capital spending on industrial buildings contracted by 0.3% in 2014 after a 39.7% increase in 2013. Total capital investment in residential properties fell by 0.7% in 2014 with decreased spending on new units largely offset by increased spending on renovations, conversions, mobile units and cottages. Corresponding to fewer housing starts in 2014, investment in new housing units fell by 6.3% last year, while spending on residential renovations, the largest component, continued at a firm pace, increasing by 4.7%. |
Looking forward, the Conference Board of Canada has marked the Manitoba construction industry as a growth leader over the short term. “The five-year core infrastructure investment program is contributing growth to the economy in the short and medium terms, and Manitoba should reap the economic benefit of increased productivity resulting from this investment over the long run. In addition to the immediate positive impact of key strategic infrastructure activities (such as CentrePort, key trade routes, and enhanced flood protection), the boost to the economy will last well past the construction phases.”
According to the Conference Board of Canada, the value added in Manitoba’s construction sector is expected to increase on average by 6.4% annually from 2014 to 2017, the highest among provinces and above the 2.6% annual national increase.
Foreign Merchandise Exports
Globalization and trade agreements have encouraged more trade across countries. As these new opportunities open, Manitoba businesses and agricultural producers are taking advantage by increasing volumes and broadening markets.
Over the last 20 years, real exports have increased by 4.0% annually, the second-fastest growth among provinces and above the national increase of 3.3%. In the post-recession period, Manitoba’s exports grew the fastest among non-resource based provincial economies. This solid pace of growth has increased the contribution of exports from 43% of total real expenditures in 1993 to 58% by 2013.
Centrally located in North America, Manitoba also has one of the most balanced export markets in Canada. On average, over 52% of Manitoba export sales are destined for international markets, and 48% for provincial markets. The U.S. dominates the international market with 67% share of all foreign merchandise exports. This is considerably lower than the national average of 77%, indicating that Manitoba has a lower exposure to the U.S. market than Canada overall.
China is Manitoba’s second-largest international export market with 7.5% share of foreign merchandise exports. Manitoba currently exports over $1 billion in sales to China. Relative to other provinces, at 7.5%, Manitoba has the second-largest share of exports
B U D G E T 2 0 1 5 E c o n o m i c R e v i e w a n d O u t l o o k / A 15
to China, following British Columbia. Japan is Manitoba’s third-largest export market with a 5.3% share and the European Union accounts for 3.5% of Manitoba’s foreign export sales.
| | |
Provincially, Ontario is by far Manitoba’s largest market, accounting for approximately 41% of interprovincial exports (2011 latest information). Alberta accounts for roughly 19% of interprovincial exports, while Quebec and Saskatchewan are relatively equally matched at 13% and 12%, respectively. British Columbia accounts for 10% of interprovincial exports, while the Maritime provinces account for 3%. Manitoba’s export performance has fluctuated since 2009 with swings generated from weather-related changes in grain production and sales. Wet weather and flooding in 2011 and 2012 resulted in a 21% drop in exports of agricultural products, pushing down overall foreign merchandise exports by 2.7%. The bumper crop in 2013 led to a 47% increase in agricultural exports and contributed to a 10.4% increase in overall exports. Export sales of manufactured goods have grown at a relatively strong pace since 2011, expanding on average by 7.1% annually. Shipments of food products, transportation equipment, and wood products were the main exports driving growth. | | 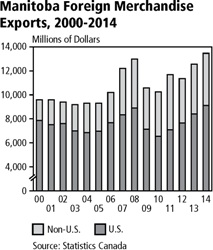 |
With uneven pace of growth in overseas markets, the U.S. has been a key destination for Manitoba exports over the last four years, with sales accelerating by 8.6% annually. In 2014, exports to the U.S. increased by 8.4% to a record $9.1 billion, with notable sales of manufactured products and primary products (crops and livestock).
Reduced shipments of nickel and processed meat products drove down export sales to China by 2.7% in 2014; however, the Asian market was supported by a 47% increase to Taiwan and a 45% increase to Hong Kong.
Demand for Manitoba goods and services is expected to remain firm in 2015 with stronger growth predicted for the U.S. economy. The weaker currency is also expected to boost sales as Manitoba products become more competitive.
n ECONOMIC OUTLOOK
Manitoba Finance surveys several independent economic forecasting agencies regarding their economic projections for Manitoba and Canada. The survey is used to establish a consensus for the medium-term economic outlook.
The recent dramatic fall in oil prices generated large revisions to the economic forecasts for Canada and all provinces. Further revisions are likely if oil prices move rapidly in either direction. This adds to the already high level of economic uncertainty, especially for sectors that have a high exposure to the oil industry and for the Canadian exchange rate.
The most recent survey shows slower-than-previously-forecast medium-term real GDP growth for Canada and for the large oil-producing provinces, and slightly improved expectations for provinces with relatively high non-energy related exports to the U.S. Canada is expected to grow by 2.1% in 2015 and by 2.2% in 2016, down from 2.5% in 2014.
A 16 / E c o n o m i c R e v i e w a n d O u t l o o k B U D G E T 2 0 1 5
According to the Manitoba Bureau of Statistics, Manitoba’s real GDP is estimated at 2.4% in 2014. Manitoba Finance survey of economic forecasters estimates real GDP in 2014 at 2.0%.
In Manitoba, the depreciation of the Canadian dollar is expected to lift manufacturing and export sales, while base metal production is expected to increase from two new mines in Northern Manitoba. The livestock industry should continue to benefit from high prices. The core infrastructure program will also support growth throughout the province. As a result, Manitoba’s real GDP is expected to increase by 2.5% in 2015, a 0.1% improvement from last year’s budget estimates. Nominal GDP is expected to soften to 3.8% in 2015 from an estimated 3.9% increase in 2014. For 2016, real GDP growth is expected to moderate to 2.3%.
The current momentum in the labour market is expected to lift employment growth to 1.2% in 2015 and to 1.1% in 2016. The unemployment rate is expected to remain steady at 5.4% in both 2015 and 2016, reflecting a balanced labour market.
The U.S. is currently viewed as a growth leader among the G7, however, slower-than-anticipated growth in 2015 could pose a risk to the medium-term outlook. The Chinese economy is expected to slow slightly in 2015, but if reforms to mitigate risks in their housing and secondary financial markets fall short, the economy could slow further. Also, weather and commodity price volatility can quickly change the outlook.
Manitoba Outlook at a Glance
| | | | | | |
| | | 2014 | | 2015f | | 2016f |
| | |
| | | | | (per cent change unless noted) | | |
Gross Domestic Product | | | | | | |
Real | | 2.4 | | 2.5 | | 2.3 |
Nominal | | 3.9 | | 3.8 | | 4.6 |
Employment | | 0.1 | | 1.2 | | 1.1 |
Unemployment Rate (%) | | 5.4 | | 5.4 | | 5.4 |
Consumer Price Index | | 1.9 | | 0.9 | | 2.3 |
Population | | 1.3 | | 1.3 | | 1.3 |
f-Forecast
Sources: 2014 Statistics Canada and Manitoba Bureau of Statistics. 2015f and 2016f Manitoba Finance survey of economic forecasters.
B U D G E T 2 0 1 5 E c o n o m i c R e v i e w a n d O u t l o o k / A 17
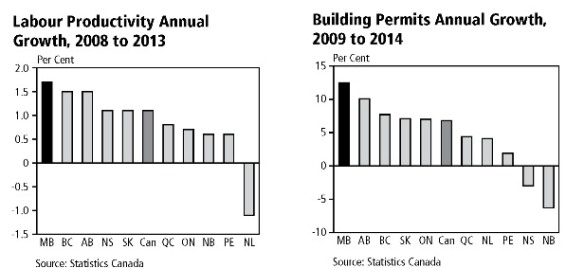
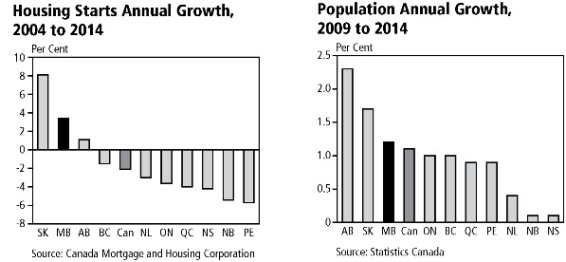

A 18 / E c o n o m i c R e v i e w a n d O u t l o o k B U D G E T 2 0 1 5
MANITOBA ECONOMIC STATISTICS, 2009 TO 2014
| | | | | | | | | | | | | | | | | | | | |
| | | 2010 | | | 2011 | | | 2012 | | | 2013 | | | 2014 | |
| | | | | | (Millions of Dollars) | | | | |
POPULATION | | | | | | | | | | | | | | | | | | | | |
July 1 (000’s) | | | 1,221 | | | | 1,234 | | | | 1,251 | | | | 1,265 | | | | 1,282 | |
| | | | | |
GROSS DOMESTIC PRODUCT1 | | | | | | | | | | | | | | | | | | | | |
Nominal | | | 52,934 | | | | 55,829 | | | | 58,881 | | | | 61,244 | | | | 63,633 | |
Real (chained 2007 dollars) | | | 52,361 | | | | 53,541 | | | | 55,009 | | | | 56,348 | | | | 57,700 | |
| | | | | |
SECTORS | | | | | | | | | | | | | | | | | | | | |
Farm Cash Receipts | | | 4,781 | | | | 4,971 | | | | 5,146 | | | | 5,767 | | | | n/a | |
Crops | | | 2,683 | | | | 2,550 | | | | 2,718 | | | | 3,404 | | | | n/a | |
Livestock | | | 1,748 | | | | 1,921 | | | | 1,934 | | | | 1,992 | | | | n/a | |
Direct Payments | | | 349 | | | | 501 | | | | 495 | | | | 371 | | | | n/a | |
Manufacturing Shipments | | | 14,367 | | | | 15,229 | | | | 15,398 | | | | 15,428 | | | | 15,926 | |
Mining | | | 2,582 | | | | 3,188 | | | | 3,005 | | | | 3,071 | | | | 3,001 | |
Electric Power Sales | | | 1,569 | | | | 1,592 | | | | 1,547 | | | | 1,805 | | | | 1,833 | |
Export Sales | | | 410 | | | | 354 | | | | 321 | | | | 389 | | | | 400 | |
Housing Starts (no. of units) | | | 5,888 | | | | 6,083 | | | | 7,242 | | | | 7,465 | | | | 6,220 | |
Retail Trade | | | 15,770 | | | | 16,443 | | | | 16,652 | | | | 17,297 | | | | 18,034 | |
New Car Sales (no. of units) | | | 45,355 | | | | 48,546 | | | | 52,236 | | | | 56,275 | | | | 57,783 | |
| | | | | |
FOREIGN EXPORTS | | | | | | | | | | | | | | | | | | | | |
Total Exports | | | 10,238 | | | | 11,678 | | | | 11,363 | | | | 12,550 | | | | 13,466 | |
U.S. | | | 6,545 | | | | 7,096 | | | | 7,655 | | | | 8,407 | | | | 9,115 | |
| | | | | |
LABOUR MARKET | | | | | | | | | | | | | | | | | | | | |
Labour Force (000’s) | | | 643.9 | | | | 647.4 | | | | 656.6 | | | | 661.5 | | | | 662.1 | |
Employment (000’s) | | | 609.0 | | | | 611.7 | | | | 621.6 | | | | 625.8 | | | | 626.5 | |
Participation Rate (%) | | | 69.4 | | | | 68.9 | | | | 68.9 | | | | 68.6 | | | | 67.8 | |
Unemployment Rate (%) | | | 5.4 | | | | 5.5 | | | | 5.3 | | | | 5.4 | | | | 5.4 | |
Average Weekly Earnings ($) | | | 780.77 | | | | 801.33 | | | | 822.99 | | | | 827.52 | | | | 862.87 | |
| | | | | |
INVESTMENT | | | | | | | | | | | | | | | | | | | | |
Total | | | 11,218 | | | | 11,213 | | | | 11,894 | | | | 12,578 | | | | 12,391 | |
Private | | | 7,635 | | | | 7,850 | | | | 8,305 | | | | 8,691 | | | | 8,522 | |
Public | | | 3,582 | | | | 3,363 | | | | 3,589 | | | | 3,887 | | | | 3,869 | |
Non-residential | | | 8,567 | | | | 8,381 | | | | 8,745 | | | | 9,446 | | | | 9,389 | |
Housing | | | 2,651 | | | | 2,832 | | | | 3,149 | | | | 3,132 | | | | 3,002 | |
| | | | | |
CONSUMER PRICE INDEX | | | | | | | | | | | | | | | | | | | | |
(Index, 2002 = 100) | | | 115.0 | | | | 118.4 | | | | 120.3 | | | | 123.0 | | | | 125.3 | |
| | | | | |
BANKRUPTCIES | | | | | | | | | | | | | | | | | | | | |
Business | | | 68 | | | | 60 | | | | 36 | | | | 55 | | | | 48 | |
Farm | | | 6 | | | | 5 | | | | 7 | | | | 13 | | | | 2 | |
Personal | | | 1,994 | | | | 1,514 | | | | 1,276 | | | | 1,214 | | | | 1,200 | |
1 2014 are preliminary estimates by Manitoba Bureau of Statistics.
Sources: Statistics Canada, Manitoba Bureau of Statistics and Manitoba Finance.
Totals may not add due to rounding.
B U D G E T 2 0 1 5 E c o n o m i c R e v i e w a n d O u t l o o k / A 19
| | | | | | | | | | | | | | | | | | | | |
| 2010 | | | 2011 | | | 2012 | | | 2013 | | | 2014 | | | |
| | | | (Annual Percentage Change) | | | | | | |
| | | | | | | | | | | | | | | | | | | | POPULATION |
| | 1.0 | | | | 1.0 | | | | 1.4 | | | | 1.2 | | | | 1.3 | | | July 1 (000’s) |
| | | | | |
| | | | | | | | | | | | | | | | | | | | GROSS DOMESTIC PRODUCT1 |
| | 4.5 | | | | 5.5 | | | | 5.5 | | | | 4.0 | | | | 3.9 | | | Nominal |
| | 2.6 | | | | 2.3 | | | | 2.7 | | | | 2.4 | | | | 2.4 | | | Real (chained 2007 dollars) |
| | | | | |
| | | | | | | | | | | | | | | | | | | | SECTORS |
| | -1.5 | | | | 4.0 | | | | 3.5 | | | | 12.0 | | | | n/a | | | Farm Cash Receipts |
| | -4.7 | | | | -5.0 | | | | 6.6 | | | | 25.3 | | | | n/a | | | Crops |
| | 5.8 | | | | 9.9 | | | | 0.7 | | | | 3.0 | | | | n/a | | | Livestock |
| | -9.6 | | | | 43.3 | | | | -1.2 | | | | -25.0 | | | | n/a | | | Direct Payments |
| | -2.1 | | | | 6.0 | | | | 1.1 | | | | 0.2 | | | | 3.2 | | | Manufacturing Shipments |
| | 31.0 | | | | 23.5 | | | | -5.8 | | | | 2.2 | | | | -2.3 | | | Mining |
| | 0.5 | | | | 1.5 | | | | -2.8 | | | | 16.7 | | | | 1.6 | | | Electric Power Sales |
| | 2.6 | | | | -13.6 | | | | -9.3 | | | | 21.3 | | | | 2.9 | | | Export Sales |
| | 41.1 | | | | 3.3 | | | | 19.1 | | | | 3.1 | | | | -16.7 | | | Housing Starts (no. of units) |
| | 5.7 | | | | 4.3 | | | | 1.3 | | | | 3.9 | | | | 4.3 | | | Retail Trade |
| | 3.1 | | | | 7.0 | | | | 7.6 | | | | 7.7 | | | | 2.7 | | | New Car Sales (no. of units) |
| | | | | |
| | | | | | | | | | | | | | | | | | | | FOREIGN EXPORTS |
| | -3.1 | | | | 14.1 | | | | -2.7 | | | | 10.4 | | | | 7.3 | | | Total Exports |
| | -8.3 | | | | 8.4 | | | | 7.9 | | | | 9.8 | | | | 8.4 | | | U.S. |
| | | | | |
| | | | | | | | | | | | | | | | | | | | LABOUR MARKET |
| | 1.6 | | | | 0.5 | | | | 1.4 | | | | 0.7 | | | | 0.1 | | | Labour Force (000’s) |
| | 1.4 | | | | 0.4 | | | | 1.6 | | | | 0.7 | | | | 0.1 | | | Employment (000’s) |
| | - | | | | - | | | | - | | | | - | | | | - | | | Participation Rate (%) |
| | - | | | | - | | | | - | | | | - | | | | - | | | Unemployment Rate (%) |
| | 2.1 | | | | 2.6 | | | | 2.7 | | | | 0.6 | | | | 4.3 | | | Average Weekly Earnings ($) |
| | | | | |
| | | | | | | | | | | | | | | | | | | | INVESTMENT |
| | 15.7 | | | | 0.0 | | | | 6.1 | | | | 5.8 | | | | -1.5 | | | Total |
| | 14.7 | | | | 2.8 | | | | 5.8 | | | | 4.6 | | | | -1.9 | | | Private |
| | 18.0 | | | | -6.1 | | | | 6.7 | | | | 8.3 | | | | -0.5 | | | Public |
| | 15.0 | | | | -2.2 | | | | 4.3 | | | | 8.0 | | | | -0.6 | | | Non-residential |
| | 18.0 | | | | 6.8 | | | | 11.2 | | | | -0.5 | | | | -4.1 | | | Housing |
| | | | | |
| | | | | | | | | | | | | | | | | | | | CONSUMER PRICE INDEX |
| | 0.8 | | | | 3.0 | | | | 1.6 | | | | 2.2 | | | | 1.9 | | | (Index, 2002 = 100) |
| | | | | |
| | | | | | | | | | | | | | | | | | | | BANKRUPTCIES |
| | 4.6 | | | | -11.8 | | | | -40.0 | | | | 52.8 | | | | -12.7 | | | Business |
| | -64.7 | | | | -16.7 | | | | 40.0 | | | | 85.7 | | | | -84.6 | | | Farm |
| | -18.4 | | | | -24.1 | | | | -15.7 | | | | -4.9 | | | | -1.2 | | | Personal |
A 20 / E c o n o m i c R e v i e w a n d O u t l o o k B U D G E T 2 0 1 5
Budget Paper B
SUPPLEMENTARY
FINANCIAL INFORMATION
| | |
Available in alternate formats upon request. | | |
SUPPLEMENTARY FINANCIAL INFORMATION
| | | | |
| |
CONTENTS | | | | |
| |
SPECIAL ACCOUNTS | | | 1 | |
Fiscal Stabilization Account | | | 1 | |
Pension Assets Fund | | | 2 | |
| |
CAPITAL INVESTMENT | | | 4 | |
| |
CAPITAL INVESTMENT – CORE GOVERNMENT | | | 4 | |
| |
CAPITAL INVESTMENT – OTHER | | | 5 | |
| |
LOAN REQUIREMENTS | | | 6 | |
| |
BORROWING REQUIREMENTS | | | 8 | |
| |
SUMMARY NET DEBT | | | 9 | |
B U D G E T 2 0 1 5 S u p p l e m e n t a r y F i n a n c i a l I n f o r m a t i o n / B 1
n SPECIAL ACCOUNTS
Fiscal Stabilization Account
The Fiscal Stabilization Account (FSA) is projected to have a balance of $220 million as at March 31, 2015, after a draw of $55 million in 2014/15, to retire a portion of the borrowings incurred during the period of recovery to support core government programs.
The budgeted draw in 2015/16 of $105 million includes $85 million to retire a portion of the borrowings of the core government and an additional $20 million to offset the impact of investments in the capital infrastructure that supports programs such as health, education and housing.
FISCAL STABILIZATION ACCOUNT
Revenue, Expenditure and Balance
Projection to March 31, 2015
| | | | | | | | | | |
| | | 2015/16 | | | | | 2014/15 | |
| | | |
| | | Budget | | | | | Forecast | |
| | | | | | (Millions of Dollars) | | | |
Balance, Beginning of Year | | | 220 | | | | | | 275 | |
| | | |
Transfers to the Core Government | | | | | | | | | | |
Debt Repayment | | | (85) | | | | | | (55) | |
Principal Repayment | | | (20) | | | | | | - | |
| | | | | | | | | | |
| | | |
Balance, End of Year | | | 115 | | | | | | 220 | |
| | | | | | | | | | |
B 2 / S u p p l e m e n t a r y F i n a n c i a l I n f o r m a t i o n B U D G E T 2 0 1 5
Pension Assets Fund
The trust conditions of the funds held in the Pension Assets Fund are irrevocably restricted for pension purposes only. Net investment earnings of pension assets include the expected rate of return during the year as well as adjustments to market-related value. Market fluctuations of pension assets are not recorded in the year in which they occur but are recognized over the employee average remaining service life.
The Fund is expected to increase as a result of net investment earnings, contributions and the government’s plan to set aside $100 million in 2015/16 as we continue addressing the province’s unfunded liability for Teachers’ Retirement Allowances Fund (TRAF). This amount is in addition to $1,502 million funded in 2007/08.
The Fund is expected to have a balance of $4,195 million by the end of the 2015/16 fiscal year.
Pension Assets Fund
Projection as at March 31, 2016 and March 31, 2015
| | | | | | | | | | | | |
| | | 2015/16 | | | | | | 2014/15 | |
| | | Budget | | | | | | Forecast | |
| | | | | | | (Millions of Dollars | ) | | | | |
Balance, Beginning of Year | | | 3,999 | | | | | | | | 3,856 | |
| | | | | | | | | | | | |
| | | |
Contributions and Revenue | | | | | | | | | | | | |
New Investment | | | 100 | | | | | | | | - | |
Net Investment Earnings | | | 226 | | | | | | | | 270 | |
Departments and Crown Corporations | | | 195 | | | | | | | | 191 | |
| | | | | | | | | | | | |
| | | 521 | | | | | | | | 461 | |
| | | | | | | | | | | | |
Transfers | | | | | | | | | | | | |
Teachers’ Retirement Allowances Fund (TRAF) and | | | | | | | | | | | | |
Civil Service Superannuation Fund (CSSF) payments | | | (325) | | | | | | | | (318) | |
| | | | | | | | | | | | |
| | | |
Balance, End of Year | | | 4,195 | | | | | | | | 3,999 | |
| | | | | | | | | | | | |
B U D G E T 2 0 1 5 S u p p l e m e n t a r y F i n a n c i a l I n f o r m a t i o n / B 3
SUMMARY OF ACCOUNT/FUND ACTIVITY
| | | | | | | | | | | | | | | | | | | | | | | | | | | | | | | | | | | | | | | | | | | | | | | | | | | | | | | | | | | | | | | | | | | | |
| | | 15/16 | | | 14/15 | | | 13/14 | | | 12/13 | | | 11/12 | | | 10/11 | | | 09/10 | | | 08/09 | | | 07/08 | | | 06/07 | | | 05/06 | | | 04/05 | | | 03/04 | | | 02/03 | | | 01/02 | | | 00/01 | | | 99/00 | |
| | | Budget | | | Forecast | | | Actual | | | Actual | | | Actual | | | Actual | | | Actual | | | Actual | | | Actual | | | Actual | | | Actual | | | Actual | | | Actual | | | Actual | | | Actual | | | Actual | | | Actual | |
| | | (Millions of Dollars) | |
Fiscal Stabilization Account | | | | | | | | | | | | | | | | | | | | | | | | | | | | | | | | | | | | | | | | | | | | | | | | | | | | | | | | | | | | | | | | | | | | |
Transfers to Account | | | - | | | | - | | | | - | | | | - | | | | - | | | | - | | | | - | | | | 30 | | | | 128 | | | | 110 | | | | 31 | | | | 405 | | | | 13 | | | | 4 | | | | 63 | | | | 40 | | | | 11 | |
Transfers from Account | | | (105 | ) | | | (55 | ) | | | (100 | ) | | | (152 | ) | | | (155 | ) | | | (125 | ) | | | (57 | ) | | | - | | | | - | | | | - | | | | - | | | | - | | | | (171 | ) | | | (22 | ) | | | (150 | ) | | | - | | | | (185 | ) |
Investment Revenue | | | - | | | | - | | | | | | | | - | | | | - | | | | - | | | | - | | | | 16 | | | | 27 | | | | 21 | | | | 15 | | | | 2 | | | | 1 | | | | 7 | | | | 14 | | | | 15 | | | | 12 | |
Balance, End of Year | | | 115 | | | | 220 | | | | 275 | | | | 375 | | | | 527 | | | | 682 | | | | 807 | | | | 864 | | | | 818 | | | | 663 | | | | 532 | | | | 486 | | | | 79 | | | | 236 | | | | 247 | | | | 320 | | | | 265 | |
Pension Assets Fund | | | | | | | | | | | | | | | | | | | | | | | | | | | | | | | | | | | | | | | | | | | | | | | | | | | | | | | | | | | | | | | | | | | | |
Transfers from Debt | | | - | | | | - | | | | - | | | | - | | | | - | | | | - | | | | 10 | | | | 55 | | | | 85 | | | | 85 | | | | 85 | | | | 79 | | | | 75 | | | | 48 | | | | 75 | | | | 21 | | | | - | |
Retirement Account | | | | | | | | | | | | | | | | | | | | | | | | | | | | | | | | | | | | | | | | | | | | | | | | | | | | | | | | | | | | | | | | | | | | |
Net Investment Earnings | | | 226 | | | | 270 | | | | 502 | | | | 291 | | | | 40 | | | | 100 | | | | 160 | | | | 41 | | | | 16 | | | | 67 | | | | 61 | | | | 31 | | | | 38 | | | | (6 | ) | | | 2 | | | | - | | | | - | |
Net Current Service | | | (130 | ) | | | (127 | ) | | | (129 | ) | | | (132 | ) | | | (130 | ) | | | (114 | ) | | | (100 | ) | | | (80 | ) | | | (60 | ) | | | 10 | | | | 8 | | | | 6 | | | | 3 | | | | 2 | | | | 9 | | | | - | | | | - | |
Contributions | | | | | | | | | | | | | | | | | | | | | | | | | | | | | | | | | | | | | | | | | | | | | | | | | | | | | | | | | | | | | | | | | | | | |
TRAF/CSSF Funding | | | 100 | | | | - | | | | - | | | | - | | | | 240 | | | | 180 | | | | 330 | | | | 350 | | | | 1,502 | | | | - | | | | - | | | | - | | | | - | | | | - | | | | - | | | | - | | | | - | |
Balance, End of Year | | | 4,195 | | | | 3,999 | | | | 3,856 | | | | 3,483 | | | | 3,324 | | | | 3,174 | | | | 3,008 | | | | 2,608 | | | | 2,242 | | | | 699 | | | | 537 | | | | 383 | | | | 267 | | | | 151 | | | | 107 | | | | 21 | | | | - | |
B 4 / S u p p l e m e n t a r y F i n a n c i a l I n f o r m a t i o n B U D G E T 2 0 1 5
n CAPITAL INVESTMENT
Government-owned capital assets such as highways, waterways, buildings, machinery and computer systems are amortized over their useful life based on established guidelines for amortization (see Appendix B of the 2015/16 Estimates of Expenditure). The amortization and interest costs are borne by departments that are responsible for each asset and are reflected as annual costs related to capital assets. In total, costs related to capital assets are estimated at $485 million in 2015/16, an increase of $45 million from 2014/15. In 2015/16, departmental appropriations include $249 million for amortization and $236 million for allocation of interest.
Capital investment, both in core government and the Other Reporting Entities (OREs), continues to be a priority for the government. An investment made to construct or enhance capital assets is a major benefit to government in providing the services Manitobans need into the future.
The investment in tangible capital assets is projected to be $20.6 billion as at March 31, 2016, with $8.4 billion of related debt having been retired through accumulated amortization. Core government will have a total of $8.8 billion in capital asset investments as at March 31, 2016 and $3.0 billion of related debt will have been retired through accumulated amortization.
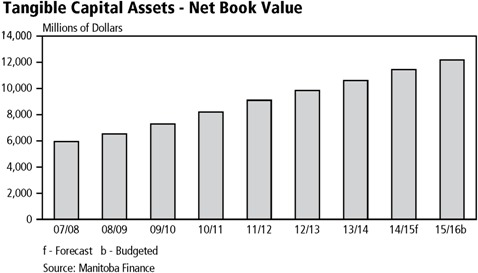
n CAPITAL INVESTMENT – CORE GOVERNMENT
Government-owned capital assets such as highways, waterways, buildings, machinery and computer systems are amortized over their useful life based on established guidelines for amortization (see Appendix B of the 2015/16 Estimates of Expenditure). The amortization and interest costs are borne by departments that are responsible for each asset and are reflected as annual costs related to capital assets. In total, costs related to capital assets are estimated at $485 million in 2015/16, an increase of $45 million from 2014/15. In 2015/16, departmental appropriations include $249 million for amortization and $236 million for allocation of interest.
B U D G E T 2 0 1 5 S u p p l e m e n t a r y F i n a n c i a l I n f o r m a t i o n / B 5
Authority for the annual cost to acquire government-owned assets is reflected as Part B – Capital Investment which totals $751 million in 2015/16, an increase of $9 million from 2014/15.
Capital Investment, 2015/16
| | | | | | | | |
| | | 2015/16 | | | 2014/15 | |
| | | Budget | | | Budget | |
| | | (Thousands of Dollars) | |
General Assets | | | | | | | | |
Government Services Capital Projects | | | 60,000 | | | | 80,000 | |
Transportation Equipment and Aircraft | | | 16,610 | | | | 16,310 | |
Information Technology Projects | | | | | | | | |
Corporate Information Technology Projects | | | 13,939 | | | | 21,431 | |
Education and Advanced Learning | | | 100 | | | | 100 | |
Conservation and Water Stewardship | | | 300 | | | | 300 | |
Family Services | | | 100 | | | | 500 | |
Finance | | | 1,500 | | | | 500 | |
Infrastructure and Transportation | | | 600 | | | | 100 | |
Justice | | | 100 | | | | 200 | |
Other Equipment and Buildings | | | 8,916 | | | | 17,015 | |
| | | | | | | | |
| | | 102,165 | | | | 136,456 | |
| | | | | | | | |
Infrastructure Assets | | | | | | | | |
Provincial Roads, Highways and Airport Infrastructure | | | 590,510 | | | | 550,510 | |
Water Related Infrastructure | | | 38,800 | | | | 36,000 | |
Parks, Cottage and Camping Projects | | | 19,226 | | | | 18,613 | |
| | | | | | | | |
| | | 648,536 | | | | 605,123 | |
| | | | | | | | |
Total Capital Investment | | | 750,701 | | | | 741,579 | |
| | | | | | | | |
n CAPITAL INVESTMENT – OTHER
Government continues to support capital assets held for public use within the OREs. These assets include hospitals, universities, colleges, public schools and housing, with an investment of $810 million included in Budget 2015.
B 6 / S u p p l e m e n t a r y F i n a n c i a l I n f o r m a t i o n B U D G E T 2 0 1 5
n LOAN REQUIREMENTS
The Loan Act, 2015 provides borrowing and expenditure authority and, in some cases, guarantee authority for the government and its agencies to undertake self-sustaining programs, where self-sustaining means having the ability for repayment. This authority is in addition to that voted in the printed estimates review.
Incremental Capital Authority Requirements for Non-Budgetary Programs, 2015/16
| | | | |
(Thousands of Dollars) | |
The Loan Act, 2015 | | | | |
The Manitoba Hydro-Electric Board | | | $2,337,000 | |
Public Schools Finance Board | | | 237,872 | |
Post-Secondary Institutions | | | 164,795 | |
Manitoba Agricultural Services Corporation | | | 145,353 | |
Manitoba Housing and Renewal Corporation | | | 39,987 | |
Manitoba Student Aid Program | | | 39,608 | |
Manitoba Liquor and Lotteries Corporation | | | 31,200 | |
Special Operating Agencies Financing Authority - Vehicle and Equipment Management Agency | | | 27,000 | |
Manitoba Water Services Board | | | 24,074 | |
Communities Economic Development Fund | | | 18,000 | |
Northern Affairs Communities | | | 16,039 | |
Sport Manitoba Inc. | | | 13,300 | |
Diagnostic Services of Manitoba, Inc. | | | 4,590 | |
Co-operative Loans and Loan Guarantee Board | | | 2,140 | |
Leaf Rapids Town Properties Ltd. | | | 2,000 | |
Special Operating Agencies Financing Authority - Pineland Forest Nursery | | | 830 | |
| | | | |
| | | $3,103,788 | |
| | | | |
B U D G E T 2 0 1 5 S u p p l e m e n t a r y F i n a n c i a l I n f o r m a t i o n / B 7
Non-Budgetary Capital Program, 2015/16
| | | | |
| (Thousands of Dollars) | |
| |
The Manitoba Hydro-Electric Board | | | $2,833,000 | |
Health Capital Program | | | 380,440 | |
Manitoba Housing and Renewal Corporation | | | 277,013 | |
Manitoba Agricultural Services Corporation | | | 188,075 | |
Post-Secondary Institutions | | | 142,675 | |
The Manitoba Water Services Board | | | 92,656 | |
Public Schools Finance Board | | | 92,572 | |
Manitoba Liquor and Lotteries Corporation | | | 88,300 | |
Business Support (including Manitoba Industrial Opportunities Program) | | | 71,926 | |
Special Operating Agencies Financing Authority - Vehicle and Equipment Management Agency | | | 49,560 | |
Manitoba Student Aid Program | | | 36,644 | |
Manitoba Opportunities Fund | | | 24,959 | |
Sport Manitoba Inc. | | | 19,300 | |
Communities Economic Development Fund | | | 12,000 | |
Northern Affairs Communities | | | 10,220 | |
Diagnostic Services of Manitoba, Inc. | | | 6,833 | |
Special Operating Agencies Financing Authority - Crown Lands and Property Agency | | | 4,000 | |
Miscellaneous Corporations, Agencies and Other Programs | | | 9,038 | |
| | | | |
| | | $4,339,211 | |
| | | | |
B 8 / S u p p l e m e n t a r y F i n a n c i a l I n f o r m a t i o n B U D G E T 2 0 1 5
n BORROWING REQUIREMENTS
Manitoba’s borrowing requirements with respect to both general and self-sustaining borrowings are estimated to total $4.7 billion in 2015/16, of which $2.0 billion is required for refinancing purposes. New cash requirements, net of estimated repayments, are $2.7 billion, which includes requirements for general government purposes, capital investments by departments and The Manitoba Hydro-Electric Board. Estimated repayments are for capital investment assets, health facilities and lotteries. The Loan Act, 2015, will provide incremental capital authority of $3.1 billion. To date, approximately $0.3 billion of Manitoba’s borrowing requirements have been funded.
Borrowing Requirements 2015/16
| | | | | | | | | | | | | | | | |
| | | Refinancing | | | New Cash
Requirements | | | Estimated
Repayments | | | Borrowing
Requirements | |
| | | | | | (Thousands of Dollars) | | | | |
Government Business Enterprises | | | | | | | | | | | | | | | | |
The Manitoba Hydro-Electric Board | | | 197,677 | | | | 1,763,000 | | | | - | | | | 1,960,677 | |
Manitoba Liquor and Lotteries Corporation | | | 60,000 | | | | 100,000 | | | | 41,813 | | | | 118,187 | |
| | | | | | | | | | | | | | | | |
Subtotal | | | 257,677 | | | | 1,863,000 | | | | 41,813 | | | | 2,078,864 | |
| | | | | | | | | | | | | | | | |
Other Borrowings | | | | | | | | | | | | | | | | |
General Purpose Borrowings | | | 804,691 | | | | 442,156 | | | | 85,000 | | | | 1,161,847 | |
Capital Investment Assets | | | 426,523 | | | | 465,701 | | | | 248,660 | | | | 643,564 | |
Health Facilities | | | - | | | | 125,000 | | | | 88,113 | | | | 36,887 | |
Other Crowns and Organizations | | | 553,800 | | | | 150,000 | | | | - | | | | 703,800 | |
Teachers’ Retirement Allowances Fund | | | - | | | | 100,000 | | | | - | | | | 100,000 | |
| | | | | | | | | | | | | | | | |
Subtotal | | | 1,785,014 | | | | 1,282,857 | | | | 421,773 | | | | 2,646,098 | |
| | | | | | | | | | | | | | | | |
Total Borrowing Requirements | | | 2,042,691 | | | | 3,145,857 | | | | 463,586 | | | | 4,724,962 | |
| | | | | | | | | | | | | | | | |
B U D G E T 2 0 1 5 S u p p l e m e n t a r y F i n a n c i a l I n f o r m a t i o n / B 9
n SUMMARY NET DEBT
| | | | | | |
| Changes in Summary Net Debt | | | | | |
| | | (Millions of Dollars) | | | |
| | |
2014/15 Summary Net Debt (Forecast) | | | 18,775 | | | |
| | |
Changes in Equity of Government Business Enterprises1 | | | 502 | | | |
| | |
Net Investment in Tangible Capital Assets | | | | | | |
Core Government | | | 502 | | | |
Other Reporting Entities | | | 225 | | | |
| | | | | | |
| | | 727 | | | |
| | | | | | |
Plus: Projected (Income) Loss for the Year | | | | | | |
Core Government | | | 441 | | | |
Other Reporting Entities | | | (19) | | | |
| | | 422 | | | |
| | | | | | |
Change in Net Debt | | | 1,651 | | | |
| | | | | | |
2015/16 Summary Net Debt (Budget) | | | 20,426 | | | |
| | | | | | |
In Budget 2015, the net debt to GDP ratio is forecast to be 30.9%. Net debt is an important indicator of a government’s financial position as this highlights the affordability of future government service. Summary net debt represents the difference between the Government Reporting Entities total liabilities, such as borrowing less financial assets2 – it reflects the residual liability that must be financed by future revenues. Net debt may grow in absolute terms from time to time, as needed investments in capital assets are made. These investments underpin and support Manitoba’s economic performance. It is important to measure changes in net debt against the growth of the economy, as measured by the nominal GDP.
1 Changes result from adoption of International Financial Reporting Standards by The Manitoba Hydro-Electric Board, effective April 1, 2015.
2 Financial assets are liquid assets such as cash, investments, loans and accounts receivable that could be readily converted to cash.
B 10 / S u p p l e m e n t a r y F i n a n c i a l I n f o r m a t i o n B U D G E T 2 0 1 5