Exhibit 99.1
MANITOBA
2016/17
First Quarter Report
Honourable Cameron Friesen
Minister of Finance

| | |
| FIRST QUARTER REPORT | | APRIL TO JUNE 2016 |
SUMMARY
Budget 2016 provided the financial overview of the Government Reporting Entity (GRE) which includes core government and government business enterprises (such as Manitoba Hydro and Manitoba Public Insurance, health authorities, social service authorities, school divisions, etc.).
Manitoba’s summary budget aligns with the accounting standards set by the Public Sector Accounting Board (PSAB) and fully reflects Generally Accepted Accounting Principles (GAAP). The financial information in this report is presented in the same format as the budget.
While Manitoba is facing significant fiscal challenges, our New Government has committed to carefully correcting the fiscal course.
Budget 2016 set a new course toward lower taxes, better services and a stronger economy.
| | | | |
| GOVERNMENT REPORTING ENTITY | | | |
Millions of Dollars | | | | |
| | | 2016/17
Budget | |
Revenue | | | | |
Income Taxes | | | 3,868 | |
Other Taxes | | | 4,136 | |
Fees and Other Revenue | | | 2,199 | |
Federal Transfers | | | 4,108 | |
Net Income of Government Business Enterprises | | | 674 | |
Sinking Funds and Other Earnings | | | 245 | |
| |
Total Revenue | | | 15,230 | |
| |
Expenditure | | | | |
Health | | | 6,497 | |
Education | | | 4,061 | |
Families | | | 2,036 | |
Community, Economic and Resource Development | | | 1,504 | |
Justice and Other Expenditures | | | 1,319 | |
Debt Servicing | | | 874 | |
| |
Total Expenditure | | | 16,291 | |
| |
In-Year Adjustments/Lapse | | | (150 | ) |
| |
Net Income (Loss) | | | (911 | ) |
- 1 -
| | |
| FIRST QUARTER REPORT | | APRIL TO JUNE 2016 |
CORE GOVERNMENT
The core government budget provides information on the core government activities – the revenue and expenditure of government departments that are under the direct control of the Legislative Assembly. These are where the day-to-day decisions are made that ultimately determine the success of the government strategies, plans and programs.
Controlling spending growth is a key element in restoring fiscal discipline. Our New Government has already implemented measures to ensure that
government programs and services become more effective and efficient.
Expenditure management initiatives will continue throughout the year as government carefully reviews funding structures and looks for ways to reduce costs. The fiscal performance review is well underway to assess program expenditures to ensure they are providing the best value for public money spent.
| | | | |
| CORE GOVERNMENT | | | |
Millions of Dollars | | | | |
| | | 2016/17
Budget | |
Revenue | | | | |
Income Taxes | | | 3,868 | |
Other Taxes | | | 3,717 | |
Fees and Other Revenue | | | 562 | |
Federal Transfers | | | 3,845 | |
Net Income of Government Business Enterprises | | | 586 | |
Sinking Funds and Other Earnings | | | - | |
| |
Total Revenue | | | 12,578 | |
| |
Expenditure | | | | |
Health | | | 5,990 | |
Education | | | 2,734 | |
Families | | | 1,928 | |
Community, Economic and Resource Development | | | 1,528 | |
Justice and Other Expenditures | | | 1,128 | |
Debt Servicing | | | 230 | |
| |
Total Expenditure | | | 13,538 | |
| |
In-Year Adjustments/Lapse | | | (70 | ) |
| |
Net Income (Loss) | | | (890 | ) |
- 2 -
| | |
| FIRST QUARTER REPORT | | APRIL TO JUNE 2016 |
QUARTERLY FINANCIAL RESULTS
The unaudited net result of the core government for the first three months of the fiscal year is a loss of $(83) million.
The three-month revenue variance of $(4) million primarily reflects lower than anticipated Retail Sales Tax, Levy for Health and Education, and Tobacco Tax as a result of timing of remittances.
The three-month expenditure variance of $(42) million is primarily the result of timing of expenditures in various departments.
Expenditures in critical areas such as health, justice and services for vulnerable persons are being closely monitored. A full year projection will be provided in the next quarterly report.
| | | | | | | | | | | | | | | | | | | | |
| CORE GOVERNMENT OPERATING STATEMENT | | | | | | | | | | | | | | | |
Millions of Dollars | | | | | | | | | | | | | | | | | | | | |
| | | Year-to-Date to June 30 | |
| UNAUDITED | | Actual | | | | | | Estimated | | | | | | Variance | |
| | | | | |
Revenue | | | | | | | | | | | | | | | | | | | | |
Income Taxes | | | 985 | | | | | | | | 986 | | | | | | | | (1 | ) |
Other Taxes | | | 960 | | | | | | | | 969 | | | | | | | | (9 | ) |
Fees and Other Revenue | | | 131 | | | | | | | | 127 | | | | | | | | 4 | |
Federal Transfers | | | 906 | | | | | | | | 906 | | | | | | | | - | |
Net Income of Government Business Enterprises | | | 148 | | | | | | | | 146 | | | | | | | | 2 | |
Sinking Funds and Other Earnings | | | - | | | | | | | | - | | | | | | | | - | |
| | | | | |
Total Revenue | | | 3,130 | | | | | | | | 3,134 | | | | | | | | (4 | ) |
| | | | | |
Expenditure | | | | | | | | | | | | | | | | | | | | |
Health, Seniors and Active Living | | | 1,575 | | | | | | | | 1,566 | | | | | | | | 9 | |
Education and Training | | | 756 | | | | | | | | 755 | | | | | | | | 1 | |
Families | | | 464 | | | | | | | | 464 | | | | | | | | - | |
Community, Economic and Resource Development | | | 262 | | | | | | | | 290 | | | | | | | | (28 | ) |
Justice and Other Expenditures | | | 214 | | | | | | | | 238 | | | | | | | | (24 | ) |
Debt Servicing Costs | | | (58 | ) | | | | | | | (58 | ) | | | | | | | - | |
| | | | | |
Total Expenditure | | | 3,213 | | | | | | | | 3,255 | | | | | | | | (42 | ) |
| | | | | |
Net Result | | | (83 | ) | | | | | | | (121 | ) | | | | | | | 38 | |
Core government revenue and expenditure details are provided in Appendix I and II on pages 11 and 12, and information on core government capital investment can be found in Appendix III on page 13.
- 3 -
| | |
| FIRST QUARTER REPORT | | APRIL TO JUNE 2016 |
QUARTERLY FINANCIAL RESULTS (Continued)
The three-month net result of $(83) million represents a variance of $(12) million from the prior year. Revenue is up $111 million year-over-year, offset by an increase in expenditures of $123 million.
The year-over-year increase in revenue is primarily due to increases in Individual Income Tax and
Federal Transfers, as well as higher Corporations Taxes as a result of timing of remittances.
The year-over-year increase in expenditures reflects increased spending related to Health, Seniors and Active Living, Families and Education and Training.
| | | | | | | | | | | | | | | | | | | | |
| COMPARISON TO PRIOR YEAR | | | | | | | | | | | | | | | |
Millions of Dollars | | | | | | | | | | | | | | | | | | | | |
| | | Year-to-Date to June 30 | |
| UNAUDITED | | 2016 | | | | | | 2015 | | | | | | Variance | |
| | | | | |
Revenue | | | 3,130 | | | | | | | | 3,019 | | | | | | | | 111 | |
| | | | | |
Expenditure | | | 3,213 | | | | | | | | 3,090 | | | | | | | | 123 | |
| | | | | |
Net Result | | | (83 | ) | | | | | | | (71 | ) | | | | | | | (12 | ) |
| | | | | | | | | | | | | | | | | | | | | |
- 4 -
| | |
| FIRST QUARTER REPORT | | APRIL TO JUNE 2016 |
STRATEGIC INFRASTRUCTURE INVESTMENT
Investments in strategic infrastructure stimulate the provincial economy, generate employment and increase household and business incomes. In addition, infrastructure, and infrastructure renewal projects boost productivity over the long term, further strengthening the economy. It is important that the investment decisions are not only made in the context of stimulating the economy and for the public good but are also financially sustainable over the long term.
Manitoba’s New Government is committed to spending at least $1 billion on strategic infrastructure in 2016/17 - roads and bridges, flood protection, hospitals, schools, universities and colleges, as well as municipal projects and other infrastructure. Over $1.8 billion in strategic infrastructure investment is forecast for 2016/17.
| | | | | | |
| STRATEGIC INFRASTRUCTURE | | | | | |
Millions of Dollars | | | | | | |
| Core Government Infrastructure | | | | 2016/17
Budget | |
| |
Roads, Highways, Bridges, Flood Protection and Parks | | | | |
Highways and Bridges | | | | | 542 | |
Water-Related Capital | | | | | 45 | |
Parks, Cottages and Camping | | | | | 12 | |
| | Subtotal | | | 599 | |
| | |
Capital Grants, Maintenance and Preservation | | | | | | |
Building Manitoba Fund* - Capital Grants | | | | | 284 | |
Maintenance and Preservation - Highways | | | | | 144 | |
Maintenance and Preservation - Water | | | | | 10 | |
| | Subtotal | | | 438 | |
Core Government Infrastructure Total | | | | | 1,037 | |
| | |
Other Provincial Infrastructure | | | | | | |
| | |
Health | | | | | 442 | |
Education | | | | | 241 | |
Housing | | | | | 120 | |
Northern Affairs Communities | | | | | 15 | |
Other Provincial Infrastructure Total | | | | | 818 | |
| | |
Total Strategic Infrastructure | | | | | 1,855 | |
| | |
| * Net of Transit Operating | | | | | | |
- 5 -
| | |
| FIRST QUARTER REPORT | | APRIL TO JUNE 2016 |
BORROWINGS AND SUMMARY NET DEBT
Manitoba’s total borrowing requirement identified in Budget 2016 was $6.5 billion including refinancing of $2.2 billion and new cash requirements (net of estimated repayments) of $4.3 billion.
New cash requirements are necessary for general government purposes, capital investments by departments, health facilities, post-secondary institutions and Manitoba Hydro. Estimated repayments are primarily for departmental capital investment and general purpose borrowings.
Borrowings are used to finance capital related projects, and to finance the expenditures of priority government services in excess of generated income.
While these investments underpin and support Manitoba’s economic performance, Manitoba’s New Government has committed to reduce the reliance on borrowings to ensure that the use of the debt is within reasonable and predictable limits.
Budget 2016 projects a net debt to GDP ratio of 33.8%.
| | | | |
| CHANGE IN SUMMARY NET DEBT | | | |
Millions of Dollars | | | | |
| | | 2016/17
Budget | |
| |
2015/16 Summary Net Debt (Forecast) | | | 21,395 | |
Net Investment in Tangible Capital Assets | | | | |
Core Government | | | 445 | |
Other Reporting Entities | | | 398 | |
| | | 843 | |
Plus: Projected (Income) Loss for the Year | | | | |
Core Government | | | 890 | |
Other Reporting Entities | | | 21 | |
| | | 911 | |
| |
Change in Net Debt | | | 1,754 | |
| |
Summary Net Debt | | | 23,149 | |
- 6 -
| | |
| FIRST QUARTER REPORT | | APRIL TO JUNE 2016 |
ECONOMIC REVIEW AND OUTLOOK
Overview
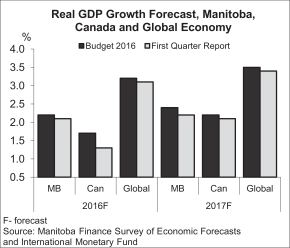
Global economic conditions have weakened since Budget 2016. These updates are reflected in minor adjustments to the Budget 2016 economic growth projections; however, Manitoba’s stable and diverse economy continues to outperform Canada and many of the other provinces.
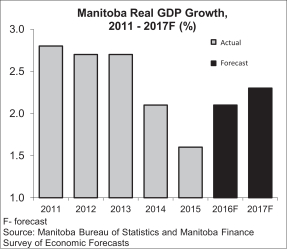
According to the Manitoba Finance Survey of Economic Forecasts, Manitoba’s real GDP is expected to grow by 2.1% in 2016 and by 2.3% in 2017.
The outlook for Manitoba’s real GDP growth in 2016 is 0.1% lower than what was estimated in the May 31, 2016 Budget. For 2017, the forecast is 0.2% below the Budget estimate.
The forecast for slower growth in Manitoba is due to continued weakness in Canada and the global economies.
Significant downside risks continue to be associated with the current outlook since the medium-term global growth forecast. The U.S. was recently revised down due to weaker than expected growth in the first quarter of 2016.
Stagnant and uneven demand conditions are contributing to low inflation, low commodity prices, modest capital spending and slow employment growth around the world.
The current unknown repercussion from Britain’s decision to leave the European Union has further increased the level of uncertainty in financial markets and has raised concerns about a possible breakup of the 28 member state Union altogether.
Canada has been considerably impacted by the low commodity price cycle. In 2015, Canada posted 1.1% real Gross Domestic Product (GDP) growth, the slowest annual rate since the Great Recession. Even a weaker currency and a growing U.S. economy have failed to generate any sustained rebound. Consequently, Canada’s economic forecasts for 2016 and 2017 are lowered to 1.3% and 2.1%, respectively.
Manitoba’s Economic Growth
Manitoba has a diverse industrial structure dominated by mostly medium-sized sectors, which contribute evenly to overall growth. As a result, the economy has remained relatively stable in a global environment that is now more frequently impacted by relatively large and broad based financial, economic, geo-political and natural environmental shocks.
- 7 -
| | |
| FIRST QUARTER REPORT | | APRIL TO JUNE 2016 |
As mentioned previously, these external factors are contributing to slower real economic activity in the province. Nominal GDP, which is a broad measure of incomes generated in the province and Manitoba’s potential tax base, has also slowed. In 2015, nominal GDP growth expanded by 2.7%, the smallest annual increase since 2009. Its forecast growth has been reduced by 0.4% to 3.4% for 2016 and by 0.2% to 4.2% for 2017.
Given the slow pace of growth in demand for goods and services everywhere, Manitoba’s key indicators are showing mixed results in 2016. The solid gains in Manitoba’s retail sector is being offset by weakness in manufacturing sales, non-residential capital spending, and housing starts. Like elsewhere in Canada, Manitoba’s labour market has softened, but is showing signs of improvement this summer.
Manitoba’s Key Economic Indicators
The annual and quarterly economic statistics in the following section are on a calendar year basis.
Inflation Rate
Due to low energy prices, Manitoba’s annual increase in consumer prices slowed to 1.2% in 2015, but as fuel prices stabilize and higher import costs are passed onto consumers, prices are rising.
The annual inflation rate in July 2016 rose to 1.5% in Manitoba and matches that of Canada.
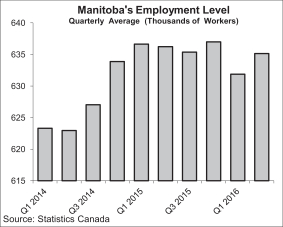
Labour Market
After declining in early 2016, Manitoba’s employment level is showing signs of improvement. On a quarterly basis, Manitoba’s employment increased by 0.5% in the second quarter of 2016, compared to the 0.2% growth in Canada overall.
On a quarterly basis, full-time employment increased by 0.9% while part-time employment fell by 1.3% in the second quarter, compared to the first quarter of 2016.
Manitoba’s unemployment rate is averaging 6.0% in 2016, the lowest among provinces and below Canada at 7.0%.
Labour Income
Compensation of employees (labour income), a broad base for personal income tax, has increased by 2.5% in the first six months of 2016, below the 3.3% growth in 2015, but above the 1.7% increase in Canada.
The overall growth in labour income has slowed as low commodity prices have driven down incomes in the mining, oil and gas sector. Total labour income in the federal public administration continues to slide while incomes in construction and professional services improve.
Retail Sales
Solid gains from motor vehicle dealers and health and personal care stores have driven up retail sales by 6.7% in the first half of 2016, the highest increase among provinces and well above the 4.5% growth in Canada.
- 8 -
| | |
| FIRST QUARTER REPORT | | APRIL TO JUNE 2016 |
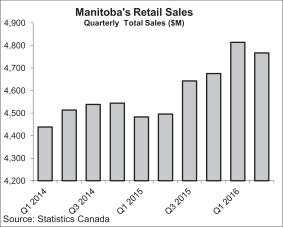
Retail sales in 2016 are considerably higher than the 1.5% growth achieved in 2015.
All retail categories are showing positive gains in 2016. Sporting, music and book stores, general merchandise stores and furniture and furnishing store sales are among the other leading categories while gasoline stations, food stores and building supply dealers are lagging.
Manufacturing
Even with a lower Canadian dollar, manufacturing sales remain tepid in Canada, with five provinces showing a reduction in sales this year.
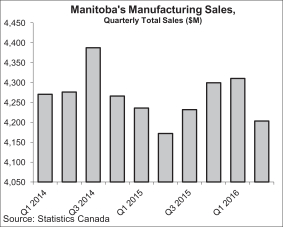
Sales in Manitoba are up 0.3% on a year-to-date basis in July 2016, compared to a 0.2% growth in Canada.
Transportation equipment and wood product sales are increasing at double digit growth rates while food products, fabricated metal, machinery equipment and furniture sales are improving, but remain negative on an annual basis in June 2016.
Capital Investment
With completion of several major projects, non-residential capital spending in Manitoba slowed through 2015, after marking a record investment of $471 million in the first quarter of 2015.
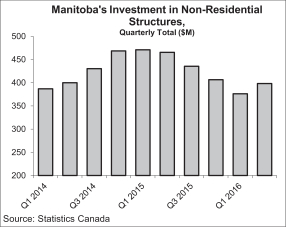
Investment in non-residential building construction turned around in the second quarter of 2016, increasing by 5.8% to $398 million. This follows four consecutive quarterly declines.
In the second quarter, industrial sector non-residential investment spending increased by 17.0%, while commercial sector spending increased by 8.4%.
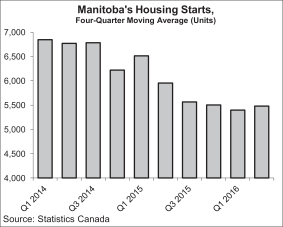
Housing Starts
An increase in new housing inventory led to a pull back in new residential construction in the province. Overall housing starts numbers have gradually declined since the fourth quarter of 2014.
In the first six months of 2016, as new inventory is being absorbed, construction of residential units has stabilized at just fewer
- 9 -
| | |
| FIRST QUARTER REPORT | | APRIL TO JUNE 2016 |
than 5,500 units on an annual basis. This has slowed down the retraction in new housing starts to a 0.9% decline, compared to 11.6% annual decrease in 2015.
Exports
Manitoba exports are growing at a stable rate at just under 2.0% annually, but well above the 3.0% decline in Canada.
On an annual basis, in June 2016, exports are up by 2.6% to the U.S. and up by 2.6% to China. Non-U.S. exports are down 0.5%, generating an overall annual total exports growth of 1.6% compared to 2.2% in 2015.
In the first six months of 2016, exports are led by motor vehicles and parts, consumer goods, electronics and chemical products. Sales are lagging in metal ores, processed metal products, energy products, machinery and equipment.
| | | | | | | | | | | | |
| Manitoba Outlook at a Glance | | | | | | | | | |
| (per cent change unless noted) | | | | | | | | | |
| | | 2015 | | | 2016f | | | 2017f | |
Gross Domestic Product | | | | | | | | | | | | |
Real | | | 1.6 | | | | 2.1 | | | | 2.3 | |
Nominal | | | 2.7 | | | | 3.5 | | | | 4.3 | |
Employment | | | 1.5 | | | | 0.2 | | | | 1.0 | |
Unemployment Rate | | | 5.6 | | | | 5.9 | | | | 5.7 | |
Consumer Price Index | | | 1.2 | | | | 1.7 | | | | 2.1 | |
Population | | | 1.0 | | | | 1.1 | | | | 1.1 | |
f = forecast
Sources: Statistics Canada, Manitoba Bureau of Statistics and Manitoba Finance Survey of Economic Forecasts (2016f - 2017f)
- 10 -
| | |
| FIRST QUARTER REPORT | | APRIL TO JUNE 2016 |
Appendix I
| | | | | | | | | | | | | | | | | | | | | | | | | | | | |
| 2016/17 CORE GOVERNMENT REVENUE BY SOURCE | | | | | | | | | | | | | | | | |
Thousands of Dollars | | | | | | | | | | | | | | | | | | | | | | | | | | | | |
| | | Year-to-Date to June 30 | | | | | | Full Year | |
UNAUDITED | | | Actual | | | | | | | | Estimated | | | | | | | | Variance | | | | | | | | Budget | |
Income Taxes | | | | | | | | | | | | | | | | | | | | | | | | | | | | |
Individual Income Tax | | | 741,405 | | | | | | | | 742,431 | | | | | | | | (1,026 | ) | | | | | | | 3,338,761 | |
Corporation Income Tax | | | 243,234 | | | | | | | | 244,219 | | | | | | | | (985 | ) | | | | | | | 529,016 | |
Subtotal: Income Taxes | | | 984,639 | | | | | | | | 986,650 | | | | | | | | (2,011 | ) | | | | | | | 3,867,777 | |
| | | | | | | |
Other Taxes | | | | | | | | | | | | | | | | | | | | | | | | | | | | |
Corporations Taxes | | | 88,453 | | | | | | | | 87,455 | | | | | | | | 998 | | | | | | | | 249,047 | |
Fuel Taxes | | | 82,594 | | | | | | | | 80,500 | | | | | | | | 2,094 | | | | | | | | 321,150 | |
Land Transfer Tax | | | 21,036 | | | | | | | | 21,000 | | | | | | | | 36 | | | | | | | | 83,736 | |
Levy for Health and Education | | | 113,983 | | | | | | | | 117,000 | | | | | | | | (3,017 | ) | | | | | | | 472,614 | |
Retail Sales Tax | | | 584,358 | | | | | | | | 589,000 | | | | | | | | (4,642 | ) | | | | | | | 2,325,330 | |
Tobacco Tax | | | 67,308 | | | | | | | | 71,600 | | | | | | | | (4,292 | ) | | | | | | | 256,123 | |
Other Taxes | | | 2,182 | | | | | | | | 2,158 | | | | | | | | 24 | | | | | | | | 9,591 | |
Subtotal: Other Taxes | | | 959,914 | | | | | | | | 968,713 | | | | | | | | (8,799 | ) | | | | | | | 3,717,591 | |
| | | | | | | |
Fees and Other Revenue | | | | | | | | | | | | | | | | | | | | | | | | | | | | |
Fines and Costs and Other Legal | | | 13,878 | | | | | | | | 13,467 | | | | | | | | 411 | | | | | | | | 53,574 | |
Minerals and Petroleum | | | 3,721 | | | | | | | | 3,500 | | | | | | | | 221 | | | | | | | | 9,628 | |
Automobile and Motor Carrier Licences and Fees | | | 42,857 | | | | | | | | 41,731 | | | | | | | | 1,126 | | | | | | | | 152,270 | |
Parks: Forestry and Other Conservation | | | 2,469 | | | | | | | | 2,525 | | | | | | | | (56 | ) | | | | | | | 33,856 | |
Water Power Rentals | | | 30,443 | | | | | | | | 28,574 | | | | | | | | 1,869 | | | | | | | | 107,722 | |
Service Fees and Other Miscellaneous Charges | | | 28,482 | | | | | | | | 27,934 | | | | | | | | 548 | | | | | | | | 181,826 | |
Revenue Sharing from SOAs | | | 9,467 | | | | | | | | 9,542 | | | | | | | | (75 | ) | | | | | | | 23,170 | |
Subtotal: Fees and Other Revenue | | | 131,317 | | | | | | | | 127,273 | | | | | | | | 4,044 | | | | | | | | 562,046 | |
| | | | | | | |
Federal Transfers | | | | | | | | | | | | | | | | | | | | | | | | | | | | |
Equalization | | | 433,898 | | | | | | | | 433,898 | | | | | | | | - | | | | | | | | 1,735,600 | |
Canada Health Transfer (CHT) | | | 325,907 | | | | | | | | 325,907 | | | | | | | | - | | | | | | | | 1,303,600 | |
Canada Social Transfer (CST) | | | 120,612 | | | | | | | | 120,612 | | | | | | | | - | | | | | | | | 482,400 | |
Shared Cost and Other Transfers | | | 25,612 | | | | | | | | 25,353 | | | | | | | | 259 | | | | | | | | 322,955 | |
Subtotal: Federal Transfers | | | 906,029 | | | | | | | | 905,770 | | | | | | | | 259 | | | | | | | | 3,844,555 | |
| | | | | | | |
Net Income of Government | | | | | | | | | | | | | | | | | | | | | | | | | | | | |
Business Enterprises (GBEs) | | | | | | | | | | | | | | | | | | | | | | | | | | | | |
Manitoba Liquor and Lotteries Corporation | | | 148,329 | | | | | | | | 146,000 | | | | | | | | 2,329 | | | | | | | | 585,700 | |
| | | | | | | |
Total Revenue | | | 3,130,228 | | | | | | | | 3,134,406 | | | | | | | | (4,178 | ) | | | | | | | 12,577,669 | |
- 11 -
| | |
| FIRST QUARTER REPORT | | APRIL TO JUNE 2016 |
Appendix II
| | | | | | | | | | | | | | | | | | | | | | | | | | | | |
| 2016/17 CORE GOVERNMENT EXPENDITURE BY SECTOR/DEPARTMENT | | | | | | | | | | | | | |
Thousands of Dollars | | | | | | | | | | | | | | | | | | | | | | | | | | | | |
| | | Year-to-Date to June 30 | | | | | | Full Year | |
UNAUDITED | | | Actual | | | | | | | | Estimated | | | | | | | | Variance | | | | | | | | Budget | |
| | | | | | | |
Health | | | | | | | | | | | | | | | | | | | | | | | | | | | | |
Health, Seniors and Active Living | | | 1,574,806 | | | | | | | | 1,566,444 | | | | | | | | 8,362 | | | | | | | | 5,989,870 | |
| | | | | | | |
Education | | | | | | | | | | | | | | | | | | | | | | | | | | | | |
Education and Training | | | 755,663 | | | | | | | | 754,594 | | | | | | | | 1,069 | | | | | | | | 2,733,768 | |
| | | | | | | |
Families | | | | | | | | | | | | | | | | | | | | | | | | | | | | |
Families | | | 464,099 | | | | | | | | 463,598 | | | | | | | | 501 | | | | | | | | 1,927,625 | |
| | | | | | | |
Community, Economic and Resource Development | | | | | | | | | | | | | | | | | | | | | | | | | | | | |
Agriculture | | | 13,548 | | | | | | | | 12,595 | | | | | | | | 953 | | | | | | | | 180,371 | |
Growth, Enterprise and Trade | | | 21,284 | | | | | | | | 22,719 | | | | | | | | (1,435 | ) | | | | | | | 82,593 | |
Indigenous and Municipal Relations | | | 36,674 | | | | | | | | 43,423 | | | | | | | | (6,749 | ) | | | | | | | 498,023 | |
Infrastructure | | | 153,074 | | | | | | | | 168,905 | | | | | | | | (15,831 | ) | | | | | | | 625,093 | |
Sustainable Development | | | 37,550 | | | | | | | | 42,616 | | | | | | | | (5,066 | ) | | | | | | | 141,715 | |
Total Community, Economic and Resource Development | | | 262,130 | | | | | | | | 290,258 | | | | | | | | (28,128 | ) | | | | | | | 1,527,795 | |
| | | | | | | |
Justice and Other Expenditures | | | | | | | | | | | | | | | | | | | | | | | | | | | | |
Legislative Assembly | | | 16,124 | | | | | | | | 18,615 | | | | | | | | (2,491 | ) | | | | | | | 57,707 | |
Executive Council | | | 2,998 | | | | | | | | 2,013 | | | | | | | | 985 | | | | | | | | 4,107 | |
Civil Service Commission | | | 5,424 | | | | | | | | 5,805 | | | | | | | | (381 | ) | | | | | | | 21,677 | |
Employee Pensions and Other Costs | | | (5,096 | ) | | | | | | | (3,048 | ) | | | | | | | (2,048 | ) | | | | | | | 14,735 | |
Finance | | | 64,013 | | | | | | | | 62,932 | | | | | | | | 1,081 | | | | | | | | 278,349 | |
Justice | | | 105,680 | | | | | | | | 112,146 | | | | | | | | (6,466 | ) | | | | | | | 585,844 | |
Sport, Culture and Heritage | | | 18,748 | | | | | | | | 23,496 | | | | | | | | (4,748 | ) | | | | | | | 66,462 | |
Enabling Appropriations | | | - | | | | | | | | - | | | | | | | | - | | | | | | | | 42,991 | |
Other Appropriations | | | 6,869 | | | | | | | | 15,908 | | | | | | | | (9,039 | ) | | | | | | | 56,700 | |
Total Justice and Other Expenditures | | | 214,760 | | | | | | | | 237,867 | | | | | | | | (23,107 | ) | | | | | | | 1,128,572 | |
| | | | | | | |
Debt Servicing Costs | | | (58,052 | ) | | | | | | | (57,764 | ) | | | | | | | (288 | ) | | | | | | | 230,000 | |
| | | | | | | |
Total Expenditure | | | 3,213,406 | | | | | | | | 3,254,997 | | | | | | | | (41,591 | ) | | | | | | | 13,537,630 | |
- 12 -
| | |
| FIRST QUARTER REPORT | | APRIL TO JUNE 2016 |
Appendix III
| | | | | | | | | | | | | | | | | | | | | | | | | | | | |
| 2016/17 CORE GOVERNMENT CAPITAL INVESTMENT BY DEPARTMENT | | | | |
Thousands of Dollars | | | | | | | | | | | | | | | | | | | | | | | | | | | | |
| | | Year-to-Date to June 30 | | | | | | Full Year | |
UNAUDITED | | | Actual | | | | | | | | Estimated | | | | | | | | Variance | | | | | | | | Budget | |
| | | | | | | |
Agriculture | | | - | | | | | | | | - | | | | | | | | - | | | | | | | | 250 | |
Education and Training | | | - | | | | | | | | - | | | | | | | | - | | | | | | | | 2,173 | |
Families | | | 212 | | | | | | | | 667 | | | | | | | | (455 | ) | | | | | | | 465 | |
Finance | | | 10,047 | | | | | | | | 8,441 | | | | | | | | 1,606 | | | | | | | | 61,525 | |
Health, Seniors and Active Living | | | - | | | | | | | | 50 | | | | | | | | (50 | ) | | | | | | | 1,202 | |
Infrastructure | | | 65,380 | | | | | | | | 75,900 | | | | | | | | (10,520 | ) | | | | | | | 606,200 | |
Justice | | | 359 | | | | | | | | 1,688 | | | | | | | | (1,329 | ) | | | | | | | 3,507 | |
Sport, Culture and Heritage | | | - | | | | | | | | - | | | | | | | | - | | | | | | | | 205 | |
Sustainable Development | | | 486 | | | | | | | | 3,832 | | | | | | | | (3,346 | ) | | | | | | | 15,044 | |
Internal Service Adjustments | | | - | | | | | | | | - | | | | | | | | - | | | | | | | | 12,931 | |
| | | | | | | |
Total Capital Investment | | | 76,484 | | | | | | | | 90,578 | | | | | | | | (14,094 | ) | | | | | | | 703,502 | |
| | | | | | | | | | | | | | | | | | | | | | | | | | | | | |
- 13 -