|
Exhibit 99.1 
|
Exhibit 99.1
Bipole III, Keeyask and Tie-Line review
September 19, 2016
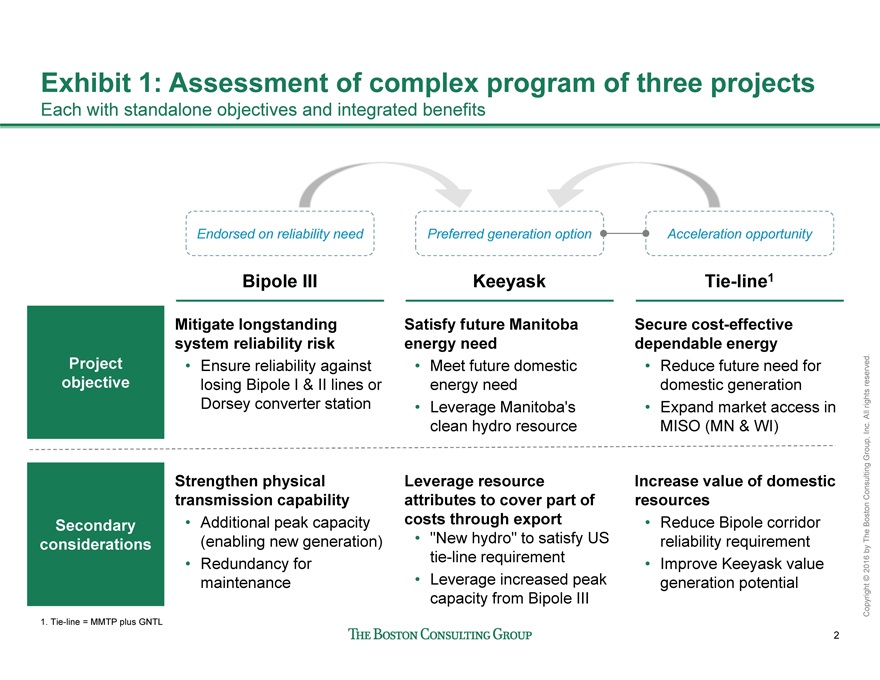
Exhibit 1: Assessment of complex program of three projects
Each with standalone objectives and integrated benefits
Endorsed on reliability need Preferred generation option Acceleration opportunity
Bipole III Keeyask Tie-line1
Mitigate longstanding Satisfy future Manitoba Secure cost-effective system reliability risk energy need dependable energy Project • Ensure reliability against • Meet future domestic • Reduce future need for objective losing Bipole I & II lines or energy need domestic generation Dorsey converter station • Leverage Manitoba’s • Expand market access in clean hydro resource MISO (MN & WI)
Strengthen physical Leverage resource Increase value of domestic transmission capability attributes to cover part of resources Secondary • Additional peak capacity costs through export • Reduce Bipole corridor considerations (enabling new generation) • “New hydro” to satisfy US reliability requirement
• Redundancy for tie-line requirement • Improve Keeyask value maintenance • Leverage increased peak generation potential capacity from Bipole III
1. Tie-line = MMTP plus GNTL
BCG Report.pptx
Copyright © 2016 by The Boston Consulting Group, IncAll. rights reserved.
2
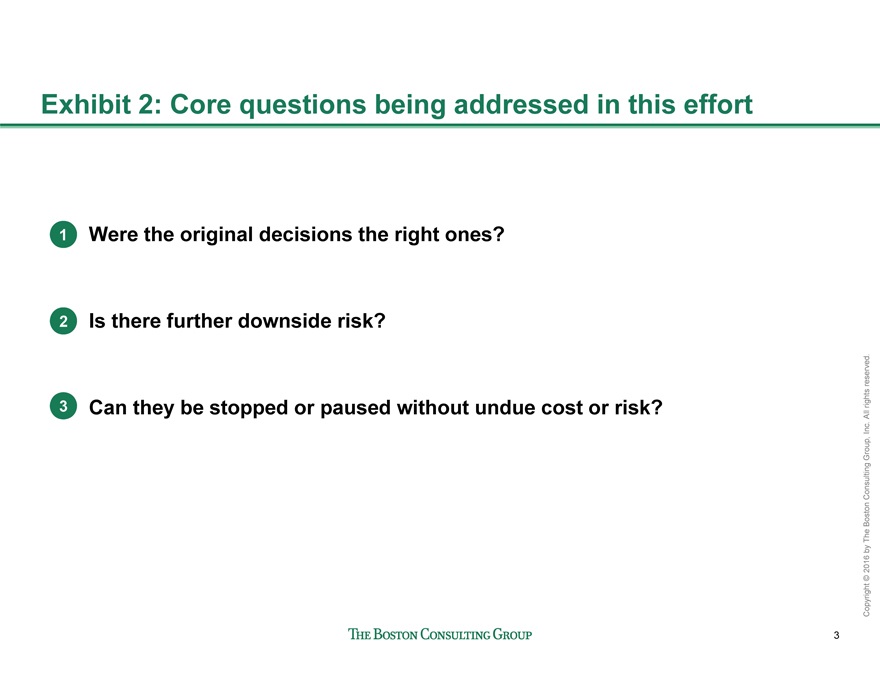
Exhibit 2: Core questions being addressed in this effort
1 Were the original decisions the right ones?
2 Is there further downside risk?
3 Can they be stopped or paused without undue cost or risk?
BCG Report.pptx
Copyright © 2016 by The Boston Consulting Group, IncAll. rights reserved.
3
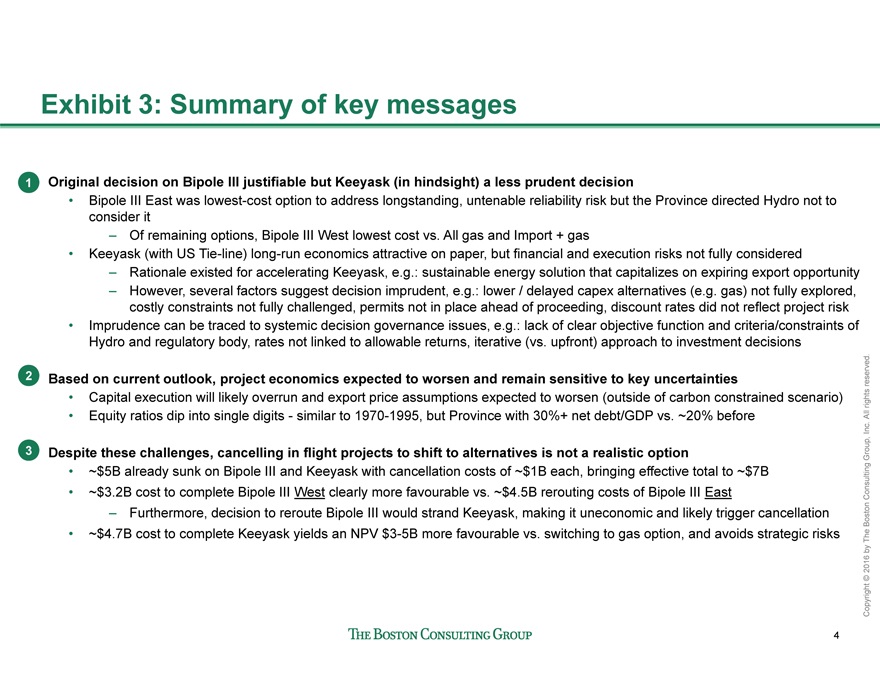
Exhibit 3: Summary of key messages
1 Original decision on Bipole III justifiable but Keeyask (in hindsight) a less prudent decision
• Bipole III East was lowest-cost option to address longstanding, untenable reliability risk but the Province directed Hydro not to consider it
– Of remaining options, Bipole III West lowest cost vs. All gas and Import + gas
• Keeyask (with US Tie-line) long-run economics attractive on paper, but financial and execution risks not fully considered
– Rationale existed for accelerating Keeyask, e.g.: sustainable energy solution that capitalizes on expiring export opportunity
– However, several factors suggest decision imprudent, e.g.: lower / delayed capex alternatives (e.g. gas) not fully explored, costly constraints not fully challenged, permits not in place ahead of proceeding, discount rates did not reflect project risk
• Imprudence can be traced to systemic decision governance issues, e.g.: lack of clear objective function and criteria/constraints of Hydro and regulatory body, rates not linked to allowable returns, iterative (vs. upfront) approach to investment decisions
2 Based on current outlook, project economics expected to worsen and remain sensitive to key uncertainties
• Capital execution will likely overrun and export price assumptions expected to worsen (outside of carbon constrained scenario)
• Equity ratios dip into single digits - similar to 1970-1995, but Province with 30%+ net debt/GDP vs. ~20% before
3 Despite these challenges, cancelling in flight projects to shift to alternatives is not a realistic option
• ~$5B already sunk on Bipole III and Keeyask with cancellation costs of ~$1B each, bringing effective total to ~$7B
• ~$3.2B cost to complete Bipole III West clearly more favourable vs. ~$4.5B rerouting costs of Bipole III East
– Furthermore, decision to reroute Bipole III would strand Keeyask, making it uneconomic and likely trigger cancellation
• ~$4.7B cost to complete Keeyask yields an NPV $3-5B more favourable vs. switching to gas option, and avoids strategic risks
BCG Report.pptx
Copyright © 2016 by The Boston Consulting Group, IncAll. rights reserved.
4
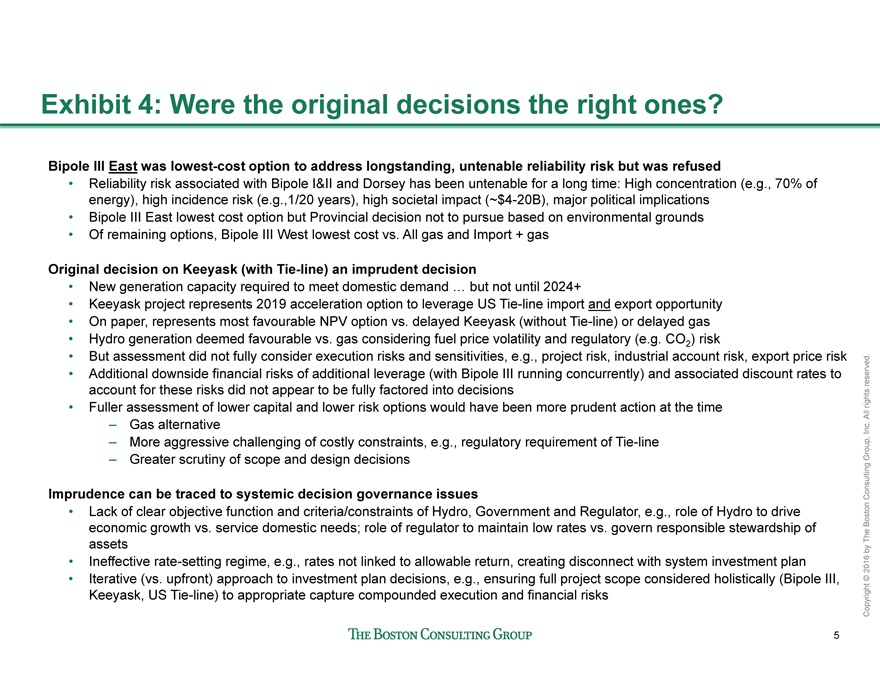
Exhibit 4: Were the original decisions the right ones?
Bipole III East was lowest-cost option to address longstanding, untenable reliability risk but was refused
• Reliability risk associated with Bipole I&II and Dorsey has been untenable for a long time: High concentration (e.g., 70% of energy), high incidence risk (e.g.,1/20 years), high societal impact (~$4-20B), major political implications
• Bipole III East lowest cost option but Provincial decision not to pursue based on environmental grounds
• Of remaining options, Bipole III West lowest cost vs. All gas and Import + gas
Original decision on Keeyask (with Tie-line) an imprudent decision
• New generation capacity required to meet domestic demand … but not until 2024+
• Keeyask project represents 2019 acceleration option to leverage US Tie-line import and export opportunity
• On paper, represents most favourable NPV option vs. delayed Keeyask (without Tie-line) or delayed gas
• Hydro generation deemed favourable vs. gas considering fuel price volatility and regulatory (e.g. CO2) risk
• But assessment did not fully consider execution risks and sensitivities, e.g., project risk, industrial account risk, export price risk
• Additional downside financial risks of additional leverage (with Bipole III running concurrently) and associated discount rates to account for these risks did not appear to be fully factored into decisions
• Fuller assessment of lower capital and lower risk options would have been more prudent action at the time
– Gas alternative
– More aggressive challenging of costly constraints, e.g., regulatory requirement of Tie-line
– Greater scrutiny of scope and design decisions
Imprudence can be traced to systemic decision governance issues
• Lack of clear objective function and criteria/constraints of Hydro, Government and Regulator, e.g., role of Hydro to drive economic growth vs. service domestic needs; role of regulator to maintain low rates vs. govern responsible stewardship of assets
• Ineffective rate-setting regime, e.g., rates not linked to allowable return, creating disconnect with system investment plan
• Iterative (vs. upfront) approach to investment plan decisions, e.g., ensuring full project scope considered holistically (Bipole III, Keeyask, US Tie-line) to appropriate capture compounded execution and financial risks
BCG Report.pptx
Copyright © 2016 by The Boston Consulting Group, IncAll. rights reserved.
5
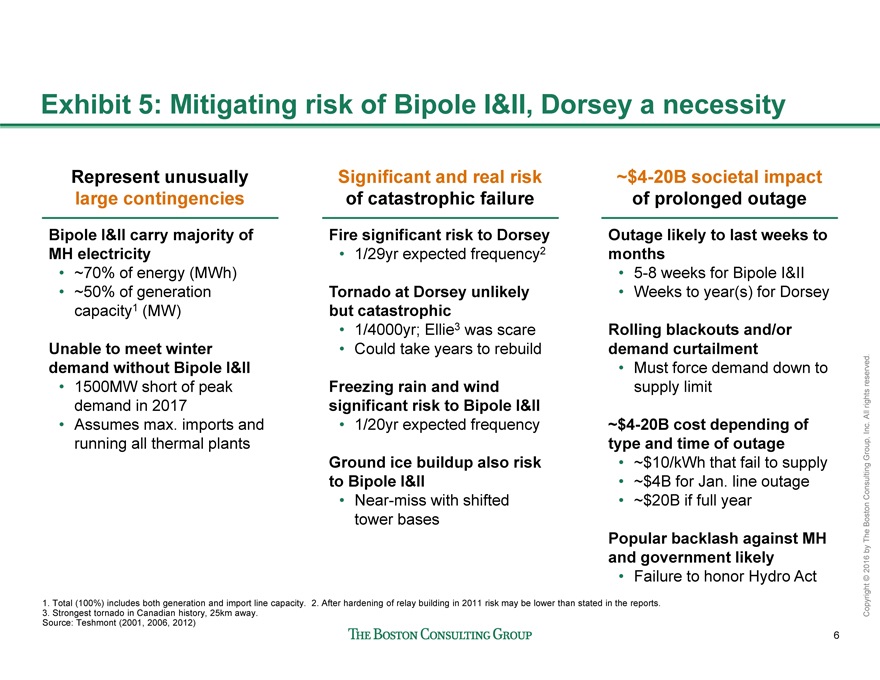
Exhibit 5: Mitigating risk of Bipole I&II, Dorsey a necessity
Represent unusually large contingencies
Bipole I&II carry majority of MH electricity
• ~70% of energy (MWh)
• ~50% of generation capacity1 (MW)
Unable to meet winter demand without Bipole I&II
• 1500MW short of peak demand in 2017
• Assumes max. imports and running all thermal plants
~$4-20B societal impact of prolonged outage
Outage likely to last weeks to months
• 5-8 weeks for Bipole I&II
• Weeks to year(s) for Dorsey
Rolling blackouts and/or demand curtailment
• Must force demand down to supply limit
~$4-20B cost depending of type and time of outage
• ~$10/kWh that fail to supply
• ~$4B for Jan. line outage
• ~$20B if full year
Popular backlash against MH and government likely
• Failure to honor Hydro Act
1. Total (100%) includes both generation and import line capacity. 2. After hardening of relay building in 2011 risk may be lower than stated in the reports.
3. Strongest tornado in Canadian history, 25km away.
Source: Teshmont (2001, 2006, 2012)
BCG Report.pptx
Copyright © 2016 by The Boston Consulting Group, IncAll. rights reserved.
6
7
Copyright © 2016 by The Boston Consulting Group, Inc. All rights reserved.
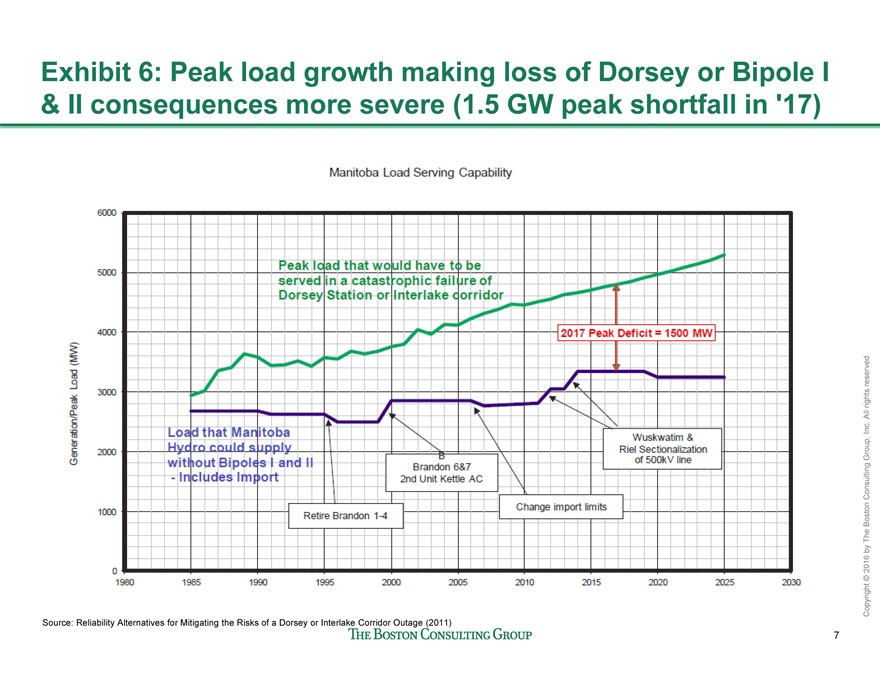
Exhibit 6: Peak load growth making loss of Dorsey or Bipole I
& II consequences more severe (1.5 GW peak shortfall in ‘17)
Source: Reliability Alternatives for Mitigating the Risks of a Dorsey or Interlake Corridor Outage (2011)
8
Copyright © 2016 by The Boston Consulting Group, Inc. All rights reserved.
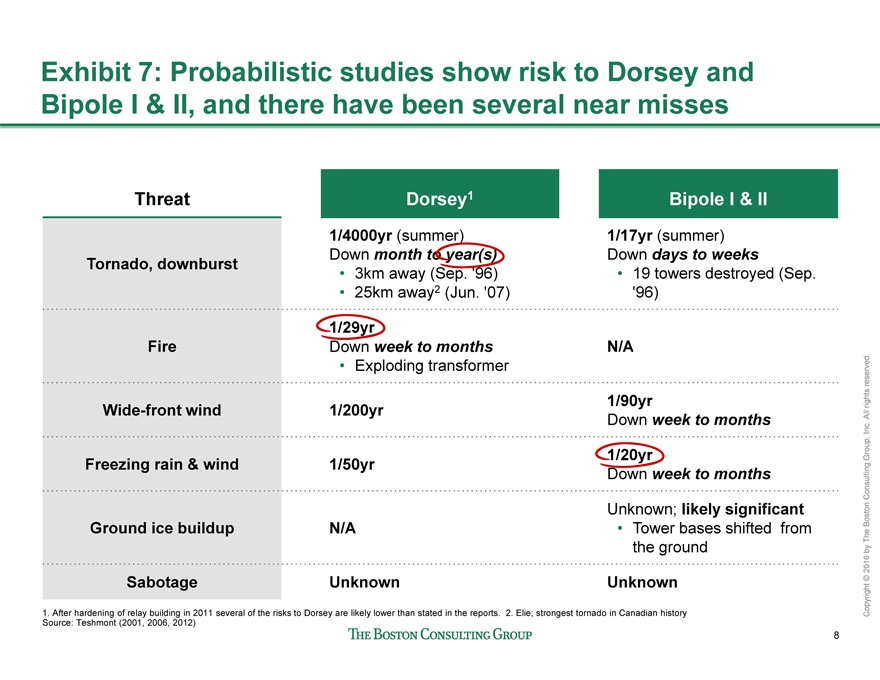
Exhibit 7: Probabilistic studies show risk to Dorsey and
Bipole I & II, and there have been several near misses
1. After hardening of relay building in 2011 several of the risks to Dorsey are likely lower than stated in the reports. 2. Elie; strongest tornado in Canadian history
Source: Teshmont (2001, 2006, 2012)
Threat Dorsey1 Bipole I & II
Tornado, downburst
1/4000yr (summer)
Down month to year(s)
• 3km away (Sep. ‘96)
• 25km away2 (Jun. ‘07)
1/17yr (summer)
Down days to weeks
• 19 towers destroyed (Sep.
‘96)
Fire
1/29yr
Down week to months
• Exploding transformer
N/A
Wide-front wind 1/200yr 1/90yr
Down week to months
Freezing rain & wind 1/50yr 1/20yr
Down week to months
Ground ice buildup N/A
Unknown; likely significant
• Tower bases shifted from
the ground
Sabotage Unknown Unknown
9
Copyright © 2016 by The Boston Consulting Group, Inc. All rights reserved.
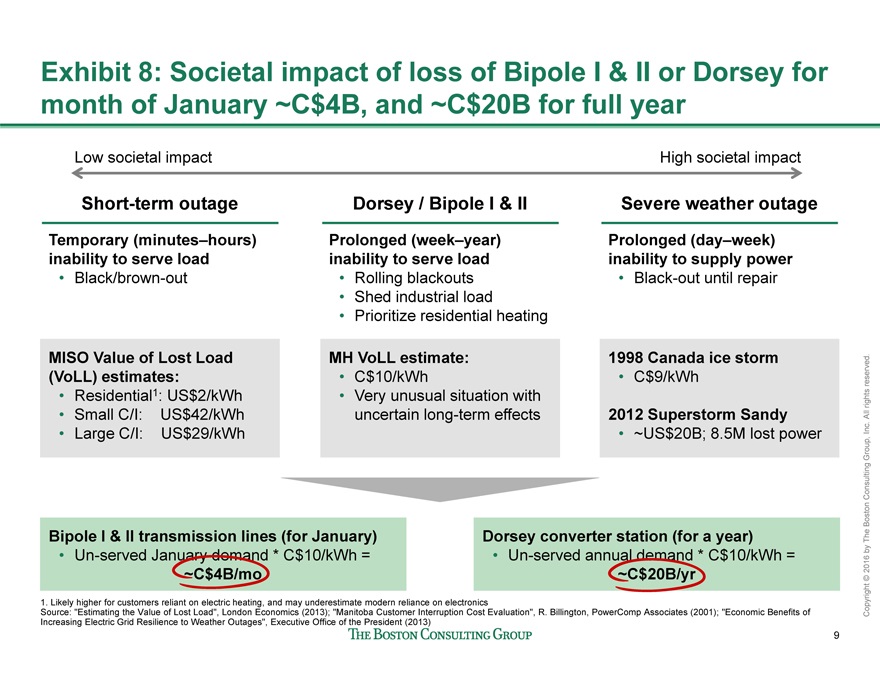
Exhibit 8: Societal impact of loss of Bipole I & II or Dorsey for
month of January ~C$4B, and ~C$20B for full year
Short-term outage
Temporary (minutes–hours)
inability to serve load
• Black/brown-out
Dorsey / Bipole I & II
Prolonged (week–year)
inability to serve load
• Rolling blackouts
• Shed industrial load
• Prioritize residential heating
Severe weather outage
Prolonged (day–week)
inability to supply power
• Black-out until repair
Low societal impact High societal impact
MISO Value of Lost Load
(VoLL) estimates:
• Residential1: US$2/kWh
• Small C/I: US$42/kWh
• Large C/I: US$29/kWh
MH VoLL estimate:
• C$10/kWh
• Very unusual situation with
uncertain long-term effects
1998 Canada ice storm
• C$9/kWh
2012 Superstorm Sandy
• ~US$20B; 8.5M lost power
1. Likely higher for customers reliant on electric heating, and may underestimate modern reliance on electronics
Source: “Estimating the Value of Lost Load”, London Economics (2013); “Manitoba Customer Interruption Cost Evaluation”, R. Billington, PowerComp Associates (2001); “Economic Benefits of
Increasing Electric Grid Resilience to Weather Outages”, Executive Office of the President (2013)
Bipole I & II transmission lines (for January)
• Un-served January demand * C$10/kWh =
~C$4B/mo
Dorsey converter station (for a year)
• Un-served annual demand * C$10/kWh =
~C$20B/yr
10
Copyright © 2016 by The Boston Consulting Group, Inc. All rights reserved.
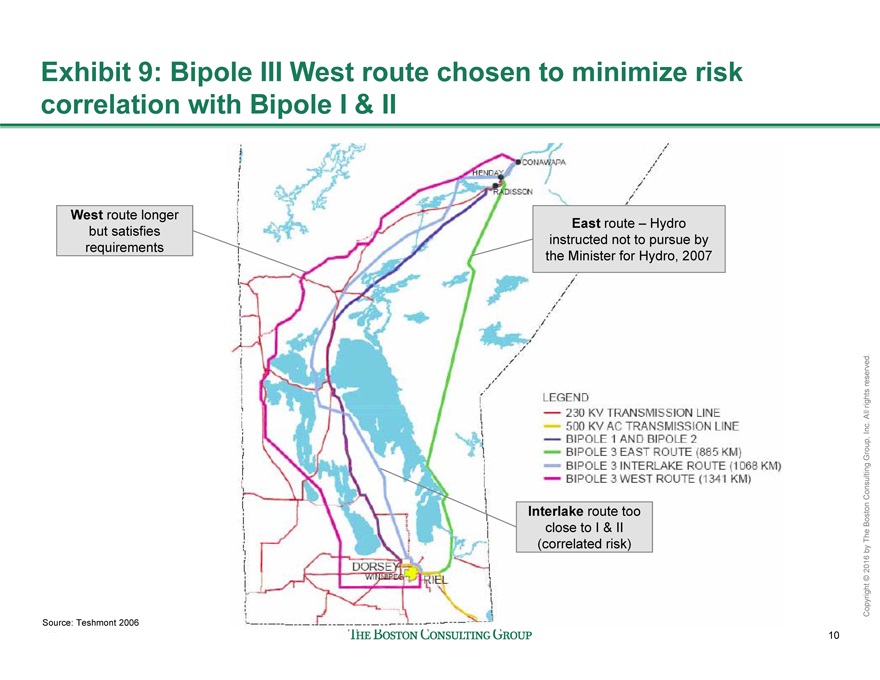
Exhibit 9: Bipole III West route chosen to minimize risk
correlation with Bipole I & II
East route – Hydro
instructed not to pursue by
the Minister for Hydro, 2007
Interlake route too
close to I & II
(correlated risk)
West route longer
but satisfies
requirements
Source: Teshmont 2006
11
Copyright © 2016 by The Boston Consulting Group, Inc. All rights reserved.
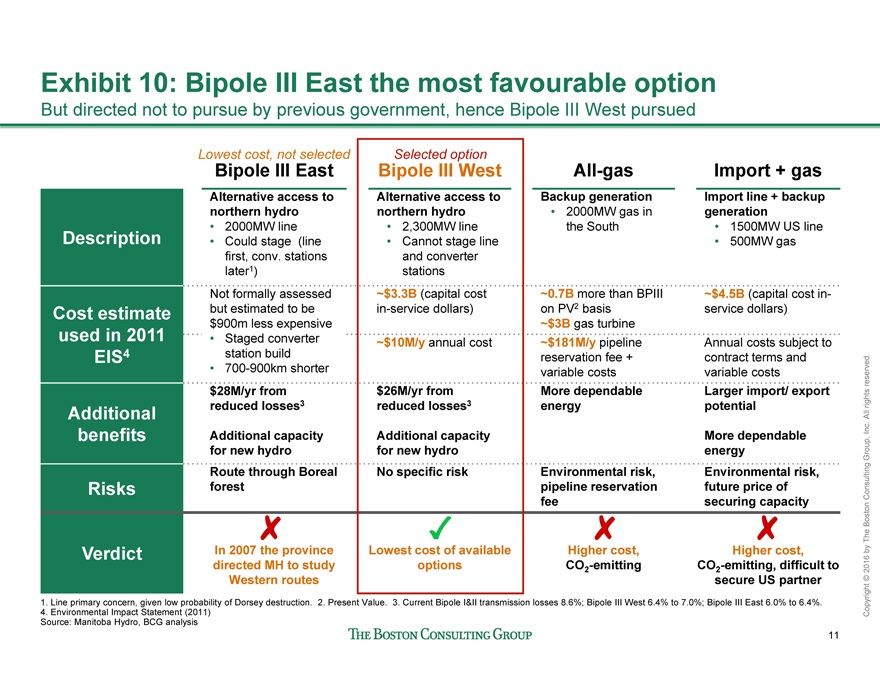
Exhibit 10: Bipole III East the most favourable option
But directed not to pursue by previous government, hence Bipole III West pursued
Bipole III East Bipole III West All-gas Import + gas
Description
Alternative access to
northern hydro
• 2000MW line
• Could stage (line
first, conv. stations
later1)
Alternative access to
northern hydro
• 2,300MW line
• Cannot stage line
and converter
stations
Backup generation
• 2000MW gas in
the South
Import line + backup
generation
• 1500MW US line
• 500MW gas
Cost estimate
used in 2011
EIS4
Not formally assessed
but estimated to be
$900m less expensive
• Staged converter
station build
• 700-900km shorter
~$3.3B (capital cost
in-service dollars)
~0.7B more than BPIII
on PV2 basis
~$3B gas turbine
~$4.5B (capital cost inservice
dollars)
~$10M/y annual cost ~$181M/y pipeline
reservation fee +
variable costs
Annual costs subject to
contract terms and
variable costs
Additional
benefits
$28M/yr from
reduced losses3
Additional capacity
for new hydro
$26M/yr from
reduced losses3
Additional capacity
for new hydro
More dependable
energy
Larger import/ export
potential
More dependable
energy
Risks
Route through Boreal
forest
No specific risk Environmental risk,
pipeline reservation
fee
Environmental risk,
future price of
securing capacity
Verdict In 2007 the province
directed MH to study
Western routes
Lowest cost of available
options
Higher cost,
CO2-emitting
Higher cost,
CO2-emitting, difficult to
secure US partner
1. Line primary concern, given low probability of Dorsey destruction. 2. Present Value. 3. Current Bipole I&II transmission losses 8.6%; Bipole III West 6.4% to 7.0%; Bipole III East 6.0% to 6.4%.
4. Environmental Impact Statement (2011)
Source: Manitoba Hydro, BCG analysis
Lowest cost, not selected Selected option
12
Copyright © 2016 by The Boston Consulting Group, Inc. All rights reserved.
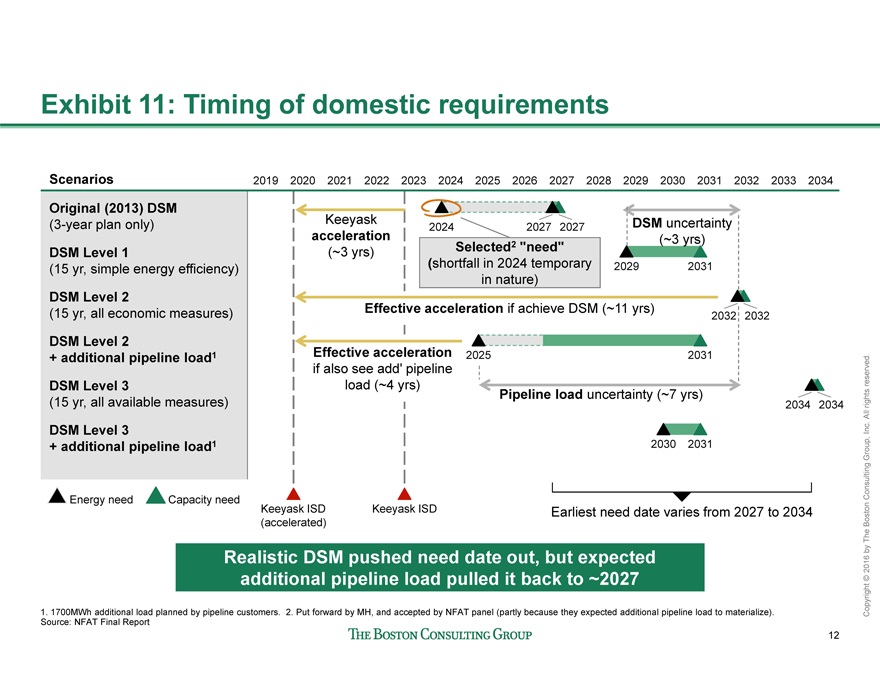
Exhibit 11: Timing of domestic requirements
2019 2020 2021 2022 2023 2024 2025 2026 2027 2028 2029 2030 2031 2032 2033 2034
DSM Level 2
+ additional pipeline load1 2031
Earliest need date varies from 2027 to 2034
DSM Level 2
(15 yr, all economic measures) 2032 2032
DSM Level 1
(15 yr, simple energy efficiency) 2029 2031
Original (2013) DSM
(3-year plan only) 2027 2027
2025
Keeyask ISD Keeyask ISD
(accelerated)
2034 2034
DSM Level 3
(15 yr, all available measures)
2030 2031
DSM Level 3
+ additional pipeline load1
Scenarios
2024
1. 1700MWh additional load planned by pipeline customers. 2. Put forward by MH, and accepted by NFAT panel (partly because they expected additional pipeline load to materialize).
Source: NFAT Final Report
Energy need Capacity need
Keeyask
acceleration
(~3 yrs)
Effective acceleration if achieve DSM (~11 yrs)
Selected2 “need”
(shortfall in 2024 temporary
in nature)
DSM uncertainty
(~3 yrs)
Pipeline load uncertainty (~7 yrs)
Realistic DSM pushed need date out, but expected
additional pipeline load pulled it back to ~2027
Effective acceleration
if also see add’ pipeline
load (~4 yrs)
13
Copyright © 2016 by The Boston Consulting Group, Inc. All rights reserved.
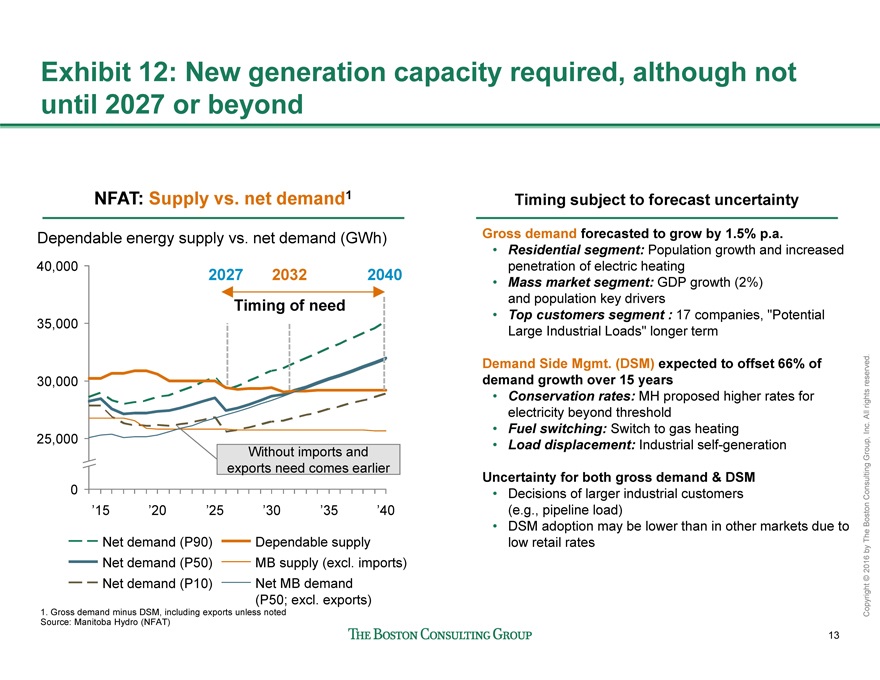
Exhibit 12: New generation capacity required, although not
until 2027 or beyond
1. Gross demand minus DSM, including exports unless noted
Source: Manitoba Hydro (NFAT)
NFAT: Supply vs. net demand1 Timing subject to forecast uncertainty
Gross demand forecasted to grow by 1.5% p.a.
• Residential segment: Population growth and increased
penetration of electric heating
• Mass market segment: GDP growth (2%)
and population key drivers
• Top customers segment : 17 companies, “Potential
Large Industrial Loads” longer term
Demand Side Mgmt. (DSM) expected to offset 66% of
demand growth over 15 years
• Conservation rates: MH proposed higher rates for
electricity beyond threshold
• Fuel switching: Switch to gas heating
• Load displacement: Industrial self-generation
Uncertainty for both gross demand & DSM
• Decisions of larger industrial customers
(e.g., pipeline load)
• DSM adoption may be lower than in other markets due to
low retail rates
40,000
35,000
30,000
25,000
0
Dependable energy supply vs. net demand (GWh)
’15 ’20 ’25 ’30 ’35 ’40
MB supply (excl. imports)
Net demand (P10)
Dependable supply
Net demand (P50)
Net demand (P90)
Net MB demand
(P50; excl. exports)
Without imports and
exports need comes earlier
Timing of need
2027 2032 2040
14
Copyright © 2016 by The Boston Consulting Group, Inc. All rights reserved.
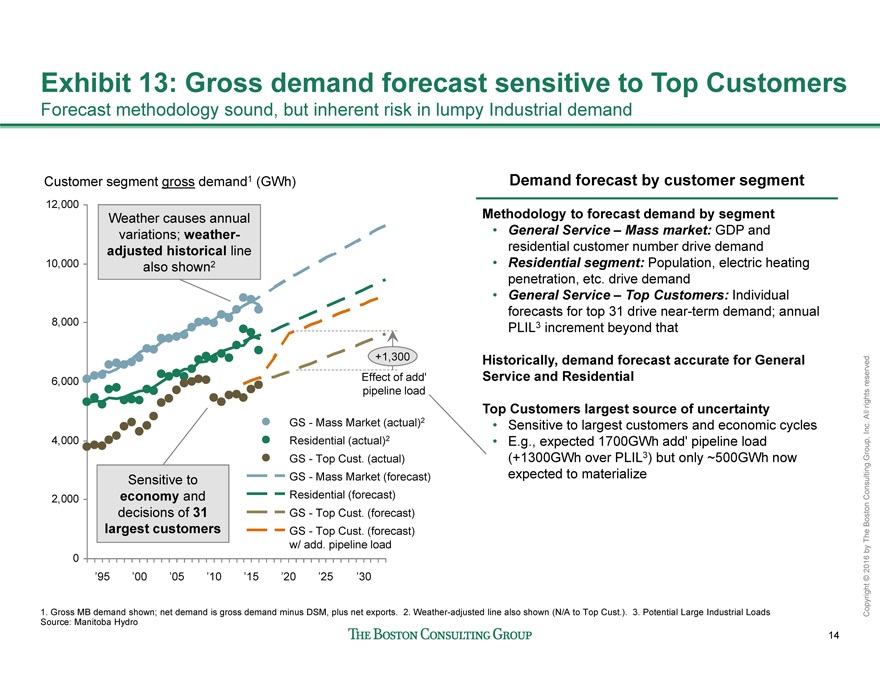
Exhibit 13: Gross demand forecast sensitive to Top Customers
Forecast methodology sound, but inherent risk in lumpy Industrial demand
Demand forecast by customer segment
Methodology to forecast demand by segment
• General Service – Mass market: GDP and
residential customer number drive demand
• Residential segment: Population, electric heating
penetration, etc. drive demand
• General Service – Top Customers: Individual
forecasts for top 31 drive near-term demand; annual
PLIL3 increment beyond that
Historically, demand forecast accurate for General
Service and Residential
Top Customers largest source of uncertainty
• Sensitive to largest customers and economic cycles
• E.g., expected 1700GWh add’ pipeline load
(+1300GWh over PLIL3) but only ~500GWh now
expected to materialize
0
2,000
4,000
6,000
8,000
10,000
12,000
Customer segment gross demand1 (GWh)
+1,300
’95 ’00 ’05 ’10 ’15 ’20 ’25 ’30
GS - Top Cust. (forecast)
w/ add. pipeline load
GS - Top Cust. (forecast)
Residential (forecast)
GS - Mass Market (forecast)
GS - Top Cust. (actual)
Residential (actual)2
GS - Mass Market (actual)2
1. Gross MB demand shown; net demand is gross demand minus DSM, plus net exports. 2. Weather-adjusted line also shown (N/A to Top Cust.). 3. Potential Large Industrial Loads
Source: Manitoba Hydro
Effect of add’
pipeline load
Weather causes annual
variations; weatheradjusted
historical line
also shown2
Sensitive to
economy and
decisions of 31
largest customers
15
Copyright © 2016 by The Boston Consulting Group, Inc. All rights reserved.
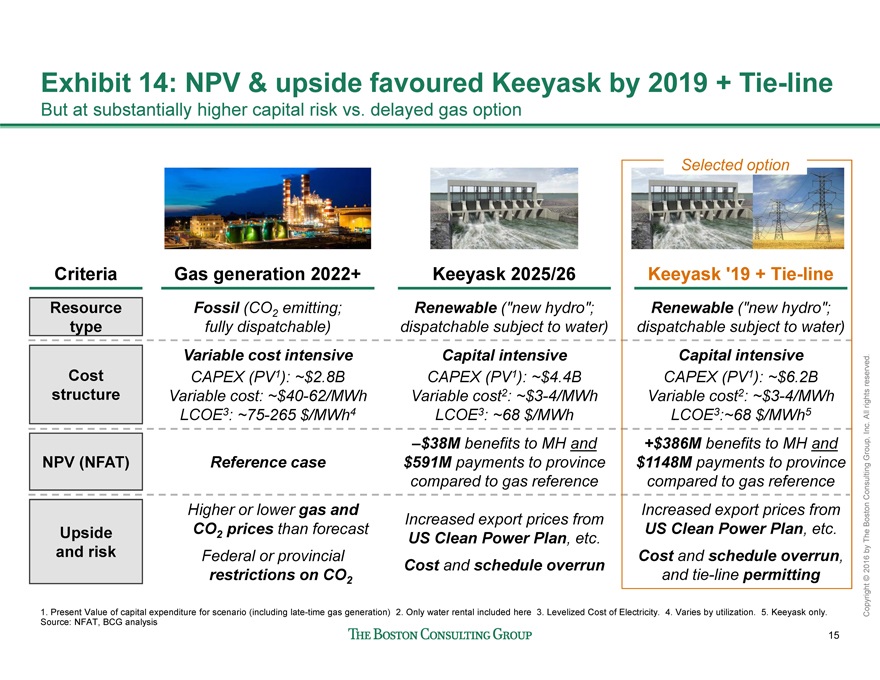
Criteria Gas generation 2022+ Keeyask 2025/26 Keeyask ‘19 + Tie-line
Resource
type
Fossil (CO2 emitting;
fully dispatchable)
Renewable (“new hydro”;
dispatchable subject to water)
Renewable (“new hydro”;
dispatchable subject to water)
Cost
structure
Variable cost intensive
CAPEX (PV1): ~$2.8B
Variable cost: ~$40-62/MWh
LCOE3: ~75-265 $/MWh4
Capital intensive
CAPEX (PV1): ~$4.4B
Variable cost2: ~$3-4/MWh
LCOE3: ~68 $/MWh
Capital intensive
CAPEX (PV1): ~$6.2B
Variable cost2: ~$3-4/MWh
LCOE3:~68 $/MWh5
NPV (NFAT) Reference case
–$38M benefits to MH and
$591M payments to province
compared to gas reference
+$386M benefits to MH and
$1148M payments to province
compared to gas reference
Upside
and risk
Higher or lower gas and
CO2 prices than forecast
Federal or provincial
restrictions on CO2
Increased export prices from
US Clean Power Plan, etc.
Cost and schedule overrun
Increased export prices from
US Clean Power Plan, etc.
Cost and schedule overrun,
and tie-line permitting
Exhibit 14: NPV & upside favoured Keeyask by 2019 + Tie-line
But at substantially higher capital risk vs. delayed gas option
Selected option
1. Present Value of capital expenditure for scenario (including late-time gas generation) 2. Only water rental included here 3. Levelized Cost of Electricity. 4. Varies by utilization. 5. Keeyask only.
Source: NFAT, BCG analysis
16
Copyright © 2016 by The Boston Consulting Group, Inc. All rights reserved.
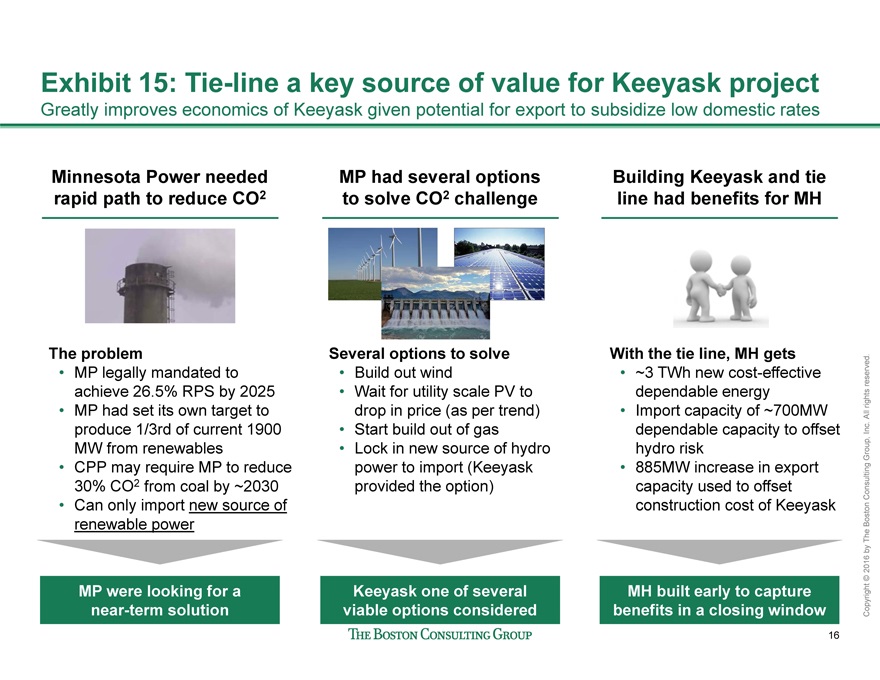
Exhibit 15: Tie-line a key source of value for Keeyask project
Greatly improves economics of Keeyask given potential for export to subsidize low domestic rates
Building Keeyask and tie
line had benefits for MH
With the tie line, MH gets
• ~3 TWh new cost-effective
dependable energy
• Import capacity of ~700MW
dependable capacity to offset
hydro risk
• 885MW increase in export
capacity used to offset
construction cost of Keeyask
Minnesota Power needed
rapid path to reduce CO2
The problem
• MP legally mandated to
achieve 26.5% RPS by 2025
• MP had set its own target to
produce 1/3rd of current 1900
MW from renewables
• CPP may require MP to reduce
30% CO2 from coal by ~2030
• Can only import new source of
renewable power
MP had several options
to solve CO2 challenge
Several options to solve
• Build out wind
• Wait for utility scale PV to
drop in price (as per trend)
• Start build out of gas
• Lock in new source of hydro
power to import (Keeyask
provided the option)
MP were looking for a
near-term solution
Keeyask one of several
viable options considered
MH built early to capture
benefits in a closing window
17
Copyright © 2016 by The Boston Consulting Group, Inc. All rights reserved.
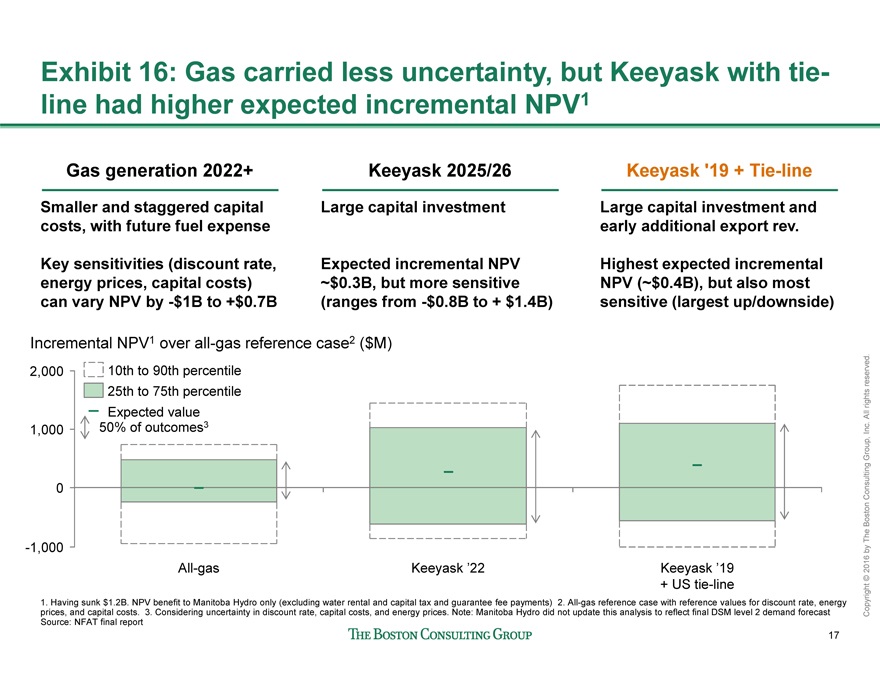
Exhibit 16: Gas carried less uncertainty, but Keeyask with tieline
had higher expected incremental NPV1
1. Having sunk $1.2B. NPV benefit to Manitoba Hydro only (excluding water rental and capital tax and guarantee fee payments) 2. All-gas reference case with reference values for discount rate, energy
prices, and capital costs. 3. Considering uncertainty in discount rate, capital costs, and energy prices. Note: Manitoba Hydro did not update this analysis to reflect final DSM level 2 demand forecast
Source: NFAT final report
2,000
0
1,000
-1,000
Keeyask ’19
+ US tie-line
Incremental NPV1 over all-gas reference case2 ($M)
All-gas Keeyask ’22
Expected value
25th to 75th percentile
10th to 90th percentile
50% of outcomes3
Gas generation 2022+
Smaller and staggered capital
costs, with future fuel expense
Key sensitivities (discount rate,
energy prices, capital costs)
can vary NPV by -$1B to +$0.7B
Keeyask 2025/26
Large capital investment
Expected incremental NPV
~$0.3B, but more sensitive
(ranges from -$0.8B to + $1.4B)
Keeyask ‘19 + Tie-line
Large capital investment and
early additional export rev.
Highest expected incremental
NPV (~$0.4B), but also most
sensitive (largest up/downside)
18
Copyright © 2016 by The Boston Consulting Group, Inc. All rights reserved.
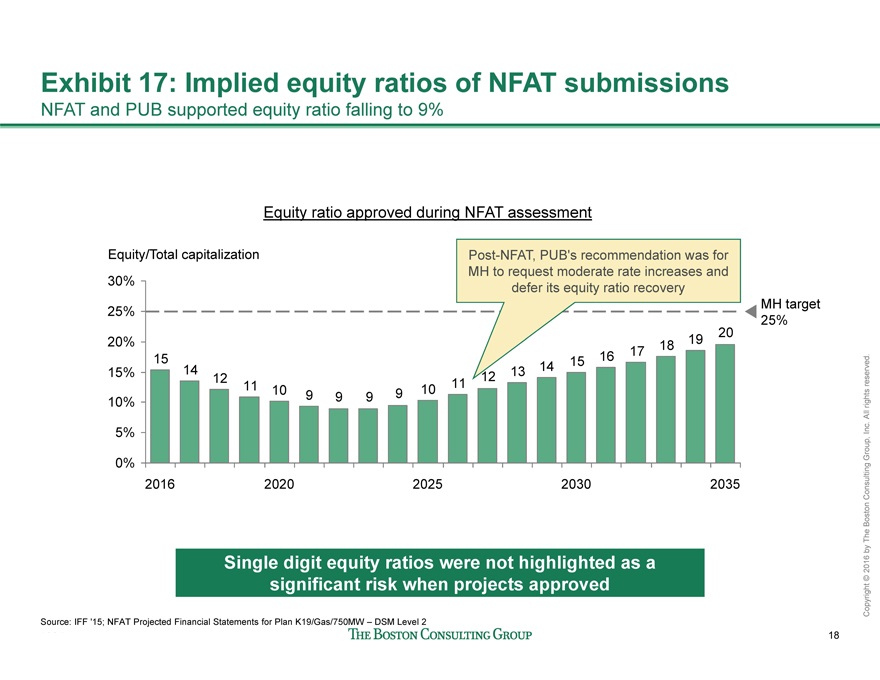
Exhibit 17: Implied equity ratios of NFAT submissions
NFAT and PUB supported equity ratio falling to 9%
19 20 17 18 15 16 13 14 11 12 11 10 9 9 9 9 10 14 12
15
0%
5%
10%
15%
20%
25%
30%
Equity/Total capitalization
2016 2025 2035
MH target
25%
2020 2030
Source: IFF ‘15; NFAT Projected Financial Statements for Plan K19/Gas/750MW – DSM Level 2
Post-NFAT, PUB’s recommendation was for
MH to request moderate rate increases and
defer its equity ratio recovery
Equity ratio approved during NFAT assessment
Single digit equity ratios were not highlighted as a
significant risk when projects approved
19
Copyright © 2016 by The Boston Consulting Group, Inc. All rights reserved.
Exhibit 18: Equity ratios well-below most peers
Capital structure and credit rating for US and Canadian
gov’t and investor-owned regulated utilities
1. 2022 Expected Equity Ratio on NFAT Base Case 2. Salt River Project an entity of the State of Arizona 3. Federally owned corporation 4. US Federal administration within Dept. of Energy
Source: 2015 Audited Financial statements, SNL
0%
80%
60%
40%
20%
Equity /Total Capitalization
Hydro
One
51
Min. projected1
MH level: 9
NB Power
4
Manitoba
Hydro
18
9
BC Hydro
20
Sask
Power
26
Hydro
Quebec
32
Bonneville4
18
TVA3
23
Salt River2
53
Exelon
51
Duke
Energy
53
Dominion
59
NextEra
62
Investor-owned
regulated utilities
US Gov’t
backed
hydro
Canadian Crown
Corporations
20
Copyright © 2016 by The Boston Consulting Group, Inc. All rights reserved.
30%
45
50
55
15%
5%
35%
40%
25%
60
60%
20%
10%
55%
65%
0%
45%
50%
70%
0
5
10
15
20
25
30
35
40
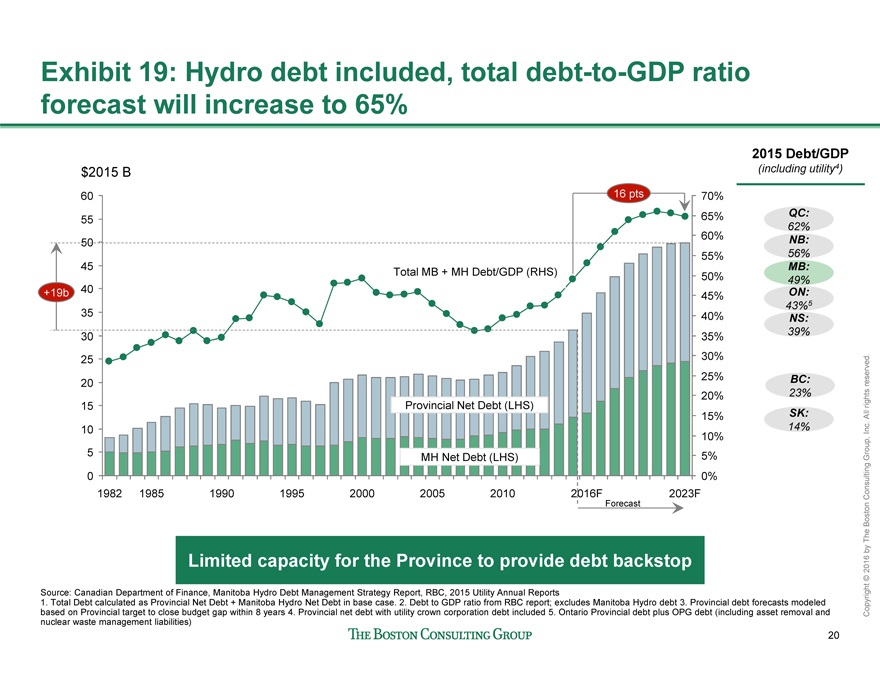
16 pts
$2015 B
1982 1985 1990 1995 2000 2005 2010 2023F
+19b
2016F
Total MB + MH Debt/GDP (RHS)
Exhibit 19: Hydro debt included, total debt-to-GDP ratio
forecast will increase to 65%
Source: Canadian Department of Finance, Manitoba Hydro Debt Management Strategy Report, RBC, 2015 Utility Annual Reports
1. Total Debt calculated as Provincial Net Debt + Manitoba Hydro Net Debt in base case. 2. Debt to GDP ratio from RBC report; excludes Manitoba Hydro debt 3. Provincial debt forecasts modeled
based on Provincial target to close budget gap within 8 years 4. Provincial net debt with utility crown corporation debt included 5. Ontario Provincial debt plus OPG debt (including asset removal and
nuclear waste management liabilities)
Provincial Net Debt (LHS)
MH Net Debt (LHS)
Limited capacity for the Province to provide debt backstop
Forecast
2015 Debt/GDP
(including utility4)
SK:
14%
BC:
23%
MB:
49%
NB:
56%
QC:
62%
ON:
43%5
NS:
39%
21
Copyright © 2016 by The Boston Consulting Group, Inc. All rights reserved.
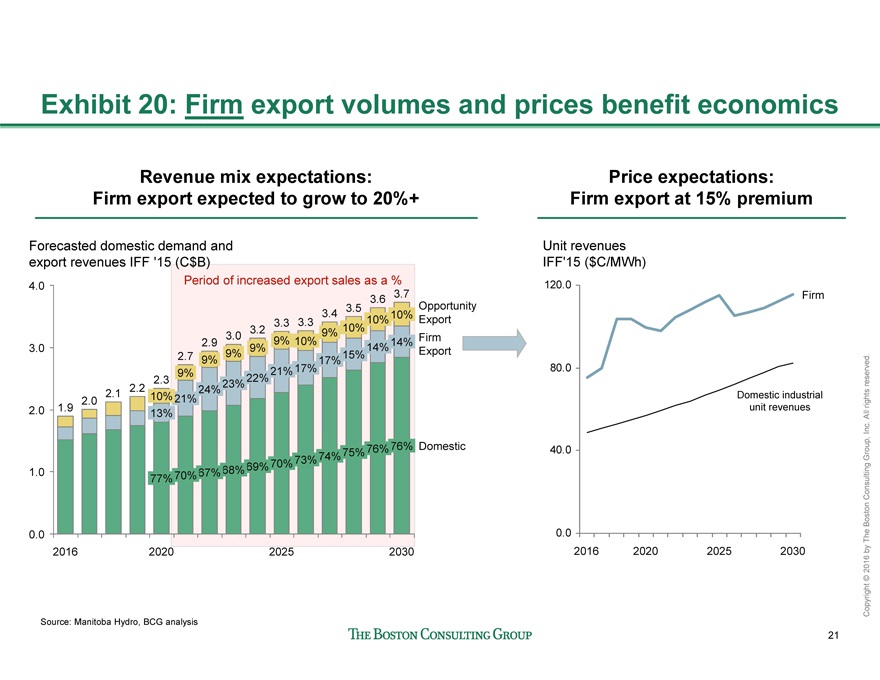
Period of increased export sales as a %
Exhibit 20: Firm export volumes and prices benefit economics
0.0
4.0
3.0
2.0
1.0
Forecasted domestic demand and
export revenues IFF ‘15 (C$B)
Domestic
Firm
Export
Opportunity
Export
2030
3.7
76%
14%
10%
3.6
76%
14%
10%
3.5
75%
15%
10%
3.4
74%
17%
9%
3.3
73%
17%
10%
2025
3.3
70%
21%
9%
3.2
69%
22%
9%
3.0
68%
23%
9%
2.9
67%
24%
2.7 9%
70%
21%
9%
2020
2.3
77%
13%
10%
2.1 2.2 2.0
2016
1.9
0.0
40.0
80.0
120.0
Firm
2016 2020 2025 2030
Unit revenues
IFF’15 ($C/MWh)
Revenue mix expectations:
Firm export expected to grow to 20%+
Price expectations:
Firm export at 15% premium
Source: Manitoba Hydro, BCG analysis
Domestic industrial
unit revenues
22
Copyright © 2016 by The Boston Consulting Group, Inc. All rights reserved.
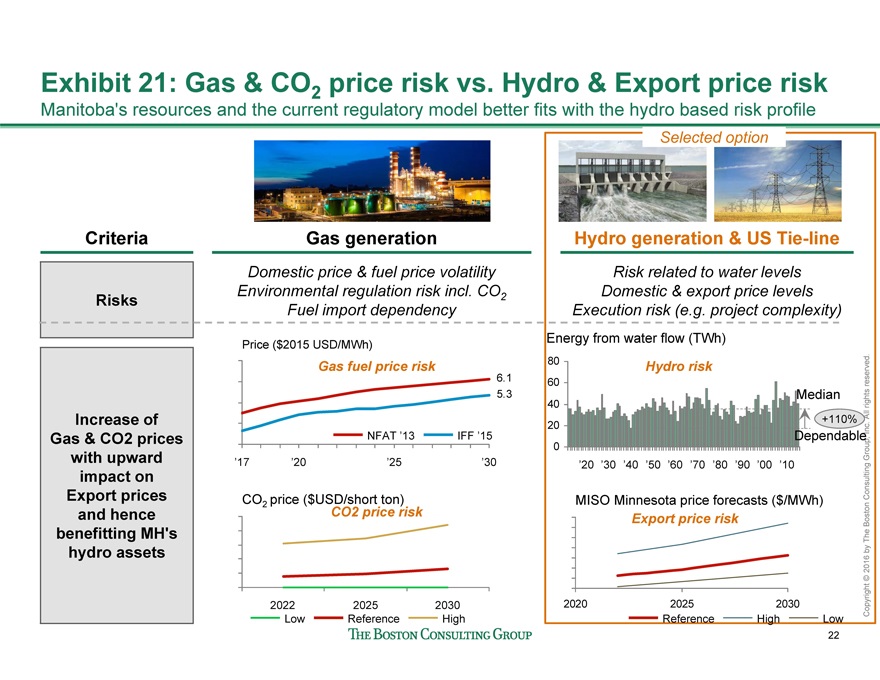
Criteria Gas generation Hydro generation & US Tie-line
Risks
Domestic price & fuel price volatility
Environmental regulation risk incl. CO2
Fuel import dependency
Risk related to water levels
Domestic & export price levels
Execution risk (e.g. project complexity)
Increase of
Gas & CO2 prices
with upward
impact on
Export prices
and hence
benefitting MH’s
hydro assets
Exhibit 21: Gas & CO2 price risk vs. Hydro & Export price risk
Manitoba’s resources and the current regulatory model better fits with the hydro based risk profile
Selected option
0
20
40
60
80
Energy from water flow (TWh)
+110%
’20 ’30 ’40 ’50 ’60 ’70 ’80 ’90 ’00 ’10
Median
Export price risk
Gas fuel price risk
2020 2025 2030
MISO Minnesota price forecasts ($/MWh)
Hydro risk
Dependable
Reference High Low
CO2 price risk
6.1
5.3
Price ($2015 USD/MWh)
’17 ’20 ’25 ’30
NFAT ’13 IFF ’15
2022 2025 2030
CO2 price ($USD/short ton)
Low Reference High
23
Copyright © 2016 by The Boston Consulting Group, Inc. All rights reserved.
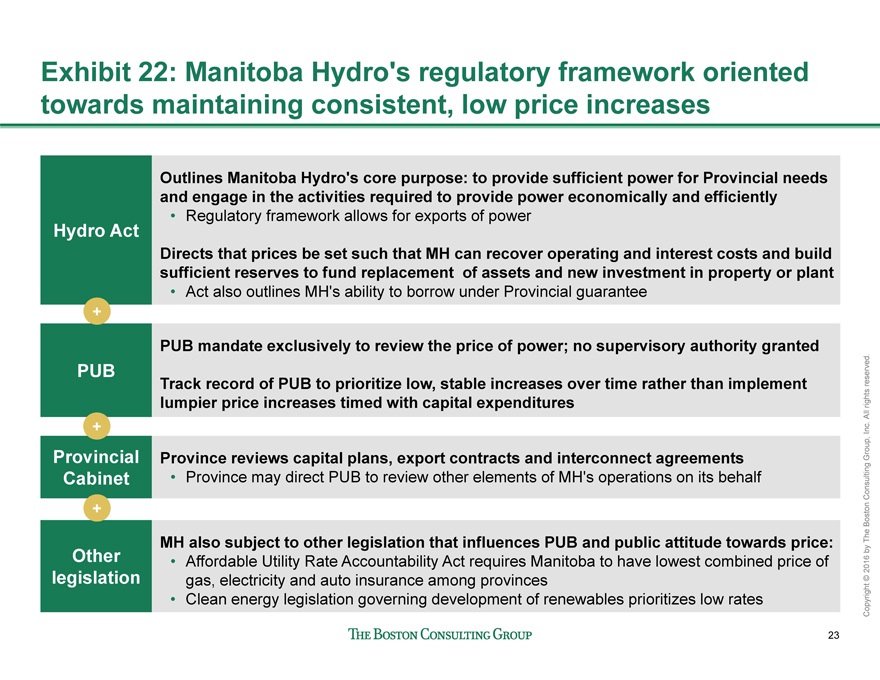
Exhibit 22: Manitoba Hydro’s regulatory framework oriented
towards maintaining consistent, low price increases
Hydro Act
Outlines Manitoba Hydro’s core purpose: to provide sufficient power for Provincial needs
and engage in the activities required to provide power economically and efficiently
• Regulatory framework allows for exports of power
Directs that prices be set such that MH can recover operating and interest costs and build
sufficient reserves to fund replacement of assets and new investment in property or plant
• Act also outlines MH’s ability to borrow under Provincial guarantee
PUB
PUB mandate exclusively to review the price of power; no supervisory authority granted
Track record of PUB to prioritize low, stable increases over time rather than implement
lumpier price increases timed with capital expenditures
Provincial
Cabinet
Province reviews capital plans, export contracts and interconnect agreements
• Province may direct PUB to review other elements of MH’s operations on its behalf
Other
legislation
MH also subject to other legislation that influences PUB and public attitude towards price:
• Affordable Utility Rate Accountability Act requires Manitoba to have lowest combined price of
gas, electricity and auto insurance among provinces
• Clean energy legislation governing development of renewables prioritizes low rates
+
+
+
24
Copyright © 2016 by The Boston Consulting Group, Inc. All rights reserved.
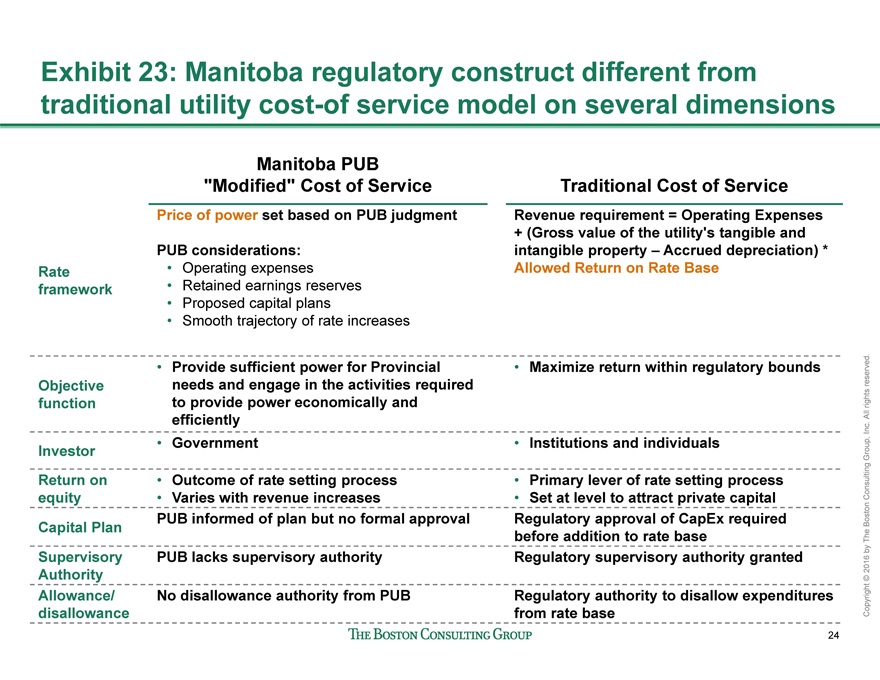
Exhibit 23: Manitoba regulatory construct different from
traditional utility cost-of service model on several dimensions
Manitoba PUB
“Modified” Cost of Service Traditional Cost of Service
Rate
framework
Price of power set based on PUB judgment
PUB considerations:
• Operating expenses
• Retained earnings reserves
• Proposed capital plans
• Smooth trajectory of rate increases
Revenue requirement = Operating Expenses
+ (Gross value of the utility’s tangible and
intangible property – Accrued depreciation) *
Allowed Return on Rate Base
Objective
function
��� Provide sufficient power for Provincial
needs and engage in the activities required
to provide power economically and
efficiently
• Maximize return within regulatory bounds
Investor • Government • Institutions and individuals
Return on
equity
• Outcome of rate setting process
• Varies with revenue increases
• Primary lever of rate setting process
• Set at level to attract private capital
Capital Plan PUB informed of plan but no formal approval Regulatory approval of CapEx required
before addition to rate base
Supervisory
Authority
PUB lacks supervisory authority Regulatory supervisory authority granted
Allowance/
disallowance
No disallowance authority from PUB Regulatory authority to disallow expenditures
from rate base
25
Copyright © 2016 by The Boston Consulting Group, Inc. All rights reserved.
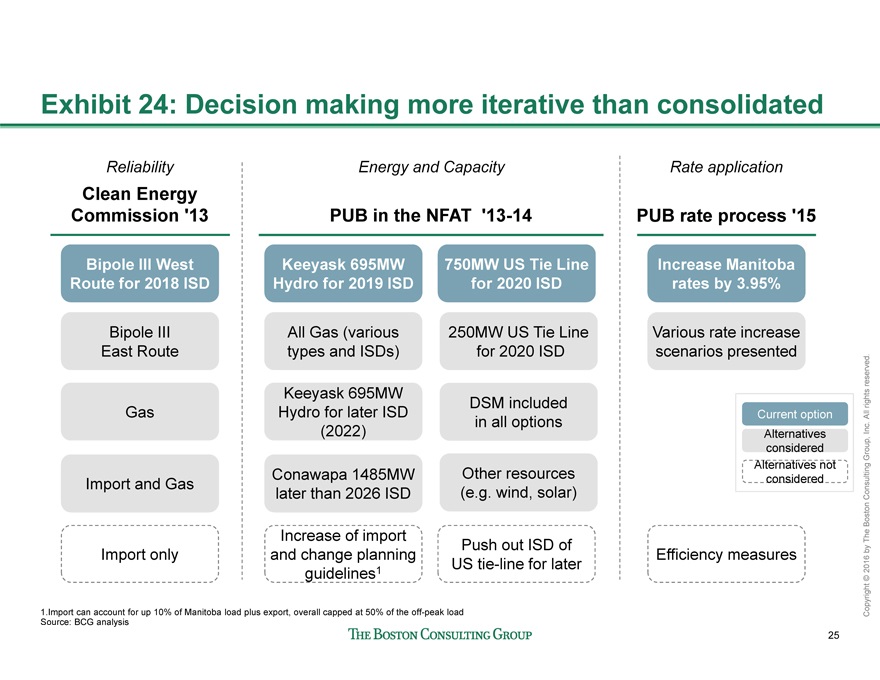
Exhibit 24: Decision making more iterative than consolidated
Current option
Alternatives
considered
Alternatives not
considered
1.Import can account for up 10% of Manitoba load plus export, overall capped at 50% of the off-peak load
Source: BCG analysis
Bipole III West
Route for 2018 ISD
Bipole III
East Route
Gas
Import and Gas
Keeyask 695MW
Hydro for 2019 ISD
750MW US Tie Line
for 2020 ISD
Various rate increase
scenarios presented
Conawapa 1485MW
for later than 2026
ISD
Clean Energy
Commission ‘13 PUB in the NFAT ‘13-14 PUB rate process ‘15
Increase Manitoba
rates by 3.95%
Reliability Energy and Capacity Rate application
Increase of import
and change planning
guidelines1
Import only
Conawapa 1485MW
later than 2026 ISD
All Gas (various
types and ISDs)
Keeyask 695MW
Hydro for later ISD
(2022)
Efficiency measures
250MW US Tie Line
for 2020 ISD
DSM included
in all options
Other resources
(e.g. wind, solar)
Push out ISD of
US tie-line for later
26
Copyright © 2016 by The Boston Consulting Group, Inc. All rights reserved.
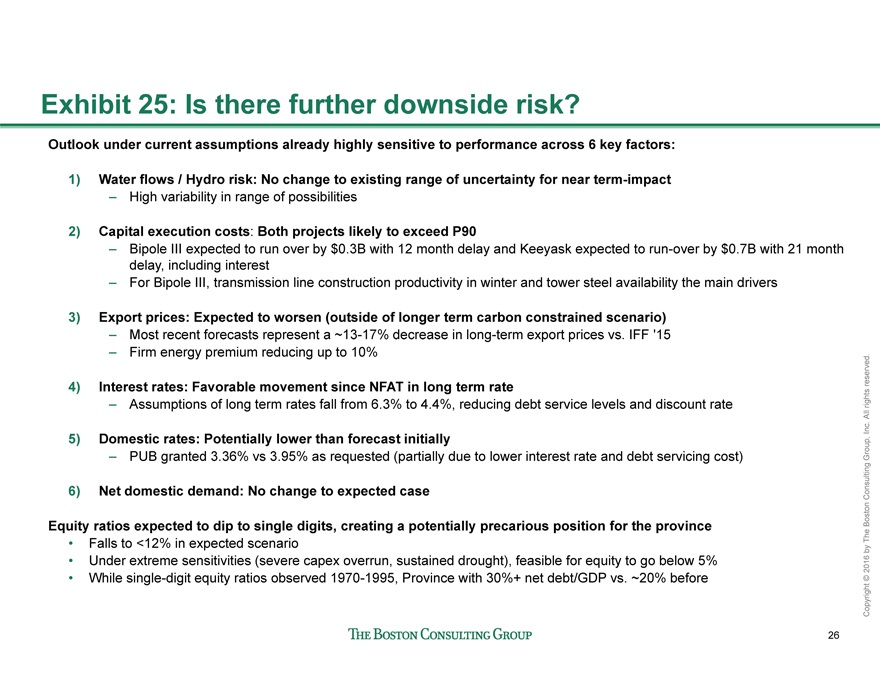
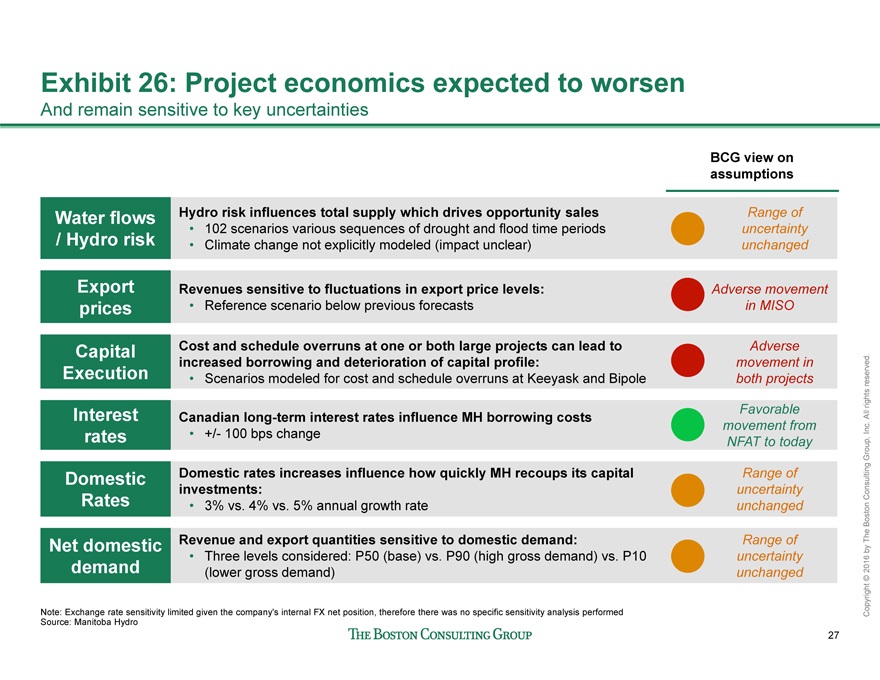
Exhibit 25: Is there further downside risk?
Outlook under current assumptions already highly sensitive to performance across 6 key factors:
1) Water flows / Hydro risk: No change to existing range of uncertainty for near term-impact
– High variability in range of possibilities
2) Capital execution costs: Both projects likely to exceed P90
– Bipole III expected to run over by $0.3B with 12 month delay and Keeyask expected to run-over by $0.7B with 21 month
delay, including interest
– For Bipole III, transmission line construction productivity in winter and tower steel availability the main drivers
3) Export prices: Expected to worsen (outside of longer term carbon constrained scenario)
– Most recent forecasts represent a ~13-17% decrease in long-term export prices vs. IFF ‘15
– Firm energy premium reducing up to 10%
4) Interest rates: Favorable movement since NFAT in long term rate
– Assumptions of long term rates fall from 6.3% to 4.4%, reducing debt service levels and discount rate
5) Domestic rates: Potentially lower than forecast initially
– PUB granted 3.36% vs 3.95% as requested (partially due to lower interest rate and debt servicing cost)
6) Net domestic demand: No change to expected case
Equity ratios expected to dip to single digits, creating a potentially precarious position for the province
• Falls to <12% in expected scenario
• Under extreme sensitivities (severe capex overrun, sustained drought), feasible for equity to go below 5%
• While single-digit equity ratios observed 1970-1995, Province with 30%+ net debt/GDP vs. ~20% before
27
Copyright © 2016 by The Boston Consulting Group, Inc. All rights reserved.
Water flows
/ Hydro risk
Hydro risk influences total supply which drives opportunity sales
• 102 scenarios various sequences of drought and flood time periods
• Climate change not explicitly modeled (impact unclear)
Range of
uncertainty
unchanged
Export
prices
Revenues sensitive to fluctuations in export price levels:
• Reference scenario below previous forecasts
Adverse movement
in MISO
Capital
Execution
Cost and schedule overruns at one or both large projects can lead to
increased borrowing and deterioration of capital profile:
• Scenarios modeled for cost and schedule overruns at Keeyask and Bipole
Adverse
movement in
both projects
Interest
rates
Canadian long-term interest rates influence MH borrowing costs
• +/- 100 bps change
Favorable
movement from
NFAT to today
Domestic
Rates
Domestic rates increases influence how quickly MH recoups its capital
investments:
• 3% vs. 4% vs. 5% annual growth rate
Range of
uncertainty
unchanged
Net domestic
demand
Revenue and export quantities sensitive to domestic demand:
• Three levels considered: P50 (base) vs. P90 (high gross demand) vs. P10
(lower gross demand)
Range of
uncertainty
unchanged
Exhibit 26: Project economics expected to worsen
And remain sensitive to key uncertainties
Note: Exchange rate sensitivity limited given the company’s internal FX net position, therefore there was no specific sensitivity analysis performed
Source: Manitoba Hydro
BCG view on
assumptions
28
Copyright © 2016 by The Boston Consulting Group, Inc. All rights reserved.
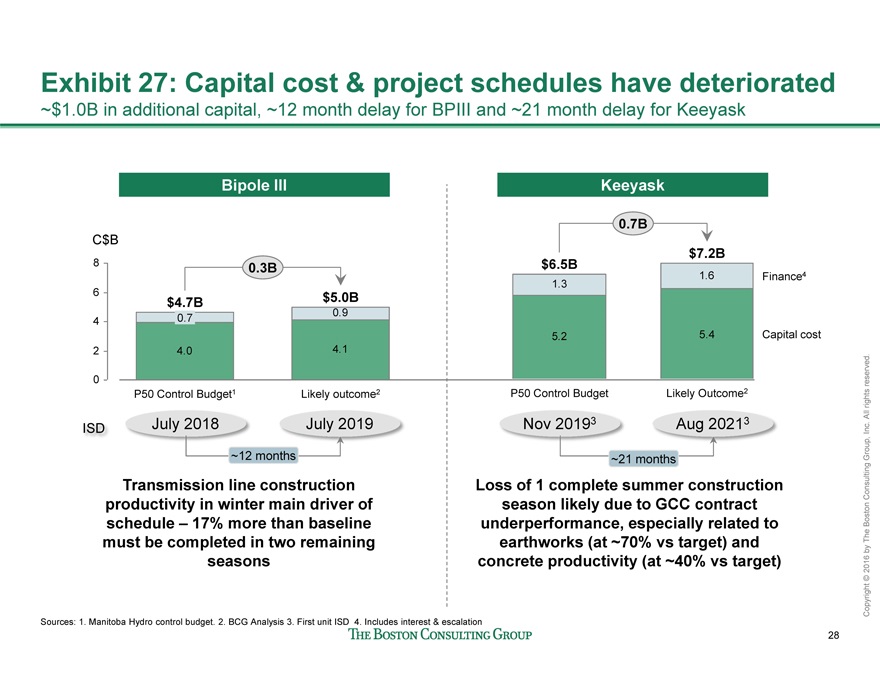
Exhibit 27: Capital cost & project schedules have deteriorated
~$1.0B in additional capital, ~12 month delay for BPIII and ~21 month delay for Keeyask
Sources: 1. Manitoba Hydro control budget. 2. BCG Analysis 3. First unit ISD 4. Includes interest & escalation
4.0 4.1
0.9
0
2
4
6
8
C$B
Likely outcome2
0.3B
$5.0B
P50 Control Budget1
$4.7B
0.7
ISD July 2018 July 2019
1.3
1.6
5.2
$6.5B
P50 Control Budget
5.4
$7.2B
Likely Outcome2
Finance4
Capital cost
0.7B
Nov 20193 Aug 20213
Bipole III Keeyask
Transmission line construction
productivity in winter main driver of
schedule – 17% more than baseline
must be completed in two remaining
seasons
Loss of 1 complete summer construction
season likely due to GCC contract
underperformance, especially related to
earthworks (at ~70% vs target) and
concrete productivity (at ~40% vs target)
~12 months ~21 months
29
Copyright © 2016 by The Boston Consulting Group, Inc. All rights reserved.
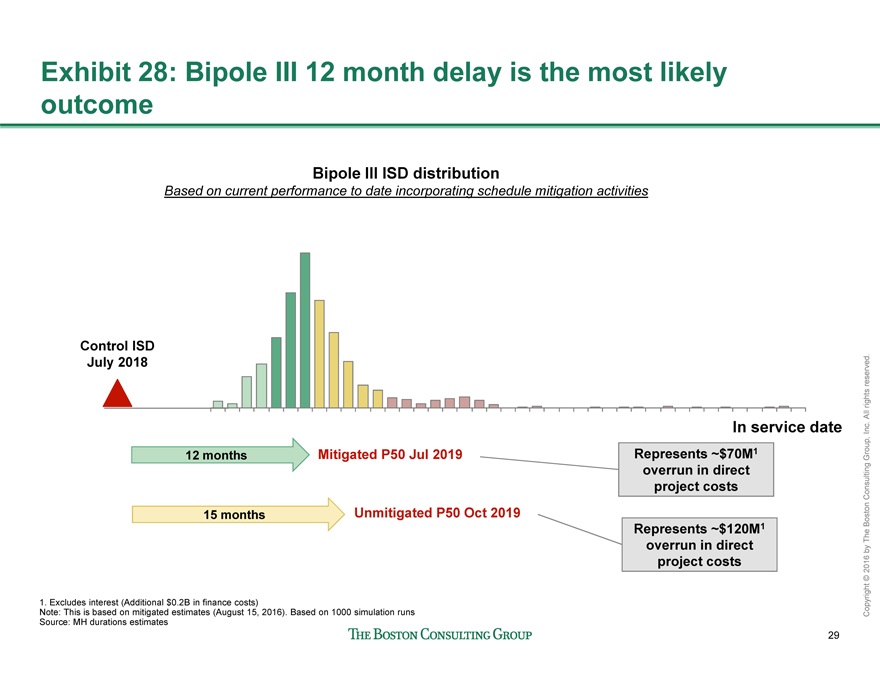
Exhibit 28: Bipole III 12 month delay is the most likely
outcome
Unmitigated P50 Oct 2019
Mitigated P50 Jul 2019
Control ISD
July 2018
12 months
In service date
1. Excludes interest (Additional $0.2B in finance costs)
Note: This is based on mitigated estimates (August 15, 2016). Based on 1000 simulation runs
Source: MH durations estimates
Bipole III ISD distribution
Based on current performance to date incorporating schedule mitigation activities
15 months
Represents ~$70M1
overrun in direct
project costs
Represents ~$120M1
overrun in direct
project costs
30
Copyright © 2016 by The Boston Consulting Group, Inc. All rights reserved.
Exhibit 29: Mitigated project delay expected to be ~21 months
Estimated in-service cost equal to ~$7.2B
1. Excludes interest (Additional $0.3B in finance costs) 2. Excludes interest (Additional $0.7B in finance costs)
Note: Activity durations and mitigation plans determined in conjunction with Manitoba Hydro. Based on 10000 simulation runs on 12-Aug-2016
Source: MH durations estimates. BCG analysis
Control ISD
Unit 1: Nov 2019
This image cannot currently be displayed.
Mitigated P50 Aug 2021
Represents ~$0.4B1
overrun in direct
project costs
21 months
32 months Unmitigated P50 Jul 2022
Keeyask schedule distribution
Represents ~$0.6B2
overrun in direct
project costs
31
Copyright © 2016 by The Boston Consulting Group, Inc. All rights reserved.
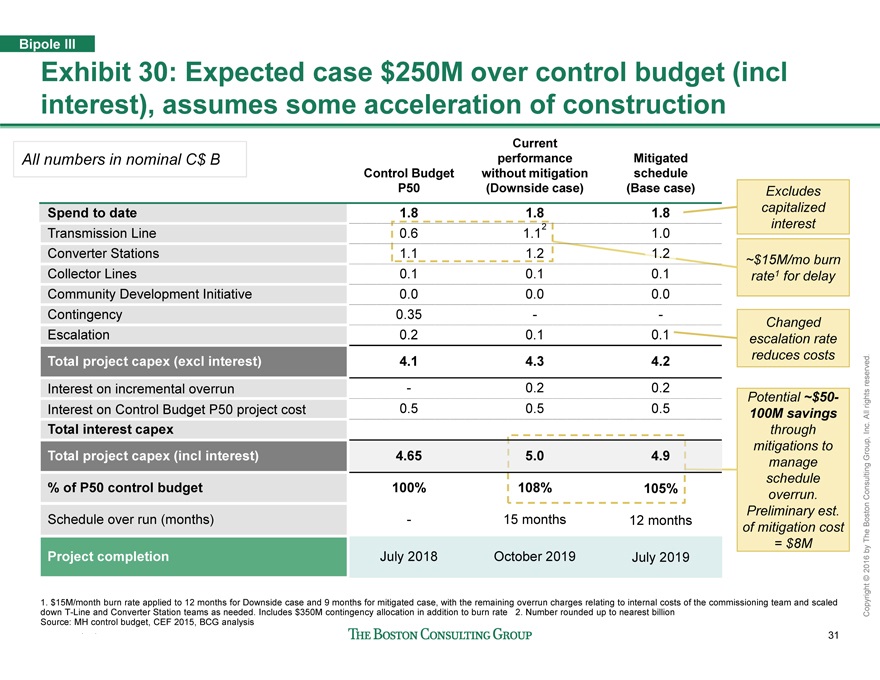
Exhibit 30: Expected case $250M over control budget (incl
interest), assumes some acceleration of construction
Bipole III
All numbers in nominal C$ B
~$15M/mo burn
rate1 for delay
Potential ~$50-
100M savings
through
mitigations to
manage
schedule
overrun.
Preliminary est.
of mitigation cost
= $8M
Excludes
capitalized
interest
1. $15M/month burn rate applied to 12 months for Downside case and 9 months for mitigated case, with the remaining overrun charges relating to internal costs of the commissioning team and scaled
down T-Line and Converter Station teams as needed. Includes $350M contingency allocation in addition to burn rate 2. Number rounded up to nearest billion
Source: MH control budget, CEF 2015, BCG analysis
Changed
escalation rate
reduces costs
Control Budget
P50
Current
performance
without mitigation
(Downside case)
Mitigated
schedule
(Base case)
Spend to date 1.8 1.8 1.8
Transmission Line 0.6 1.12 1.0
Converter Stations 1.1 1.2 1.2
Collector Lines 0.1 0.1 0.1
Community Development Initiative 0.0 0.0 0.0
Contingency 0.35 - -
Escalation 0.2 0.1 0.1
Total project capex (excl interest) 4.1 4.3 4.2
Interest on incremental overrun - 0.2 0.2
Interest on Control Budget P50 project cost 0.5 0.5 0.5
Total interest capex
Total project capex (incl interest) 4.65 5.0 4.9
% of P50 control budget 100% 108% 105%
Schedule over run (months) - 15 months 12 months
Project completion July 2018 October 2019 July 2019
32
Copyright © 2016 by The Boston Consulting Group, Inc. All rights reserved.
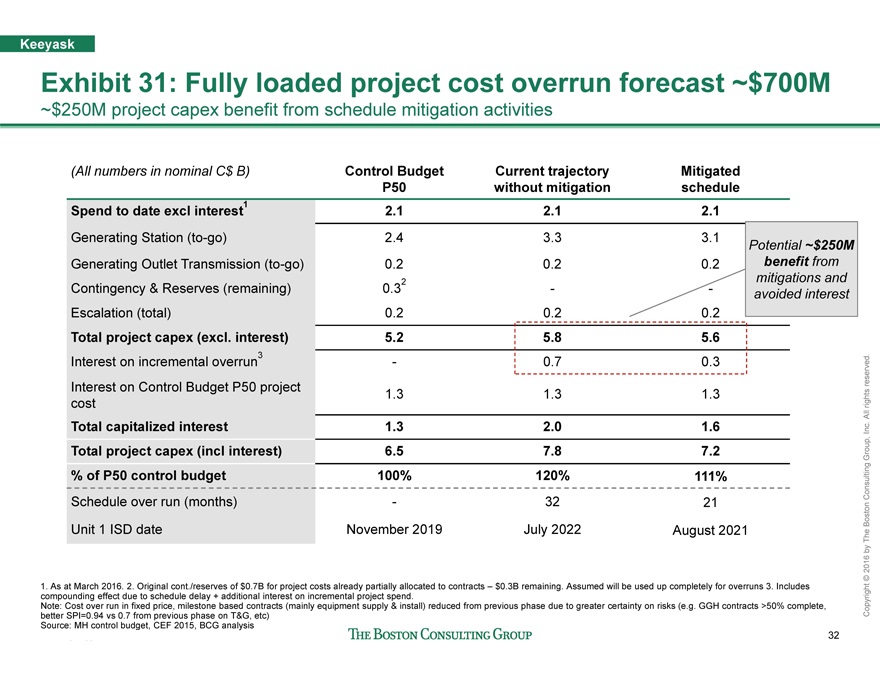
Exhibit 31: Fully loaded project cost overrun forecast ~$700M
~$250M project capex benefit from schedule mitigation activities
Keeyask
(All numbers in nominal C$ B) Control Budget
P50
Current trajectory
without mitigation
Mitigated
schedule
Spend to date excl interest1 2.1 2.1 2.1
Generating Station (to-go) 2.4 3.3 3.1
Generating Outlet Transmission (to-go) 0.2 0.2 0.2
Contingency & Reserves (remaining) 0.32 - -
Escalation (total) 0.2 0.2 0.2
Total project capex (excl. interest) 5.2 5.8 5.6
Interest on incremental overrun3 - 0.7 0.3
Interest on Control Budget P50 project
cost
1.3 1.3 1.3
Total capitalized interest 1.3 2.0 1.6
Total project capex (incl interest) 6.5 7.8 7.2
% of P50 control budget 100% 120% 111%
Schedule over run (months) - 32 21
Unit 1 ISD date November 2019 July 2022 August 2021
1. As at March 2016. 2. Original cont./reserves of $0.7B for project costs already partially allocated to contracts – $0.3B remaining. Assumed will be used up completely for overruns 3. Includes
compounding effect due to schedule delay + additional interest on incremental project spend.
Note: Cost over run in fixed price, milestone based contracts (mainly equipment supply & install) reduced from previous phase due to greater certainty on risks (e.g. GGH contracts >50% complete,
better SPI=0.94 vs 0.7 from previous phase on T&G, etc)
Source: MH control budget, CEF 2015, BCG analysis
Potential ~$250M
benefit from
mitigations and
avoided interest
33
Copyright © 2016 by The Boston Consulting Group, Inc. All rights reserved.
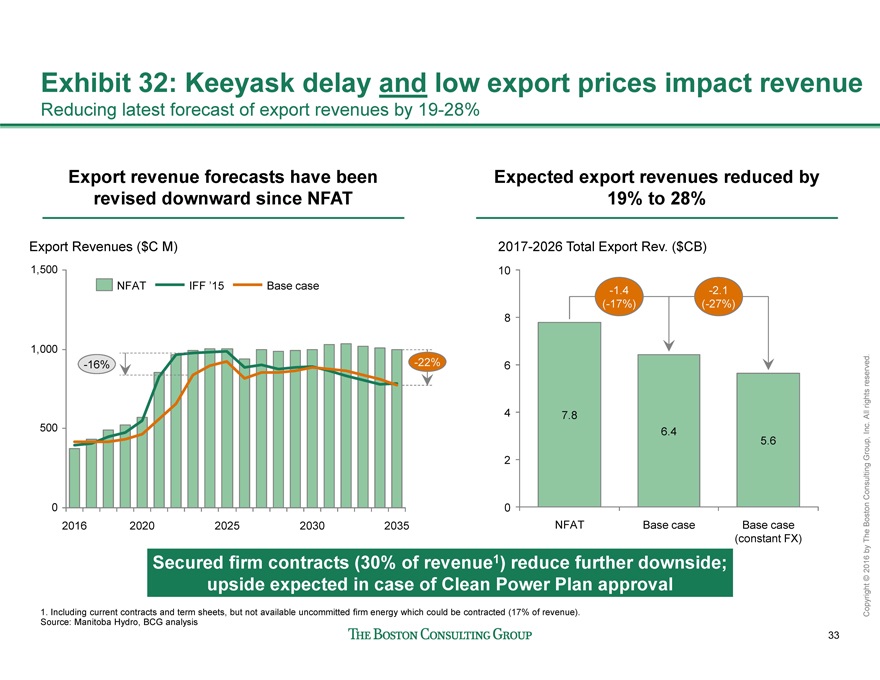
Exhibit 32: Keeyask delay and low export prices impact revenue
Reducing latest forecast of export revenues by 19-28%
Export revenue forecasts have been
revised downward since NFAT
Expected export revenues reduced by
19% to 28%
0
500
1,000
1,500
2025 2030 2035
Export Revenues ($C M)
2016 2020
-16% -22% 6
8
10
4
2
0
2017-2026 Total Export Rev. ($CB)
Base case
5.6
-1.4
(-17%)
Base case
(constant FX)
-2.1
(-27%)
6.4
7.8
NFAT
NFAT IFF ’15 Base case
1. Including current contracts and term sheets, but not available uncommitted firm energy which could be contracted (17% of revenue).
Source: Manitoba Hydro, BCG analysis
Secured firm contracts (30% of revenue1) reduce further downside;
upside expected in case of Clean Power Plan approval
34
Copyright © 2016 by The Boston Consulting Group, Inc. All rights reserved.
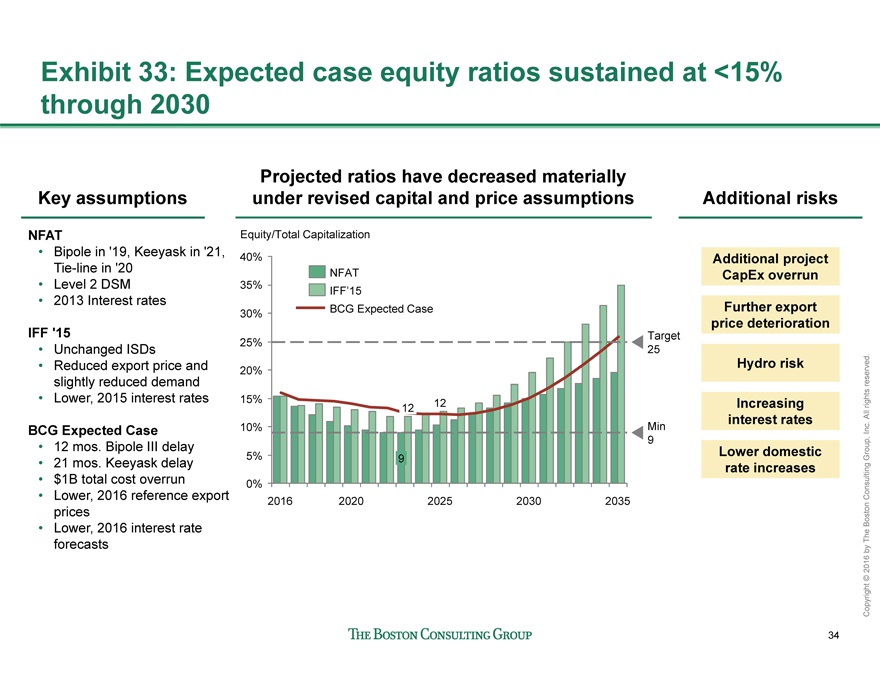
Exhibit 33: Expected case equity ratios sustained at <15%
through 2030
35%
40%
0%
5%
10%
20%
15%
25%
30%
Equity/Total Capitalization
Target
25
Min
9
12
2025 2030 2035
9
2016
12
2020
Projected ratios have decreased materially
under revised capital and price assumptions
IFF’15
NFAT
BCG Expected Case
Key assumptions Additional risks
NFAT
• Bipole in ‘19, Keeyask in ‘21,
Tie-line in ‘20
• Level 2 DSM
• 2013 Interest rates
IFF ‘15
• Unchanged ISDs
• Reduced export price and
slightly reduced demand
• Lower, 2015 interest rates
BCG Expected Case
• 12 mos. Bipole III delay
• 21 mos. Keeyask delay
• $1B total cost overrun
• Lower, 2016 reference export
prices
• Lower, 2016 interest rate
forecasts
Additional project
CapEx overrun
Increasing
interest rates
Lower domestic
rate increases
Hydro risk
Further export
price deterioration
35
Copyright © 2016 by The Boston Consulting Group, Inc. All rights reserved.
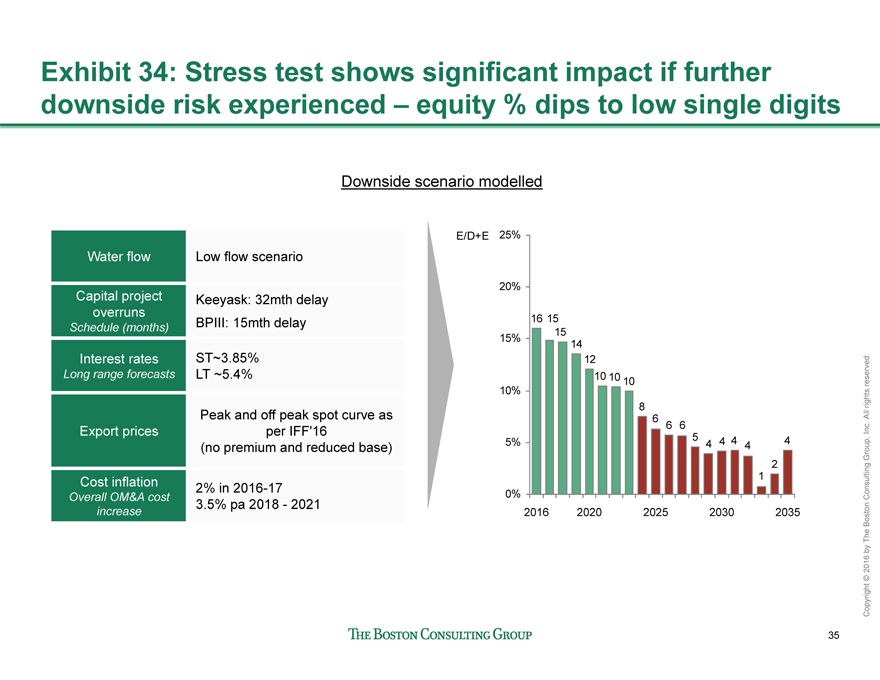
Exhibit 34: Stress test shows significant impact if further
downside risk experienced – equity % dips to low single digits
4
2
1
4 4 4 4 5
6 6 6
8
10 10 10
12
14
15
16 15
0%
5%
10%
15%
20%
E/D+E 25%
2016 2020 2025 2030 2035
Downside scenario modelled
Water flow Low flow scenario
Capital project
overruns
Schedule (months)
Keeyask: 32mth delay
BPIII: 15mth delay
Interest rates
Long range forecasts
ST~3.85%
LT ~5.4%
Export prices
Peak and off peak spot curve as
per IFF’16
(no premium and reduced base)
Cost inflation
Overall OM&A cost
increase
2% in 2016-17
3.5% pa 2018 – 2021
36
Copyright © 2016 by The Boston Consulting Group, Inc. All rights reserved.
Exhibit 35: Can the projects be stopped / paused?
Bipole III and Keeyask are already well advanced in their construction with $5B already sunk
• Bipole III $2.5B (53%) spent of $4.7B control budget
• Keeyask with $2.5B (39%) of $6.5B control budget spent, including completion of milestones that prevent contractual cancellation
Cancelling Bipole III and Keeyask would bring total spend up to ~$7B
• In addition to sunk costs, Bipole III and Keeyask would both incur cancellation costs (e.g., breakage, remediation) of ~$1B each
• Decision to just cancel (or reroute) Bipole III would strand Keeyask, making it uneconomic and likely trigger cancellation
• Implication of cancelling both projects is ~$7B capital spent without completion of any functioning assets
Economics remain in favour of continuing both projects when compared to alternatives
• ~$3.2B cost to complete Bipole III West clearly more favourable vs. ~$4.5B rerouting costs of Bipole III East
– Construction cost of Bipole III East ~$3.0-3.5B on top of ~$1B Bipole III West cancellation costs
• $4.7B cost to complete Keeyask yields an NPV $3-5B more favourable vs. switching to gas option
– Gas option with incremental $11.9B spend (including cancellation and capitalized cost of gas supply)
Further, several strategic risks to consider for stopping or pausing Keeyask
• Considerable trust and relationship damage with four First Nations partners likely to impede any future Hydro project
• Market risk of inability to supply MISO plus requirement to add domestic reserve
• Direct GDP impact of ~0.5%, particularly impacting First Nations communities
37
Copyright © 2016 by The Boston Consulting Group, Inc. All rights reserved.
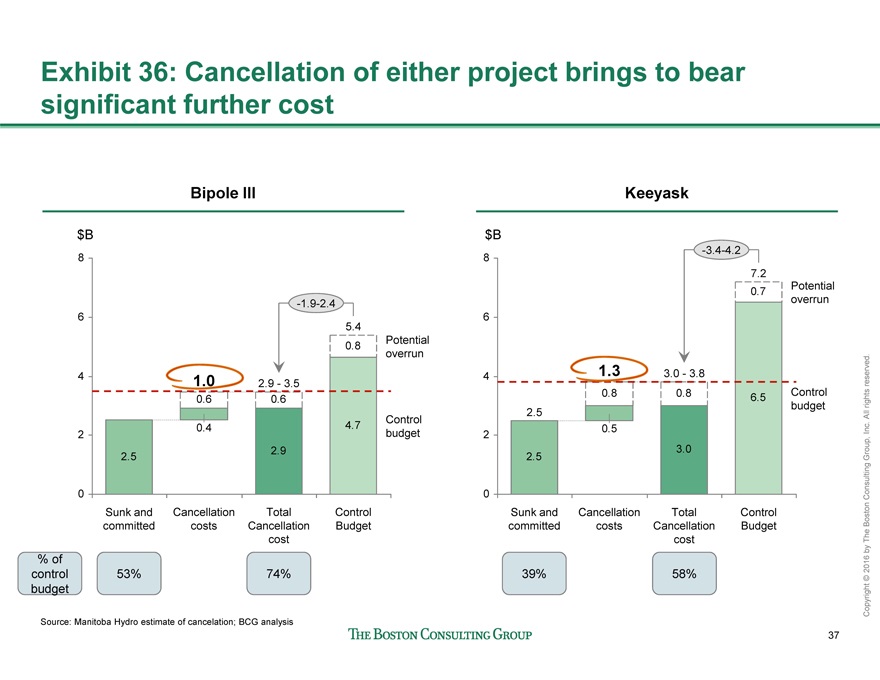
2.5 2.9
4.7
0.6 0.6
0.8
0.4
0
2
4
6
8
$B
-1.9-2.4
Control
budget
Potential
overrun
Control
Budget
5.4
Total
Cancellation
cost
2.9 - 3.5
Cancellation
costs
1.0
Sunk and
committed
$B
Source: Manitoba Hydro estimate of cancelation; BCG analysis
Bipole III Keeyask
Exhibit 36: Cancellation of either project brings to bear
significant further cost
53% 74% 39% 58%
% of
control
budget
2.5
3.0
0.8 0.8 6.5
0.7
0.5
0
2
4
6
8 -3.4-4.2
Control
budget
Potential
overrun
Control
Budget
7.2
Total
Cancellation
cost
3.0 - 3.8
Cancellation
costs
1.3
Sunk and
committed
2.5
38
Copyright © 2016 by The Boston Consulting Group, Inc. All rights reserved.
Source: Manitoba Hydro estimate of cancelation; BCG analysis
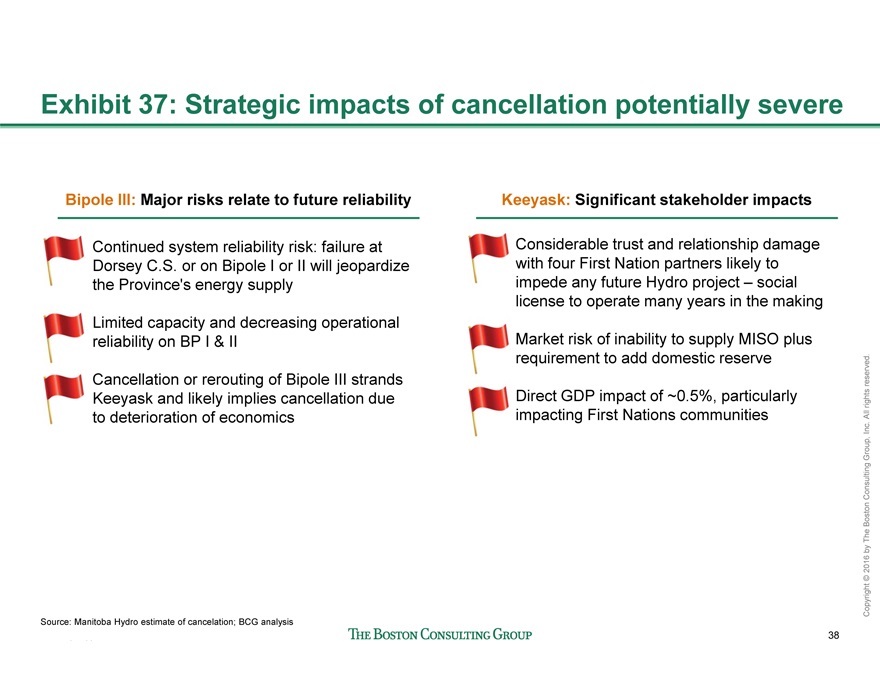
Bipole III: Major risks relate to future reliability Keeyask: Significant stakeholder impacts
• Continued system reliability risk: failure at
Dorsey C.S. or on Bipole I or II will jeopardize
the Province’s energy supply
• Limited capacity and decreasing operational
reliability on BP I & II
• Cancellation or rerouting of Bipole III strands
Keeyask and likely implies cancellation due
to deterioration of economics
• Considerable trust and relationship damage
with four First Nation partners likely to
impede any future Hydro project – social
license to operate many years in the making
• Market risk of inability to supply MISO plus
requirement to add domestic reserve
• Direct GDP impact of ~0.5%, particularly
impacting First Nations communities
Exhibit 37: Strategic impacts of cancellation potentially severe
39
Copyright © 2016 by The Boston Consulting Group, Inc. All rights reserved.
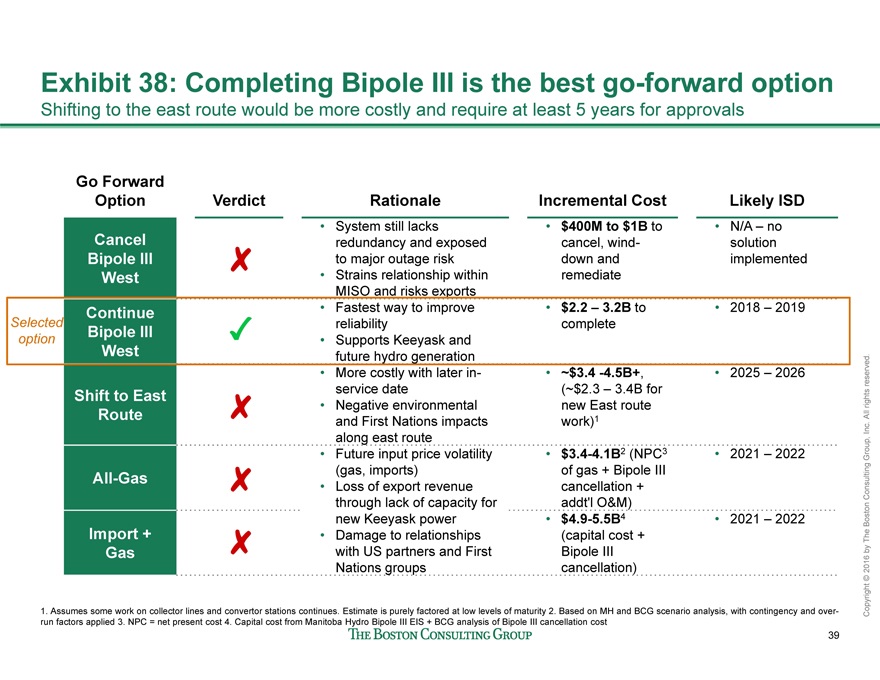
Exhibit 38: Completing Bipole III is the best go-forward option
Shifting to the east route would be more costly and require at least 5 years for approvals
Go Forward
Option Verdict Rationale Incremental Cost Likely ISD
Cancel
Bipole III
West
• System still lacks
redundancy and exposed
to major outage risk
• Strains relationship within
MISO and risks exports
• $400M to $1B to
cancel, winddown
and
remediate
• N/A – no
solution
implemented
Continue
Bipole III
West
• Fastest way to improve
reliability
• Supports Keeyask and
future hydro generation
• $2.2 – 3.2B to
complete
• 2018 – 2019
Shift to East
Route
• More costly with later inservice
date
• Negative environmental
and First Nations impacts
along east route
• ~$3.4 -4.5B+,
(~$2.3 – 3.4B for
new East route
work)1
• 2025 – 2026
All-Gas
• Future input price volatility
(gas, imports)
• Loss of export revenue
through lack of capacity for
new Keeyask power
• Damage to relationships
with US partners and First
Nations groups
• $3.4-4.1B2 (NPC3
of gas + Bipole III
cancellation +
addt’l O&M)
• 2021 – 2022
Import +
Gas
• $4.9-5.5B4
(capital cost +
Bipole III
cancellation)
• 2021 – 2022
Selected
option
1. Assumes some work on collector lines and convertor stations continues. Estimate is purely factored at low levels of maturity 2. Based on MH and BCG scenario analysis, with contingency and overrun
factors applied 3. NPC = net present cost 4. Capital cost from Manitoba Hydro Bipole III EIS + BCG analysis of Bipole III cancellation cost
40
Copyright © 2016 by The Boston Consulting Group, Inc. All rights reserved.
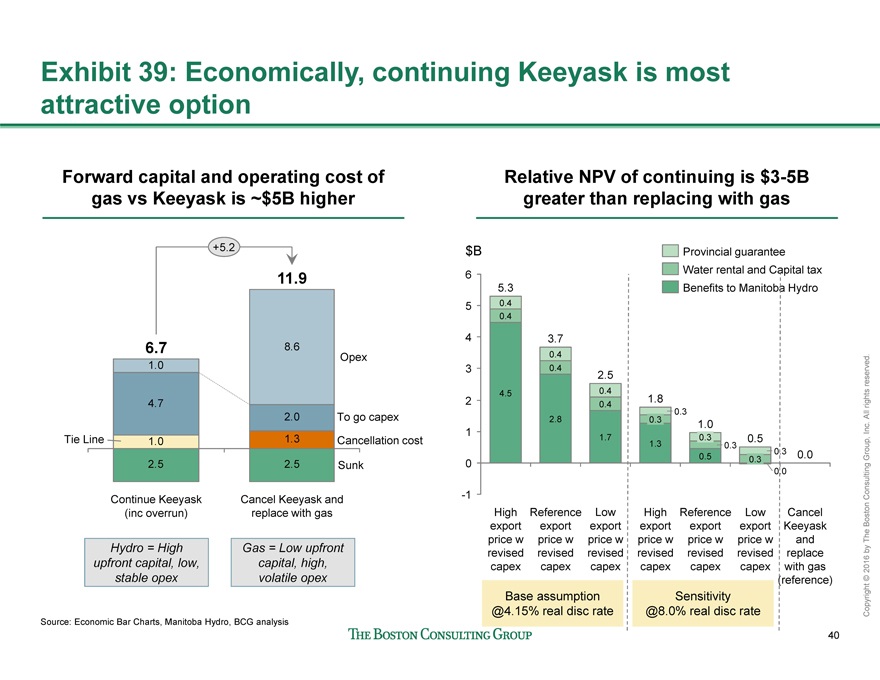
6
-1
3
1
5
4
2
0
0.0
5.3
4.5
0.4
0.4
0.0
Low
export
price w
revised
capex
2.5
1.7
0.4
0.4
Reference
export
price w
revised
capex
3.7
2.8
0.4
0.4
High
export
price w
revised
capex
1.3
1.8
$B
0.3
0.3
Low
export
price w
revised
capex
0.5
0.3
0.3
0.3 1.0
High
export
price w
revised
capex
Reference
export
price w
revised
capex
0.3
0.5
Cancel
Keeyask
and
replace
with gas
(reference)
Exhibit 39: Economically, continuing Keeyask is most
attractive option
2.5 2.5
4.7
2.0
1.0
8.6
1.0 1.3
Continue Keeyask
(inc overrun)
6.7
+5.2
Cancel Keeyask and
replace with gas
11.9
Forward capital and operating cost of
gas vs Keeyask is ~$5B higher
Relative NPV of continuing is $3-5B
greater than replacing with gas
Benefits to Manitoba Hydro
Water rental and Capital tax
Provincial guarantee
Source: Economic Bar Charts, Manitoba Hydro, BCG analysis
Opex
To go capex
Sunk
Tie Line Cancellation cost
Hydro = High
upfront capital, low,
stable opex
Gas = Low upfront
capital, high,
volatile opex
Base assumption
@4.15% real disc rate
Sensitivity
@8.0% real disc rate