Exhibit 99.1
MANITOBA
2016/17
Second Quarter Report
Honourable Cameron Friesen
Minister of Finance

| | |
SECOND QUARTER REPORT | | APRIL TO SEPTEMBER 2016 |
SUMMARY
Budget 2016 provided the financial overview of the Government Reporting Entity (GRE), which includes core government and government business enterprises (such as Manitoba Hydro and Manitoba Public Insurance), health authorities, social service authorities, school divisions, etc.
Manitoba’s summary budget aligns with the accounting standards set by the Public Sector Accounting Board (PSAB) and fully reflects Generally Accepted Accounting Principles (GAAP).
The financial information in this report is presented in the same format as the budget.
The summary forecast for fiscal year 2016/17 is a net loss $(1,004) million, a variance of $(93) million from the net loss of $(911) million included in Budget 2016, primarily related to lower net income of government business enterprises and expenditure pressures in Education, Health and Families. These pressures are partially offset by under-expenditures in other sectors.
GOVERNMENT REPORTING ENTITY
Millions of Dollars
| | | | | | | | | | | | |
| | | 2016/17 Summary | |
| UNAUDITED | | | Forecast | | | | Budget | | | | Variance | |
Revenue | | | | | | | | | | | | |
Income Taxes | | | 3,868 | | | | 3,868 | | | | – | |
Other Taxes | | | 4,384 | | | | 4,136 | | | | 248 | * |
Fees and Other Revenue | | | 2,239 | | | | 2,199 | | | | 40 | |
Federal Transfers | | | 4,110 | | | | 4,108 | | | | 2 | |
Net Income of Government Business Enterprises | | | 578 | | | | 674 | | | | (96 | ) |
Sinking Funds and Other Earnings | | | 253 | | | | 245 | | | | 8 | |
Total Revenue | | | 15,432 | | | | 15,230 | | | | 202 | |
Expenditure | | | | | | | | | | | | |
Health | | | 6,501 | | | | 6,497 | | | | 4 | |
Education | | | 4,338 | | | | 4,065 | | | | 273 | * |
Families | | | 2,041 | | | | 2,039 | | | | 2 | |
Community, Economic and Resource Development | | | 1,494 | | | | 1,512 | | | | (18 | ) |
Justice and Other Expenditures | | | 1,264 | | | | 1,305 | | | | (41 | ) |
Debt Servicing Costs | | | 873 | | | | 873 | | | | – | |
Total Expenditure | | | 16,511 | | | | 16,291 | | | | 220 | |
In-Year Adjustment/Lapse | | | (75 | ) | | | (150 | ) | | | 75 | |
NET INCOME (LOSS) | | | (1,004 | ) | | | (911 | ) | | | (93 | ) |
| * | Other Taxes and Education expenditures reflect offsetting increases of $260 million in revenue and expenditures due to restatement of the Education Property Tax Credit to correct an accounting error in deriving the budgeted amounts, resulting in no effect on the net loss. |
- 1 -
| | |
SECOND QUARTER REPORT | | APRIL TO SEPTEMBER 2016 |
CORE GOVERNMENT OUTLOOK
The core government outlook provides information on the core government activities – the revenue and expenditure of government departments that are under the direct control of the Legislative Assembly. These are where the day-to-day decisions are made that ultimately determine the success of the government strategies, plans and programs.
The core government forecast for fiscal year 2016/17 is a net loss $(930) million, a variance of $(40) million from the net loss of $(890) million included in Budget 2016, primarily as a result of lower Retail Sales Tax, Tobacco Tax, and Levy for Health and Education, reflecting projections lower than budget.
Federal revenues associated with cost shared infrastructure projects are also anticipated to be lower than budget as a result of timing.
Expenditure increases in Families, primarily due to pressures in Employment, Income and Rental Assistance programs, are offset by reductions in Health largely related to the ongoing review and prioritization of capital projects.
As part of the fiscal performance and health sustainability reviews currently underway, program expenditures throughout government continue to be assessed for opportunities to reduce the growth of core government spending and improve the effectiveness with which government delivers results for Manitobans.
CORE GOVERNMENT
Millions of Dollars
| | | | | | | | | | | | |
| | | 2016/17 Core Government | |
| UNAUDITED | | | Forecast | | | | Budget | | | | Variance | |
Revenue | | | | | | | | | | | | |
Income Taxes | | | 3,868 | | | | 3,868 | | | | – | |
Other Taxes | | | 3,698 | | | | 3,717 | | | | (19 | ) |
Fees and Other Revenue | | | 573 | | | | 562 | | | | 11 | |
Federal Transfers | | | 3,825 | | | | 3,845 | | | | (20 | ) |
Net Income of Government Business Enterprises | | | 586 | | | | 586 | | | | – | |
Sinking Funds and Other Earnings | | | – | | | | – | | | | – | |
Total Revenue | | | 12,550 | | | | 12,578 | | | | (28 | ) |
Expenditure | | | | | | | | | | | | |
Health | | | 5,941 | | | | 5,990 | | | | (49 | ) |
Education | | | 2,743 | | | | 2,738 | | | | 5 | |
Families | | | 1,951 | | | | 1,930 | | | | 21 | |
Community, Economic and Resource Development | | | 1,543 | | | | 1,536 | | | | 7 | |
Justice and Other Expenditures | | | 1,107 | | | | 1,114 | | | | (7 | ) |
Debt Servicing Costs | | | 230 | | | | 230 | | | | – | |
Total Expenditure | | | 13,515 | | | | 13,538 | | | | (23 | ) |
In-Year Adjustment/Lapse | | | (35 | ) | | | (70 | ) | | | 35 | |
NET INCOME (LOSS) | | | (930 | ) | | | (890 | ) | | | (40 | ) |
- 2 -
| | |
SECOND QUARTER REPORT | | APRIL TO SEPTEMBER 2016 |
QUARTERLY FINANCIAL RESULTS
The unaudited net result of the core government for the first six months of the fiscal year is a loss of $(190) million.
The six-month revenue variance of $(22) million reflects lower than anticipated Retail Sales Tax, Levy for Health and Education, and Tobacco Tax.
The six-month expenditure variance of $(73) million is the result of timing of expenditures in various departments.
The six-month net result of $(190) million represents a variance of $(177) million from the prior year. Revenue is up $163 million year-over-year, offset by an increase in expenditures of $340 million.
The year-over-year increase in revenue is primarily due to increases in Individual Income Tax and Federal Transfers, as well as higher Corporations Taxes as a result of timing of remittances.
The year-over-year increase in expenditures reflects increased spending in 2016/17 related to Health, Families and Education.
CORE GOVERNMENT OPERATING STATEMENT
Millions of Dollars
| | | | | | | | | | | | |
| | | Year-to-Date to September 30 | |
| UNAUDITED | | | Actual | | | | Estimated | | | | Variance | |
Revenue | | | | | | | | | | | | |
Income Taxes | | | 2,015 | | | | 2,014 | | | | 1 | |
Other Taxes | | | 1,870 | | | | 1,895 | | | | (25 | ) |
Fees and Other Revenue | | | 263 | | | | 259 | | | | 4 | |
Federal Transfers | | | 1,829 | | | | 1,825 | | | | 4 | |
Net Income of Government Business Enterprises | | | 297 | | | | 303 | | | | (6 | ) |
Sinking Funds and Other Earnings | | | – | | | | – | | | | – | |
Total Revenue | | | 6,274 | | | | 6,296 | | | | (22 | ) |
Expenditure | | | | | | | | | | | | |
Health | | | 2,992 | | | | 3,028 | | | | (36 | ) |
Education | | | 1,370 | | | | 1,383 | | | | (13 | ) |
Families | | | 953 | | | | 960 | | | | (7 | ) |
Community, Economic and Resource Development | | | 635 | | | | 640 | | | | (5 | ) |
Justice and Other Expenditures | | | 482 | | | | 495 | | | | (13 | ) |
Debt Servicing Costs | | | 32 | | | | 31 | | | | 1 | |
Total Expenditure | | | 6,464 | | | | 6,537 | | | | (73 | ) |
Net Result | | | (190 | ) | | | (241 | ) | | | 51 | |
- 3 -
| | |
SECOND QUARTER REPORT | | APRIL TO SEPTEMBER 2016 |
STRATEGIC INFRASTRUCTURE INVESTMENT
The Manitoba government is committed to spending at least $1 billion on strategic infrastructure in 2016/17 – roads and bridges, flood protection, hospitals, schools, universities and colleges, as well as municipal projects and other infrastructure.
As of the second quarter, strategic infrastructure investment is forecast to exceed $1.7 billion in 2016/17.
It is important to ensure that investment decisions are financially sustainable over the long term and are assessed to provide the best value for money.
In order to ensure value for money while meeting government’s commitments, all infrastructure investments continue to be scrutinized.
STRATEGIC INFRASTRUCTURE
Millions of Dollars
| | | | | | | | | | | | | | |
| | | | | | | | | 2016/17 | | | | | |
| Core Government Infrastructure | | | | | Forecast | | | | Budget | | | | Variance | |
Roads, Highways, Bridges, Flood Protection and Parks | | | | | | | | | | | | |
Highways and Bridges | | | | | 542 | | | | 542 | | | | – | |
Water-Related Capital | | | | | 42 | | | | 45 | | | | (3 | ) |
Parks, Cottages and Camping | | | | | 9 | | | | 12 | | | | (3 | ) |
| | | | | | | | | | | | | | |
| | Subtotal | | | 593 | | | | 599 | | | | (6 | ) |
| | | | | | | | | | | | | | |
Capital Grants, Maintenance and Preservation | | | | | | | | | | | | | | |
Building Manitoba Fund* – Capital Grants | | | | | 284 | | | | 284 | | | | – | |
Maintenance and Preservation – Highways | | | | | 143 | | | | 144 | | | | (1 | ) |
Maintenance and Preservation – Water | | | | | 12 | | | | 10 | | | | 2 | |
| | | | | | | | | | | | | | |
| | Subtotal | | | 439 | | | | 438 | | | | 1 | |
| | | | | | | | | | | | | | |
Core Government Infrastructure Total | | | | | 1,032 | | | | 1,037 | | | | (5 | ) |
| | | | | | | | | | | | | | |
Other Provincial Infrastructure | | | | | | | | | | | | | | |
Health | | | | | 369 | | | | 442 | | | | (73 | ) |
Education | | | | | 161 | | | | 241 | | | | (80 | ) |
Housing | | | | | 137 | | | | 120 | | | | 17 | |
Northern Affairs Communities | | | | | 8 | | | | 15 | | | | (7 | ) |
| | | | | | | | | | | | | | |
Other Provincial Infrastructure Total | | | | | 675 | | | | 818 | | | | (143 | ) |
| | | | | | | | | | | | | | |
Total Strategic Infrastructure | | | | | 1,707 | | | | 1,855 | | | | (148 | ) |
| | | | | | | | | | | | | | |
| * | Net of Transit Operating |
- 4 -
| | |
SECOND QUARTER REPORT | | APRIL TO SEPTEMBER 2016 |
BORROWINGS AND SUMMARY NET DEBT
At the end of the second quarter, Manitoba’s borrowing requirement has been revised to $6.3 billion, a reduction of $0.2 billion from Budget 2016, primarily due to reduced requirements for Manitoba Hydro, health facilities, capital and general purpose borrowings.
Borrowings are used to finance capital related projects, and to finance the expenditures of priority government services in excess of generated income.
While these investments underpin and support Manitoba’s economic performance, Manitoba’s Government has committed to reduce the reliance on borrowings to ensure that the use of the debt is within reasonable and predictable limits.
Net debt to GDP is currently forecast at 34.2% compared to 33.8% included in Budget 2016.
CHANGE IN SUMMARY NET DEBT
Millions of Dollars
| | | | | | | | |
| | | 2016/17 | |
| | | Forecast | | | Budget | |
2015/16 Summary Net Debt | | | 21,433 | | | | 21,395 | |
Net Investment in Tangible Capital Assets | | | | | | | | |
Core Government | | | 421 | | | | 445 | |
Other Reporting Entities | | | 384 | | | | 398 | |
| | | | | | | | |
| | | 805 | | | | 843 | |
Plus: Projected (Income) Loss for the Year | | | | | | | | |
Core Government | | | 930 | | | | 890 | |
Other Reporting Entities | | | 74 | | | | 21 | |
| | | | | | | | |
| | | 1,004 | | | | 911 | |
| | | | | | | | |
Change in Net Debt | | | 1,809 | | | | 1,754 | |
| | | | | | | | |
Summary Net Debt | | | 23,242 | | | | 23,149 | |
| | | | | | | | |
- 5 -
| | |
SECOND QUARTER REPORT | | APRIL TO SEPTEMBER 2016 |
ECONOMIC REVIEW AND OUTLOOK
Overview
Slower than expected economic growth in the U.S., Canada, Japan and many European countries combined with the U.K.’s vote to exit the European Union have all contributed to a weaker economic outlook for advanced economies overall. These developments, particularly in the U.S. and Canada, are reflected in a downward adjustment to the Budget 2016 economic growth projections for Manitoba. However, Manitoba’s stable and diverse economy continues to outperform Canada and most other provinces.
According to the Manitoba Finance Survey of Economic Forecasts, Manitoba’s real GDP is expected to grow by 2.0% in 2016 and 2017.
The outlook for Manitoba’s real GDP growth in 2016 is 0.2% lower than what was estimated in the May 31, 2016 Budget. For 2017, the forecast is 0.4% below the Budget estimate.
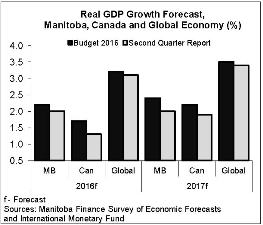
Manitoba’s projected growth in 2016 and 2017 is third best among provinces and above the national average. Since Budget 2016, the Canadian real
GDP outlook is reduced by 0.4% to 1.3% in 2016 and reduced by 0.3% to 1.9% in 2017.
According to the International Monetary Fund (IMF), subdued prospects for advanced economies can be attributed to many factors including, high debt, financial sector vulnerabilities, low investment, an aging population, low productivity, and political uncertainty following the U.K’s vote to exit the European Union.
More recently, the election of a new administration in the U.S. has generated considerable uncertainty over major economic policies such as domestic infrastructure investments, immigration and international trade.
Supporting global growth will depend on improving economic conditions in emerging markets and developing economies. China and India are expected to benefit from simulative policy measures as well as low commodity prices for their imports.
The IMF lowered the U.S. real GDP outlook by 0.6% to 1.6% in 2016. Still expected to lead the G7 nations in growth, U.S. growth forecast for 2017 was lowered by 0.3% to 2.2%.
Growth in emerging markets and developing economies is expected to improve to 4.2% in 2016 and to 4.6% in 2017, up from 4.0% in 2015.
Manitoba Economy
Manitoba’s economy is resilient and diversified with a broad mix of medium, yet similar, sized industries. Provincial exports are diversified in both composition and destination. The province has a consistent long-term profile of private sector capital investment and strong population growth.
These characteristics provide stable economic growth, lower volatility than most other provinces, and a labour market that is
- 6 -
| | |
SECOND QUARTER REPORT | | APRIL TO SEPTEMBER 2016 |
characterized by a high participation rate and a low unemployment rate.
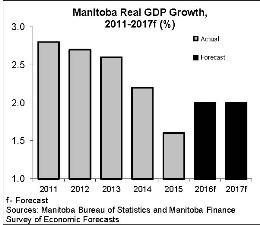
Following the oil price collapse in 2014, economic momentum slowed in Manitoba, but is expected to improve this year to a moderate 2.0%, which is down from earlier forecasts.
A depreciated Canadian dollar relative to the U.S. currency has failed to provide the expected boost for manufacturing sales and corresponding exports in Canada and in Manitoba.
Employment level in Manitoba is down slightly from the record set in 2015, while employment incomes are growing at a slower pace compared to last year.
At 22,000 persons, Manitoba recorded the largest gain in population over a 12 month period ending in July 2016. Retail sales have significantly strengthened this year.
Manitoba’s Key Economic Indicators
The annual and quarterly economic statistics in the following section are on a calendar year basis.
Inflation Rate
Manitoba’s inflation rate is averaging 1.4% in 2016, up marginally from 1.2% in 2015.
In 2016, clothing and footwear, food and health and personal care prices are increasing below the average rate, while alcohol and tobacco, transportation, shelter, and household operations prices are increasing above the average rate.
Labour Market
Manitoba’s employment level is moderating near a record level in 2016, but is lower compared to the record set in 2015.
On a year-to-date basis, employment level has averaged 633,400, down by 3,100 jobs from the same period last year. The province is currently averaging 511,100 full-time and 122,300 part-time workers.
Manitoba’s unemployment rate is averaging 6.1% in 2016, tied with the lowest among provinces and below Canada’s at 7.0%.
Labour income has increased by 2.2% in the first nine months of 2016, below the 3.3% growth in 2015 and below the 2.4% increase in Canada.
Average weekly earnings in Manitoba are up 1.3% in the first nine months of 2016 compared to the same period last year, fourth among provinces and above Canada’s 0.4%.
Retail Sales
There are gains from health and personal care stores, and motor vehicle dealers have driven up retail sales by 5.2% in the first nine months of 2016, the third-highest increase among provinces and well above the 3.7% growth in Canada.
- 7 -
| | |
SECOND QUARTER REPORT | | APRIL TO SEPTEMBER 2016 |
All retail categories are showing positive gains in 2016. Department stores, sporting goods, music and book stores, general merchandise stores, and furniture and furnishing store sales are among the other leading categories. With fuel prices remaining relatively stable, gasoline station retail sales have improved after a sharp decline in 2015.
Manufacturing
Since the sharp decline in oil and other commodity prices, manufacturing sales in Manitoba have been moderating. Total sales fell by 1.5% in 2015, the first decline since 2010 and have only increased by 0.7% through the first nine months of 2016.
Manufacturing sales are generally lower for chemicals, furniture and transportation equipment in 2016. Sales, however, remain strong for wood products and processed food products.
Manufacturing sales in Manitoba have averaged $17 billion on a 12-month moving average basis in September 2016.
Capital Investment
Investment in non-residential building construction turned around mid-year increasing by 5.9% in the second quarter and by 6.7% in the third quarter of 2016. This follows four consecutive quarterly declines.
Through the first three quarters of 2016, non-residential investment spending is down by 11.6%. Industrial sector non-residential investment spending has increased, while commercial sector spending and institutional and governmental investment are down during the same period. The decline in non-residential investment is reflected in the projected decrease in retail sales tax revenues.
Housing Market
Reflecting a balanced market for single detached houses, the declining trend in new construction was reversed in the second and third quarter of 2016, with more units being built this year compared to last year. The construction of multiple units (semi-detached, row-housing and apartment/ condominiums) continues to decline in 2016.
On a year-to-date basis, total housing starts are down by 8.3%, with a 10.7% increase in single detached units being offset by a 21.4% decline in multiple units.
MLS® sales for the Winnipeg region show an improvement in the number of transactions in 2016. On a year-to-date basis, sales are up by 7.0% in the region and are expected to potentially surpass the pre-recession record peak in annual sales from 2007.
International Merchandise Exports
In 2015, overall international exports moderated to 2.2% growth as strong sales to the U.S. were somewhat offset by reduced sales to non-US markets.
In the first ten months of 2016, the revisions to the monthly export sales information now show a 3.0% decline in overall international exports.
Exports are led by wood products, non-metallic mineral products, food products and transportation equipment. Sales are lagging in metal ores, energy products, mineral products, and machinery and equipment.
Due to a sharp decline in international shipments of oil and agricultural commodities, exports to the U.S. are down by 4.6% in 2016, the first decline since 2010.
- 8 -
| | |
SECOND QUARTER REPORT | | APRIL TO SEPTEMBER 2016 |
Among non-U.S. markets, exports are up 2.0% to China, up 11.9% to Japan and up 2.2% to Mexico. Exports to Hong Kong and Germany are down by 38.8% and 38.7%, respectively, in 2016.
Agriculture
For the 2016 crop season, many crop producers changed their crop mix from barley, oats and wheat, to soybeans, corn and peas.
The crop season opened with an early spring and good precipitation levels for seeding. General weather conditions were good through the summer months with some localized crop losses due to extreme rainfall levels and wind conditions.
Production estimates from Statistics Canada indicate a slight decrease in the overall volume of the grain and oilseed harvest. However, the volume was relatively high compared to the 10-year historical average.
Soybean production has expanded significantly in Manitoba, increasing by 22% annually over the past decade. In 2016,
Manitoba set a new record for soybeans by harvesting 27% of the total Canadian output.
Peas (126%), rye (55%) and corn (19%) production was notably up in 2016, while oats (-16.8%), barley (-12.5%), canola (-7.8%) and wheat (-2.9%) production was down.
Commodity prices in agriculture remain under pressure in 2016. Wheat and canola prices have continued to decline in 2016, as grain inventories remain high from increases in global production. The lower value of the Canadian dollar is moderating the impact from low prices.
Lower feed costs and an improved pasture conditions in Texas and other cattle producing states, have increased supply of cattle and thereby lowered prices. Prices are expected to remain low in 2017.
Hog prices are expected to remain relatively stable over the near term as supply and demand conditions are more aligned, following the containment of the Porcine Epidemic Diarrhea virus in the hog sector.
Manitoba Outlook at a Glance
(per cent change unless noted)
| | | | | | | | | | | | |
| | | 2015 | | | 2016f | | | 2017f | |
Gross Domestic Product | | | | | | | | | | | | |
Real | | | 1.6 | | | | 2.0 | | | | 2.0 | |
Nominal | | | 2.7 | | | | 3.0 | | | | 3.9 | |
Employment | | | 1.5 | | | | -0.2 | | | | 0.9 | |
Unemployment Rate | | | 5.6 | | | | 6.0 | | | | 5.9 | |
Consumer Price Index | | | 1.2 | | | | 1.7 | | | | 2.2 | |
Population | | | 1.2 | | | | 1.7 | | | | 1.1 | |
f – Forecast
Sources: Statistics Canada, Manitoba Bureau of Statistics and Manitoba Finance Survey of Economic Forecasts (2016f-2017f)
- 9 -
| | |
SECOND QUARTER REPORT | | APRIL TO SEPTEMBER 2016 |
Appendix I
2016/17 CORE GOVERNMENT REVENUE BY SOURCE
Thousands of Dollars
| | | | | | | | | | | | | | | | | | | | | | | | | | | | |
| | | Year-to-Date to September 30 | | | | | | Full Year | |
| UNAUDITED | | Actual | | | Estimated | | | Variance | | | | | | Forecast | | | Budget1 | | | Variance | |
Income Taxes | | | | | | | | | | | | | | | | | | | | | | | | | | | | |
Individual Income Tax | | | 1,676,686 | | | | 1,676,524 | | | | 162 | | | | | | | | 3,338,761 | | | | 3,338,761 | | | | — | |
Corporation Income Tax | | | 337,860 | | | | 337,421 | | | | 439 | | | | | | | | 529,016 | | | | 529,016 | | | | — | |
| | | | | | | | | | | | | | | | | | | | | | | | | | | | |
Subtotal: Income Taxes | | | 2,014,546 | | | | 2,013,945 | | | | 601 | | | | | | | | 3,867,777 | | | | 3,867,777 | | | | — | |
| | | | | | | | | | | | | | | | | | | | | | | | | | | | |
| | | | | | | |
Other Taxes | | | | | | | | | | | | | | | | | | | | | | | | | | | | |
Corporations Taxes | | | 127,105 | | | | 127,653 | | | | (548 | ) | | | | | | | 249,047 | | | | 249,047 | | | | — | |
Fuel Taxes | | | 167,373 | | | | 164,736 | | | | 2,637 | | | | | | | | 321,150 | | | | 321,150 | | | | — | |
Land Transfer Tax | | | 50,069 | | | | 49,235 | | | | 834 | | | | | | | | 83,736 | | | | 83,736 | | | | — | |
Levy for Health and Education | | | 222,382 | | | | 223,927 | | | | (1,545 | ) | | | | | | | 467,614 | | | | 472,614 | | | | (5,000 | ) |
Retail Sales Tax | | | 1,164,737 | | | | 1,184,844 | | | | (20,107 | ) | | | | | | | 2,315,330 | | | | 2,325,330 | | | | (10,000 | ) |
Tobacco Tax | | | 133,122 | | | | 140,087 | | | | (6,965 | ) | | | | | | | 251,123 | | | | 256,123 | | | | (5,000 | ) |
Other Taxes | | | 4,987 | | | | 4,424 | | | | 563 | | | | | | | | 10,392 | | | | 9,591 | | | | 801 | |
| | | | | | | | | | | | | | | | | | | | | | | | | | | | |
Subtotal: Other Taxes | | | 1,869,775 | | | | 1,894,906 | | | | (25,131 | ) | | | | | | | 3,698,392 | | | | 3,717,591 | | | | (19,199 | ) |
| | | | | | | | | | | | | | | | | | | | | | | | | | | | |
| | | | | | | |
Fees and Other Revenue | | | | | | | | | | | | | | | | | | | | | | | | | | | | |
Fines and Costs and Other Legal | | | 27,922 | | | | 27,796 | | | | 126 | | | | | | | | 54,578 | | | | 53,574 | | | | 1,004 | |
Minerals and Petroleum | | | 5,808 | | | | 5,555 | | | | 253 | | | | | | | | 10,096 | | | | 9,628 | | | | 468 | |
Automobile and Motor Carrier Licences and Fees | | | 81,478 | | | | 77,857 | | | | 3,621 | | | | | | | | 152,270 | | | | 152,270 | | | | — | |
Parks: Forestry and Other Conservation | | | 10,968 | | | | 14,518 | | | | (3,550 | ) | | | | | | | 34,077 | | | | 33,856 | | | | 221 | |
Water Power Rentals | | | 59,459 | | | | 57,894 | | | | 1,565 | | | | | | | | 112,587 | | | | 107,722 | | | | 4,865 | |
Service Fees and Other Miscellaneous Charges | | | 63,105 | | | | 61,464 | | | | 1,641 | | | | | | | | 185,851 | | | | 181,826 | | | | 4,025 | |
Revenue Sharing from SOAs | | | 13,985 | | | | 14,085 | | | | (100 | ) | | | | | | | 23,170 | | | | 23,170 | | | | — | |
| | | | | | | | | | | | | | | | | | | | | | | | | | | | |
Subtotal: Fees and Other Revenue | | | 262,725 | | | | 259,169 | | | | 3,556 | | | | | | | | 572,629 | | | | 562,046 | | | | 10,583 | |
| | | | | | | | | | | | | | | | | | | | | | | | | | | | |
| | | | | | | |
Federal Transfers | | | | | | | | | | | | | | | | | | | | | | | | | | | | |
Equalization | | | 867,797 | | | | 867,797 | | | | — | | | | | | | | 1,735,600 | | | | 1,735,600 | | | | — | |
Canada Health Transfer (CHT) | | | 651,814 | | | | 651,815 | | | | (1 | ) | | | | | | | 1,306,936 | | | | 1,303,600 | | | | 3,336 | |
Canada Social Transfer (CST) | | | 241,223 | | | | 241,224 | | | | (1 | ) | | | | | | | 483,365 | | | | 482,400 | | | | 965 | |
Shared Cost and Other Transfers | | | 68,421 | | | | 63,681 | | | | 4,740 | | | | | | | | 298,797 | | | | 322,955 | | | | (24,158 | ) |
| | | | | | | | | | | | | | | | | | | | | | | | | | | | |
Subtotal: Federal Transfers | | | 1,829,255 | | | | 1,824,517 | | | | 4,738 | | | | | | | | 3,824,698 | | | | 3,844,555 | | | | (19,857 | ) |
| | | | | | | | | | | | | | | | | | | | | | | | | | | | |
| | | | | | | |
Net Income of Government Business Enterprises (GBEs) | | | | | | | | | | | | | | | | | | | | | | | | | | | | |
Manitoba Liquor and Lotteries Corporation | | | 297,329 | | | | 302,829 | | | | (5,500 | ) | | | | | | | 585,700 | | | | 585,700 | | | | — | |
| | | | | | | | | | | | | | | | | | | | | | | | | | | | |
Total Revenue | | | 6,273,630 | | | | 6,295,366 | | | | (21,736 | ) | | | | | | | 12,549,196 | | | | 12,577,669 | | | | (28,473 | ) |
| | | | | | | | | | | | | | | | | | | | | | | | | | | | |
| 1. | Budget figures are adjusted to include Enabling Appropriations. |
- 10 -
| | |
SECOND QUARTER REPORT | | APRIL TO SEPTEMBER 2016 |
Appendix II
2016/17 CORE GOVERNMENT EXPENDITURE BY SECTOR/DEPARTMENT
Thousands of Dollars
| | | | | | | | | | | | | | | | | | | | | | | | | | | | |
| | | Year-to-Date to September 30 | | | | | | Full Year | |
| UNAUDITED | | Actual | | | Estimated Variance | | | | | | Forecast | | | Budget1 | | | Variance | |
Health | | | | | | | | | | | | | | | | | | | | | | | | | | | | |
Health, Seniors and Active Living | | | 2,992,214 | | | | 3,028,135 | | | | (35,921 | ) | | | | | | | 5,940,748 | | | | 5,989,870 | | | | (49,122 | ) |
| | | | | | | |
Education | | | | | | | | | | | | | | | | | | | | | | | | | | | | |
Education and Training | | | 1,369,924 | | | | 1,383,153 | | | | (13,229 | ) | | | | | | | 2,743,084 | | | | 2,738,200 | | | | 4,884 | |
| | | | | | | |
Families | | | | | | | | | | | | | | | | | | | | | | | | | | | | |
Families | | | 952,683 | | | | 959,650 | | | | (6,967 | ) | | | | | | | 1,950,963 | | | | 1,929,614 | | | | 21,349 | |
| | | | | | | |
Community, Economic and Resource Development | | | | | | | | | | | | | | | | | | | | | | | | | | | | |
Agriculture | | | 32,635 | | | | 33,735 | | | | (1,100 | ) | | | | | | | 182,385 | | | | 180,371 | | | | 2,014 | |
Growth, Enterprise and Trade | | | 40,618 | | | | 46,556 | | | | (5,938 | ) | | | | | | | 93,866 | | | | 88,432 | | | | 5,434 | |
Indigenous and Municipal Relations | | | 175,715 | | | | 178,114 | | | | (2,399 | ) | | | | | | | 497,168 | | | | 498,023 | | | | (855 | ) |
Infrastructure | | | 305,189 | | | | 302,595 | | | | 2,594 | | | | | | | | 625,873 | | | | 625,873 | | | | – | |
Sustainable Development | | | 80,276 | | | | 78,906 | | | | 1,370 | | | | | | | | 143,547 | | | | 143,638 | | | | (91 | ) |
| | | | | | | | | | | | | | | | | | | | | | | | | | | | |
Total Community, Economic and Resource Development | | | 634,433 | | | | 639,906 | | | | (5,473 | ) | | | | | | | 1,542,839 | | | | 1,536,337 | | | | 6,502 | |
| | | | | | | | | | | | | | | | | | | | | | | | | | | | |
| | | | | | | |
Justice and Other Expenditures | | | | | | | | | | | | | | | | | | | | | | | | | | | | |
Legislative Assembly | | | 29,811 | | | | 29,816 | | | | (5 | ) | | | | | | | 57,188 | | | | 57,707 | | | | (519 | ) |
Executive Council | | | 4,333 | | | | 3,770 | | | | 563 | | | | | | | | 6,164 | | | | 6,164 | | | | – | |
Civil Service Commission | | | 11,464 | | | | 11,804 | | | | (340 | ) | | | | | | | 21,677 | | | | 21,677 | | | | – | |
Employee Pensions and Other Costs | | | (2,254 | ) | | | (1,787 | ) | | | (467 | ) | | | | | | | 17,735 | | | | 17,735 | | | | – | |
Finance | | | 126,745 | | | | 130,379 | | | | (3,634 | ) | | | | | | | 278,597 | | | | 279,334 | | | | (737 | ) |
Justice | | | 258,841 | | | | 263,574 | | | | (4,733 | ) | | | | | | | 595,448 | | | | 590,849 | | | | 4,599 | |
Sport, Culture and Heritage | | | 36,260 | | | | 38,254 | | | | (1,994 | ) | | | | | | | 67,609 | | | | 67,609 | | | | – | |
Enabling Appropriations | | | — | | | | — | | | | — | | | | | | | | 15,834 | | | | 15,834 | | | | – | |
Other Appropriations | | | 17,046 | | | | 19,594 | | | | (2,548 | ) | | | | | | | 47,223 | | | | 56,700 | | | | (9,477 | ) |
| | | | | | | | | | | | | | | | | | | | | | | | | | | | |
Total Justice and Other Expenditures | | | 482,246 | | | | 495,404 | | | | (13,158 | ) | | | | | | | 1,107,475 | | | | 1,113,609 | | | | (6,134 | ) |
| | | | | | | | | | | | | | | | | | | | | | | | | | | | |
Debt Servicing Costs | | | 32,237 | | | | 31,052 | | | | 1,185 | | | | | | | | 230,000 | | | | 230,000 | | | | – | |
| | | | | | | | | | | | | | | | | | | | | | | | | | | | |
| | | | | | | |
Total Expenditure | | | 6,463,737 | | | | 6,537,300 | | | | (73,563 | ) | | | | | | | 13,515,109 | | | | 13,537,630 | | | | (22,521 | ) |
| | | | | | | | | | | | | | | | | | | | | | | | | | | | |
| 1. | Budget figures are adjusted to include Enabling Appropriations. |
- 12 -
| | |
SECOND QUARTER REPORT | | APRIL TO SEPTEMBER 2016 |
Appendix III
2016/17 CORE GOVERNMENT CAPITAL INVESTMENT BY DEPARTMENT
Thousands of Dollars
| | | | | | | | | | | | | | | | | | | | | | | | | | | | |
| | | Year-to-Date to September 30 | | | | | | Full Year | |
| UNAUDITED | | Actual | | | Estimated Variance | | | | | | Forecast | | | Budget | | | Variance | |
| | | | | | | |
Agriculture | | | – | | | | – | | | | – | | | | | | | | 250 | | | | 250 | | | | – | |
Education and Training | | | – | | | | – | | | | – | | | | | | | | 500 | | | | 2,173 | | | | (1,673 | ) |
Families | | | 212 | | | | 364 | | | | (152 | ) | | | | | | | 364 | | | | 465 | | | | (101 | ) |
Finance | | | 20,196 | | | | 24,649 | | | | (4,453 | ) | | | | | | | 45,952 | | | | 61,525 | | | | (15,573 | ) |
Health, Seniors and Active Living | | | 14 | | | | 150 | | | | (136 | ) | | | | | | | 1,202 | | | | 1,202 | | | | – | |
Infrastructure | | | 253,179 | | | | 266,151 | | | | (12,972 | ) | | | | | | | 606,200 | | | | 606,200 | | | | – | |
Justice | | | 661 | | | | 1,581 | | | | (920 | ) | | | | | | | 2,957 | | | | 3,507 | | | | (550 | ) |
Sport, Culture and Heritage | | | – | | | | – | | | | – | | | | | | | | 205 | | | | 205 | | | | – | |
Sustainable Development | | | 2,792 | | | | 4,994 | | | | (2,202 | ) | | | | | | | 11,895 | | | | 15,044 | | | | (3,149 | ) |
Internal Service Adjustments | | | – | | | | – | | | | – | | | | | | | | 9,698 | | | | 12,931 | | | | (3,233 | ) |
| | | | | | | | | | | | | | | | | | | | | | | | | | | | |
Total Capital Investment | | | 277,054 | | | | 297,889 | | | | (20,835 | ) | | | | | | | 679,223 | | | | 703,502 | | | | (24,279 | ) |
| | | | | | | | | | | | | | | | | | | | | | | | | | | | |
- 12 -