Exhibit 99.1
SUMMARY BUDGET 2017/18

2 / BUDGET 2017
Summary Budget
For the Fiscal Year Ending March 31, 2018 (Millions of Dollars)
With Comparative Data for the Fiscal Year Ending March 31, 2017
| | | | | | | | | | | | | | | | | | | | | | | | | |
| | | 2017/18 | | 2016/17 | | 2016/17 | | Per Cent Change 2017/18 Budget from 2016/17 |
| | | Budget | | Forecast | | Budget | | Forecast | | Budget |
| | | | | |
Revenue | | | | | | | | | | | | | | | | | | | | | | | | | |
| | | | | |
Income Taxes | | | | 4,194 | | | | | 3,950 | | | | | 3,868 | | | | | 6.2 | | | | | 8.4 | |
| | | | | |
Other Taxes | | | | 4,497 | | | | | 4,395 | | | | | 4,396 | | | | | 2.3 | | | | | 2.3 | |
| | | | | |
Fees and Other Revenue | | | | 2,307 | | | | | 2,307 | | | | | 2,220 | | | | | - | | | | | 3.9 | |
| | | | | |
Federal Transfers | | | | 4,163 | | | | | 4,117 | | | | | 4,108 | | | | | 1.1 | | | | | 1.3 | |
| | | | | |
Net Income of Government Business Enterprises | | | | 705 | | | | | 644 | | | | | 674 | | | | | 9.5 | | | | | 4.6 | |
| | | | | |
Sinking Funds and Other Earnings | | | | 235 | | | | | 230 | | | | | 209 | | | | | 2.2 | | | | | 12.4 | |
| | | | | | | | | | | | | | | | | | | | | | | | | |
| | | | | |
Total Revenue | | | | 16,101 | | | | | 15,643 | | | | | 15,475 | | | | | 2.9 | | | | | 4.0 | |
| | | | | | | | | | | | | | | | | | | | | | | | | |
| | | | | |
Expenditure | | | | | | | | | | | | | | | | | | | | | | | | | |
| | | | | |
Health | | | | 6,681 | | | | | 6,475 | | | | | 6,504 | | | | | 3.2 | | | | | 2.7 | |
| | | | | |
Education | | | | 4,400 | | | | | 4,284 | | | | | 4,281 | | | | | 2.7 | | | | | 2.8 | |
| | | | | |
Families | | | | 2,159 | | | | | 2,037 | | | | | 2,037 | | | | | 6.0 | | | | | 6.0 | |
| | | | | |
Community, Economic and Resource Development | | | | 1,531 | | | | | 1,511 | | | | | 1,521 | | | | | 1.3 | | | | | 0.7 | |
| | | | | |
Justice and Other Expenditures | | | | 1,294 | | | | | 1,270 | | | | | 1,282 | | | | | 1.9 | | | | | 0.9 | |
| | | | | |
Debt Servicing | | | | 991 | | | | | 938 | | | | | 911 | | | | | 5.7 | | | | | 8.8 | |
| | | | | | | | | | | | | | | | | | | | | | | | | |
| | | | | |
Total Expenditure | | | | 17,056 | | | | | 16,515 | | | | | 16,536 | | | | | 3.3 | | | | | 3.1 | |
| | | | | | | | | | | | | | | | | | | | | | | | | |
| | | | | |
In-Year Adjustments/Lapse | | | | (115) | | | | | – | | | | | (150) | | | | | | | | | | | |
| | | | | | | | | | | | | | | | | | | | | | | | | |
| | | | | |
Net Income (Loss) | | | | (840) | | | | | (872) | | | | | (911) | | | | | | | | | | | |
| | | | | | | | | | | | | | | | | | | | | | | | | |
NOTES:
| • | | The 2016/17 forecast and budget have been restated to be consistent with the 2017/18 budget presentation. |
| • | | In-Year Adjustments/Lapse could be an increase in revenue and/or decrease in expenditures. |
| • | | Numbers may not add due to rounding. |
BUDGET 2017 / 3
SUMMARY BUDGET 2017/18
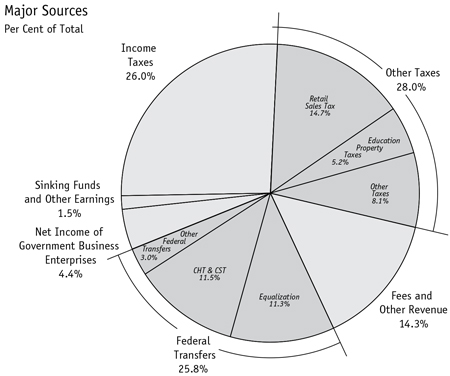
Revenue
Revenue in 2017/18 is projected to increase $626 million, or 4.0%, from the 2016/17 Budget.
Income tax revenue is projected to increase by $326 million, with a $312 million increase in individual income tax revenue and an increase of $14 million in corporation income tax revenue. Budget 2017 projects a $101 million, or 2.3%, increase in other tax revenue, mainly reflecting growth in retail sales tax and corporations taxes. Fees and other revenue is projected to increase $87 million, or 3.9%. Federal transfers are projected to increase $55 million, or 1.3%. Net income of Government Business Enterprises is projected to increase $31 million, or 4.6%. Sinking funds and other earnings is projected to increase by $26 million.
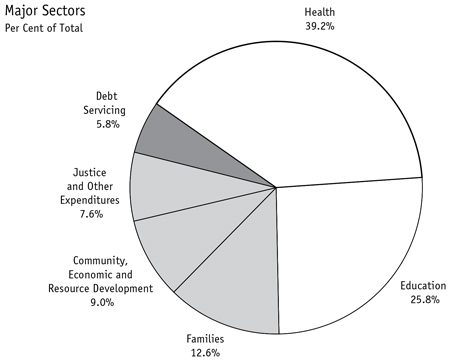
Expenditure
Expenditure in 2017/18 is projected to increase $520 million, or 3.1%, from the 2016/17 Budget.
The growth in health expenditure is $177 million, or 2.7%. Education-related expenditure is increasing by $119 million, or 2.8%. Families is up $122 million, or 6.0%. Community, economic and resource development expenditure will increase by $10 million, or 0.7%. The justice and other expenditures sector will increase by $12 million, or 0.9%. Debt servicing is expected to increase by $80 million.
4 / BUDGET 2017
Summary Revenue
For the Fiscal Year Ending March 31, 2018 (Millions of Dollars)
With Comparative Data for the Fiscal Year Ending March 31, 2017
| | | | | | | | | | | | | | | | | | | | | | | | | |
| | | 2017/18 | | 2016/17 | | 2016/17 | | Per Cent Change 2017/18 Budget from 2016/17 |
| Source of Revenue | | Budget | | Forecast | | Budget | | Forecast | | Budget |
| | | | | |
Income Taxes | | | | | | | | | | | | | | | | | | | | | | | | | |
Individual Income Tax | | | | 3,651 | | | | | 3,498 | | | | | 3,339 | | | | | | | | | | | |
Corporation Income Tax | | | | 543 | | | | | 452 | | | | | 529 | | | | | | | | | | | |
| | | | | | | | | | | | | | | | | | | | | | | | | |
Subtotal: Income Taxes | | | | 4,194 | | | | | 3,950 | | | | | 3,868 | | | | | 6.2 | | | | | 8.4 | |
| | | | | | | | | | | | | | | | | | | | | | | | | |
Other Taxes | | | | | | | | | | | | | | | | | | | | | | | | | |
Corporations Taxes | | | | 282 | | | | | 270 | | | | | 249 | | | | | | | | | | | |
Fuel Taxes | | | | 334 | | | | | 341 | | | | | 331 | | | | | | | | | | | |
Land Transfer Tax | | | | 84 | | | | | 83 | | | | | 84 | | | | | | | | | | | |
Levy for Health and Education | | | | 342 | | | | | 340 | | | | | 345 | | | | | | | | | | | |
Retail Sales Tax | | | | 2,360 | | | | | 2,298 | | | | | 2,328 | | | | | | | | | | | |
Tobacco Tax | | | | 249 | | | | | 251 | | | | | 256 | | | | | | | | | | | |
Other Taxes | | | | 11 | | | | | 13 | | | | | 10 | | | | | | | | | | | |
Education Property Taxes | | | | 835 | | | | | 799 | | | | | 793 | | | | | | | | | | | |
| | | | | | | | | | | | | | | | | | | | | | | | | |
Subtotal: Other Taxes | | | | 4,497 | | | | | 4,395 | | | | | 4,396 | | | | | 2.3 | | | | | 2.3 | |
| | | | | | | | | | | | | | | | | | | | | | | | | |
Fees and Other Revenue | | | | | | | | | | | | | | | | | | | | | | | | | |
Fines and Costs and Other Legal | | | | 54 | | | | | 58 | | | | | 54 | | | | | | | | | | | |
Minerals and Petroleum | | | | 11 | | | | | 12 | | | | | 10 | | | | | | | | | | | |
Automobile and Motor Carrier Licences and Fees | | | | 154 | | | | | 153 | | | | | 152 | | | | | | | | | | | |
Parks: Forestry and Other Conservation | | | | 34 | | | | | 36 | | | | | 34 | | | | | | | | | | | |
Water Power Rentals | | | | 111 | | | | | 114 | | | | | 108 | | | | | | | | | | | |
Service Fees and Other Miscellaneous Charges | | | | 1,636 | | | | | 1,635 | | | | | 1,572 | | | | | | | | | | | |
Tuition Fees | | | | 307 | | | | | 299 | | | | | 290 | | | | | | | | | | | |
| | | | | | | | | | | | | | | | | | | | | | | | | |
Subtotal: Fees and Other Revenue | | | | 2,307 | | | | | 2,307 | | | | | 2,220 | | | | | – | | | | | 3.9 | |
| | | | | | | | | | | | | | | | | | | | | | | | | |
Federal Transfers | | | | | | | | | | | | | | | | | | | | | | | | | |
Equalization | | | | 1,820 | | | | | 1,736 | | | | | 1,736 | | | | | | | | | | | |
Canada Health Transfer (CHT) | | | | 1,355 | | | | | 1,313 | | | | | 1,304 | | | | | | | | | | | |
Canada Social Transfer (CST) | | | | 502 | | | | | 485 | | | | | 482 | | | | | | | | | | | |
Shared Cost and Other Transfers | | | | 486 | | | | | 583 | | | | | 586 | | | | | | | | | | | |
| | | | | | | | | | | | | | | | | | | | | | | | | |
Subtotal: Federal Transfers | | | | 4,163 | | | | | 4,117 | | | | | 4,108 | | | | | 1.1 | | | | | 1.3 | |
| | | | | | | | | | | | | | | | | | | | | | | | | |
Net Income of Government | | | | | | | | | | | | | | | | | | | | | | | | | |
Business Enterprises (GBEs) | | | | | | | | | | | | | | | | | | | | | | | | | |
Manitoba Liquor and Lotteries Corporation | | | | 592 | | | | | 580 | | | | | 586 | | | | | | | | | | | |
Deposit Guarantee Corporation | | | | 20 | | | | | 18 | | | | | 18 | | | | | | | | | | | |
Manitoba Hydro-Electric Board1 | | | | 74 | | | | | 50 | | | | | 42 | | | | | | | | | | | |
Workers Compensation Board | | | | 7 | | | | | 24 | | | | | 9 | | | | | | | | | | | |
Manitoba Public Insurance Corporation | | | | 12 | | | | | (28) | | | | | 19 | | | | | | | | | | | |
| | | | | | | | | | | | | | | | | | | | | | | | | |
Subtotal: Net Income of GBEs | | | | 705 | | | | | 644 | | | | | 674 | | | | | 9.5 | | | | | 4.6 | |
| | | | | | | | | | | | | | | | | | | | | | | | | |
Sinking Funds and Other Earnings | | | | 235 | | | | | 230 | | | | | 209 | | | | | 2.2 | | | | | 12.4 | |
| | | | | | | | | | | | | | | | | | | | | | | | | |
Total Revenue | | | | 16,101 | | | | | 15,643 | | | | | 15,475 | | | | | 2.9 | | | | | 4.0 | |
| | | | | | | | | | | | | | | | | | | | | | | | | |
1 Budget figures as per Integrated Financial Forecast (IFF15)
BUDGET 2017 / 5
Summary Expenditure
For the Fiscal Year Ending March 31, 2018 (Millions of Dollars)
With Comparative Data for the Fiscal Year Ending March 31, 2017
| | | | | | | | | | | | | | | | | | | | | | | | | |
| | | 2017/18 | | 2016/17 | | 2016/17 | | Per Cent Change 2017/18 Budget from 2016/17 |
| Sector/Department | | Budget | | Forecast | | Budget | | Forecast | | Budget |
| | | | | |
Health | | | | | | | | | | | | | | | | | | | | | | | | | |
| | | | | |
Health, Seniors and Active Living | | | | 6,681 | | | | | 6,475 | | | | | 6,504 | | | | | 3.2 | | | | | 2.7 | |
| | | | | |
Education | | | | | | | | | | | | | | | | | | | | | | | | | |
| | | | | |
Education and Training | | | | 4,400 | | | | | 4,284 | | | | | 4,281 | | | | | 2.7 | | | | | 2.8 | |
| | | | | |
Families | | | | | | | | | | | | | | | | | | | | | | | | | |
| | | | | |
Families | | | | 2,159 | | | | | 2,037 | | | | | 2,037 | | | | | 6.0 | | | | | 6.0 | |
| | | | | |
Community, Economic and Resource Development | | | | | | | | | | | | | | | | | | | | | | | | | |
| | | | | |
Agriculture | | | | 394 | | | | | 289 | | | | | 381 | | | | | | | | | | | |
| | | | | |
Growth, Enterprise and Trade | | | | 114 | | | | | 137 | | | | | 130 | | | | | | | | | | | |
| | | | | |
Indigenous and Municipal Relations | | | | 451 | | | | | 516 | | | | | 458 | | | | | | | | | | | |
| | | | | |
Infrastructure | | | | 430 | | | | | 428 | | | | | 409 | | | | | | | | | | | |
| | | | | |
Sustainable Development | | | | 142 | | | | | 141 | | | | | 143 | | | | | | | | | | | |
| | | | | | | | | | | | | | | | | | | | | | | | | |
| | | | | |
Subtotal: Community, Economic and Resource Development | | | | 1,531 | | | | | 1,511 | | | | | 1,521 | | | | | 1.3 | | | | | 0.7 | |
| | | | | | | | | | | | | | | | | | | | | | | | | |
| | | | | |
Justice and Other Expenditures | | | | | | | | | | | | | | | | | | | | | | | | | |
| | | | | |
Legislative Assembly | | | | 47 | | | | | 57 | | | | | 58 | | | | | | | | | | | |
| | | | | |
Executive Council | | | | 3 | | | | | 3 | | | | | 3 | | | | | | | | | | | |
| | | | | |
Civil Service Commission | | | | 21 | | | | | 21 | | | | | 21 | | | | | | | | | | | |
| | | | | |
Employee Pensions and Other Costs | | | | 77 | | | | | 77 | | | | | 77 | | | | | | | | | | | |
| | | | | |
Finance | | | | 352 | | | | | 345 | | | | | 346 | | | | | | | | | | | |
| | | | | |
Justice | | | | 615 | | | | | 602 | | | | | 604 | | | | | | | | | | | |
| | | | | |
Sport, Culture and Heritage | | | | 82 | | | | | 78 | | | | | 83 | | | | | | | | | | | |
| | | | | |
Enabling Appropriations | | | | 40 | | | | | 30 | | | | | 33 | | | | | | | | | | | |
| | | | | |
Other Appropriations | | | | 57 | | | | | 57 | | | | | 57 | | | | | | | | | | | |
| | | | | | | | | | | | | | | | | | | | | | | | | |
| | | | | |
Subtotal: Justice and Other Expenditures | | | | 1,294 | | | | | 1,270 | | | | | 1,282 | | | | | 1.9 | | | | | 0.9 | |
| | | | | | | | | | | | | | | | | | | | | | | | | |
| | | | | |
Debt Servicing | | | | 991 | | | | | 938 | | | | | 911 | | | | | 5.7 | | | | | 8.8 | |
| | | | | | | | | | | | | | | | | | | | | | | | | |
| | | | | |
Total Expenditure | | | | 17,056 | | | | | 16,515 | | | | | 16,536 | | | | | 3.3 | | | | | 3.1 | |
| | | | | | | | | | | | | | | | | | | | | | | | | |
6 / BUDGET 2017
Revenue, 2017/18
Expenditure, 2017/18
FISCAL RESPONSIBILITY STRATEGY 2017/18:
THE ROAD TO RECOVERY
FISCAL RESPONSIBILITY STRATEGY 2017/18: THE ROAD TO RECOVERY
| | | | |
| CONTENTS | | | | |
| |
WHERE WE ARE TODAY | | | 9 | |
| |
WHAT WE HEARD: YOUR PROVINCE – YOUR PLAN | | | 9 | |
| |
EXPERT REVIEWS | | | 11 | |
| |
WHAT WE LEARNED | | | 11 | |
| |
RESTORING FISCAL DISCIPLINE | | | 12 | |
| |
ALL HANDS ON DECK | | | 15 | |
| |
THE PATH FORWARD | | | 16 | |
| |
REBUILDING THE ECONOMY | | | 19 | |
| |
CLIMATE AND GREEN PLAN | | | 21 | |
| |
PARTNERSHIPS | | | 21 | |
| |
APPENDICES | | | | |
| |
Appendix 1: Fiscal Performance Review | | | 23 | |
| |
Appendix 2: Clinical and Preventive Services Planning for Manitoba | | | 29 | |
| |
Appendix 3: Factors Affecting Emergency Department Waiting Room Times in Winnipeg | | | 33 | |
| |
Appendix 4: Health System Sustainability and Innovation Review | | | 35 | |
BUDGET 2017 / 9
As our government proceeds into year two of our mandate, we continue on the path to making Manitoba the most improved province in Canada: from better health care and education for Manitoba families; to better jobs that will inspire our young people to make Manitoba their home into the future; led by an open government that earns the trust of Manitobans. Our road to recovery is based on the foundation of a strong fiscal plan to make this process possible.
WHERE WE ARE TODAY
Our first year has been spent listening to Manitobans who came forward during our pre-budget consultation to give us their views on how to repair our services, fix Manitoba’s finances and rebuild our economy. We received advice from Manitobans from all walks of life and from all across the province, small business people and provincial civil servants, front-line service providers and farmers. We sought expert advice on how to improve the performance of our government, with particular focus in the short term to improving our health care services. From that advice we have developed Budget 2017 and a longer-term strategy to improve services to give Manitobans better value for their hard-earned tax dollars.
Further work is underway on other services, including a strategy to improve services for children in care that will build on our initial legislative reforms to enhance information sharing between the agencies helping children in need of protection and support. We have begun to explore ways to improve our justice system, and are developing a strategy to provide more child care spaces for Manitoba families. Reviews are underway on how best to encourage more private sector investment to strengthen our economy.
WHAT WE HEARD: YOUR PROVINCE – YOUR PLAN
We strongly believe that Manitoba citizens have valuable insight and advice to offer as we move forward in our mandate. This is why we undertook the most

extensive pre-budget consultation that Manitobans have ever seen, offering opportunities in person, in written communication and through social media in order to reach out as extensively as possible to all corners of our province.
Launched in October of 2016, our pre-budget consultations engaged Manitobans from across the province. Community meetings, hosted by the Minister of Finance, were held in Winnipeg, Brandon, Swan River and Thompson, with approximately 340 individuals and almost 50 stakeholders participating.
In addition, over 220 citizens provided advice and ideas online in the areas of efficiency, regulatory reform, managing the province’s expenditure growth, supporting economic growth and specifically, private sector growth in Manitoba’s North. Over 100 Manitobans chose to write or e-mail the Minister of Finance directly with their priorities. Over 300 civil servants from across Manitoba provided advice through an internal website.
In all, our consultations included over 18,000 interactions with Manitobans who provided extensive and important feedback and input on priorities for Budget 2017.
The ideas brought forward were valuable, important and much appreciated as we collectively work towards fixing our finances and rebuilding our economy.
10 / BUDGET 2017
Manitoba was the first province to employ an interactive online tool that allowed Manitobans to build their own provincial budget based on their priorities.
At the same time, they were able to see how those decisions impact Manitoba’s 2016/17 budgeted core deficit of $890 million. This tool allowed Manitobans to experience firsthand the development of a provincial budget and to better understand the challenges as we strive to fix our finances.
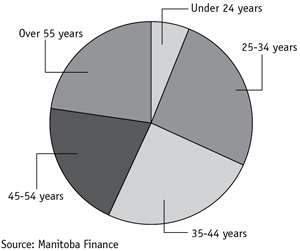
Almost 1,000 Manitobans built their own provincial budget. The input came from a broad spectrum of Manitobans from all regions of the province, including urban, rural and northern, home owners and renters, 90% of whom have resided in Manitoba for more than 10 years, and representing all age groups.
Manitoba’s Citizen Budget Participants
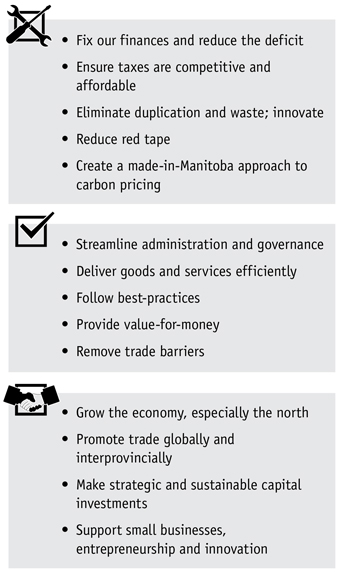
What we heard from Manitobans was that sustainability and ensuring programs and services are delivered in the most efficient way possible is fundamental to good governance. The following themes emerged:
These themes were echoed by the Advisory Panel on Fiscal Performance, which participated in the budget deliberations and offered their advice to the Minister of Finance based on the feedback of Manitobans and the expert panel reviews.
Budget 2017 reflects the consideration of the advice we have received over the last several months. Manitobans have a right to expect that their government uses public revenues effectively and efficiently to deliver high-quality government programs and services at a reasonable and sustainable cost, and this is what we heard when we consulted our citizens.
BUDGET 2017 / 11
EXPERT REVIEWS
Several major reviews by external experts have helped us as we prepared Budget 2017 and developed our long-term plans for repairing our services and making progress towards a balanced future.
Firstly, we conducted a comprehensive Fiscal Performance Review of our core government departments, excluding the health sector. Secondly, we received two important reports on our health care services, the Provincial Clinical and Preventive Services Planning for Manitoba: Doing Things Differently and Better (the ‘Peachey Report’), and Factors Affecting Emergency Department Waiting Room Times in Winnipeg, by the Manitoba Centre for Health Policy. A third and complementary review – the Health System Sustainability and Innovation Review – focused on assessing the current state of our health care services, and recommended a pathway towards improving the quality and sustainability of our health care system. Appendices 1 to 4 provides further details regarding the findings of these reports.
WHAT WE LEARNED
Our first year was also spent learning and understanding the full extent of the fiscal challenges inherited from the previous government.
Throughout our first year, we have learned that the challenges we inherited are significant and include:
| ● | | the level of regional health authority deficit spending: history of running deficits including almost $60 million in 2015/16; |
| ● | | the East Side Road Authority commitments, which totaled over $200 million; |
| ● | | depletion of the Fiscal Stabilization Account leaving the current balance of $115 million, the lowest balance of the account in 14 years; |
| ● | | lengthy lease commitments, long-term collective bargaining agreements, complex job descriptions and bargaining units, all challenging the government’s ability to improve front-line services; |
| ● | | neglected upgrades for the Fleetnet emergency communications service used by first responders, resulting in an estimated $400 million replacement price tag; |
| ● | | amortization, principal and interest payments, the cost of servicing debt on capital assets, rising by almost $60 million annually; and |
| ● | | deferred maintenance liability of over $8 billion in core government infrastructure alone, as a result of failing to properly maintain owned assets. |
These examples of fiscal mismanagement contributed to Manitoba’s 2015/16 level of expenditures to Gross Domestic Product (GDP) of 24%, significantly higher than other western provinces. In Budget 2015, the last tabled budget of the previous government, the financial deficit projection was $422 million on a summary basis while the actual deficit came in at $846 million, more than double their projection. This enormous increase in the deficit came despite Budget 2014’s projection that the deficit would be eliminated by 2016.
From 2005/06 to 2015/16, core government revenues grew at a reasonable and predictable pace, averaging 3.8%. Expenditures on the other hand, grew at 4.7%, outstripping the revenue growth. It is clear that these annual deficits were not the result of a revenue problem – the previous government had a chronic spending problem.
Running deficits has resulted in a very serious issue for our province’s net debt position, which more than doubled since 2007/08 to $21.4 billion in 2015/16, and is a key factor in recent downgrades from credit rating agencies.
It is clear that Manitoba’s fiscal situation will not fix itself. In addition to these liabilities, our government faces upcoming challenges, notably the reduction of the level of federal transfers for health care. This unilateral announcement applies a further pressure of $39 million on provincial revenues, despite numerous expert studies warning of the oncoming demographic challenges to the health care system.
12 / BUDGET 2017
But we are making progress. Budget 2016, introduced four weeks after the swearing in of our government, is on track: based on the third quarter of the fiscal year 2016/17, we are projecting a deficit of $872 million, $39 million better than the budgeted deficit of $911 million.
RESTORING FISCAL DISCIPLINE
Our government will continue working to restore fiscal discipline with a common sense approach to financial management. We will work to implement the input from Manitobans and the recommendations of our expert reviews to eliminate waste and duplication, and ensure that we deliver value for taxpayers’ hard-earned money.
Manitoba’s Budget Projections
Open and transparent financial reporting means that financial management plans, actions and results should be clearly described and readily available to the public.
Summary budget reporting and core government reporting are both important to provide transparency and accountability with respect to the province’s financial management. The Summary Budget brings together the results for not just core government, but also all of the government business enterprises (GBEs) such as Manitoba Hydro and Manitoba Public Insurance, the health authorities, the social service authorities, school divisions, and many more entities either
controlled or financially dependent on the provincial government. As such, it provides an important overview of the financial position of the provincial public sector as a whole.
The core government projections provide information on the revenues and expenses of government departments that are under the direct control of the Legislative Assembly. These are where the day-to-day decisions are made that ultimately determine the success of the government’s strategies, plans and programs.
Manitoba now has the basic elements in place to ensure transparency, including summary financial statements that are compliant with Canadian Public Sector Accounting Standards, as well as quarterly financial reporting on the same summary basis.
Open and transparent financial reporting increases accountability and ultimately fosters the fiscal discipline needed to bend the cost curve in government spending to restore budget balance.
Although several risks and challenges remain for the global economy, Manitoba’s stable economic and demographic fundamentals are projected to produce steady economic growth over the next year.
Both summary and core government budget projections assume revenue will rise by an average of 3% annually from 2017/18 to 2019/20. We have taken measures to control expenditures, which are now projected to increase by an annual average of 2% during the same period.
Summary Budget
| | | | | | | | | | | | | | | | | | | | |
| (Millions of Dollars) | | 2016/17
Budget | | | 2016/17
Forecast | | | 2017/18
Budget | | | 2018/19
Projection | | | 2019/20
Projection | |
| | | | | |
Revenue | | | 15,475 | | | | 15,643 | | | | 16,101 | | | | 16,584 | | | | 17,081 | |
| | | | | |
Expenditure | | | 16,536 | | | | 16,515 | | | | 17,056 | | | | 17,397 | | | | 17,745 | |
| | | | | |
Year-End Adjustments/Lapse | | | (150) | | | | - | | | | (115) | | | | (115) | | | | (115) | |
| | | | | |
Net Income (Loss) | | | (911) | | | | (872) | | | | (840) | | | | (698) | | | | (549) | |
| | | | | | | | | | | | | | | | | | | | |
BUDGET 2017 / 13
Core Government
| | | | | | | | | | | | | | | | | | | | |
| (Millions of Dollars) | | 2016/17
Budget | | | 2016/17
Forecast | | | 2017/18
Budget | | | 2018/19
Projection | | | 2019/20
Projection | |
| | | | | |
Revenue | | | 12,578 | | | | 12,663 | | | | 13,016 | | | | 13,406 | | | | 13,808 | |
| | | | | |
Expenditure | | | 13,538 | | | | 13,463 | | | | 13,820 | | | | 14,096 | | | | 14,378 | |
| | | | | |
Year-End Adjustments/Lapse | | | (70) | | | | - | | | | (35) | | | | (35) | | | | (35) | |
| | | | | |
Net Result | | | (890) | | | | (800) | | | | (769) | | | | (655) | | | | (535) | |
| | | | | |
Fiscal Stabilization Account Transfer | | | - | | | | - | | | | (10) | | | | (50) | | | | (50) | |
| | | | | |
Net Income (Loss) | | | (890) | | | | (800) | | | | (779) | | | | (705) | | | | (585) | |
| | | | | | | | | | | | | | | | | | | | |
Beginning in 2017/18, transfers to the Fiscal Stabilization Account will begin to rebuild the province’s savings, providing protection for core government operations in future years.
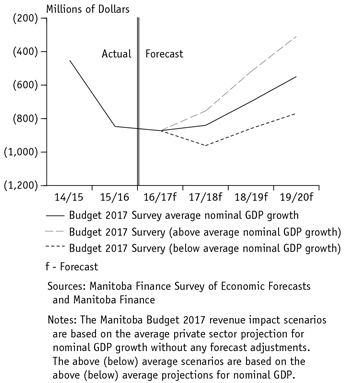
Budget 2017 fiscal projections are based on the latest available economic projections. The current Manitoba Finance Survey of Economic Forecasts from March 2017 shows Manitoba’s nominal GDP - the broadest measure of the tax base - to increase by 3.6% in 2017 and by 3.8% annual average growth over the next two years.
Given the uncertainty in the economic environment, risks and revisions to the economic forecast can materially impact provincial revenue projections and thereby impact the projected budget surplus/deficit position. The following chart shows fiscal outcomes under two additional revenue growth scenarios compared to the base case. The above average nominal GDP growth scenario uses forecasts that are above the survey average, while the below average scenario uses the forecasts that are below the survey average.
Manitoba continues to face significant fiscal challenges on the road to recovery. We know that this recovery will take time, and we stand behind our commitment to ensure that we get it right, and that we return to balance before the end of our second term.
Prudent budget decisions in expenditure increases and fiscal discipline throughout the coming year are imperative to ensuring that the 2017/18 budgeted deficit position is achieved. This approach will continue in future years.
Manitoba Summary Budget
Under Various Revenue Growth Scenarios
14 / BUDGET 2017
Reaffirming Our Commitment: The Fiscal
Responsibility and Taxpayer Protection Act
Bill 21, The Fiscal Responsibility and Taxpayer Protection Act re-establishes the foundation of fiscal discipline and accountability that will support a sustainable financial future for Manitoba.
The new Act will require government to show progress from the deficit base line of $924 million established on a summary basis in Budget 2017 and, as progress is made each year, the deficit must continue to be less than the year before.
However, Bill 21 also recognizes the impact that decisions of the past will continue to have on our ability to pay for the services Manitobans expect.
Manitoba Hydro has made aggressive capital investments that have led to volatile and costly projections that impact our budget on a summary basis. Any significant loss experienced by Manitoba Hydro would have to be offset by reductions to the very services and supports that our government is committed to protecting.
At the same time, because the projections are volatile, Manitoba Hydro may see positive results in some years, as these capital projects progress. It would likewise be imprudent to count on those positive earnings as an indicator of success on the road to balance, with the knowledge that Manitoba will be paying for the decisions of the past for many years to come. It is therefore the fiscally responsible approach to exclude Manitoba Hydro’s net income, whether it is positive or negative.
The new legislation will reaffirm the value of planning for the future through the use of the Fiscal Stabilization Account. It will allow government to set aside one-time revenue that is intended to pay for a service or project that will be completed and paid for in a future year and to return that revenue to the Consolidated Fund when the payment is made. This is a practical, transparent and responsible approach that ensures that when progress is made and ultimately balance is achieved, it is sustainable and not dependent on one-time revenue that cannot be maintained into the future.
The calculation of the Budget 2017 base line deficit, as determined under the new Act, is as follows:
Fiscal Responsibility and Taxpayer Protection,
Base Line Deficit
| | |
| (Millions of Dollars) | | 2017/18 Budget |
| |
Revenue | | 16,101 |
| |
Expenditure | | 17,056 |
| |
Net Result | | (955) |
| |
Year-End Adjustments/Lapse | | (115) |
| |
Net Income (Loss) | | (840) |
| |
Adjustments: | | |
| |
1) Net Income (Loss) Manitoba Hydro | | 74 |
| |
2) Fiscal Stabilization Account | | 10 |
| |
Base Line Deficit 2017/18 | | (924) |
BUDGET 2017 / 15
To ensure the accountability of members of cabinet and to reflect our principles to face difficult decisions head on and to reward performance, the new Act will require ministers to forgo 20% of their salary each year that a deficit is projected. If progress is achieved and the deficit is smaller than the previous year, then that performance is rewarded and ministers will receive the withheld salary. However, if progress is not achieved, then the salary repayment will be reduced, or even forfeited for that year, and further withheld at 40% in subsequent years, until progress towards balance is achieved.
Returning to balance will require focus, vigilance and a common sense approach, but it must not be achieved on the backs of hard-working Manitobans. The Fiscal Responsibility and Taxpayer Protection Act will provide Manitoba taxpayers with enforceable protection, including the restoration of the right to vote on major tax increases.
These measures will ensure that we stay on a financially prudent course and that all of our partners contribute to Manitoba claiming its title as the Most Improved Province.
ALL HANDS ON DECK
A common theme in both fiscal performance reviews and the clinical services review was the invaluable contribution provided by the public service and those delivering front-line services to Manitobans. Our civil service is committed to reinvigorating and contributing to the design of a more responsive and efficient government that benefits all Manitobans.
At the same time, we recognize that a significant portion of expenditures in government relate to public service compensation. If we are to work together to return our books to balance and chart a sustainable path for future generations, then we must all contribute to that goal.
Our government’s initial focus was to reduce the size of cabinet and reorganize government departments. The next step involved a more responsive and effective
management approach, to reduce a top-heavy structure initially in the civil service through streamlining and consolidation, a process that will continue across the broader public sector.
A further component of our efforts to ensure the sustainability of front-line services across the public sector is reflected in the introduction of Bills 28 and 29, companion pieces of legislation designed to protect the front-line services relied upon by Manitoba families, deliver better patient care through necessary reform and bargaining unit restructuring, and guard against tax increases. This legislation follows extensive pre-budget consultations with Manitobans and continuing dialogue with union leaders.
Bill 28, The Public Services Sustainability Act, establishes a four-year sustainability period with percentage limits on pay increases for an estimated 120,000 public servants, including employees of: the government and its agencies; health organizations including physicians; child and family service authorities and agencies; universities, colleges and school divisions; other financial reporting organizations; independent offices; the legislative assembly; and political staff.
There are currently more than 180 different bargaining units and collective agreements in the health care sector, adding administrative burdens and creating challenges to ensure integrated, quality care for patients across our province’s health care system. Bill 29, The Health Sector Bargaining Unit Review Act sets out a framework to significantly reduce the number of bargaining units and increase the flexibility necessary to improve the quality and consistency of patient care across Manitoba.
16 / BUDGET 2017
THE PATH FORWARD
Budget 2017 continues the common sense approach to review processes and programs to eliminate waste and duplication to ensure that public funding delivers value for money.
Restoring Credit Ratings
After many years of stability, Manitoba’s credit ratings have come under increasing pressure in recent years as budget deficits continue at unsustainable levels. When Budget 2015 showed that Manitoba would not return to balance in 2016 as planned, Manitoba received its first credit downgrade in almost 30 years. While many factors are considered in determining a credit rating, the one that was highlighted when Moody’s Investors Service downgraded Manitoba was the lack of control over spending growth. In 2016, Manitoba received a second downgrade, this time by Standard & Poor’s, largely as a result of Manitoba Hydro’s increasing debt burden. The threat of additional downgrades is real.
Our government acknowledges the importance of controlling spending growth as the key element in restoring fiscal discipline. As the financial forecasts indicate, our government is committed to maintaining spending growth at sustainable levels, setting the foundation for a return to balance.
Meeting Budget Targets
A key to restoring fiscal discipline is to restrain the growth of spending, bending the cost curve, to ensure that spending does not outpace revenue growth. Our government is committed to ensuring that government programs and services become more effective and efficient.
The Third Quarter Report for fiscal year 2016/17, forecasts that core government is on track to meet expenditure budget targets, which has not happened since 2002/03. This was the result of government changing the tone and working with departments to instill accountability for meeting their budgets. The focus on meeting budget targets continues in Budget 2017, to stop the chronic overspending of the
past decade. Manitobans will once again be able to place their trust in government’s financial projections.
Initiatives to support this increased emphasis on delivering better value within available resources will continue in the coming year:
| ● | | procurement of public goods will continue through smart shopping including competitive tendering of government contracts; |
| ● | | checking in on the progress made to meet the commitments outlined in the mandate letters given to government ministers when they took office; |
| ● | | keeping annual core government spending growth below 3% to reduce the deficit; |
| ● | | creating the Regulatory Accountability Secretariat to ensure that barriers to growth and productivity are continually reviewed to reduce the regulatory burden on businesses and stakeholders; |
| ● | | tabling Bill 20, The Crown Corporations Governance and Accountability Act to define the roles and responsibilities of the crown corporations and the minister responsible; |
| ● | | implementing the Fiscal Performance Review Framework and change management principles into core government department decision making processes; |
| ● | | taking initial steps in health care to ensure a sustainable system today and for future generations; and |
| ● | | continuing to engage front-line workers in all departments to find ways to deliver better results for citizens through the use of proven methodologies like Lean and Continuous Improvement. |
Stabilizing Net Debt to GDP
Net debt is an important indicator of a government’s financial position as this highlights how government services will remain affordable in the future. Summary net debt is made up of financial assets (such as cash or investments) minus total liabilities (such as loans or financing). It is the remaining liability that must be financed by future revenues.
The net debt to GDP ratio measures changes in net debt against the growth of the economy. A stable net debt
BUDGET 2017 / 17
to GDP ratio is a good indication that the province is managing its debt responsibly.
Some amount of public debt is necessary for the efficient delivery of required services. It is the relative size of the debt that matters. Prudent debt management means managing the size of the debt to stay within reasonable and predictable limits that reflect the ability of the provincial economy to support it. While governments run deficits, debt cannot be reduced. As outlined in Bill 21, The Fiscal Responsibility and Taxpayer Protection Act, the Manitoba government has set guidelines for reducing the deficit and will set targets for reducing the debt once balance is achieved. In order to meet this commitment, setting a sustainable level of capital investment will assist with the reduction of the debt level over time.
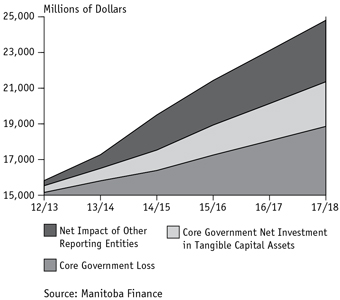
The following chart breaks out the components of the growth in the summary net debt in recent years to show the impact that core government deficits have had on the growth of the province’s net debt. Manitoba’s commitment to correct the course and move back to balance will eliminate that component of the growth curve, bringing it back down to a reasonable and sustainable level.
Summary Net Debt
Principal, Amortization and Interest Growth
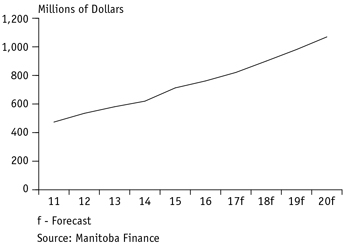
With the growth in the capital investment and debt over the last number of years, the growth in debt servicing costs has been dramatic. In 2017/18, over $900 million has been included in core government appropriations for principal, amortization and interest related to capital investment. Continued capital investment at similar levels into the future will result in unsustainable growth in capital related debt servicing costs. The resulting pressure to pay for the debt results in bigger deficits and erodes the ability to pay for front-line services. This will be compounded by potential future interest rate increases which will have an even greater impact on government’s ability to protect front-line services.
A total of $492 million has been included in core government appropriations to retire debt associated with capital investments: $270 million for amortization of department-owned assets; and $222 million for principal payments mainly for education and health-related assets.
Manitoba’s communities and the economy as a whole benefit from the debt financed net investment in tangible capital assets in both core government and other reporting entities, ranging from roads and water-control structures to health facilities, universities, colleges and schools, and parks. While the public good provided by these investments is clear, it is also evident that continued growth at the level of past investment is unsustainable.
18 / BUDGET 2017
Sustainable Investment in
Strategic Infrastructure
Investments in strategic capital stimulate the provincial economy, generate employment and increase household and business incomes. In addition, infrastructure and infrastructure renewal projects, boost productivity over the long-term, further strengthening the economy.
Our government is committed to spending at least $1 billion annually on strategic infrastructure: roads and bridges, flood protection, hospitals, schools, universities and colleges, as well as municipal projects and other infrastructure. In addition to our direct expenditures on infrastructure, we are working to
remove barriers to private investments in public infrastructure through public-private partnerships, and to maximize the cost-sharing opportunities with our federal and municipal partners.
In 2017/18, the province will invest over $1.7 billion on strategic infrastructure. It is important that the investment decisions are made in the context of stimulating the economy, are for the public good, but are also financially sustainable over the long-term. With this in mind, all infrastructure investments will continue to be scrutinized to ensure the best value for money.
Strategic Infrastructure 2017/18
| | | | | | | | | | | | | | | |
| (Millions of Dollars) | | 2017/18 Budget | | 2016/17 Forecast | | 2016/17 Budget |
| | | |
Roads, Highways, Bridges and Flood Protection | | | | | | | | | | | | | | | |
| | | |
Highways Infrastructure and Airport Runway Capital | | | | 510 | | | | | 542 | | | | | 542 | |
| | | |
Maintenance and Preservation – Highways | | | | 143 | | | | | 147 | | | | | 144 | |
| | | |
Water Related Infrastructure | | | | 60 | | | | | 40 | | | | | 45 | |
| | | |
Transportation Equipment and Aircraft | | | | 19 | | | | | 15 | | | | | 17 | |
| | | |
Maintenance and Preservation – Water | | | | 15 | | | | | 15 | | | | | 15 | |
| | | |
Subtotal | | | | 747 | | | | | 759 | | | | | 763 | |
| | | |
Health, Education and Housing | | | | | | | | | | | | | | | |
| | | |
Health | | | | 358 | | | | | 364 | | | | | 442 | |
| | | |
Education | | | | 176 | | | | | 154 | | | | | 241 | |
| | | |
Housing | | | | 107 | | | | | 137 | | | | | 120 | |
| | | |
Subtotal | | | | 641 | | | | | 655 | | | | | 803 | |
| | | |
Other Provincial Infrastructure | | | | | | | | | | | | | | | |
| | | |
Municipal and Local Infrastructure | | | | 270 | | | | | 265 | | | | | 277 | |
| | | |
Public Service Buildings, Equipment and Technology | | | | 88 | | | | | 55 | | | | | 87 | |
| | | |
Parks, Cottage and Camping | | | | 12 | | | | | 8 | | | | | 12 | |
| | | |
Subtotal | | | | 370 | | | | | 328 | | | | | 376 | |
| | | |
Total Strategic Infrastructure | | | | 1,758 | | | | | 1,742 | | | | | 1,942 | |
NOTE:
| • | | The 2016/17 forecast and budget have been restated to be consistent with the 2017/18 budget presentation. |
BUDGET 2017 / 19
REBUILDING THE ECONOMY
Employment and economic growth are at the centre of our plan for a better Manitoba. A stronger economy will allow improvements in front-line services and additional investments in the programs and initiatives most important to Manitoba families, while also repairing the state of the province’s finances. Manitobans recognize that better services depend on a stronger economy, and we have taken the first steps on the road to make Manitoba a more attractive place to invest and create jobs.
Our government has a 10-point plan to grow Manitoba’s economy by increasing competitiveness, building strategic infrastructure, working with business and entrepreneurs to expand their opportunities, and promoting Manitoba as an attractive place to invest and trade. A stronger Manitoba depends on access to trading partners, and early in our mandate we took steps to join the New West Partnership Trade Agreement and improve the national Canada Free Trade Agreement to reduce barriers to interprovincial trade.
Last December, we announced the creation of our Premier’s Enterprise Team, an advisory team of top business leaders to work with us to create new jobs and economic growth in the province. This team has begun its review of the full suite of our economic development programs and agencies, to ensure we are taking the right steps to encourage investment and job creation, and will oversee the refinement of our economic development strategy.
Our government will continue to work closely with business and community leaders to create new and innovative opportunities to ensure our economy remains strong and growing. Included among the initiatives to grow the economy in 2017 are:
| ● | | enhancing export opportunities as a result of the Canada-European Union Comprehensive Economic and Trade Agreement coming into force in 2017; |
| ● | | continuing to invest no less than $1 billion annually in strategic infrastructure; |
| ● | | partnering with municipalities to provide them with a fair say on strategic infrastructure investment priorities; |
| ● | | continuing investments in tourism marketing and development through 96/4 tourism funding model; |
| ● | | Look North Strategy launched in February 2017, engaging stakeholders, communities and businesses to develop a long-term vision for economic growth and job creation in northern Manitoba; and |
| ● | | Manitoba’s Partnerships for Economic Growth program, introducing a single window funding mechanism for external economic development partners. |
Reducing Red Tape
Reducing red tape is part of our plan to grow the economy. We are committed to becoming Canada’s most improved province by reducing the burden of regulatory requirements that are poorly designed, duplicative, contradictory, anachronistic or overly prescriptive.
Manitoba recently received an “F” in the Canadian Federation of Independent Business (CFIB) 2016 Provincial Red Tape Report Card1, the lowest provincial ranking for regulatory accountability. CFIB estimates that regulation from all levels of government cost Manitoba’s small- and medium-sized businesses $1.2 billion annually in time and resources. Manitoba entrepreneurs estimate that 30% of all regulatory requirements are “red tape” and do not contribute to greater environmental quality, consumer protection or workplace safety.
In comparison with other provinces, Manitoba has no legislation and few policies regarding regulatory accountability. For example, Manitoba has no established measurement system to quantify the number of regulatory burdens or requirements being applied to stakeholders or private citizens, and there is no department with the responsibility for providing direction or training to departmental staff on effective and efficient regulation making and red tape reduction.
| 1 | http://www.cfib-fcei.ca/cfib-documents/RTAWReportCard2016_ en.pdf |
20 / BUDGET 2017
Similarly, there is neither consistent consultation policy nor a central online location that stakeholders can monitor for consultation notices or pending regulatory changes.
We are committed to providing better guidance on regulatory affairs and developing an institutional framework to promote better regulation making and accountability for regulatory decisions, which will in turn help promote more responsive decision making, and improved business development and growth through the following steps.
Our government has taken early action to reduce red tape. Once passed, Bill 24, The Red Tape Reduction and Government Efficiency Act, 2017, will eliminate 15 red tape issues and remove 749 regulatory requirements. In addition, Bill 22, The Regulatory Accountability Act and Amendments to the Statutes and Regulations Act, will minimize the administrative burden on stakeholders to comply with regulatory requirements and will promote and enhance regulatory accountability within government and government agencies.
Key elements of Bill 24 include:
| ● | | mandating the regulatory requirement baseline count, including annual reporting and updating of the baseline; |
| ● | | requiring regulatory changes to complete a regulatory impact statement (including a thorough cost-benefit analysis) and publicizing them in whole or in part if the change is adopted by government; |
| ● | | implementing a two-for-one rule (two regulations repealed for every one introduced) until fiscal year 2019/20, with a relaxation clause to one-for-one for all years proceeding from fiscal year 2020/21; |
| ● | | restricting introduction of non-emergency regulatory requirements to a set frequency; |
| ● | | establishing the Regulatory Accountability Committee of Cabinet and Regulatory Accountability Secretariat in legislation; and |
| ● | | requiring new regulations be reviewed by the Legislative Assembly of Manitoba’s Statutory Regulations and Orders Committee within three years of implementation to determine if the regulations or policies are meeting their intended purpose. |
Our new legislation will expand the mandate of the current Legislative Review Committee of Cabinet (LRC) into a Regulatory Accountability Committee. The LRC already analyzes legislation to ensure proposed regulatory requirements on stakeholders are effectively and efficiently implemented as part of their work. Expanding LRC’s mandate to include reviewing regulatory proposals will ensure consistent direction and analysis of all regulatory tools.
The new Regulatory Accountability Secretariat will bring together existing expertise within the civil service to support the cabinet committee by performing a number of tasks, including:
| ● | | reviewing existing and proposed regulations utilizing effective regulatory impact analysis techniques; |
| ● | | developing and maintaining methodology, tools and support for departments to facilitate counting regulatory requirements; |
| ● | | monitoring references to external standards in legislation and regulations to ensure all references are updated in a timely manner and adhere to interprovincial agreements; and |
| ● | | developing a central information hub for external stakeholders on consultation notices and pending regulatory changes. |
Employment Growth
Manitoba’s labour market is the most stable in Canada, with modest changes from year-to-year in annual growth rates. The province’s unemployment rate is second lowest among the provinces and the labour force participation rate is the third highest. Our steady labour market reflects the growth in the economy, with the supply of labour growing at about the same rate as the growth in jobs.
BUDGET 2017 / 21
Manitoba Labour Force Trend
12-Month Moving Average
February 2016 – February 2017
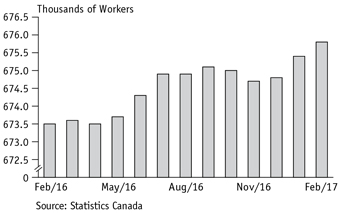
Supported by population growth, the working age population in Manitoba now exceeds one million persons. Combined with the labour force participation rate at 67.2%, there is a record 675,800 workers in Manitoba’s labour market on an annual basis.
Employment increased by 6,600 jobs in the 12 months ending in February 2017. Full-time employment increased by 7,800 jobs and part-time employment fell by 1,200 jobs. Manitoba’s unemployment rate is 5.8%, compared to 6.6% in Canada.
The Manitoba Finance Survey of Economic Forecasts shows an expected 0.7% growth in employment this year and 0.8% growth in 2018, in line with the national average. The unemployment rate is expected to average 6.1% in 2017 and is anticipated to fall to 5.9% in 2018, tied for the lowest among provinces.
The encouraging signs in the economy regarding the solid gains in the labour market will provide a further boost to business and household confidence in Manitoba.
CLIMATE AND GREEN PLAN
The environment and economy go hand-in-hand. We cannot think of one without acting on the other. Sustainable development brings the environment
and economy together. It means jobs and economic opportunity for Manitobans, as well as the need to protect and preserve our natural environment and live and act sustainably.
The Manitoba government is developing a made-in-Manitoba climate and green plan founded on the principle of sustainable development. It will contain policies and priorities on climate, jobs, water and nature. It will seek to leverage our province’s clean, green foundation into an environmental and economic advantage. It will build on our clean energy investments to responsibly and realistically reduce carbon emissions while creating new low-carbon economic opportunities in our province, including carbon pricing. It will offer approaches to water and land use, sustainable agriculture, protecting wetlands, forests and natural areas, investing in green infrastructure, promoting technology and innovation, and numerous other initiatives.
We will seek the input of Manitobans on our proposed plan, to get their suggestions and ideas.
PARTNERSHIPS
Much of our time during our first year in government has been spent listening to our municipal partners. We are committed to supporting all municipalities, including Winnipeg, through a simplified approach that provides more flexibility and autonomy for local decision-making. We will develop funding envelopes that will reduce red tape while expanding “fair say” for all municipalities.
In addition, we look forward to moving towards a single window model to simplify the process for municipalities and third-party proponents to apply for cost-sharing and allow us to assess strategic investments in infrastructure and services based upon maximizing value for provincial taxpayers’ money.
We have benefited greatly from the discussions and advice from our Indigenous communities and their leaders and elders, and we will continue to work
22 / BUDGET 2017
together to move forward on important projects that have been too long delayed.
We continue to pursue concrete actions toward reconciliation with First Nations who were displaced from their homes by the catastrophic flooding of 2011. The construction of flood protection infrastructure to keep Manitobans and their communities safe remains a top priority for our government, including outlet channels that are needed to alleviate flooding around Lake Manitoba and Lake St. Martin. We look forward to meaningful engagement with those who may be affected by these projects, including regular outreach and meetings with municipalities and private landowners. We remain committed to meaningful engagement and consultations with Indigenous communities on the government’s preferred outlet channel routes and any impact that the proposed routes may have on aboriginal and treaty rights. Our
engagement will ensure that Indigenous communities have opportunities to participate in related construction work and realize economic benefits from the eventual channel projects. Manitoba is also committed to working with Shoal Lake First Nation, the Government of Canada and the City of Winnipeg to move forward with the Shoal Lake road project with the full participation of the local community.
We look forward to bringing clarity to the protocols that govern formal consultations with our Indigenous partners so we can move forward together on these and other developments that will help strengthen our economy.
Budget 2017 is our government’s second budget. We are building on our commitment to work with all Manitobans to make Manitoba better. We are on the road to recovery.
BUDGET 2017 / 23
APPENDICES
Appendix 1: Fiscal Performance Review
24 / BUDGET 2017
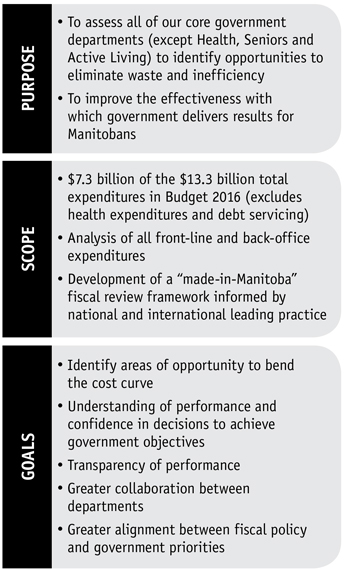
Interviews were conducted with over 140 senior government officials and included an assessment of whether there is a clear framework governing provincial expenditures, with a focus towards identifying opportunities within each of the departments to reduce the rate of growth in expenditures, both in the short term (Budget 2017) and beyond.
The observations that arose from the Fiscal Performance Review (Review) included the following:
| ● | | the Review noted the lack of performance management and measurement of outcomes/results across government; |
| ● | | a performance-based framework is required to focus on results and to ensure good value for taxpayers’ dollars; |
| ● | | over 160 specific opportunities across government were identified to bend the expenditure curve with most of these grouped into 11 key areas of opportunity; |
| ● | | opportunities should be created to promote the ongoing consideration and discussion of innovative ideas within the civil service; and |
| ● | | a concerted effort is required to improve interdepartmental collaboration. |
BUDGET 2017 / 25
The Review has provided a Fiscal Performance Review Framework (Framework) to support a fundamental change in behaviour, culture and approach to fiscal decision-making across government based on the following principles:
| | |
Results-based | | Fiscal performance should be centred on the intended outcomes to be achieved. |
Aligned | | Services and programs must be aligned to achieve the intended outcomes. |
Transparent | | The results of programs and services should be measured against the intended outcomes in a transparent and accountable manner. |
Transformative | | Changes to programs and services need to be sustained in a manner that delivers value for taxpayers. |
All
encompassing | | Barriers between departments need to be removed in recognition of the interdependence of programs and services. |
The Framework provides the public service with:
| ● | | an assessment tool to measure effectiveness, efficiency and value for money regarding government expenditures on programs and services; |
| ● | | an approach to analysis that provides options of service delivery methods or models and business cases; |
| ● | | the right questions to ask in order to align programs and policies to intended outcomes and performance measurement; and |
| ● | | guidance to apply analysis and evidence to inform policy and program choices and prioritize resources. |
This “made-in-Manitoba” Framework is informed by characteristics that ensure success based on global best practices:
|
Leadership from the Top: Cabinet Sets the Tone Clear and Open Principles |
| |
Long-Term Planning: Focus on Fiscal Sustainability Culture of Cost Efficiency and Effectiveness |
| |
Accountibility: Openness and Transparency of Information Clarity of Objectives and Results |
Part of a performance review framework depends on identifying government’s overall strategic outcomes and then aligning each department with those overall outcomes. Once the departmental outcomes have been established within the wider government framework, indicators of progress towards those outcomes can be identified for each outcome. A sample of this alignment, developed for Manitoba Growth, Enterprise and Trade (Department), is provided in Figure 1.
26 / BUDGET 2017
Figure 1
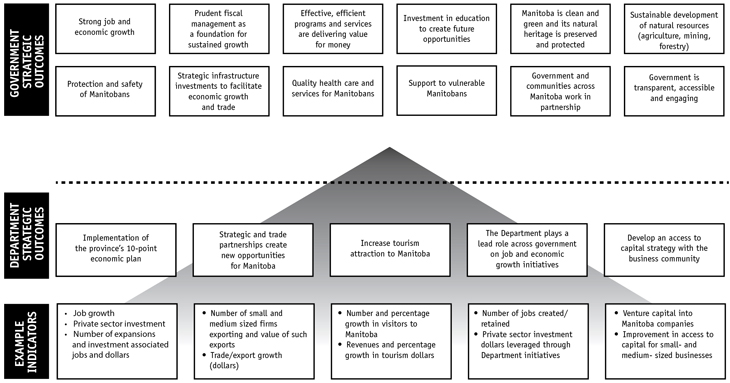
Implementation of the Framework requires establishing a culture of results-driven, continuous improvement, wherein decision makers apply a series of questions to programs and services to establish alignment, measurement, assessment, implementation and evaluation. The use of reliable data, information and evidence, supported by standards and tools, is key to the successful application of the Framework.
As referenced in the November 21st, 2016 Speech from the Throne, a full framework based on this advice will be developed to guide our efforts towards ensuring that Manitobans receive value for the services government provides with their hard-earned money.
Beyond the specific opportunities identified within departments, the Review also identified several larger areas of opportunity where the Manitoba government can enhance and improve the delivery of its services. Experience with other jurisdictions and knowledge of leading practices allowed the identification of a number of opportunities for Manitoba to:
| ● | | eliminate waste and duplication; |
| ● | | reduce program costs and enhance service delivery; |
| ● | | improve government operating and administrative process efficiencies; |
| ● | | enable technology to automate processes; |
| ● | | increase organizational governance and internal controls; and |
| ● | | leverage potential opportunities to increase revenues and improve customer service. |
BUDGET 2017 / 27
Eleven key areas of opportunity were identified with savings estimated at over $100 million if all recommended actions are successfully implemented:
| 1. | Rationalization of management and back- office functions resulting from departmental reorganization |
| 2. | Reduction of communications expenditures |
| 3. | Modernization of procurement across government |
| 4. | Reduction of targeted tax credits |
| 5. | Reduction of direct support programs to business |
| 6. | Asset management planning and rationalization, including real estate |
| 7. | Organizational and process transformation in Manitoba Families |
| 8. | Funding for schools and the post-secondary education sector |
| 9. | Capital project management and delivery |
| 11. | Review of agencies, boards and commissions |
Further investigation and business cases were developed for prioritized areas of opportunity. A change management approach and plan was also developed to provide guidelines to assist departments in implementation.
In Budget 2017, we have taken our first steps towards meeting the challenges and embracing the opportunities presented in this review. Significant realignment of non-performing tax credit programs, streamlining and creating single-window access to business development supports, and meeting our early commitment to streamline and reduce senior management in government is already resulting in meaningful improvements that will bend the cost curve over time and build a sustainable financial future for Manitoba.
28 / BUDGET 2017
BUDGET 2017 / 29
Appendix 2: Clinical and Preventive Services Planning for Manitoba
30 / BUDGET 2017
In January of 2017 we received the final report on Provincial Clinical and Preventive Services Planning for Manitoba: Doing Things Differently and Better2 (the ‘Peachey Report’). The overall goal of the Peachey Report was to develop a province-wide plan to improve health services and the health of Manitobans while making the health care system more sustainable.
The Peachey Report’s overall conclusions indicate that the necessary resources and capacity are present and adequate, and that there is an opportunity to reshape health care in an evidence-based and cost-effective manner that will have an overall positive effect on the health outcomes of Manitobans.
The scope of the Peachey Report is comprehensive and reflects consultations with Manitobans and health care providers. It identifies principles that should govern how clinical and preventive services should be planned, many of which mirror the principles identified in the Fiscal Performance Review:
| | |
Transparent | | All aspects of the decision-making process are easily understood or able to be explained |
Patient-centred | | Focuses on the holistic needs of the patient and family as the centre of the health care delivery system Culturally safe and culturally sensitive |
Active, robust provider engagement | | Ensures effective practitioner input |
Reflects population
needs | | Equitable across the geographic and demographic distribution of the population |
Supports access to needed services | | Incorporates local access to core services and additional access to referred services |
Enhanced
quality of care that is affordable now and sustainable in the future | | Consistent with our economic base and annual real growth Applies defined standards for acceptable, appropriate, accessible, efficient, effective and safe care |
Innovative delivery models | | Supports collaborative models of care and role optimization of health professions |
Decision-
making based on evidence | | Requires validated qualitative and quantitative evidence |
| 2 | The Provincial Clinical and Preventive Services Planning for Manitoba report was commissioned in late 2015 and conducted by Health Intelligence and Associates: David K. Peachey (Principal), Nicholas Tait, Orvill Adams and William Croson. |
BUDGET 2017 / 31
The Peachey Report reviewed 10 priority areas within our health care system and provided observations on the current state and recommendations on how care could be improved within each of the following sectors:
| ● | | Emergency medical and health services |
| ● | | Mental health and addictions |
| ● | | Public and population health |
In addition, the report reviewed the health services and unique challenges faced by Indigenous Manitobans and provided recommendations for improved service and outcomes.
The Peachey Report described the challenges of the current governance system in health and the need to clarify the respective roles of Manitoba Health, Seniors and Active Living, the regional health authorities and the service providers. It reviewed the evolution of digital health and the need to focus the investments in this sector towards the priorities identified in the clinical and preventive services plan.
Similar and complementary challenges and opportunities were also identified, and further explored in the Health System Sustainability and Innovation Review.
32 / BUDGET 2017
BUDGET 2017 / 33
Appendix 3: Factors Affecting Emergency
Department Waiting Room Times in Winnipeg3
| 3 | Factors Affecting Emergency Department Waiting Room Times in Winnipeg by Malcolm Doupe, Dan Chateau, Shelley Derksen, Ricardo Lobato de Faria, Joykrishna Sarkar, Ruth-Ann Soodeen, Scott McCulloch, and Matt Dahl. Manitoba Centre for Health Policy, University of Manitoba. 2017. |
34 / BUDGET 2017
The objectives of this report, carried out by researchers at the Manitoba Centre for Health Policy at the University of Manitoba, was to identify factors which affect wait times in the City of Winnipeg’s emergency department waiting rooms. It analyzed Emergency Department Information System (EDIS) data and the factors on which that data is provided.
The report identifies three determinants of emergency department wait time:
| ● | | Input Factors: Volume of incoming patients, which it concluded have a relatively low impact on wait times; |
| ● | | Throughput Factors: Provider supply and number/ type of diagnostic tests performed, which it found have a high impact on wait times; |
| ● | | Output Factors: Number of emergency department patients waiting to be admitted to an inpatient hospital bed and the hospital’s admission capacity, which have a medium impact on wait times. |
The report reviews factors affecting emergency department wait times with a focus on the capacity of EDIS use to provide information on the variety of factors that impact the length of an emergency department visit. The authors describe a unique approach for analyzing input, throughput and output factors differing from previous analyses in treating throughput and output separately. It concludes that by breaking out the throughput factors and seeking additional data, improvements can be made to the flow of these factors and reduce waits.
BUDGET 2017 / 35
Appendix 4: Health System Sustainability
and Innovation Review
36 / BUDGET 2017
OVERVIEW OF MANDATE AND PROCESS
The independent Health System Sustainability and Innovation Review (Health Review) was undertaken to better understand how the cost curve in relation to the growth in health care funding could be bent, to improve the efficiency and effectiveness of health care services, so the health system is sustainable and supports improved health outcomes for Manitobans. The current organizational structure of the Winnipeg Regional Health Authority (WRHA) was included in the review to further support reflections on the current structure of the provincial health system, including Manitoba Health, Seniors and Active Living (MHSAL).
The in-scope spending for the review was approximately $6 billion, representing approximately 45% of the total Manitoba government budget for program expenditures. Over 300 specific cost improvement opportunities were identified in the first phase of the Health Review, in part through ideas put forward during over 70 stakeholder engagement sessions, on-line surveys of front-line service providers and research based on leading global practice. These were grouped into 11 key areas of opportunity.
To effectively measure financial performance, the following two lenses were applied:
| 1. | Allocative Efficiency: the extent to which limited funds are directed towards the right mix of health services. In other words, doing the right things. |
Measuring allocative efficiency includes assessing the services we currently invest in and identifying services that require further investment. This approach evaluates health care programs and services to identify the optimal focus and degree of investment. In health care, this also relates to the proportion of care appropriately provided in acute care settings as opposed to community and primary care settings.
| 2. | Technical Efficiency: the extent to which a health care provider is securing the minimum cost for the maximum quality. In other words, doing things the right way. |
Technical efficiency is an operational performance assessment that measures the degree to which resources are being wasted and assessing the health system’s capability to optimize those health care services already provided through various means of quality improvement.
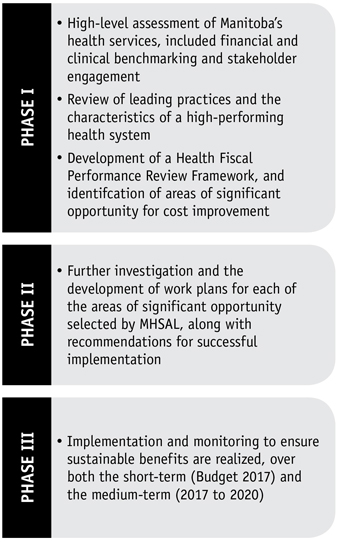
The review was undertaken in two phases, with our government committing to undertake a third phase with our partners in the health sector.
HEALTH SYSTEM CURRENT STATE ASSESSMENT
When compared against four other provincial jurisdictions4, Manitoba spent 23% more than it would have at Ontario’s per capita rate and 26% more than it
| 4 | British Columbia, Alberta, Saskatchewan and Ontario |
BUDGET 2017 / 37
would have at British Columbia’s rate. These findings are even more concerning when compared to our per capita spending in 2003, which was in line with both Ontario and British Columbia. Over the following 13 years, from 2003 to 2016, Manitoba’s health expenditures per capita increased by 72%5.
Ontario and British Columbia have been more successful in constraining cost increases by incorporating improvements from similar evaluations. However, reforms that have occurred in other provinces, such as consolidation of services, a shift to a patient-centered, commissioning-based model and funding reform have not yet occurred in Manitoba.
Other findings of the Health Review include:
| ● | | Most health care programs and services in Manitoba have not been subject to a systemic cost review in a very long time. |
| ● | | Manitoba spent more on “other institutions”, which includes personal care homes, than it would have at the per capita rates of any of the comparator provinces. |
| ● | | Manitoba spent less per capita on physicians than Ontario, Saskatchewan and Alberta. |
| ● | | Lengths of acute care stay in Manitoba are typically significantly longer than the average of their Ontario peers. |
Most notably, and notwithstanding the substantial increased spending from 2012 to 2016, Manitoba’s health services did not improve and productivity declined:
| ● | | emergency department expenses increased by 21% while total visits decreased by 2%; |
| ● | | operating room expenses increased by 8% while total visits decreased by 2%; and |
| ● | | overall hospital costs increased by 15% while patient days decreased by 1%, representing an increase in cost per patient day of 17%. |
| 5 | National Health Expenditure Trends 1975-2016 (Health System Sustainability and Innovation Review: Phase 1 Report). |
FUTURE STATE:
OPPORTUNITIES FOR IMPROVEMENT
The second phase of the Health Review focused on the development of work plans for seven prioritized areas of opportunity for cost and service improvement:
Opportunity #1
| | | | |
Strategic system realignment | | Realign and focus the roles and responsibilities between the MHSAL, the regional health authorities and facilities. | | |
| | |
| | Establish province-wide programs with consistent service standards, codes of practice, standard work and consistent measurement frameworks. | | |
FINDINGS
| ● | | There is currently no comprehensive framework in place across the health care system that codifies the mandates, accountabilities and roles of MHSAL, health authorities or providers. |
| ● | | The organizational structures of the health care system are complex for a province of our size, leading to misalignment and duplication of roles and functions across eight health authorities, five regional health authorities and multiple provider boards. |
| ● | | The structure of the Regional Health Authority Act, current operating agreements and service delivery frameworks/practices codify independence and autonomy of regions and sites instead of encouraging performance as part of a province-wide system, including poorly defined performance metrics and service expectations. |
| ● | | Alignment of planning, core service delivery and clinical delivery programs is required to improve |
38 / BUDGET 2017
| | effectiveness and resource utilization, but many health leaders are concerned about further centralization because of a bias to local delivery and/or because of their experience with poor centralized execution. |
Opportunities #2 and #3
| | | | |
| | |
Funding for performance | | Establish commissioning and performance-based funding model along with expenditure management programs | | |
| | |
Infrastructure rationalization | | Develop long-term infrastructure strategy aligned with health care priorities | | |
FINDINGS
| ● | | Funding for health care programs and services remains largely based on historic global budgets not linked to population need and with limited incentives to improve quality and efficiency. |
| ● | | The structure of current operating agreements and service delivery frameworks encourage independence and autonomy of regions and sites instead of encouraging performance as part of a province-wide system. |
| ● | | Funding conditions are not consistently defined between funding authorities to achieve a co-ordinated set of outcomes. Moreover, the funding model incorporates direct and indirect funding support to many organizations thereby impeding delivery capability and prevents meaningful transformation activity. |
Opportunities #4 and #5
| | | | |
| | |
Insured benefits and funded health programs | | Benefits and funded programs should be in alignment with Canadian standards | | |
| | |
Core clinical and health care services | | Shift from acute care to community care, review procurement and transportation program reduce variability of care and length of stay | | |
FINDINGS
| ● | | The planning and development of health care services, including the development of facilities, has not been based on a provincial clinical services plan and evidence-based care, resulting in suboptimal development and use of clinical facilities. |
| ● | | Manitoba’s health care system is centred around acute care delivery and provider centred care, which restricts the development of alternate delivery models that emphasize community or preventative care or strategies. This limits opportunities to pursue integrated delivery with alternate cost structures. |
BUDGET 2017 / 39
Opportunity #6
| | |
| |
Integrated shared services | | Identify functions that can be delivered better under a shared service model, including consolidation of health supports and administrative services |
| |
| | Align community level delivery with advanced facilities and sites |
FINDINGS
| ● | | While some corporate functions such as shared services in finance, human resources and laundry have been consolidated at the WRHA level, other functions remain dispersed across WRHA sites. |
Opportunity #7
| | | | |
| | |
Health care work force | | Improving the overall framework for managing the health care work force, including addressing the fragmentation of the complexity and number of bargaining units | | |
FINDINGS
| ● | | The large number of bargaining units has a significant impact on organizational performance, restricting the ability to operate as an integrated system. |
WHAT WE LEARNED
Significant system performance gains cannot be achieved without structural and organizational reform, including the development of a commissioning framework and funding reform. Stakeholders are hoping that this review will establish an agenda for bold structural change and will support strategies that address long-standing barriers to system performance even if this requires some level of compromise. The effort to engage stakeholders in system-wide delivery and integrated service planning are viewed as a positive sign of change.
40 / BUDGET 2017
Budget Paper A
ECONOMIC REVIEW AND OUTLOOK
ECONOMIC REVIEW AND OUTLOOK
| | | | |
| CONTENTS | | | | |
| |
INTRODUCTION | | | A1 | |
| |
GLOBAL ECONOMY | | | A1 | |
| |
CANADIAN ECONOMY | | | A4 | |
| |
MANITOBA ECONOMY | | | A5 | |
| |
MANITOBA OUTLOOK | | | A15 | |
| |
MANITOBA FINANCE SURVEY OF ECONOMIC FORECASTS 2017f–2018f | | | A17 | |
BUDGET 2017 Economic Review and Outlook / A1
INTRODUCTION
Economic growth in Manitoba is expected to improve this year as several indicators are pointing towards improving economic activity. The gains, however, are expected to be modest and gradual as demand conditions grow and momentum builds in other provinces and in international markets.
Over the last three years, low primary commodity prices, national and international developments clearly slowed growth in Canada and in Manitoba. They contributed to a rapid drop in capital spending, a decline in export demand and a loss in productive capacity with regards to the unprecedented wildfires in Alberta. These factors kept growth in Canada and Manitoba well below historical annual average rates.
In Manitoba, real exports declined for two consecutive years, reflecting slowdowns in several manufacturing industries and in wholesale trade. Sales from Manitoba’s petroleum and agriculture sectors were affected by the drop in commodity prices, despite higher production volumes for several commodities.
Other indicators are showing improvement. Retail sales, for example, accelerated in 2016 as the province marked a long-term record in annual population increase. Manufacturing sales turned around with a modest increase in sales compared to the decline in 2015. Last year, as construction started on several large commercial properties, the value of building permits in the province increased by 13.5%.
More recently, the housing market saw a large jump in the number of housing starts in the first two months of 2017. Similarly, over the same two months, the labour market added 4,700 jobs compared to a decline in jobs in 2016.
Reflecting the improvement in Manitoba and the momentum in Canada and the U.S., the Manitoba Finance Survey of Economic Forecasts shows real GDP increasing by 2.0% in both 2017 and 2018. Manitoba’s expected growth in 2017 and 2018 matches the national average forecast and is ranked fourth highest among provinces in both years.
Manitoba Real GDP Growth, 2011–2018f
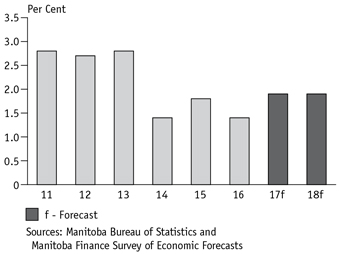
Improving from a slower pace, the expected medium-term growth is below the 2.4% annual average growth achieved over the past 20 years. Employment is expected to increase at a modest 0.7% growth rate in 2017 and 0.8% in 2018.
Even with the positive trend in Canada and the U.S., uncertainty remains elevated from the ongoing spillovers from previous global shocks and potential new repercussions from any broad policy measures from the new U.S. administration and from U.K.’s exit from the European Union. These factors pose both upside and downside risks to the outlook.
GLOBAL ECONOMY
After advancing by over 5% annually from 2003 to 2007, global economic growth slowed in the last five years. The repercussions from the U.S. subprime crisis, the European sovereign debt crisis, the slowdown in Emerging Market Economies, and more recently the rapid deflation in oil and base metal prices are still being absorbed. These shocks have increased indebtedness, reduced job creation, slowed income growth, and lowered demand for goods and services within countries and across borders.
A2 / Economic Review and Outlook BUDGET 2017
Increasing anti-globalization and anti-free trade sentiment in several advanced economies has come into sharper focus with Great Britain’s decision to leave the European Union (BREXIT) and the election of a new administration in the U.S.
Limited restrictive trade policies and trade disputes are not new. According to World Trade Organization statistics, 1,583 trade-restrictive measures have been implemented by G20 nations since 2009. However, dismantling comprehensive trade agreements is unprecedented and raises concerns about the outlook for global trade.
Affected by these factors, global demand remains weak despite aggressive monetary easing by many central banks around the world. However, there are signals of strengthening momentum in economic activity, particularly in the U.S. This is fueling an improvement in consumer and business confidence, and has led to a modest improvement in the outlook.
In its latest World Economic Outlook, the International Monetary Fund (IMF) forecasts global growth to expand by 3.4% in 2017 and increase further by 3.6% in 2018. This is up from 3.1% in 2016 and 3.2% in 2015. Led by
the U.S., growth in advanced economies is expected to improve to 1.9% in 2017 and 2.0% in 2018. As Russia and Brazil emerge from recessions in 2017, overall growth in emerging market and developing economies is expected to increase by 4.5% in 2017 and 4.8% in 2018.
Posting an average annual growth rate of 2.1% since the Great Recession, the American economy has grown well below its historical growth norm of 3.5%. Fundamentals point to stronger growth going forward. The U.S. labour market is tight, with the unemployment rate currently at 4.7%. Several labour compensation indicators are currently near pre-crisis levels, including average hourly earnings of all total private employees at 2.8% year-over-year.
At an annualized pace of 17.6 million units, automobile sales are well above pre-crisis levels. Existing home sales have sharply rebounded to 5.69 million units in January 2017, growing at their fastest pace in almost a decade.
Policy choices by the new U.S. administration on personal and corporate taxation, deregulation, international trade and fiscal stimulus will materially change the outlook for the U.S. economy.
Global, Advanced Economies and Emerging Market Developing Economies Real GDP Growth, 2011–2018f
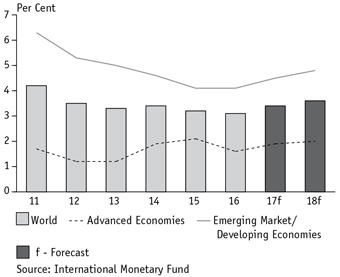
U.S. Real GDP Growth,
2011–2018f
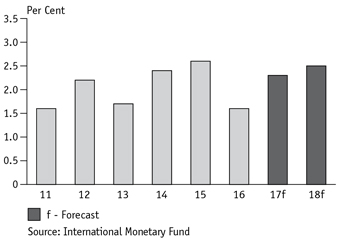
BUDGET 2017 Economic Review and Outlook / A3
China is Manitoba’s second-largest trading partner. Economic growth in China rapidly expanded after China joined the World Trade Organization. The expansion boosted demand for raw materials from across the globe, including Manitoba. In the post-recession period, as exports slowed, China focused on monetary and fiscal stimulus policy to boost domestic demand.
This transition has resulted in high indebtedness and heightened risks of broader credit default. Inflation has also picked up, resulting in higher labour costs and a lowering of China’s competitive advantage in
China Real GDP Growth,
2011–2018f
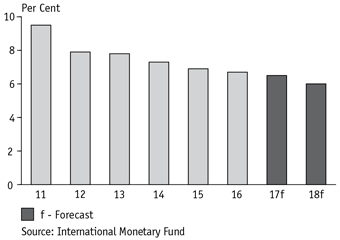
production costs. Given the downward pressures in the domestic economy, Chinese economic growth is expected to moderate to 6.4% in 2017 and ease further to 6.3% in 2018, down from 6.6% in 2016 and 6.9% in 2015.
Japan is Manitoba’s third-largest trading partner. Japan has struggled with low growth and deflation for well over two decades. Ageing population and slow growth in wages and salaries are other factors contributing to anemic economic growth conditions. Despite the best efforts of the Bank of Japan, increasing private consumption remains a challenge.
In 2016, the Japanese economy expanded at an annualized pace of 1.0% compared to 1.2% in 2015. More importantly, private consumption, which accounts for nearly 60% of the Japanese economy, grew at a modest 0.4% annual rate. The recent depreciation of the currency has provided some support to the economy. Growth in Japan is expected to remain relatively unchanged at 0.8% in 2017 before slowing to 0.5% in 2018.
Mexico is Manitoba’s fourth-largest trading partner. The Mexican economy is being impacted by increasing uncertainty from any pending U.S. international trade and immigration policy choices. The currency has already retreated by around 20% against the U.S. dollar in the last 12 months prompting the Mexican central bank to increase its target policy interest rate several times. Reflecting these pressures, the IMF has downgraded Mexico’s 2017 and 2018 economic growth forecast by 0.6% – the IMF now foresees the Mexican economy growing by 1.7% and 2.0% in 2017 and 2018, respectively.
The euro area economy slipped into a recession in the years following its sovereign debt crisis. Growth appears to be stabilizing. The IMF is forecasting real growth rates of 1.6% in both 2017 and 2018, lower than the 2.0% and 1.7% registered in 2015 and 2016, respectively. Labour markets have improved materially and the unemployment rate has dipped below 10% for the first time since 2009, but the youth (18-24 year olds) unemployment rate still remains around 20%.
Euro area-wide core inflation, a good gauge of underlying price pressures, continues to be well below the European Central Bank’s (ECB) target rate of 2.0%. The ECB, citing reduced deflationary pressures, has embarked on a very gradual path of normalization by reducing its asset purchase program from €80 billion to €60 billion/month. Partly in response, government bond yields have risen across the common currency area.
A4 / Economic Review and Outlook BUDGET 2017
Euro Area Real GDP Growth,
2011–2018f
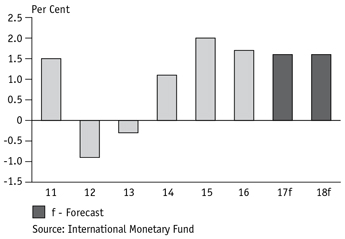
CANADIAN ECONOMY
The contraction in the Canadian economy during the Great Recession was one the shortest and shallowest among the Group of Seven (G7) industrialized economies. The recovery was underpinned by the relatively quick turnaround in commodity prices. However, the collapse of commodity prices in mid-2014 sent the Canadian economy into a recession in the first half of 2015.
Real capital investment has subtracted from economic growth in every quarter since the third quarter of 2014. The decline in capital spending was especially severe in the energy sector, dampening overall real GDP growth to 0.9% in 2015.
As a proactive move to support the contracting economy, the Bank of Canada (BoC) lowered its main policy rate by 0.25% in January 2015. Recognizing that the downside risks to the economy were more widespread that it had initially anticipated, the BoC cut the interest rate by a further 0.25% in July 2015.
This narrowed the Canada/U.S. interest rate differential and prompted a rapid depreciation of the Canadian dollar to US$0.69 in January 2016. As oil prices firmed, the Canadian dollar recovered and has traded between US$0.74 and US$0.77 for much of the last 12 months.
Canada Real GDP Growth,
2011–2018f
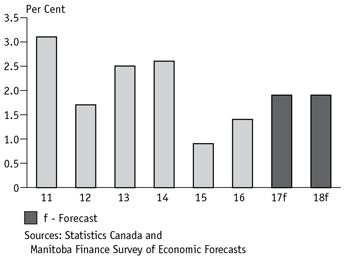
In the U.S., improving economic conditions led the Federal Reserve to reverse their monetary policy stance. Following a pause since December 2008, the Federal Reserve raised their target rate on three occasions in the last 15 months with a possibility of two more hikes in 2017. The now, higher interest rates in U.S. will add downward pressure on the Canadian dollar and may compel the BoC to start increasing interest rates in Canada.
The Canadian economy rebounded in 2016, but annual growth was pulled down by lower business investment in non-residential structures, which posted its second consecutive year of double-digit decline in growth. The decline in non-residential investment was mainly due to weakness in the energy sector. Corporate profits decreased by 4.5% in 2016 and followed a 19.5% drop in 2015. Labour income increased by 2.5%, the smallest increase since the 0.9% decline recorded in 2009.
Employment increase of 133,300 jobs in 2016 came in lower than the 144,400 increase registered the previous year. The average unemployment rate inched up by one-tenth to 7.0% in 2016, and six out of ten jobs created were part-time jobs. The number of hours worked in the economy increased by just 0.8% in 2016.
BUDGET 2017 Economic Review and Outlook / A5
These annual statistics, however, mask the underlying momentum in the economy in the second half of 2016. The labour market created 235,000 full-time jobs in the second half of last year and a further 187,000 full-time jobs were added in the first two months of 2017. Labour income increased by 1.8% in the fourth quarter after declining in the third quarter.
Household incomes were supported by employment income and by the enhanced Canada Child Benefit introduced by the federal government as a part of the fiscal stimulus in Budget 2016. With the boost in incomes, growth in household disposable income outpaced the growth in household consumer spending, bumping up the household saving rate slightly from 5.0% in 2015 to 5.3% in 2016.
There are signs of a modest recovery in the energy sector as oil prices firmed somewhat after the Organization of the Petroleum Exporting Countries and other key oil producers decided to cut production. The latest Business Outlook Survey from the BoC indicates an increase in capital spending intentions in 2017.
The strengthening U.S. economy combined with a competitively priced Canadian dollar should spur Canadian exports in 2017. In addition, measurable gains from the federal government’s multi-year fiscal stimulus program, which includes a 10-year, $120 billion infrastructure spending plan covering a wide variety of projects, ranging from public transit to green infrastructure to social housing, is also expected to boost growth in the medium term.
These positive factors are raising the economic growth forecast for Canada over the medium term. The average of growth projections from the Manitoba Finance Survey of Economic Forecasts indicates 2.0% growth in both 2017 and 2018.
Low commodity prices kept inflation relatively low in the past two years at 1.1% in 2015 and 1.4% in 2016. With economic activity forecast to improve, consumer prices are expected to increase by 2.1% in 2017 and by 2.0% in 2018, closely matching the BoC’s target rate.
Reflecting the slack in the economy, employment is expected to increase by a moderate 1.1% in 2017 and 0.9% in 2018.
MANITOBA ECONOMY
The Manitoba economy has a relatively well-balanced industrial base. The majority of industrial sectors in the province are medium–sized, each contributing over 5% to total value-added output. This provides a noticeable level of economic stability. Over the last 20 years, the compounded average annual growth in real GDP, real exports and employment was the most stable in Canada.
Manitoba GDP By Industry Shares, 2015
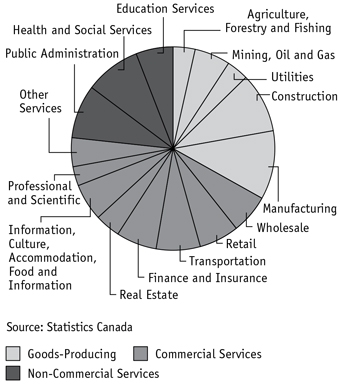
As with most jurisdictions in Canada, the numerous global economic, financial and commodity price shocks over the past decade have slowed the pace of average annual growth. However, due to industrial diversity within the province, a balance in interprovincial and international export, strong population growth, high
A6 / Economic Review and Outlook BUDGET 2017
labour force participation, low unemployment rate and the lowest household debt per capita among provinces, Manitoba’s annual real GDP growth consistently ranks high in Canada, despite the slower pace of growth.
In 2016, Manitoba’s real GDP grew by 1.4% after a gain of 1.8% in 2015 and 1.4% in 2014. Combined over three years the economy expanded by 1.5% annually, well below the 2.4% average annual growth achieved in the last 20 years. Manitoba’s real GDP growth in 2016 matched the national average and ranked fourth among provinces.
Growth in 2016 was supported by household spending, capital investment in engineering construction and fewer imports and offset by a decline in exports, reduction in residential capital investment, and decrease in spending on machinery and equipment.
Manitoba’s inflation rate averaged 1.3% in 2016, up marginally from 1.2% in 2015. Consumer prices for clothing and footwear fell by 2.9% last year, while food prices increased by 0.3%. Alcohol and tobacco, transportation, shelter and household operations prices increased above the 1.3% average.
Population
Manitoba is experiencing a population boom. Over the last seven years, Manitoba’s population increased by over 1.0% per year. Manitoba exceeded Canada’s population growth in each of the last six years. The higher rate of population growth is a key factor in supporting overall economic growth in Manitoba, directly lifting retail sales, housing demand and labour supply.
In 2016, Manitoba’s population was estimated at 1,318,128 persons, an increase of 1.7%. This was the second highest growth rate among Canadian provinces. Population increased by 22,147 persons, the largest annual increase ever. The 2016 population estimate is as of July 2016, which is considered to be the annual population for the calendar year.
Population Growth, Manitoba and Canada, 2007–2016
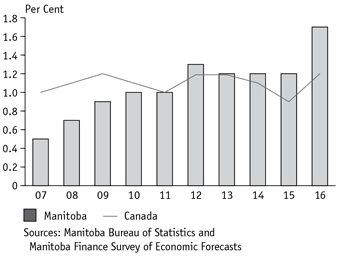
Statistics Canada releases population estimates, on a quarterly basis. The fourth quarter of 2016 was the latest available and shows population at 1,328,346. Population increased by 1.7% or 21,859 persons from a year earlier – the highest annual growth rate among provinces.
The significant increase in the population base can largely be attributed to the Manitoba Provincial Nominee Program. This program provides a broad framework to recruit and nominate skilled workers and business immigrants who have a strong likelihood of becoming successfully established and make a positive contribution to the province. This program helps coordinate business, labour and government interests in expanding employment and business enterprises in Manitoba through immigration.
In October 2016, Manitoba set a new all time 12-month record for international immigration, with 17,392 persons arriving. An increase in the number of births is also lifting population estimates. Supported by immigration and the echo boom generation maturing into the prime child rearing age cohort, the number of births increased by over 17,600 in 2016, the highest number of births since 1972.
These same factors are stabilizing Manitoba’s median population age. Since 2009, the Manitoba median
BUDGET 2017 Economic Review and Outlook / A7
population age stopped increasing and in 2014 it fell by 0.1 of a year and fell again last year by 0.2 of a year. In contrast, the Canadian median rate has continued to increase. In 2016, Manitoba’s median age was 37.5 years, third lowest among provinces, and was also below the 40.6 years national average.
The population growth forecast for Manitoba remains positive. Manitoba Finance’s survey of demographic forecasts highlights this encouraging trend, with population increases projected at 1.4% and 1.3% in 2017 and 2018, respectively.
Retail Sales
Strong population growth continued to buoy retail activity in Manitoba as consumer spending advanced at its quickest pace in six years. Retail sales rose by 4.4% in 2016, an improvement from the 1.5% increase recorded in 2015. Manitoba’s retail sales growth was fourth best among provinces and better than the national increase of 3.7%.
The annual value of retail sales surpassed $19 billion for the first time ever with monthly sales averaging close to $1.6 billion. Manitoba’s retail sector employed just over 70,000 workers in 2016, an increase of 3.1% from 2015.
In 2016, retail sales rose on the strength of health and personal care stores (18.8%), motor vehicles (5.5%), department stores (5.2%), sporting goods (3.5%) and clothing (3.0%).
The three largest sectors (motor vehicle and parts dealers, food and beverage, and general and department stores) grew by a combined 4.2% in 2016, almost double the 2.3% growth in 2015. These three sectors together make up 62% of all retail sales provincially.
Motor vehicle sales and services represent 26% of all retail sales in Manitoba. Following a national pattern, sales of new trucks and SUVs have been gaining market share of all new vehicle sales in Manitoba, representing 75% of all sales in 2016. Truck and SUV sales increased
Manitoba Retail Sales,
Quarterly at Annual Total Sales
First Quarter 2014 – Fourth Quarter 2016
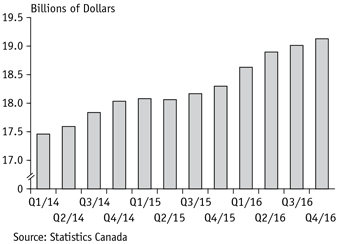
by 2.5% in 2016 to 43,045 units. Passenger car sales declined for the third consecutive year falling by 10.0% in 2016 (14,383 units) after an 8.8% decline in 2015 and a 7.2% decline in 2014. The total value of new car sales last year in Manitoba increased 6.3% to $4.0 billion and follows a 5.9% increase in 2015.
The retail sector seems poised for growth over the medium term with continued strong population growth, rising employment, stable economic growth and an increasing variety of new retail merchant stores opening in the province for the first time. For example, the opening this year of the Outlet Collection Winnipeg mall, a $200 million dollar premium fashion outlet mall, will expand the type of shopping experience available in Manitoba and draw residents and visitors from neighbouring provinces and U.S.
Housing
Capital investment in housing is an important component of the Manitoba economy. In 2016, residential capital investment amounted to $3.7 billion, or 5.5% of nominal GDP. While its share of total provincial expenditures has somewhat diminished from all-time highs of 6.2% of GDP, recorded during the housing peak years of 2012 and 2013, the housing
A8 / Economic Review and Outlook BUDGET 2017
sector nonetheless is a key contributor to the provincial economy. Average employment in the construction sector, of which housing is a major part of, was 47,100 workers, or 7.4% of the provincial labour force. Weekly earnings in the construction sector averaged $1,144 in 2016, placing it fifth among industries.
Underpinned by a number of favourable factors, housing construction surged in the early post-Great Recession years, reaching 7,465 housing starts in 2013, which was also the highest level recorded since 1987. Some of the factors that contributed to the housing boom include: strong employment and wage gains, strong population growth, historically low mortgage rates, affordable housing and low rental vacancy rates.
Motivated by the low vacancy rate, residential developers focused their attention on adding multi-family housing units during the boom years. As a result, multi-family housing units’ share of total homes built rose from an average of 33% in 2007 and 2008, to nearly 50% between 2012 and 2016.
The rapid pace of expansion in construction of new homes led Canada Mortgage and Housing Corporation (CMHC) to conclude that the housing boom in 2013 generated an overhang of inventory in the province and
Manitoba Housing Starts
Single Detached and Multiple Units
First Quarter 2011 – Fourth Quarter 2016
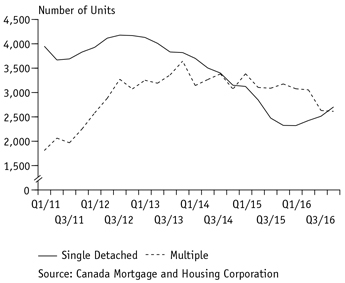
that the market was due for a slowdown. New housing construction did decrease for the next three years, with the number of higher value-added single detached units declining faster than the number of multiple units.
In 2016, the housing market for single detached units reached a balance, with the number of single detached units starting a rebound. Total single detached units increased by 16% in 2016, while the number of multiple units declined by 18% in 2016.
Concerned by the rapid increase in property values in certain jurisdictions and by high indebtedness among Canadian households, the federal government introduced a number of policies in October 2016 to cool the Canadian housing market, including increasing the qualifying interest rates for mortgage approvals and tightening rules on capital gains tax exemption from the sale of a principal residence. According to CMHC, the impact from these measures is difficult to evaluate as potential buyers may substitute for lower priced homes, increase the down payment or exit the housing market altogether.
Housing in Manitoba is one of the most affordable in Canada, as evidenced in the Royal Bank of Canada’s Housing Affordability Index. Comparing 14 major urban markets in Canada, they rank Winnipeg as the fifth most affordable place to live in both single-family and condominium categories. In addition, based on Bank of Canada’s information from chartered banks, Manitoba has the lowest mortgage debt per person in Canada. Given the high affordability of housing and relatively low debt liability, there is reason to be cautiously optimistic that the impact of the federal government’s mortgage rules on the provincial housing market will be limited.
Capital Investment
Capital investment growth in Manitoba moderated to 1.4% in 2016, down from 5.0% in 2015. An increase in expenditures on non-residential structures was offset by a reduction in spending on machinery and equipment, and residential properties.
BUDGET 2017 Economic Review and Outlook / A9
Due to completion of several major building projects, investment on non-residential structures slowed to 8.7% in 2016 compared to 17.6% in 2015. Building permits information indicates that a rebound in investments is well underway with construction of the $400 million True North Square, a mixed-use development complex in downtown Winnipeg, and other commercial building projects.
In 2016, the value of non-residential building permits issued in Manitoba increased by 30.1%, with industrial permits up 69.3%, commercial up 30.4% and institutional up 7.6%. Since the second quarter of 2016, total capital spending on building construction increased by 6.3%.
Following the depreciation of the Canadian dollar, spending on machinery and equipment declined for the second consecutive year after a 10.4% gain in 2014. Total spending was down by 3.9% in 2016 following a 1.6% decline in 2015.
According to Statistics Canada’s investment intentions survey, private sector capital spending is expected to increase by 2.0% in 2017. Capital spending in the transportation and warehousing sector is expected to increase by 13% or $160 million, while spending in the mining and petroleum sector is expected to increase by 26% or $110 million. Investment in the wholesale trade sector is expected to decline by 56% in 2017 after increasing by 29% annually over the last five years.
Labour Market
Consistent with strong population growth, and for the first time in its history, Manitoba’s working age population surpassed the million person mark with a labour force that is now over 676,000 workers. Individual engagement in the labour market is high with the participation rate averaging 67.2%, third highest among provinces and above Canada’s rate of 65.9%.
With economic growth moderating, employment growth was relatively flat in 2016, down by 2,600 jobs after increasing by 9,700 jobs in 2015. Similarly to Canada,
Manitoba Employment Trend,
Three-Month Moving Average Employment
February 2015 – February 2017
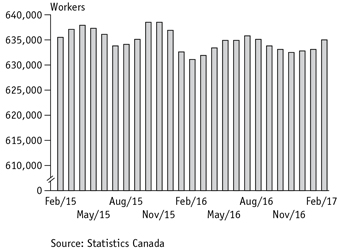
the labour market in the province has been gaining strength in the latter part of 2016 and is continuing into 2017.
On a year-to-date basis in February 2017, employment is up by 6,200 jobs, or 1.0% higher than 2016. Full-time employment increased by 6,700 jobs and part-time employment fell by 500 jobs. Manitoba’s unemployment rate averaged 6.0%, the second lowest among provinces and below Canada’s unemployment rate of 6.7%.
Over the same period, the number of service sector jobs increased by 4,700, while the number of goods-producing sector jobs increased by 1,600. Finance, insurance, real estate and leasing industries has the largest gain in jobs at 5,100 followed by professional, scientific and technical services jobs at 1,800. Recovering from a sharp loss in late 2014 and early 2016, employment in mining, oil and gas is up by 1,100 jobs in 2017.
Employment has declined in business, building and other support services (1,100 jobs), educational services (900 jobs), and accommodation and food services (900 jobs).
The benefits of industrial diversity can be observed in the labour market. Manitoba has the most stable
A10 / Economic Review and Outlook BUDGET 2017
labour market among provinces, averaging the lowest level of annual fluctuation in employment growth over the long term. Annual employment growth averages around 1.0%. The province is generally among the top three in Canada with the lowest unemployment rate and the top three with the highest rate of labour force participation.
Manufacturing
Manufacturing is the largest industrial sector in Manitoba, accounting for 10% of provincial GDP and 10% of employment. The sector generated $17.4 billion in nominal sales and added $3.1 billion to wages and salaries in 2016. Manitoba is one of four provinces in Canada that had more manufacturing workers in 2016 compared to the low in 2010.
Manitoba’s manufacturing sector, like the overall economy, is relatively diverse. The largest industry in manufacturing is food processing, which provides a broad range of products, such as processed meat and potato products, milled grain and oilseeds, dairy products and industrial agricultural feed. The second-largest industry is transportation equipment, which is comprised of aerospace products and parts manufacturing, and motor vehicle body and trailer manufacturing.
Other notable industries within manufacturing include machinery equipment (agricultural implements), primary metals, chemicals (pharmaceuticals and agricultural), fabricated metal products (structural steel), wood products (cabinets, millwork and lumber), printing, and electrical equipment (industrial and hydroelectric transformers, and electronic components).
Most manufactured products from Manitoba are exported to international and interprovincial markets. The decline in profitability and incomes in many sectors that followed the drop in commodity prices in 2014 clearly reduced capital spending and demand for manufactured products.
Manufacturing sales turned around in the second half of 2015 and advanced at a moderate pace in 2016. Total
Manitoba Manufacturing Sales,
Quarterly at Annual Total Sales
First Quarter 2014 – Fourth Quarter 2016
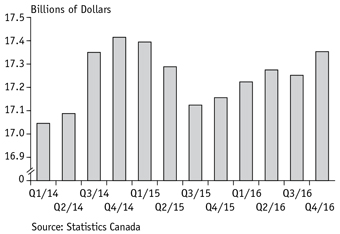
sales increased by 1.3% with sales of durable goods increasing by 1.1% and sales of non-durables increasing by 1.7%. Last year, the increase in manufacturing sales was led by wood products (30.3%), printing (5.1%) and processed food products (4.1%). Fabricated metal product sales edged up 1.8%, as investment in construction of new buildings turned around in mid-2016.
Supported by steady U.S. demand for urban transit and inter-city buses and global demand for passenger aircrafts, transportation equipment sales remained unchanged at $2.8 billion in 2016. Falling agriculture commodity prices and trade related issues impacted demand for Manitoba made tractors and harvesting equipment. As a result, machinery equipment sales declined by 1.4% in 2016 and followed a 12.7% drop in 2015. Chemical sales decreased 3.7%, as increased pharmaceutical sales were offset by weak basic chemical and fertilizer sales.
Mining and Petroleum
The mining, quarrying and petroleum extraction (mining and petroleum) sector makes up the largest primary resource sector of the Manitoba economy. The sector contributed $3 billion, or 5.4% of provincial real GDP output in 2015. Mining and petroleum companies
BUDGET 2017 Economic Review and Outlook / A11
spent, on average, almost $1 billion annually on capital projects since 2009.
Mining and petroleum can be divided into three broad categories: metallic minerals, industrial minerals and petroleum. The principal metallic minerals mined in Manitoba are nickel, copper, zinc and gold. Industrial mineral production consists principally of sand and gravel, stone, peat moss, lime, as well as granite, gypsum and limestone. The petroleum industry produces a light sour blend of crude oil that is exported via pipeline and by rail to refineries in eastern Canada, and the northeast and north-central areas of the United States.
The collapse of oil prices in 2014 had a significant impact on the mining and petroleum sector in Manitoba. Prior to the oil price drop, total value of mining and petroleum was relatively stable from 2011 to 2014 averaging $3.1 billion a year in nominal dollars. The 56% plunge in oil prices from the 2013 average to the 2016 average contributed to a reduction in both the volume and value of crude oil production in the province. The volume of oil production fell from an all-time record of 19.3 million barrels in 2013 to 14.7 million barrels in 2016. The value of oil production fell by 42% from $1.8 billion to $750 million over the same period.
Total sales from metallic minerals has been steady in the past four years, averaging $1.1 billion annually, but is lower compared to the peak recorded in 2007 of $2.3 billion. In 2016, the value decreased by 2.1% to $1,090 million. The value of industrial minerals mined has steadily climbed since the mid-1990s and marked a peak in 2015 at $280 million, accounting for 12% of total mining and petroleum that year. In 2016, the value declined to $229 million.
Capital spending in the mining sector was an important contributor to overall economic growth in the early years of the post-Great Recession recovery and grew by a compounded annual growth rate of 45% between 2009 and 2012 to $1.3 billion. As a result of the collapse of commodity prices, capital spending in the mining
Manitoba Value of Mining and Petroleum
Production, 2007–2016
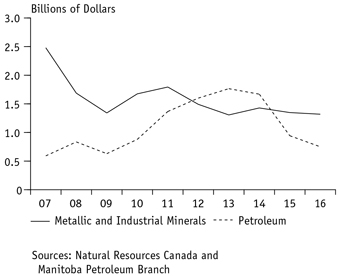
sector also declined sharply between 2014 and 2016. According to a survey published by Statistics Canada, mining companies spent $427.6 million in capital expenditures in 2016. Capital spending by mining companies is expected to break a four-year trend of declines and increase by roughly 26% to $537.2 million in 2017.
The volume of base metal extraction in Manitoba got a boost in 2014 with the opening of two new mines. HudBay Minerals Inc. (Hudbay) officially opened two mines in Manitoba in September 2014: Lalor mine and Reed mine. The Lalor mine, which is located 13 kilometres west of Snow Lake, contains gold, zinc, copper and silver. The Reed mine, located 45 kilometres west-southwest of Snow Lake, is a joint venture between Hudbay and VMS Ventures Inc. and contains mostly copper.
Market conditions for nickel have not been favourable, but extraction levels have been steady in Manitoba. Nickel ore production averaged 26.0 Mt in the past six years. However, prices have fallen by almost 60% since 2011 as global supply outstripped demand, leading to burgeoning inventory. Extraction levels were up 1.7% in 2015. However, the value of nickel production fell
A12 / Economic Review and Outlook BUDGET 2017
by 16% in 2016 to $317.5 million. As the supply and demand conditions continue to balance, future markets are indicating confidence for nickel prices to improve, with the London Metal Exchange’s nickel futures data pointing to steady increases in nickel prices in the medium term.
Copper mining in the province, which held up relatively well in the early years of the post-Great Recession period, fell to a near-term low 30.1 Mt in 2013. Copper mining has rebounded strongly since. The 42.9 Mt of copper mined in 2016 represents a roughly 40% increase compared to 2013 levels and is 8% above 2015 output. Copper prices reached an all-time high of approximately US$9,900/Mt in February 2011, but have steadily declined for much of the next five years. In 2016, copper prices fell by almost 12% from 2015, thereby lowering the value of copper production by 3% to $272.2 million. Similar to nickel, markets are anticipating a modest improvement in copper prices this year, with prices increasing by roughly 20% compared to prices recorded last year.
Zinc mining in the province tumbled in the years following the Great Recession and reached an all-time low of 73.8 Mt in 2011. Zinc ore extraction has rebounded since with 102.2 Mt mined in 2016, close to levels recorded prior to the Great Recession. Market for zinc has been very strong in the last 12 months, with prices rising by roughly 80% to around US$2,700/Mt. There are several reasons to be optimistic about the outlook for zinc, including a supply strain that is likely to continue due to natural depletion and strategic idling of production by large producers. The increase in volume and price drove up the value of zinc production by 36% in 2016 to $275.9 million.
Gold production has been cyclical in the province with an upward trend from 2005 to 2012 followed by a decline. In 2016, 3,104 kilograms of gold was extracted, roughly 45% lower compared to the near-term high of 5,477 kilograms in 2012 and down 4% from 2015. The decline in production closely follows prices, which have declined annually since 2011. However, prices rose by
almost 8% lifting the value of gold production by 7% in 2016 to $166.2 million.
Manitoba has had a long-standing reputation as a desirable destination for mining investment. That reputation was recently solidified by the Fraser Institute’s 2016 Survey of Mining Companies, which found the province the second-most-attractive in the world for mining investment.
Agriculture
Agriculture is an important contributor to the Manitoba economy. Primary agricultural production directly represents 3.0% of provincial GDP. Agriculture has both direct and indirect linkages to food manufacturing, transportation and storage, retail trade, wholesale trade, and finance and insurance. Manitoba has major food production facilities for pork, potatoes, turkey and chicken, oilseeds, grains and dairy. Food production contributes almost a quarter of total manufacturing sales in the province.
Crop production estimates from Statistics Canada indicate that 2016 was another high volume production year for Manitoba grains and oilseeds. Overall production was the second-largest harvest on record after the bumper crop year of 2013.
Many crop producers changed their crop mix for the 2016 season, away from barley, oats and wheat, and more toward soybeans, corn and peas. The growing season opened with an early spring and good precipitation levels for seeding. General weather conditions were good through the early summer months. However, untimely precipitation in late summer and during harvest affected the quality of some cereal crops.
Estimates from Statistics Canada indicate soybean production set a new record, increasing by 27.2% over 2015 and is now the third-largest cash crop behind canola and wheat. Manitoba’s soybean production represents 27.4% of Canada’s total production and is up from just 7.3% a decade ago.
BUDGET 2017 Economic Review and Outlook / A13
Production was also notably up for peas (109.9%), rye (64.9%) and corn (48.4%), and down for oats (-15.5%), barley (-4.6%) and canola (-4.0%). Wheat production was unchanged but despite this, production of Manitoba’s two key crops, wheat and canola, remained above the recent five-year average levels. Manitoba produced 17% of Canada’s total canola production, and 90% of Canada’s processed canola is exported as either seed, oil or meal.
Crop prices remain under pressure, as global inventory of grains and oilseeds are high due to favourable growing conditions. Strong demand has largely offset this supply pressure and Manitoba prices have remained mostly flat for wheat and canola in 2016.
In the livestock sector, Manitoba farmers reported 1.14 million cattle on their farms on January 1, 2017, up 1.3% from January 1, 2016. For perspective, the current inventory is well below 1.49 million cattle which were on farms in January 2005 and 2006, during the bovine spongiform encephalopathy (BSE) outbreak in Canada, and fewer farmers are reporting cattle on their farm. In 2016, only 6,670 farms had cattle, 1% lower than last year.
Total disposition (exports and food processing) of Manitoba cattle and calves rose 2.3% in 2016 compared to 2015, driven by higher processing levels. Total processing numbers increased 20.1% to 69,700 million heads in 2016.
Livestock prices are determined in the North American market. Lower feed costs and better weather conditions has increased the supply in the U.S., thereby prices for calves in Manitoba were down 29% averaging $215.64/cwt, while cow prices were 27% lower, averaging $90.27/cwt compared to 2015. However, the prices remained above the previous five-year average.
Manitoba farmers had 3.1 million pigs on their farms on January 1, 2017, up 1.4% from January 1, 2016. This is the highest inventory for the January reporting period. There were 600 farms reporting pigs on farms, less than 1% higher than last year.
Farm Commodity Price Indices, 2005–2016
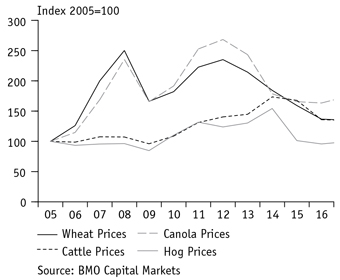
Total disposition of Manitoba pigs declined by 1.2% in 2016 compared with 2015, driven by lower international export levels, which declined 4% from 2015 to 3.16 million head in 2016.
In 2016, prices for hogs in Manitoba were down 3.5% compared to 2015, averaging $157.58/100 kg. These prices were 6.3% lower than the previous five-year average. Contributing to the hog price weakness has been the control of the porcine epidemic diarrhea (PED) virus that has resulted in increasing hog herds in the U.S.
Cattle producers reported a 26.1% decrease in cattle and calves cash receipts in the first three quarters of 2016, compared to the first three quarters of 2015. Manitoba hog producers have seen a decline in receipts over the same period, down 3.2%. The decline in livestock prices has reduced livestock cash receipts in 2016, even with increased marketing. In 2015, Manitoba produced about 30% of Canada’s pigs and is the largest pig exporting province in Canada.
Agriculture Canada estimates that 2016 total farm cash receipts for Manitoba will be $6.0 billion, a 2.4% increase from 2015. Projected estimates of 2016 crop receipts indicate a 14.1% increase to $3.7 billion, while livestock receipts were projected to decline 9.4% to $2.1 billion.
A14 / Economic Review and Outlook BUDGET 2017
The pressure on wheat and canola prices is expected to continue in 2017 as grain inventory remains high from increased global production. The lower value of the Canadian dollar is moderating the impact from low prices.
Lower feed prices, and an improvement in pasture conditions in Texas and other cattle producing states, supported an increase in U.S. cattle numbers. With increased supply, cattle prices are expected to further decline in 2017. The relatively short gestation period for hogs (compared to cattle) allows producers to react more quickly to market signals. Prices are expected to remain relatively stable over the near term as supply and demand conditions become more aligned.
Exports
Global economic, financial and commodity price shocks can directly impact the economy through exports. The ongoing volatility and uncertainty in global trade has lowered real international exports’ contribution to Manitoba’s economic growth. From 2007 to 2016, the share of international exports to real GDP in Manitoba declined from 33% to 27%. In contrast, the share of interprovincial exports has remained relatively stable, declining from 29% to 27% over the same period.
Weaker global demand has had a larger impact on Manitoba’s export volumes compared to interprovincial trade volumes. From 2007 to 2016, annual growth in real international exports slowed to 0.1% compared to 4.0% in the prior nine-year period. Real interprovincial trade, in contrast, slowed to 1.3% from 3.4% annual growth over the same period. Combined, Manitoba’s total real exports slowed to 0.7% annual growth from 3.7% annual growth earlier. The pattern continued into 2016 as real international exports fell by 1.3% and real interprovincial exports increased by 0.3%.
Since Manitoba has the most even export market among provinces with 48% of exports shipped to international markets and 52% shipped to other provinces, the balance derived from the varying growth rates of
international and interprovincial exports provide stability in overall growth in Manitoba. As a result, Manitoba has the most stable growth in real total exports in Canada.
The U.S. is Manitoba’s largest international export destination, accounting for 68% of all merchandise shipments that crossed international borders in 2016. Manitoba’s exposure to the U.S. market is lower than the national average, where 75% of Canadian exports are shipped to the U.S. The three other largest trading partners for Manitoba in 2016 were the China, Japan and Mexico, which purchased 7.1%, 5.5% and 2.7%, respectively, of the all merchandise shipped internationally.
Manitoba’s total nominal international merchandise exports declined 2.1% in 2016. Nonetheless, the province fared better than Canada, which saw its exports fall by 2.6% last year. Manitoba’s international export decline was primarily due to the 3.8% drop in exports to the U.S. A 1.9% increase in exports to non-U.S. markets contributed to partially offset the decline in exports to the U.S.
Manitoba Real International and Interprovincial Exports, 2000–2016
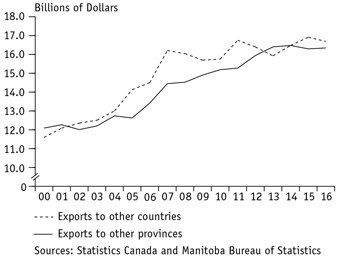
BUDGET 2017 Economic Review and Outlook / A15
The diversity of the province’s economy is reflected in its exports, with no export accounting for more than 25% of the total. The five largest exports of the province in 2016 were grains and oilseed products (20.2%), transport equipment (12.7%), livestock and processed meats (10.7%), machinery and electrical equipment (9.5%), and chemical products (8.9%).
Transport equipment (4.7%), livestock and processed meats (4.2%), and grains and oilseed products (1.9%) posted the biggest gains among exports that exceeded a billion dollars in value in 2016. Reflecting low commodity prices and weak investment conditions, base metals and articles of base metal (-20.7%), machinery and electrical equipment (-6.6%), and chemical products (-3.0%) declined the most among major exports.
Many analysts predict that the strengthening recovery in Canada and the U.S., and the Canadian dollar’s depreciation should boost Manitoba’s exports in 2017. Furthermore, implementation of the Canada/ European Union (EU) Comprehensive Economic and Trade Agreement will expand export opportunities for Manitoba. This agreement will provide expanded export opportunities for Manitoba beef, pork, wheat, canola, freshwater fish and electronics sectors.
Manitoba’s services sector, the largest sector in Manitoba’s economy, will also have preferential access to the EU services market and Manitoba companies will gain access to the $2.7 trillion/year EU government procurement market. Upon implementation, 98% of tariff lines will be duty free and 99% of tariff lines will be duty free within seven years. Currently only 25% of EU tariff lines are duty free.
China also partially lifted the ban on Canadian cattle that was imposed following the BSE ban. Exports of bone-in beef from Canadian cattle under 30 months of age will now resume. This follows Taiwan lifting its temporary ban on Canadian beef in July 2016 and Mexico lifting its ban in October 2016.
MANITOBA OUTLOOK
The number of large economic, financial and commodity market events with global implications has increased in recent years due to a broader integration of trade. The integration provides benefits, but at the same time exposes countries to economic and financial volatilities. In addition, the spillovers from global shocks are enduring longer than expected, generating uncertainty and risks to the outlook.
The consistent strength in several major economic indicators is lifting consumer and business confidence, and leading to a modest improvement in the outlook. The current outlook incorporates the economic momentum that is building in the U.S. and in Canada.
According to the Manitoba Finance Survey of Economic Forecasts, Manitoba’s real GDP is expected to increase by 2.0% in 2017 and 2018, placing the province fourth highest in Canada, in both years, and up from 1.4% in 2016. The medium-term real GDP forecast is well below the 2.4% average annual growth achieved in the past two decades.
Nominal GDP (the broadest measure of the tax base) is expected to increase by 3.6% in 2017 and by 3.8% in 2018. This is well below the 4.3% annual average growth historically. Due to a moderation in the expected growth, Manitoba’s unemployment rate is expected to average 6.1% in 2017 and 5.9% in 2018, the second-lowest rate among provinces in 2017 and tied for lowest in 2018.
Uncertainty about policy choices taken by the EU regarding BREXIT and by the new U.S. administration regarding personal and corporate taxation, deregulation, international trade and infrastructure spending combined with the lingering effects from past shocks present upside and downside risks to the outlook.
A16 / Economic Review and Outlook BUDGET 2017
Manitoba Outlook at a Glance
| | | | | | | | | | | | | | | | | | | | |
| | | | | 2016 | | | | | 2017f | | | | | 2018f | | | |
| | | | | (Per Cent Change Unless Noted) | | | |
Gross Domestic Product | | | | | | | | | | | | | | | | | | | | |
Real | | | | | 1.4 | | | | | | 2.0 | | | | | | 2.0 | | | |
Nominal | | | | | 2.0 | | | | | | 3.6 | | | | | | 3.8 | | | |
Employment | | | | | -0.4 | | | | | | 0.7 | | | | | | 0.8 | | | |
Unemployment Rate (%) | | | | | 6.1 | | | | | | 6.1 | | | | | | 5.9 | | | |
Consumer Price Index | | | | | 1.3 | | | | | | 1.9 | | | | | | 2.1 | | | |
Population | | | | | 1.7 | | | | | | 1.4 | | | | | | 1.3 | | | |
f – Forecast
Sources: Statistics Canada, Manitoba Bureau of Statistics and Manitoba Finance Survey of Economic Forecasts (2017f–2018f)
BUDGET 2017 Economic Review and Outlook / A17
MANITOBA FINANCE SURVEY OF ECONOMIC FORECASTS
2017f–2018f
| | | | | | | | |
| | | Real GDP Growth Forecast (%) |
| | | | |
| | | | | 2017f | | 2018f | | |
| | |
| | CA | | 2.0 | | 2.0 | | |
| | NL | | -2.0 | | 0.8 | | |
| | PE | | 1.3 | | 1.3 | | |
| | NS | | 1.2 | | 1.3 | | |
| | NB | | 0.7 | | 0.9 | | |
| | QC | | 1.7 | | 1.6 | | |
| | ON | | 2.3 | | 2.1 | | |
| | MB | | 2.0 | | 2.0 | | |
| | SK | | 1.7 | | 1.9 | | |
| | AB | | 2.3 | | 2.3 | | |
| | BC | | 2.2 | | 2.2 | | |
| | | Unemployment Rate Forecast (%) |
| | | | |
| | | | | 2017f | | 2018f | | |
| | |
| | CA | | 6.8 | | 6.6 | | |
| | NL | | 14.3 | | 14.8 | | |
| | PE | | 10.9 | | 10.7 | | |
| | NS | | 8.1 | | 8.1 | | |
| | NB | | 9.5 | | 9.3 | | |
| | QC | | 6.6 | | 6.5 | | |
| | ON | | 6.4 | | 6.2 | | |
| | MB | | 6.1 | | 5.9 | | |
| | SK | | 6.3 | | 6.0 | | |
| | AB | | 8.3 | | 7.7 | | |
| | BC | | 5.9 | | 5.9 | | |
| | | | | | | | |
| | | Nominal GDP Growth Forecast (%) |
| | | | |
| | | | | 2017f | | 2018f | | |
| | |
| | CA | | 4.2 | | 3.9 | | |
| | NL | | 1.3 | | 3.3 | | |
| | PE | | 2.9 | | 3.1 | | |
| | NS | | 2.9 | | 3.1 | | |
| | NB | | 2.7 | | 2.6 | | |
| | QC | | 3.4 | | 3.3 | | |
| | ON | | 4.2 | | 4.0 | | |
| | MB | | 3.6 | | 3.8 | | |
| | SK | | 4.7 | | 4.1 | | |
| | AB | | 6.2 | | 5.0 | | |
| | BC | | 4.1 | | 3.9 | | |
| | | Employment Growth Forecast (%) |
| | | | |
| | | | | 2017f | | 2018f | | |
| | |
| | CA | | 1.1 | | 0.9 | | |
| | NL | | -1.9 | | -1.3 | | |
| | PE | | 0.3 | | 0.4 | | |
| | NS | | 0.4 | | 0.3 | | |
| | NB | | 0.4 | | 0.3 | | |
| | QC | | 1.3 | | 0.7 | | |
| | ON | | 1.2 | | 1.1 | | |
| | MB | | 0.7 | | 0.8 | | |
| | SK | | 0.5 | | 0.8 | | |
| | AB | | 0.5 | | 1.1 | | |
| | BC | | 1.4 | | 1.1 | | |
f – Forecast
Source: Manitoba Finance Survey of Economic Forecasts
A18 / Economic Review and Outlook BUDGET 2017
MANITOBA ECONOMIC STATISTICS, 2012 TO 2016
| | | | | | | | | | | | | | | | | | | | | | | | | | | | | | | | |
| | | | | 2012 | | | | | 2013 | | | | | 2014 | | | | | 2015 | | | | | 2016 | | | |
| | | (Millions of Dollars) | | | |
| | | | | | | | | | | |
POPULATION | | | | | | | | | | | | | | | | | | | | | | | | | | | | | | | | |
July 1 (000’s) | | | | | 1,250 | | | | | | 1,266 | | | | | | 1,281 | | | | | | 1,296 | | | | | | 1,318 | | | |
GROSS DOMESTIC PRODUCT1 | | | | | | | | | | | | | | | | | | | | | | | | | | | | | | | | |
Nominal | | | | | 59,802 | | | | | | 62,322 | | | | | | 63,779 | | | | | | 65,717 | | | | | | 67,053 | | | |
Real (chained 2007 dollars) | | | | | 55,665 | | | | | | 57,204 | | | | | | 57,996 | | | | | | 59,065 | | | | | | 59,902 | | | |
INVESTMENT | | | | | | | | | | | | | | | | | | | | | | | | | | | | | | | | |
Residential Construction | | | | | 3,211 | | | | | | 3,476 | | | | | | 3,539 | | | | | | 3,336 | | | | | | 3,252 | | | |
Housing Starts (no. of units) | | | | | 7,242 | | | | | | 7,465 | | | | | | 6,220 | | | | | | 5,501 | | | | | | 5,318 | | | |
Building Permits | | | | | 2,486 | | | | | | 2,608 | | | | | | 2,815 | | | | | | 2,313 | | | | | | 2,626 | | | |
Non-Residential Building Construction | | | | | 1,352 | | | | | | 1,477 | | | | | | 1,649 | | | | | | 1,748 | | | | | | 1,637 | | | |
Total Capital and Repair Investment | | | | | 7,795 | | | | | | 7,620 | | | | | | 8,633 | | | | | | 9,493 | | | | | | 10,213 | | | |
Private Capital Investment | | | | | 4,388 | | | | | | 4,331 | | | | | | 5,537 | | | | | | 4,892 | | | | | | 4,485 | | | |
Public Capital Investment | | | | | 3,407 | | | | | | 3,289 | | | | | | 3,096 | | | | | | 4,600 | | | | | | 5,728 | | | |
SECTORS | | | | | | | | | | | | | | | | | | | | | | | | | | | | | | | | |
Manufacturing Shipments | | | | | 16,333 | | | | | | 16,930 | | | | | | 17,415 | | | | | | 17,156 | | | | | | 17,386 | | | |
Retail Trade | | | | | 16,652 | | | | | | 17,297 | | | | | | 18,034 | | | | | | 18,297 | | | | | | 19,111 | | | |
Wholesale Trade | | | | | 15,891 | | | | | | 15,750 | | | | | | 17,031 | | | | | | 17,254 | | | | | | 17,079 | | | |
Farm Cash Receipts | | | | | 5,146 | | | | | | 5,833 | | | | | | 5,978 | | | | | | 5,849 | | | | | | 5,992 | | | |
Crops | | | | | 2,718 | | | | | | 3,468 | | | | | | 3,254 | | | | | | 3,211 | | | | | | 3,664 | | | |
Livestock | | | | | 1,934 | | | | | | 1,993 | | | | | | 2,493 | | | | | | 2,334 | | | | | | 2,114 | | | |
Direct Payments | | | | | 495 | | | | | | 371 | | | | | | 231 | | | | | | 305 | | | | | | 214 | | | |
Mining and Petroleum | | | | | 3,092 | | | | | | 3,071 | | | | | | 3,097 | | | | | | 2,291 | | | | | | 2,069 | | | |
New Vehicle Sales (no. of units) | | | | | 52,236 | | | | | | 56,275 | | | | | | 57,783 | | | | | | 57,986 | | | | | | 57,428 | | | |
FOREIGN EXPORTS | | | | | | | | | | | | | | | | | | | | | | | | | | | | | | | | |
Total Exports | | | | | 11,363 | | | | | | 12,550 | | | | | | 13,451 | | | | | | 13,724 | | | | | | 13,437 | | | |
U.S. | | | | | 7,655 | | | | | | 8,407 | | | | | | 9,093 | | | | | | 9,528 | | | | | | 9,162 | | | |
LABOUR MARKET | | | | | | | | | | | | | | | | | | | | | | | | | | | | | | | | |
Labour Force (000’s) | | | | | 656.6 | | | | | | 661.5 | | | | | | 662.1 | | | | | | 674.1 | | | | | | 674.9 | | | |
Employment (000’s) | | | | | 621.6 | | | | | | 625.8 | | | | | | 626.5 | | | | | | 636.2 | | | | | | 633.6 | | | |
Participation Rate (%) | | | | | 68.9 | | | | | | 68.6 | | | | | | 67.8 | | | | | | 68.3 | | | | | | 67.6 | | | |
Unemployment Rate (%) | | | | | 5.3 | | | | | | 5.4 | | | | | | 5.4 | | | | | | 5.6 | | | | | | 6.1 | | | |
Average Weekly Earnings ($) | | | | | 822.66 | | | | | | 827.34 | | | | | | 862.99 | | | | | | 880.17 | | | | | | 888.52 | | | |
CONSUMER PRICE INDEX | | | | | | | | | | | | | | | | | | | | | | | | | | | | | | | | |
(Index, 2002 = 100) | | | | | 120.3 | | | | | | 123.0 | | | | | | 125.3 | | | | | | 126.8 | | | | | | 128.4 | | | |
1 2016 Manitoba Bureau of Statistics
Sources: Statistics Canada, Manitoba Bureau of Statistics and Manitoba Finance
Sums may not add due to rounding.
BUDGET 2017 Economic Review and Outlook / A19
| | | | | | | | | | | | | | | | | | | | | | | | | | | | | | | | | | |
| | | 2012 | | | | | 2013 | | | | | 2014 | | | | | 2015 | | | | | 2016 | | | | | | | |
| | | (Annual Percentage Change) | | | | | | | |
| | | | | | | | | | | | |
| | | | | | | | | | | | | | | | | | | | | | | | | | | | | | | | | | POPULATION |
| | | 1.3 | | | | | | 1.2 | | | | | | 1.2 | | | | | | 1.2 | | | | | | 1.7 | | | | | | | July 1 (000’s) |
| | | | | | | | | | | | | | | | | | | | | | | | | | | | | | | | | | GROSS DOMESTIC PRODUCT1 |
| | | 6.1 | | | | | | 4.2 | | | | | | 2.3 | | | | | | 3.0 | | | | | | 2.0 | | | | | | | Nominal |
| | | 2.7 | | | | | | 2.8 | | | | | | 1.4 | | | | | | 1.8 | | | | | | 1.4 | | | | | | | Real (chained 2007 dollars) |
| | | | | | | | | | | | | | | | | | | | | | | | | | | | | | | | | | INVESTMENT |
| | | 13.4 | | | | | | 8.2 | | | | | | 1.8 | | | | | | -5.7 | | | | | | -2.5 | | | | | | | Residential Construction |
| | | 19.1 | | | | | | 3.1 | | | | | | -16.7 | | | | | | -11.6 | | | | | | -3.3 | | | | | | | Housing Starts (no. of units) |
| | | 34.9 | | | | | | 4.9 | | | | | | 7.9 | | | | | | -17.9 | | | | | | 13.5 | | | | | | | Building Permits |
| | | 21.0 | | | | | | 9.3 | | | | | | 11.6 | | | | | | 6.0 | | | | | | -6.3 | | | | | | | Non-Residential Building Construction |
| | | 3.8 | | | | | | -2.3 | | | | | | 13.3 | | | | | | 10.0 | | | | | | 7.6 | | | | | | | Total Capital and Repair Investment |
| | | 0.8 | | | | | | -1.3 | | | | | | 27.8 | | | | | | -11.6 | | | | | | -8.3 | | | | | | | Private Capital Investment |
| | | 8.0 | | | | | | -3.5 | | | | | | -5.9 | | | | | | 48.6 | | | | | | 24.5 | | | | | | | Public Capital Investment |
| | | | | | | | | | | | | | | | | | | | | | | | | | | | | | | | | | SECTORS |
| | | 1.1 | | | | | | 3.7 | | | | | | 2.9 | | | | | | -1.5 | | | | | | 1.3 | | | | | | | Manufacturing Shipments |
| | | 1.3 | | | | | | 3.9 | | | | | | 4.3 | | | | | | 1.5 | | | | | | 4.4 | | | | | | | Retail Trade |
| | | 5.6 | | | | | | -0.9 | | | | | | 8.1 | | | | | | 1.3 | | | | | | -1.0 | | | | | | | Wholesale Trade |
| | | 3.5 | | | | | | 13.3 | | | | | | 2.5 | | | | | | -2.1 | | | | | | 2.4 | | | | | | | Farm Cash Receipts |
| | | 6.6 | | | | | | 27.6 | | | | | | -6.2 | | | | | | -1.3 | | | | | | 14.1 | | | | | | | Crops |
| | | 0.7 | | | | | | 3.1 | | | | | | 25.1 | | | | | | -6.4 | | | | | | -9.4 | | | | | | | Livestock |
| | | -1.2 | | | | | | -25.0 | | | | | | -37.7 | | | | | | 31.7 | | | | | | -29.6 | | | | | | | Direct Payments |
| | | -2.2 | | | | | | -0.7 | | | | | | 0.9 | | | | | | -26.0 | | | | | | -9.7 | | | | | | | Mining and Petroleum |
| | | 7.6 | | | | | | 7.7 | | | | | | 2.7 | | | | | | 0.4 | | | | | | -1.0 | | | | | | | New Vehicle Sales (no. of units) |
| | | | | | | | | | | | | | | | | | | | | | | | | | | | | | | | | | FOREIGN EXPORTS |
| | | -2.7 | | | | | | 10.4 | | | | | | 7.2 | | | | | | 2.0 | | | | | | -2.1 | | | | | | | Total Exports |
| | | 7.9 | | | | | | 9.8 | | | | | | 8.2 | | | | | | 4.8 | | | | | | -3.8 | | | | | | | U.S. |
| | | | | | | | | | | | | | | | | | | | | | | | | | | | | | | | | | LABOUR MARKET |
| | | 1.4 | | | | | | 0.7 | | | | | | 0.1 | | | | | | 1.8 | | | | | | 0.1 | | | | | | | Labour Force (000’s) |
| | | 1.6 | | | | | | 0.7 | | | | | | 0.1 | | | | | | 1.5 | | | | | | -0.4 | | | | | | | Employment (000’s) |
| | | - | | | | | | - | | | | | | - | | | | | | - | | | | | | - | | | | | | | Participation Rate (%) |
| | | - | | | | | | - | | | | | | - | | | | | | - | | | | | | - | | | | | | | Unemployment Rate (%) |
| | | 2.7 | | | | | | 0.6 | | | | | | 4.3 | | | | | | 2.0 | | | | | | 1.0 | | | | | | | Average Weekly Earnings ($) |
| | | | | | | | | | | | | | | | | | | | | | | | | | | | | | | | | | CONSUMER PRICE INDEX |
| | | 1.6 | | | | | | 2.2 | | | | | | 1.9 | | | | | | 1.2 | | | | | | 1.3 | | | | | | | (Index, 2002 = 100) |
1 2016 Manitoba Bureau of Statistics
Sources: Statistics Canada, Manitoba Bureau of Statistics and Manitoba Finance
Sums may not add due to rounding.
A20 / Economic Review and Outlook BUDGET 2017
Budget Paper B
SUPPLEMENTARY FINANCIAL INFORMATION
SUPPLEMENTARY FINANCIAL INFORMATION
| | | | |
CONTENTS | | | | |
| |
MANITOBA SUMMARY FINANCIAL STATISTICS | | | B2 | |
| |
CAPITAL INVESTMENT | | | B4 | |
| |
LOAN REQUIREMENTS | | | B5 | |
| |
BORROWING REQUIREMENTS | | | B6 | |
| |
SUMMARY NET DEBT | | | B7 | |
| |
SPECIAL ACCOUNTS | | | B8 | |
| |
SUMMARY BUDGET USER’S GUIDE | | | B9 | |
| |
Structure of the Summary Budget | | | B9 | |
| |
Frequently Asked Questions | | | B11 | |
| |
Glossary of Key Terms | | | B13 | |
| |
Entities Included in Summary Budget | | | B15 | |
B2 / Supplementary Financial Information BUDGET 2017
Manitoba Summary Financial Statistics
| | | | | | | | | | | | | | | | | | | | | | | | |
| | | 2017/18
Budget | | | 2016/17
Forecast | | | 2015/16
Actual | | | 2014/15
Actual | | | 2013/14
Actual | | | 2012/13
Actual | |
SUMMARY FINANCIAL STATEMENTS | | | | | | | | (Millions of Dollars) | | | | | | | |
Revenue | | | | | | | | | | | | | | | | | | | | | | | | |
Income Taxes | | | 4,194 | | | | 3,950 | | | | 3,777 | | | | 3,679 | | | | 3,446 | | | | 3,302 | |
Other Taxes | | | 4,497 | | | | 4,395 | | | | 4,250 | | | | 4,102 | | | | 3,923 | | | | 3,563 | |
Fees and Other Revenue | | | 2,307 | | | | 2,307 | | | | 2,236 | | | | 2,183 | | | | 2,202 | | | | 2,013 | |
Federal Transfers | | | 4,163 | | | | 4,117 | | | | 3,820 | | | | 3,809 | | | | 3,818 | | | | 3,953 | |
Net Income of Government Business Enterprises | | | 705 | | | | 644 | | | | 713 | | | | 921 | | | | 783 | | | | 739 | |
Sinking Funds and Other Earnings | | | 235 | | | | 230 | | | | 258 | | | | 269 | | | | 242 | | | | 242 | |
| | | | | | | | | | | | | | | | | | | | | | | | |
Total Revenue | | | 16,101 | | | | 15,643 | | | | 15,054 | | | | 14,963 | | | | 14,414 | | | | 13,812 | |
| | | | | | | | | | | | | | | | | | | | | | | | |
Expenditures (excluding Debt Servicing) | | | 16,065 | | | | 15,577 | | | | 15,045 | | | | 14,552 | | | | 14,115 | | | | 13,533 | |
Debt Servicing | | | 991 | | | | 938 | | | | 855 | | | | 841 | | | | 821 | | | | 839 | |
| | | | | | | | | | | | | | | | | | | | | | | | |
Expenditure | | | 17,056 | | | | 16,515 | | | | 15,900 | | | | 15,393 | | | | 14,936 | | | | 14,372 | |
In-Year Adjustments/Lapse | | | (115) | | | | – | | | | – | | | | – | | | | – | | | | – | |
| | | | | | | | | | | | | | | | | | | | | | | | |
Net Income (Loss) | | | (840) | | | | (872) | | | | (846) | | | | (430) | | | | (522) | | | | (560) | |
| | | | | | | | | | | | | | | | | | | | | | | | |
Provincial Borrowings, Guarantees and Obligations | | | | | | | | | | | | | | | | | | | | | | | | |
General Government Programs | | | 11,960 | | | | 12,121 | | | | 10,632 | | | | 9,460 | | | | 9,105 | | | | 8,289 | |
General Government Programs – Federal Flood Relief | | | – | | | | – | | | | – | | | | – | | | | – | | | | 276 | |
General Government Programs – Pension Liability | | | 2,695 | | | | 2,695 | | | | 2,695 | | | | 2,595 | | | | 2,595 | | | | 2,595 | |
Manitoba Hydro-Electric Board | | | 19,329 | | | | 16,374 | | | | 14,543 | | | | 12,540 | | | | 10,838 | | | | 9,609 | |
Other Crown Organizations | | | 3,919 | | | | 3,504 | | | | 3,311 | | | | 2,827 | | | | 2,511 | | | | 2,246 | |
Health Facilities | | | 1,810 | | | | 1,706 | | | | 1,499 | | | | 1,338 | | | | 1,252 | | | | 1,149 | |
Other | | | – | | | | – | | | | – | | | | 5 | | | | 9 | | | | 23 | |
Capital Investments | | | 5,751 | | | | 5,561 | | | | 5,174 | | | | 4,724 | | | | 4,020 | | | | 3,668 | |
| | | | | | | | | | | | | | | | | | | | | | | | |
Subtotal | | | 45,464 | | | | 41,961 | | | | 37,854 | | | | 33,489 | | | | 30,330 | | | | 27,855 | |
Other Obligations | | | | | | | | | | | | | | | | | | | | | | | | |
Pension Liability | | | 9,328 | | | | 8,868 | | | | 8,314 | | | | 7,947 | | | | 7,456 | | | | 6,943 | |
Pension Assets | | | (6,562) | | | | (6,249) | | | | (5,960) | | | | (5,702) | | | | (5,418) | | | | (5,115) | |
| | | | | | | | | | | | | | | | | | | | | | | | |
Net Pension Liability | | | 2,766 | | | | 2,619 | | | | 2,354 | | | | 2,245 | | | | 2,038 | | | | 1,828 | |
Debt Incurred for and Repayable by the Manitoba Hydro-Electric Board | | | (19,267) | | | | (16,286) | | | | (14,435) | | | | (12,371) | | | | (10,576) | | | | (9,446) | |
Education Debt Held by Government Enterprises | | | 630 | | | | 630 | | | | 621 | | | | 620 | | | | 600 | | | | 555 | |
Other Debt of Crown Organizations | | | 310 | | | | 301 | | | | 301 | | | | 279 | | | | 281 | | | | 256 | |
| | | | | | | | | | | | | | | | | | | | | | | | |
Subtotal | | | (15,561) | | | | (12,736) | | | | (11,159) | | | | (9,227) | | | | (7,657) | | | | (6,807) | |
| | | | | | | | | | | | | | | | | | | | | | | | |
Total Summary Borrowings, Guarantees and Obligations | | | 29,903 | | | | 29,225 | | | | 26,695 | | | | 24,262 | | | | 22,673 | | | | 21,048 | |
| | | | | | | | | | | | | | | | | | | | | | | | |
Adjustments to Arrive at Summary Net Debt | | | | | | | | | | | | | | | | | | | | | | | | |
Guarantees | | | (65) | | | | (91) | | | | (110) | | | | (172) | | | | (265) | | | | (166) | |
Net Financial Assets | | | (5,066) | | | | (6,023) | | | | (5,152) | | | | (4,589) | | | | (5,136) | | | | (5,061) | |
| | | | | | | | | | | | | | | | | | | | | | | | |
| | | | | | |
Summary Net Debt | | | 24,772 | | | | 23,111 | | | | 21,433 | | | | 19,501 | | | | 17,272 | | | | 15,821 | |
| | | | | | | | | | | | | | | | | | | | | | | | |
NOTES
| • | | In-year adjustments/lapse could be an increase in revenue and/or decrease in expenditures. |
| • | | Numbers may not add due to rounding. |
BUDGET 2017 Supplementary Financial Information / B3
Manitoba Summary Financial Statistics
| | | | | | | | | | | | | | | | | | | | | | | | |
| | | 2017/18
Budget | | | 2016/17
Forecast | | | 2015/16
Actual | | | 2014/15
Actual | | | 2013/14
Actual | | | 2012/13
Actual | |
| | | | | |
| | | | | | | | | (Percentage Change) | | | | | | | |
Annual Change | | | | | | | | | | | | | | | | | | | | | | | | |
Income Taxes | | | 6.2 | | | | 4.6 | | | | 2.7 | | | | 6.8 | | | | 4.4 | | | | 5.2 | |
Other Taxes | | | 2.3 | | | | 3.4 | | | | 3.6 | | | | 4.6 | | | | 10.1 | | | | 6.4 | |
Fees and Other Revenue | | | – | | | | 3.2 | | | | 2.4 | | | | (0.9) | | | | 9.4 | | | | 5.6 | |
Federal Transfers | | | 1.1 | | | | 7.8 | | | | 0.3 | | | | (0.2) | | | | (3.4) | | | | (8.7) | |
Total Revenue | | | 2.9 | | | | 3.9 | | | | 0.6 | | | | 3.8 | | | | 4.4 | | | | 0.9 | |
Debt Servicing | | | 5.7 | | | | 9.7 | | | | 1.7 | | | | 2.4 | | | | (2.1) | | | | 2.9 | |
Total Expenditure | | | 3.3 | | | | 3.9 | | | | 3.3 | | | | 3.1 | | | | 3.9 | | | | (2.2) | |
Summary Net Debt | | | 7.2 | | | | 7.8 | | | | 9.9 | | | | 12.9 | | | | 9.2 | | | | 9.3 | |
| | | | | |
| | | | | | | | | (Per Cent) | | | | | | | |
Per Cent of GDP | | | | | | | | | | | | | | | | | | | | | | | | |
Income Taxes | | | 6.0 | | | | 5.9 | | | | 5.7 | | | | 5.8 | | | | 5.5 | | | | 5.5 | |
Other Taxes | | | 6.5 | | | | 6.6 | | | | 6.5 | | | | 6.4 | | | | 6.3 | | | | 6.0 | |
Fees and Other Revenue | | | 3.3 | | | | 3.4 | | | | 3.4 | | | | 3.4 | | | | 3.5 | | | | 3.4 | |
Federal Transfers | | | 6.0 | | | | 6.1 | | | | 5.8 | | | | 6.0 | | | | 6.1 | | | | 6.6 | |
Total Revenue | | | 23.2 | | | | 23.3 | | | | 22.9 | | | | 23.5 | | | | 23.1 | | | | 23.1 | |
Debt Servicing | | | 1.4 | | | | 1.4 | | | | 1.3 | | | | 1.3 | | | | 1.3 | | | | 1.4 | |
Total Expenditure | | | 24.6 | | | | 24.6 | | | | 24.2 | | | | 24.1 | | | | 24.0 | | | | 24.0 | |
Summary Net Debt | | | 35.7 | | | | 34.5 | | | | 32.6 | | | | 30.6 | | | | 27.7 | | | | 26.5 | |
| | | | | | |
Per Cent of Revenue | | | | | | | | | | | | | | | | | | | | | | | | |
Income Taxes | | | 26.0 | | | | 25.3 | | | | 25.1 | | | | 24.6 | | | | 23.9 | | | | 23.9 | |
Other Taxes | | | 28.0 | | | | 28.1 | | | | 28.2 | | | | 27.4 | | | | 27.2 | | | | 25.8 | |
Fees and Other Revenue | | | 14.3 | | | | 14.7 | | | | 14.9 | | | | 14.6 | | | | 15.3 | | | | 14.6 | |
Federal Transfers | | | 25.8 | | | | 26.3 | | | | 25.4 | | | | 25.5 | | | | 26.5 | | | | 28.6 | |
Net Income of Government Business Enterprises | | | 4.4 | | | | 4.1 | | | | 4.7 | | | | 6.2 | | | | 5.4 | | | | 5.4 | |
Sinking Funds and Other Earnings | | | 1.5 | | | | 1.5 | | | | 1.7 | | | | 1.8 | | | | 1.7 | | | | 1.8 | |
| | | | | |
| | | | | | | | | (Dollars) | | | | | | | |
Dollars Per Capita | | | | | | | | | | | | | | | | | | | | | | | | |
| | | | | | |
Total Revenue | | | 12,050 | | | | 11,868 | | | | 11,616 | | | | 11,681 | | | | 11,389 | | | | 11,047 | |
Total Expenditure | | | 12,765 | | | | 12,529 | | | | 12,269 | | | | 12,016 | | | | 11,802 | | | | 11,495 | |
Debt Servicing | | | 742 | | | | 712 | | | | 660 | | | | 657 | | | | 649 | | | | 671 | |
Summary Net Debt | | | 18,539 | | | | 17,534 | | | | 16,538 | | | | 15,223 | | | | 13,647 | | | | 12,654 | |
| | | | | | |
Memorandum Items | | | | | | | | | | | | | | | | | | | | | | | | |
| | | | | | |
Population (000s) * | | | 1,336.2 | | | | 1,318.1 | | | | 1,296.0 | | | | 1,281.0 | | | | 1,265.6 | | | | 1,250.3 | |
GDP at Market Prices | | | 69,467 | | | | 67,053 | | | | 65,717 | | | | 63,779 | | | | 62,322 | | | | 59,802 | |
* official population July 1
Source: Manitoba Finance
B4 / Supplementary Financial Information BUDGET 2017
CAPITAL INVESTMENT
Capital investment, both in core government and the Other Reporting Entities, continues to be a priority for government. An investment made to construct or enhance capital assets is a benefit to Manitobans for the provision of services needed into the future.
Net investment in tangible capital assets is projected to be $14.1 billion as at March 31, 2018.
Tangible Capital Assets – Net Book Value
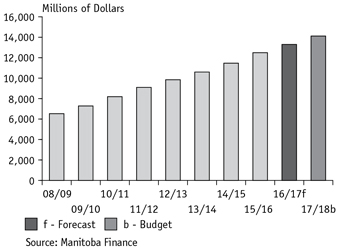
|
Tangible Capital Assets – Net Book Value |
| | | | | | | | | | |
| Projection as at March 31, 2018 and March 31, 2017 | | 2017/18 Budget | | 2016/17 Forecast |
| |
| | | (Millions of Dollars) |
| | |
Cost of Assets, Beginning of Year | | | | 22,316 | | | | | 20,821 | |
Additions | | | | 1,567 | | | | | 1,495 | |
| | | | | | | | | | |
Cost of Assets, End of Year | | | | 23,883 | | | | | 22,316 | |
| | | | | | | | | | |
| | |
Accumulated Amortization, Beginning of Year | | | | 9,021 | | | | | 8,335 | |
Amortization | | | | 746 | | | | | 686 | |
| | | | | | | | | | |
Accumulated Amortization, End of Year | | | | 9,767 | | | | | 9,021 | |
| | | | | | | | | | |
| | |
Net Book Value | | | | 14,116 | | | | | 13,295 | |
| | | | | | | | | | |
Strategic Infrastructure
Budget 2016 introduced Strategic Infrastructure, a construct that reflects government’s overall infrastructure investment commitment, including government funded tangible capital asset additions, maintenance and preservation of critical government
infrastructure and funding to support municipal and local infrastructure. Budget 2017 includes strategic infrastructure investments totaling over $1.7 billion.
Page 10 provides additional details regarding 2017/18 strategic infrastructure.
BUDGET 2017 Supplementary Financial Information / B5
LOAN REQUIREMENTS
The Loan Act, 2017 will provide borrowing and capital authority and, in some cases, guarantee authority for government and its agencies. This authority is in addition to that voted in the printed estimates.
The Loan Act, 2017 will include provisions for the Non-Budgetary Capital Program, as well as for bridge financing and future year commitments. The total authority in The Loan Act, 2017 will be comprised of the unused authority from The Loan Act, 2016, as required, and incremental authority of $3.3 million.
Non-Budgetary Capital Program, 2017/18
| | | | |
| (Thousands of Dollars) | | | |
| |
Manitoba Hydro-Electric Board | | | 3,033,000 | |
Health Capital Program | | | 307,537 | |
Manitoba Agricultural Services Corporation | | | 188,500 | |
Manitoba Housing and Renewal Corporation | | | 149,384 | |
Manitoba Public Schools Finanace Board | | | 141,148 | |
Manitoba Liquor and Lotteries Corporation | | | 128,000 | |
Manitoba Water Services Board | | | 117,744 | |
Diagnostic Services Manitoba | | | 50,281 | |
Special Operating Agencies Financing Authority – Vehicle and Equipment Management Agency | | | 41,000 | |
Manitoba Student Aid Program | | | 39,100 | |
Business Support (including Manitoba Industrial Opportunities Program) | | | 37,600 | |
Post-Secondary Institutions | | | 35,362 | |
Communities Economic Development Fund | | | 12,000 | |
Northern Affairs Communities | | | 11,585 | |
Miscellaneous Corporations, Agencies and Other Programs | | | 13,234 | |
| | | | |
| | | 4,305,475 | |
| | | | |
Incremental Capital Authority Requirements for Non-Budgetary Programs, 2017/18
| | | | |
| (Thousands of Dollars) | | | |
| |
Manitoba Hydro-Electric Board | | | 2,339,000 | |
Health Capital Program | | | 375,123 | |
Manitoba Agricultural Services Corporation | | | 231,271 | |
Manitoba Public Schools Finance Board | | | 144,183 | |
Manitoba Water Services Board | | | 42,108 | |
Manitoba Student Aid Program | | | 32,592 | |
Manitoba Liquor and Lotteries Corporation | | | 32,000 | |
Manitoba Housing and Renewal Corporation | | | 20,840 | |
Special Operating Agencies Financing Authority – Vehicle and Equipment Management Agency | | | 20,000 | |
Diagnostic Services Manitoba | | | 10,433 | |
Communities Economic Development Fund | | | 10,200 | |
Leaf Rapids Town Properties Ltd. | | | 2,000 | |
| | | | |
| | | 3,259,750 | |
| | | | |
B6 / Supplementary Financial Information BUDGET 2017
BORROWING REQUIREMENTS
Manitoba’s borrowing requirements with respect to both general and self-sustaining borrowings is estimated to total $6.7 billion in 2017/18, of which $2.1 billion is required for refinancing purposes. New cash requirements, net of estimated repayments,
are $4.6 billion, which includes requirements for general government purposes, capital investments by departments and the Manitoba Hydro-Electric Board. To date, approximately $1.1 billion of funding for 2017/18 has been completed.
BORROWING REQUIREMENTS 2017/18
| | | | | | | | | | | | | | | | |
| | | Refinancing | | | New Cash
Requirements | | | Estimated
Repayments | | | Borrowing
Requirements | |
| Government Business Enterprises | | | | | (Thousands of Dollars) | | | | |
| | | | |
Manitoba Hydro-Electric Board | | | 415,398 | | | | 2,969,500 | | | | – | | | | 3,384,898 | |
Manitoba Liquor and Lotteries Corporation | | | 25,000 | | | | 126,900 | | | | 47,111 | | | | 104,789 | |
| | | | | | | | | | | | | | | | |
Subtotal | | | 440,398 | | | | 3,096,400 | | | | 47,111 | | | | 3,489,687 | |
| | | | | | | | | | | | | | | | |
| | | | |
Other Borrowings | | | | | | | | | | | | | | | | |
| | | | |
General Purpose Borrowings | | | 941,811 | | | | 779,000 | | | | – | | | | 1,720,811 | |
Capital Investment Assets | | | 234,230 | | | | 688,498 | | | | 270,537 | | | | 652,191 | |
Civil Service Superannuation Plan | | | 350,000 | | | | – | | | | – | | | | 350,000 | |
Health Facilities | | | – | | | | 200,000 | | | | 96,024 | | | | 103,976 | |
Public Schools Finance Board | | | – | | | | 141,148 | | | | 5,011 | | | | 136,137 | |
Other Crowns and Organizations | | | 127,205 | | | | 300,586 | | | | 152,156 | | | | 275,635 | |
| | | | | | | | | | | | | | | | |
Subtotal | | | 1,653,246 | | | | 2,109,232 | | | | 523,728 | | | | 3,238,750 | |
| | | | | | | | | | | | | | | | |
| | | | |
Total Borrowing Requirements | | | 2,093,644 | | | | 5,205,632 | | | | 570,839 | | | | 6,728,437 | |
| | | | | | | | | | | | | | | | |
BUDGET 2017 Supplementary Financial Information / B7
SUMMARY NET DEBT
Changes in Summary Net Debt
(Millions of Dollars)
| | | | |
2016/17 Summary Net Debt (Forecast) | | | 23,111 | |
Net Investment in Tangible Capital Assets | | | | |
Core Government | | | 418 | |
Other Reporting Entities | | | 403 | |
| | | | |
| | | 821 | |
| | | | |
| |
Plus: Projected (Income) Loss for the Year | | | | |
Core Government | | | 779 | |
Other Reporting Entities | | | 61 | |
| | | | |
| | | 840 | |
| | | | |
Change in Net Debt | | | 1,661 | |
| | | | |
| |
2017/18 Summary Net Debt (Budget) | | | 24,772 | |
| | | | |
In Budget 2017, the net debt to GDP ratio is forecast to be 35.7%. Net debt is an important indicator of a government’s financial position, as this highlights the affordability of future government services. Summary net debt represents the difference between
the Government Reporting Entity’s total liabilities less financial assets; it reflects the residual liability that must be financed by future revenues. It is important to measure changes in net debt against the growth of the economy, as measured by the nominal GDP.
B8 / Supplementary Financial Information BUDGET 2017
SPECIAL ACCOUNTS
Fiscal Stabilization Account
The Fiscal Stabilization Account is projected to have a balance of $115 million as of March 31, 2017, as no draws are anticipated for 2016/17.
The Fiscal Stabilization Account is expected to have a balance of $125 million as of March 31, 2018 after the budgeted transfer of $10 million from core government, in 2017/18, re-building the province’s savings and providing protection for core government operations in future years.
FISCAL STABILIZATION ACCOUNT
| | | | |
| Projection as at March 31, 2018 and March 31, 2017 | | 2017/18 Budget | | 2016/17 Forecast |
| |
| | | (Millions of Dollars) |
| | |
Balance, Beginning of Year | | 115 | | 115 |
| | |
Transfer from Core Government | | 10 | | – |
| | | | |
| | |
Balance, End of Year | | 125 | | 115 |
| | | | |
Pension Assets Fund
The trust conditions of the funds held in the Pension Assets Fund are irrevocably restricted for pension purposes only. Net investment earnings of pension assets include the expected rate of return during the year, as well as adjustments to market-related value.
Market fluctuations of pension assets are not recorded in the year in which they occur, but are recognized over the employee average remaining service life.
The Fund is expected to have a balance of $4,547 million by the end of the 2017/18 fiscal year.
Pension Assets Fund
| | | | |
| Projection as at March 31, 2018 and March 31, 2017 | | 2017/18 Budget | | 2016/17 Forecast |
| |
| | | (Millions of Dollars) |
| | |
Balance, Beginning of Year | | 4,425 | | 4,312 |
| | | | |
| | |
Contributions and Revenue | | | | |
| | |
Net Investment Earnings | | 267 | | 259 |
| | |
Departments and Crown Corporations | | 208 | | 201 |
| | | | |
| | 475 | | 460 |
| | | | |
Transfers | | | | |
Teachers’ Retirement Allowances Fund and Civil Service Superannuation Fund payments | | (353) | | (347) |
| | | | |
| | |
Balance, End of Year | | 4,547 | | 4,425 |
| | | | |
BUDGET 2017 Supplementary Financial Information / B9
SUMMARY BUDGET USER’S GUIDE
Introduction
This document guides readers through the format of the Manitoba Budget. It includes a general explanation of the Structure of the Summary Budget and a list of Frequently Asked Questions, a Glossary of Key Terms and a list of Entities Included in the Summary Budget.
STRUCTURE OF THE SUMMARY BUDGET
The Summary Budget presents a high-level overview of revenue and expenditure of the entire Government Reporting Entity (GRE).
Revenue is reported under six categories.
| ● | | Income Taxes – are entirely revenue of core government. |
| ● | | Other Taxes – includes the Retail Sales Tax and all of the other tax revenues of core government, as well as property taxes levied to support school funding. |
| ● | | Fees and Other Revenue – includes fees such as automobile licences, park and forestry fees, and fees collected by Crown organizations such as fees for non-insured health services and rental revenue for Manitoba Housing and Renewal Corporation (MHRC). |
| | | Tuition fees collected by universities and colleges are also included in this category. |
| ● | | Federal Transfers – Equalization, Canada Health Transfer, Canada Social Transfer, and other grants and transfers are mostly received by core government, although some federal funds are provided directly to entities not included in core government, such as housing subsidies to MHRC, insurance premiums for agriculture programs and grants for public education. |
| ● | | Net Income of Government Business Enterprises (GBE) – represents the net income of all GBEs. This income is added to the summary financial statements on a modified equity basis and includes the income of Manitoba Liquor and Lotteries Corporation, whose net income continues to be recorded as revenue of core government. |
| ● | | Sinking Funds and Other Earnings – are interest and other investment earnings on sinking funds and other investments held by core government and Other Reporting Entities (ORE). For core government estimates purposes, investment revenue is netted against debt servicing costs. |
B10 / Supplementary Financial Information BUDGET 2017
Expenditure has been classified by major sectors. See page B15 for a list of entities in the GRE.
| ● | | Health – represents all health-related expenditures including the activities of Manitoba Health, Seniors and Active Living; all Regional Health Authorities; hospitals and other health-related entities in the GRE. |
| ● | | Education – represents costs associated with all primary, secondary and post-secondary education, including the operations of universities and colleges, the activities of Manitoba Education and Training, and additional funding for teachers’ pensions and programs funded by other sources. This also includes youth programs, workforce training and immigration services. |
| ● | | Families – includes costs related to social service programs, including the activities of Manitoba Families and its authorities. |
| ● | | Community, Economic and Resource Development – includes expenditures related to infrastructure and other government services, including the activities of Manitoba Agriculture; Manitoba Growth, Enterprise and Trade; Manitoba Indigenous and Municipal Relations; Manitoba Infrastructure; and Manitoba Sustainable Development. |
| ● | | Justice and Other Expenditures – includes costs for Manitoba Justice and the activities of the Legislative Assembly; Executive Council; Civil Service Commission, Employee Pensions and Other Costs; Manitoba Finance; Manitoba Sport, Culture and Heritage; and Enabling and Other Appropriations. |
| ● | | Debt Servicing – reflects the cost of interest and related expenses for the Teachers’ Retirement Allowances Fund, the Civil Service Superannuation Plan, capital funding and general purpose borrowings associated with all provincial summary borrowings, excluding debt servicing costs for debt incurred and repayable by the Manitoba Hydro-Electric Board. Debt servicing costs related to those borrowings are included in the net income of GBEs. |
In-Year Adjustments/Lapse – could be an increase in revenue and/or a decrease in expenditure.
Net Income (Loss) is the “bottom line” – the result after expenditure is subtracted from revenue. This represents the GRE’s financial result for the fiscal year.
BUDGET 2017 Supplementary Financial Information / B11
FREQUENTLY ASKED QUESTIONS
| Q1 | What is a Summary Budget? |
| A | A Summary Budget is a comprehensive picture of core government expenditure and revenue together with high-level projections for the operations of Crown organizations, GBEs and public sector organizations such as regional health authorities, school divisions, universities and colleges. |
It is called a Summary Budget because the revenue and expenditure of general program and departmental operations of the government – the services of government usually associated with the Legislature – and the additional functions that are indirectly controlled by the provincial government, such as public schools and universities, are consolidated.
For example, public school expenditures paid for by school division property taxes and provincial support payments are shown together in one sum. This approach allows taxpayers to see the total cost of providing public school services.
| Q2 | How can I tell how much the government raises as revenue and plans to spend on core government programs and services? |
| A | Details of core government expenditure and revenue are presented in the Estimates of Expenditure and Revenue tabled in the Legislature. |
| Q3 | What entities are included in the Summary Budget and where can I get more information about their plans? |
| A | A listing of all the entities in the GRE is included on page B15. The Summary Budget combines the Estimates of Expenditure and Revenue for core government with projections for OREs. Questions about financial information of OREs should be directed to the appropriate entity. |
| Q4 | As Manitoba’s Budget is presented for the GRE, will the government use the revenues of OREs to pay for core government operations? |
| A | A Summary Budget does not change the way in which core government operations are funded. Under the Summary Budget, only revenues from those Crown entities that have traditionally been used to support government programs and services (Manitoba Liquor and Lotteries Corporation and the Special Operating Agencies established by government) will continue to be used to support core government operations. |
| Q5 | If the government is not controlling the OREs directly, why does the government combine their revenue and expenses with its own in the Summary Budget? |
| A | The Manitoba government acted on the recommendations of the Office of the Auditor General for Manitoba. Generally Accepted Accounting Principles and the Public Sector Accounting Board standards for senior Canadian governments require all governments to prepare their annual financial statements on this basis. |
B12 / Supplementary Financial Information BUDGET 2017
| Q6 | How do core government and summary expenses differ? |
| A | Core government expenses reflect the departmental expenditure estimates of the Manitoba government that are presented and approved by the Legislative Assembly. These expenditures include grants to OREs. The summary expenditures include incremental expenses of OREs that are financed from sources other than core government. The summary total reflects the total cost of the service provided, under the various sectors, that are financed by core government and the OREs. |
| Q7 | How does the Summary Budget treat pension liabilities? |
| A | The pension liability is recorded in full in the Summary Financial Statements and therefore, changes in this liability are reflected in the Summary Budget. The pension expenses include amounts that are funded through the appropriations of core government as well as summary adjustments for actuarially determined increases in the value of the outstanding pension liability. Pension expenses related to the Teachers’ Retirement Allowances Fund are included in the education sector. |
| Q8 | What is Other Comprehensive Income (OCI) and how does it impact the government’s summary results? |
| A | OCI applies to certain OREs, and represents unrealized gains or losses in fair market value of financial instruments, such as investments held for sale or debt held in a foreign currency. Changes in OCI are based upon “mark-to-market” variances at year end and therefore, are a one-day snapshot of the change in value when compared to the same day in the previous year. Because OCI represents an unrealized gain or loss, it does not impact an ORE’s annual operating results, and therefore, does not impact the government’s Summary Net Income. However, OCI does impact the balance sheet and therefore, will impact the government’s net debt and net debt to GDP. |
When the underlying investments are sold, or when the foreign held debt is retired, OCI gains or losses are realized, which will correspondingly impact an ORE’s net income and therefore the government’s summary net income.
BUDGET 2017 Supplementary Financial Information / B13
GLOSSARY OF KEY TERMS
Borrowings: Borrowings are securities issued in the name of the government to capital markets investors. Securities include debentures, treasury bills, promissory notes, medium-term notes and Manitoba Savings Bonds.
Consolidation Impacts: The adjustments needed to bring the revenue and expenditure of the OREs into the Summary Budget, and to eliminate transactions between entities to avoid duplication of revenue and expense (ex. a government grant is counted as an expenditure of core government and is eliminated from the revenue of the ORE).
Core Government: A component of the GRE. Represents the operations of government, including the revenues directly under the government’s control, and the programs and services delivered by government departments.
Crown Organization: An organization in the GRE that is wholly owned or established by the government, such as a Crown corporation (ex. Manitoba Agricultural Services Corporation).
Debt Servicing Cost: Interest and other expenses associated with provincial borrowings.
Fair Market Value: Represents the value obtainable for an asset, financial or non-financial, if disposed of on the open market.
Federal Recoveries and Transfers: Revenues that are either received or receivable from the federal government.
Financial Assets: Assets of the government such as cash, investments, loans and accounts receivable that could be readily converted to cash in order to pay the government’s liabilities or finance its future operations.
General Purpose Debt: General program borrowings including any government securities that are not self-sustaining, or are not associated with the acquisition of capital assets.
Government Business Enterprises (GBEs): A Crown organization delegated with the financial and operating authority to carry on a business. It sells goods or services to individuals and organizations outside the GRE and can maintain its business on those revenues.
Government Reporting Entity (GRE): Includes core government and Crown organizations, GBEs and public sector organizations such as regional health authorities, school divisions, universities and colleges.
Gross Domestic Product (GDP): Represents the total market value of all final goods and services produced in the Manitoba economy.
Guarantees: In the normal course of business, the government may provide a guarantee to honour the repayment of debt or loans of an organization, primarily GBEs. Such a guarantee is provided on the Manitoba Hydro Savings Bonds.
Infrastructure Assets: A subset of tangible capital assets that are used by the general public, such as parks, highways and bridges.
B14 / Supplementary Financial Information BUDGET 2017
Net Debt to GDP Ratio: The ratio of government net debt relative to the total market value of all final goods and services produced in the Manitoba economy. Net debt represents the total liabilities of the government less its financial assets. It is widely used by credit rating agencies and other analysts to evaluate the financial situation and trends of jurisdictions in regard to their relative credit worthiness.
Net Financial Assets: Assets of the government (such as cash, investments, loans and accounts receivable) less accounts payable, that could be readily converted to cash in order to pay the government’s liabilities or finance its future operations.
Non-Financial Assets: Includes physical items such as tangible capital assets (ex. buildings and roads) and consumable goods such as inventories that are not normally converted to cash.
Obligations: Long-term, non-interest-bearing liabilities of the government, which may or may not carry specific repayment terms.
Other Comprehensive Income (OCI): An accounting recognition of unrealized gains and losses in fair market value of financial instruments, such as investments held as available for sale or trading or debt held in a foreign currency. Currently, OCI accounting standards apply only to OREs, except not-for-profit organizations. It is measured as the change in “mark-to-market” valuations, interest rates, or foreign exchange rates at year end and therefore, is a one-day snapshot of the change in value when compared to the same day in the previous year.
Other Reporting Entities (OREs): Entities in the GRE such as Crown organizations, GBEs and public sector organizations such as regional health authorities, school divisions, universities and colleges that are directly or indirectly controlled by the government, as prescribed by the Public Sector Accounting Board – excludes core government.
Pension Assets Fund: Financial assets that are set aside to provide for the orderly retirement of the government’s pension obligations.
Pension Liability: Outstanding actuarially calculated pension liability of the government and participating Crown organizations. The expense includes amounts funded through the appropriations of core government as well as for the actuarially determined increases in the pension liability.
Public Sector Accounting Board (PSAB): A board established under the Chartered Professional Accountants of Canada responsible for setting accounting standards for the public sector.
Public Sector Accounting Standards (PSAS): Standard accounting practices and reporting guidelines for the public sector as prescribed by the Public Sector Accounting Board.
Replacement Value of Assets: Represents the cost of replacing capital assets at current values.
Sinking Funds: Funds that are readily convertible to cash and set aside to provide for the orderly retirement of borrowings as they become due.
Summary Budget: Includes revenue forecasts and expenditure estimates for core government as well as high-level projections for the entities directly or indirectly controlled by government, as prescribed by the PSAB.
Summary Net Debt: Represents the total liabilities of the GRE less its financial assets. This is the residual amount that will have to be paid or financed by future revenue.
Tangible Capital Assets: Assets with a useful life extending beyond one year which are acquired, constructed or developed and held for use, not for resale.
BUDGET 2017 Supplementary Financial Information / B15
ENTITIES INCLUDED IN SUMMARY BUDGET
HEALTH
Manitoba Health, Seniors and Active Living
Addictions Foundation of Manitoba
CancerCare Manitoba
Diagnostic Services of Manitoba Inc.
Manitoba Health Services Insurance Plan
Manitoba Hospital Capital Financing Authority
Not-for-Profit Personal Care Homes
Regional Health Authorities of Manitoba Inc.
Regional Health Authorities (including controlled organizations)
Interlake-Eastern Regional Health Authority
Northern Regional Health Authority Inc.
Prairie Mountain Health
Southern Health-Santé Sud
Winnipeg Regional Health Authority
Rehabilitation Centre for Children
St.Amant
EDUCATION
Manitoba Education and Training
Assiniboine Community College
Brandon University
Manitoba Learning Resource Centre
Public School Divisions
Public Schools Finance Board
Red River College
Université de Saint-Boniface
University College of The North
University of Manitoba
University of Winnipeg
FAMILIES
Manitoba Families
First Nations of Northern Manitoba Child and Family Services Authority
General Child and Family Services Authority
Manitoba Housing and Renewal Corporation
Métis Child and Family Services Authority
Southern First Nations Network of Care
COMMUNITY, ECONOMIC AND RESOURCE DEVELOPMENT
Agriculture
Manitoba Agriculture
Farm Machinery and Equipment Act Fund
Food Development Centre
Manitoba Agricultural Services Corporation
Manitoba Horse Racing Commission
Veterinary Science Scholarship Fund
Growth, Enterprise and Trade
Manitoba Growth, Enterprise and Trade
Abandonment Reserve Fund
Co-operative Loans and Loans Guarantee Board
Cooperative Promotion Board
Communities Economic Development Fund
Economic Development Winnipeg Inc.
Entrepreneurship Manitoba
Industrial Technology Centre
Manitoba Development Corporation
Manitoba Potash Corporation
Manitoba Opportunities Fund Ltd.
Mining Community Reserve
Mining Rehabilitation Reserve Fund
Office of the Fire Commissioner
Quarry Rehabilitation Reserve Fund
Research Manitoba
Travel Manitoba
The Forks North Portage Partnership
Venture Manitoba Tours Ltd.
Workplace Safety and Health Public Education Fund
Indigenous and Municipal Relations
Manitoba Indigenous and Municipal Relations
Community Revitalization Fund
Manitoba Community Services Council Inc.
Manitoba Water Services Board
B16 / Supplementary Financial Information BUDGET 2017
Infrastructure
Manitoba Infrastructure
Crown Lands and Property Agency
Manitoba Trucking Productivity Improvement Fund
Sustainable Development
Manitoba Sustainable Development
Fish and Wildlife Enhancement Fund
Manitoba Habitat Heritage Corporation
Manitoba Hazardous Waste Management Corporation
Pineland Forest Nursery
Waste Reduction and Recycling Support Fund
JUSTICE AND OTHER EXPENDITURES
Legislative Assembly
Legislative Assembly
Executive Council
Executive Council
Civil Service Commission
Civil Service Commission
Employee Pensions and Other Costs
Pension Assets Fund
Finance
Manitoba Finance
Insurance Council of Manitoba
Leaf Rapids Town Properties Ltd.
Manitoba Centennial Centre Corporation
Manitoba Education, Research and Learning Information Networks (MERLIN)
Manitoba Financial Services Agency
Materials Distribution Agency
Special Operating Agencies Financing Authority
Vehicle and Equipment Management Agency
Justice
Manitoba Justice
Financial Literacy Fund
Funeral Board of Manitoba
Helen Betty Osborne Memorial Foundation
Land Titles Assurance Fund
Legal Aid Manitoba
Liquor and Gaming Authority of Manitoba
Manitoba Law Reform Commission
Public Guardian and Trustee of Manitoba
Victims Assistance Fund
Vital Statistics Agency
Sport, Culture and Heritage
Manitoba Sport, Culture and Heritage
Le Centre culturel franco-manitobain
Manitoba Arts Council
Manitoba Combative Sports Commission
Manitoba Film & Sound Recording Development Corporation
Sport Manitoba Inc.
GOVERNMENT BUSINESS ENTERPRISES
Deposit Guarantee Corporation of Manitoba
Manitoba Hydro-Electric Board
Manitoba Liquor and Lotteries Corporation
Manitoba Public Insurance Corporation
Workers Compensation Board of Manitoba
SPECIAL ACCOUNTS, not attached to Sector or Department
Fiscal Stabilization
Budget Paper C
TAX MEASURES
TAX MEASURES
| | | | |
| CONTENTS | | | | |
| |
FISCAL SUMMARY OF TAX MEASURES | | | C1 | |
| |
INTRODUCTION | | | C2 | |
| |
ON-GOING TAX MEASURES | | | C3 | |
| |
PERSONAL TAX MEASURES | | | C5 | |
| |
BUSINESS TAX MEASURES | | | C7 | |
| |
TECHNICAL AND ADMINISTRATIVE TAX MEASURES | | | C9 | |
| |
OTHER FINANCIAL MEASURES | | | C9 | |
| |
INTERPROVINCIAL COMPARISON OF TAX RATES | | | C10 | |
| |
CONTACTS FOR FURTHER INFORMATION | | | C12 | |
BUDGET 2017 Tax Measures / C1
FISCAL SUMMARY OF TAX MEASURES
A positive amount means an increase in revenue or a decrease in expenditure.
| | | | | | | | |
| | | 2017/18 | | | Full Year | |
| |
| | | Millions of Dollars | |
| | |
On-Going Tax Measures | | | | | | | | |
Personal Income Tax Brackets and Basic Personal Amount – indexation | | | (23.3) | | | | (34.1)1 | |
| | |
Manufacturing Investment Tax Credit – extension | | | (9.7) | | | | (38.8) | |
| | |
Mineral Exploration Tax Credit – extension | | | (0.5) | | | | (2.0) | |
| | |
Book Publishing Tax Credit – extension | | | (0.2) | | | | (0.6) | |
| | |
Interactive Digital Media Tax Credit – extension | | | - | | | | (1.3) | |
| | | | | | | | |
| | |
Total Fiscal Impact of On-Going Tax Measures | | | (33.7) | | | | (76.8) | |
| | | | | | | | |
| | |
Personal Tax Measures | | | | | | | | |
| | |
Tuition Fee Income Tax Rebate – phase-out of credit | | | 46.5 | | | | 58.5 | |
| | |
Primary Caregiver Tax Credit – adjustment to criteria | | | 8.6 | | | | 8.6 | |
| | |
Tuition Fee Income Tax Rebate Advance – eliminated | | | 6.4 | | | | 6.9 | |
| | |
Political Contributions Tax Credit – adjustment to amounts | | | * | | | | (0.2) | |
| | | | | | | | |
| | | 61.5 | | | | 73.8 | |
| | |
Business Tax Measures | | | | | | | | |
| | |
Research and Development Tax Credit – adjustment to rate | | | 9.2 | | | | 9.2 | |
| | |
Manufacturing Investment Tax Credit – adjustment to rate | | | 4.0 | | | | 4.0 | |
| | |
Paid Work Experience Tax Credit – excluding Crowns | | | 2.3 | | | | 1.8 | |
| | |
Corporation Capital Tax – deduction eliminated | | | 0.1 | | | | 0.1 | |
| | |
Co-operative Development Tax Credit – eliminated | | | * | | | | 0.1 | |
| | |
Odour Control Tax Credit – eliminated | | | * | | | | * | |
| | |
Nutrient Management Tax Credit – eliminated | | | * | | | | * | |
| | |
Riparian Tax Credit – eliminated | | | * | | | | * | |
| | |
Neighbourhoods Alive! Tax Credit – eliminated | | | - | | | | - | |
| | |
Data Processing Investment Tax Credits – eliminated | | | - | | | | - | |
| | | | | | | | |
| | |
| | | 15.6 | | | | 15.2 | |
| | |
| | | | | | | | |
Total Fiscal Impact of Personal and Business Tax Measures | | | 77.1 | | | | 89.0 | |
| | | | | | | | |
| 1 | This represents the anticipated full year revenue impact of indexing the personal income tax brackets and the basic personal amount in 2020 as announced in Budget 2016. |
| * | Estimate is less than $70,000. |
| - | There has been no or limited uptake of this tax measure. |
C2 / Tax Measures BUDGET 2017
INTRODUCTION
Budget 2017 announces a number of personal and business tax measures. The government’s ongoing review of provincial tax benefits, deductions, rebates and exemptions, together with pre-budget consultations and input from Manitobans, has informed the measures being implemented in this Budget.
Manitoba’s tax credit system is among the most diversified and complex in Canada, and currently accounts for an annual fiscal outlay of approximately $600 million. This is equal to approximately 15% of total income tax revenue, spread out across more than 30 provincial tax credits. These credits add to Manitobans’ compliance costs and increase the administration fees paid by the province to the federal government.
In making these changes, the government is focused on ensuring an affordable and competitive tax environment that increases productivity, and encourages economic growth and job creation. In addition, the changes support the Minister of Finance’s mandate to restore the fiscal integrity of the province and move to a balanced budget.
The government remains committed to making Manitoba the most improved province in family tax relief by 2020. The 2016 Manitoba Budget was the first step towards meeting this goal by indexing personal income tax brackets and the Basic Personal Amount. These measures alone remove 2,100 tax payers from the tax rolls in 2017, and save Manitobans an estimated $21 million. In 2018, an additional 2,600 individuals will be removed from the tax rolls and Manitobans will save an additional $28 million in that year or $49 million cumulatively compared to 2016. Savings increase to an estimated $113 million cumulatively by 2020 and remove a 11,100 individuals from the tax rolls.
Budget 2017 takes difficult but sensible steps to ensure fiscal sustainability with a view to more effectively meeting the needs of Manitobans and businesses. The government will continue to review the provincial tax system going forward.
BUDGET 2017 Tax Measures / C3
ON-GOING TAX MEASURES
Indexing of Personal Income Tax Brackets and the Basic Personal Amount (BPA)
2017/18 revenue impact: -$23.3 million
As was announced in Budget 2016, Manitoba personal income tax brackets and the BPA are indexed to inflation by the Manitoba Consumer Price Index (CPI).
Tax savings from indexing the brackets are calculated at the applicable tax rates. The tax savings from a higher first bracket is the difference between being taxed at the first rate (10.8%), versus the second rate (12.75%). The tax savings from indexing the second bracket is the difference between being taxed at the second rate (12.75%), versus the top rate (17.4%) on the higher threshold. Over 2,100 Manitobans who would have paid tax at 10.8% will be removed from the tax rolls in 2017.
The following table summarizes the combined individual savings from indexation.
The following chart provides a five-year comparison of the anticipated increase in Manitoba’s BPA as a result of indexation against the forecasted provincial average BPA:
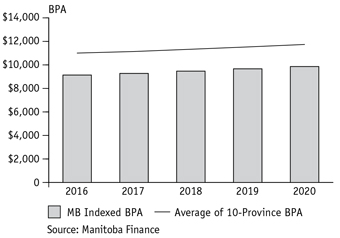
| | | | | | | | | | | | | | | | |
| | | Basic
Personal
Amount | | | First
Tax Bracket | | | Second
Tax Bracket | | | Combined
Individual
Savings | |
2016 Tax Year | | | $9,134 | | | | $31,000 | | | | $67,000 | | | | | |
Indexation Starts | | | | | | | | | | | | | | | | |
2017 Tax Year (index factor 1.5%) | | | $9,271 | | | | $31,465 | | | | $68,005 | | | | | |
| | | | |
Maximum Savings | | | $15 | | | | $9 | | | | $47 | | | | $71 | |
| |
2018 Tax Year (projected index factor 1.8%) | | | $9,438 | | | | $32,031 | | | | $69,229 | | | | | |
| | | | |
Cumulative Maximum Savings | | | $33 | | | | $20 | | | | $104 | | | | $157 | |
| |
2019 Tax Year (projected index factor 2.0%) | | | $9,627 | | | | $32,672 | | | | $70,614 | | | | | |
| | | | |
Cumulative Maximum Savings | | | $53 | | | | $33 | | | | $168 | | | | $254 | |
| |
2020 Tax Year (projected index factor 2.0%) | | | $9,819 | | | | $33,325 | | | | $72,026 | | | | | |
| | | | |
Cumulative Maximum Savings | | | $74 | | | | $45 | | | | $234 | | | | $353 | |
| |
For more information, please contact Location B, page C12.
C4 / Tax Measures BUDGET 2017
Extensions to Existing Tax Credits
2017/18 fiscal impact: -$10.4 million
In order to provide Manitobans and Manitoba businesses with greater planning certainty, the following tax credits are extended:
| ● | | The Manufacturing Investment Tax Credit, scheduled to expire on December 31, 2017, is extended to December 31, 2020. This credit supports businesses that purchase qualified plant, machinery and equipment for use in manufacturing or processing in Manitoba. |
| ● | | The Mineral Exploration Tax Credit, scheduled to expire on December 31, 2017, is extended to December 31, 2020. This credit supports Manitobans who invest in flow-through shares of qualifying mineral exploration companies and is equal to 30% of investments in flow-through shares. |
| ● | | The Book Publishing Tax Credit, scheduled to expire on December 31, 2017, is extended to December 31, 2018. This credit supports the development of the book publishing industry in Manitoba by providing a refundable tax credit equal to 40% of eligible Manitoba labour costs. |
| ● | | The Interactive Digital Media Tax Credit, scheduled to expire on December 31, 2019, is extended to December 31, 2022. This credit supports and attracts companies that develop and produce eligible interactive digital media products in Manitoba. |
BUDGET 2017 Tax Measures / C5
PERSONAL TAX MEASURES
Tuition Fee Income Tax Rebate
2017/18 revenue impact: $46.5 million
The Tuition Fee Income Tax Rebate is being phased out commencing in 2017.
Effective for the 2017 tax year, the annual cap an individual graduate can claim for this rebate is the lesser of Manitoba income tax payable, 10% of eligible tuition fees, or $500 (reduced from $2,500). The average claim amount was $1,100 in 2015.
The rebate is fully eliminated for the 2018 tax year at which time no rebate credits will be claimable. Any unclaimed rebate credits will lapse.
The government is reprofiling the Manitoba Bursary Program to better serve students’ needs while in school.
For more information, please contact Location B, page C12.
Tuition Fee Income Tax Rebate Advance
2017/18 expenditure impact: -$6.4 million
The Tuition Fee Income Tax Rebate Advance is eliminated effective for tuition and ancillary fees paid in relation to a school term that begins after April 2017.
Manitoba students will continue to benefit from the Education Amount and a basic tax credit on eligible tuition and ancillary fees. The federal government and some provinces have eliminated their Education Amount.
For more information, please contact Location B, page C12.
Primary Caregiver Tax Credit
2017/18 revenue impact: $8.6 million
This credit is a refundable individual income tax credit recognizing the support unpaid caregivers provide in assisting care recipients – including spouses, relatives, neighbours or friends – to stay in their own homes longer. Manitoba is one of only two provinces offering this type of support.
The Primary Caregiver Tax Credit is amended as follows:
| ● | | The annual credit claimable by a caregiver is capped at a maximum of $1,400 in 2017 and future years. The limit of three care recipients is removed but the maximum credit cannot exceed $1,400. Over 90% of caregivers who benefit from this credit are not impacted by this change. |
| ● | | Eligibility for this credit now begins in the year that the application is submitted to the assessing authority (i.e., a Regional Health Authority or the Department of Families). Starting this year, retroactive claims for years prior to 2017 are not permitted. However, if an application is submitted in 2017 but the credit is not claimed until 2019, the caregiver may still claim the credit for 2017 and 2018. |
For more information, please contact Location B, page C12.
C6 / Tax Measures BUDGET 2017
Political Contributions Tax Credit
2017/18 revenue impact: negligible
Effective starting with the 2018 tax year, the Political Contributions Tax Credit is enhanced by increasing the maximum eligible contribution from $1,275 to $2,325. This will result in an increase in the total available annual credit from $650 to $1,000.
This credit is earned on eligible contributions made to a recognized provincial political party or candidate for election to the Manitoba Legislature. The credit offsets Manitoba personal income tax otherwise payable and is delivered through the income tax system.
For more information, please contact Location B, page C12.
| | | | | | | | | | | | | | | | |
| | | Contribution | | | Tax Credit | | | Maximum Credit | | | Cumulative Credit
(and Maximum) | |
| | | | |
2017 (current) | | | $0 to $400 | | | | 75.0% | | | | $300 | | | | $300 | |
| | | $401 to $750 | | | | 50.0% | | | | $175 | | | | $475 | |
| | | $751 to $1,275 | | | | 33.3% | | | | $175 | | | | $650 | |
| | | | | | | | | | | | | | | | |
| |
| | | | |
Effective 2018 | | | $0 to $400 | | | | 75.0% | | | | $300 | | | | $300 | |
| | | $401 to $750 | | | | 50.0% | | | | $175 | | | | $475 | |
| | | $751 to $2,325 | | | | 33.3% | | | | $525 | | | | $1,000 | |
BUDGET 2017 Tax Measures / C7
BUSINESS TAX MEASURES
Research and Development Tax Credit
2017/18 revenue impact: $9.2 million
Effective for eligible expenditures made after April 11, 2017, the Research and Development Tax Credit is reduced from 20% to 15%. This will more closely align Manitoba’s support with other provinces for qualifying scientific research and development expenditures made by a corporation while maintaining Manitoba’s competitive position.
The credit is 100% refundable for research and development performed under contract with a prescribed Manitoba institution, including post-secondary institutions, and 50% refundable otherwise.
This change does not impact eligible expenditures made by corporations before April 12, 2017.
For more information, please contact Location A, page C12.
Paid Work Experience Tax Credit
2017/18 revenue impact: $2.3 million
Effective starting with the 2017 tax year, Crown corporations and other provincial government entities are no longer eligible for the Paid Work Experience Tax Credit. This does not affect the eligibility of other entities.
For more information, please contact Location B, page C12.
Corporation Capital Tax
2017/18 revenue impact: $0.1 million
The capital tax deduction is eliminated effective for fiscal years ending after April 30, 2017.
For more information, please contact Location D, page C12.
Manufacturing Investment Tax Credit
2017/18 revenue impact: $4.0 million
Effective for qualifying property acquired after April 11, 2017, the non-refundable portion of the Manufacturing Investment Tax Credit (MITC) is reduced from 2% to 1%.
This change does not impact the tax credit on qualified property acquired before April 12, 2017.
The 8% refundable MITC is not impacted by this change.
The following table provides an example of the impact of this change on $1,000 for qualified property.
| | | | | | | | |
| | | Before
April 12, 2017 | | | After
April 11, 2017 | |
| | |
Capital Cost | | | $1,000 | | | | $1,000 | |
Manitoba PST (8%) | | | $80 | | | | $80 | |
| | |
Total Capital Cost | | | $1,080 | | | | $1,080 | |
| | |
Refundable MITC (8%) | | | $(86) | | | | $(86) | |
Non-Refundable MITC (down from 2% to 1%) | | | $(22) | | | | $(11) | |
| | |
| | | $(108) | | | | $(97) | |
| | | | | | | | |
Net Capital Cost | | | $972 | | | | $983 | |
For more information, please contact Location A, page C12.
C8 / Tax Measures BUDGET 2017
Co-operative Development Tax Credit
2017/18 expenditure impact: negligible
The Co-operative Development Tax Credit is eliminated for contributions made after April 11, 2017.
This does not impact unused credits on eligible contributions previously made by co-operatives and credit unions towards co-operative development in Manitoba, which are available to be carried forward.
For more information, please contact Location C, page C12.
Odour Control Tax Credit
2017/18 revenue impact: negligible
The Odour Control Tax Credit is eliminated for expenditures made after April 11, 2017.
This does not impact unused credits on eligible expenditures made by businesses before April 12, 2017 that invested in capital property to control nuisance odours from the use or production of organic waste, which are available to be carried forward.
For more information, please contact Location B, page C12.
Nutrient Management Tax Credit
2017/18 revenue impact: negligible
The Nutrient Management Tax Credit is eliminated for expenditures made after April 11, 2017.
This does not impact the carry forward of unused credits for eligible expenditures made before April 12, 2017.
For more information, please contact Location B, page C12.
Riparian Tax Credit
2017/18 revenue impact: negligible
The Riparian Tax Credit is eliminated effective immediately.
This does not impact eligibility for unused credits on five-year commitments made before April 12, 2017 by farm operators and livestock producers to protect a strip along a waterway on agricultural land.
For more information, please contact Location B, page C12.
Neighbourhoods Alive! Tax Credit
2017/18 revenue impact: nil
The Neighbourhoods Alive! Tax Credit is eliminated effective immediately.
There have been no claimants since the inception of the credit in 2011.
For more information, please contact Location A, page C12.
Data Processing Investment Tax Credits
2017/18 revenue impact: nil
The Data Processing Investment Tax Credits are eliminated effective immediately.
This does not impact credits earned but which remain unused and eligible to be carried forward by corporations or partnerships for qualified property purchased or leased before April 12, 2017.
For more information, please contact Location A, page C12.
BUDGET 2017 Tax Measures / C9
TECHNICAL AND ADMINISTRATIVE TAX MEASURES
Changes are made to the accounting of tax expenditures, whereby the provincial government department responsible for the policy area will also be assigned the relevant tax expenditures in their appropriation, including:
– Education Property Tax Credit
– School Tax Credit for Homeowners
– Tuition Fee Income Tax Rebate Advance
| ● | | Growth, Enterprise and Trade |
– Interactive Digital Media Tax Credit
| ● | | Sport, Culture and Heritage |
– Film and Video Production Tax Credit –
Book Publishing Tax Credit
– Cultural Industries Printing Tax Credit
Technical updates are required for the following programs that were phased out by Canada in the 2016 Federal Budget but for which Manitoba is maintaining its support:
| ● | | the Children’s Arts and Cultural Activity Tax Credit; |
| ● | | the Fitness Tax Credit; and |
| ● | | the Manitoba Education Amount. |
For added certainty, legislation respecting the following credits is amended to ensure they are targeted to Manitoba residents:
| ● | | the Seniors’ School Tax Rebate; and |
| ● | | the Volunteer Firefighter and Search & Rescue Tax Credits. |
For more information, please contact Location B, page C12.
Corporations with less than $5,000 in tax payable in a fiscal year that file an annual instalment for Corporation Capital Tax will no longer be required to do so. As a result of this change, any tax owing is to be remitted when filing their annual Corporation Capital Tax Return.
Enforcement and administration measures will be enhanced under The Tax Administration and Miscellaneous Taxes Act and The Retail Sales Tax Act.
The administration of The Insurance Corporations Tax Act will be transferred to Taxation Division as of January 1, 2018. As a result of this change, taxpayers will only be required to pay their taxes when filing their annual return and be able to do so using Taxation Division’s online tax filing system. Further information will be provided later this year prior to the transfer in administration of the tax.
For more information, please contact Location D, page C12.
OTHER FINANCIAL MEASURES
The Financial Administration Act is being amended to account for federal changes to the calculation methodology of the Bank of Canada’s foreign exchange rates.
The Affordable Utility Rate Accountability Act is repealed for fiscal years after 2016/17.
C10 / Tax Measures BUDGET 2017
INTERPROVINCIAL COMPARISON OF TAX RATES
Figures are pre- and post-2017 provincial budgets. Data as of March 28, 2017.
| | | | | | | | | | | | | | | | | | | | | | | | | | | | | | | | | | | | | | | | | | | | |
| | | CAN | | | | | BC | | | | | AB | | | | | SK | | | | | MB | |
| | | | | | | | | | | | | |
| | | 2017 | | | | | Pre | | | Post | | | | | Pre | | | Post | | | | | Pre | | | Post | | | | | Pre | | | Post | |
Personal Income Tax | | | | | | | | | | | | | | | | | | | | | | | | | | | | | | | | | | | | | | | | | | | | |
| | | | | | | | | | | | | |
Top Mariginal Rate (%) | | | 33.00 | | | | | | 14.70 | | | | 14.70 | | | | | | 15.00 | | | | 15.00 | | | | | | 15.00 | | | | 15.00 | | | | | | 17.40 | | | | 17.40 | |
|
| |
Basic Personal Amount ($) | | | 11,474 | | | | | | 10,027 | | | | 10,208 | | | | | | 18,451 | | | | 18,690 | | | | | | 15,843 | | | | 16,065 | | | | | | 9,134 | | | | 9,271 | |
Health Care Premiums ($) | | | - | | | | | | 900 | | | | 900 | 1 | | | | | 1000 | | | | 1000 | | | | | | - | | | | - | | | | | | - | | | | - | |
| | | | | | | | | | | | | |
Health and Education Tax (%) | | | - | | | | | | - | | | | - | | | | | | - | | | | - | | | | | | - | | | | - | | | | | | 2.15 | | | | 2.15 | |
| | | | | | | | | | | | | |
Corporation Income Tax (%) | | | | | | | | | | | | | | | | | | | | | | | | | | | | | | | | | | | | | | | | | | | | |
|
| |
Small | | | 10.5 | | | | | | 2.5 | | | | 2.0 | 2 | | | | | 2.0 | | | | 2.0 | | | | | | 2.0 | | | | 2.0 | | | | | | 0.0 | | | | 0.0 | |
| | | | | | | | | | | | | |
Large | | | 15.0 | | | | | | 11.0 | | | | 11.0 | | | | | | 12.0 | | | | 12.0 | | | | | | 12.0 | | | | 12.0 | | | | | | 12.0 | | | | 12.0 | |
| | | | | | | | | | | | | |
Manufacturing | | | - | | | | | | 11.0 | | | | 11.0 | | | | | | 12.0 | | | | 12.0 | | | | | | 10.0 | | | | 10.0 | | | | | | 12.0 | | | | 12.0 | |
| | | | | | | | | | | | | |
Small Business Limit ($’000) | | | 500.0 | | | | | | 500.0 | | | | 500.0 | | | | | | 500.0 | | | | 500.0 | | | | | | 500.0 | | | | 500.0 | | | | | | 450.0 | | | | 450.0 | |
| | | | | | | | | | | | | |
Capital Tax (%) | | | | | | | | | | | | | | | | | | | | | | | | | | | | | | | | | | | | | | | | | | | | |
|
| |
Banks | | | - | | | | | | - | | | | - | | | | | | - | | | | - | | | | | | 3.25 | | | | 4.00 | | | | | | 6.00 | | | | 6.00 | |
Small Financial Institutions | | | - | | | | | | - | | | | - | | | | | | - | | | | - | | | | | | 0.70 | | | | 0.70 | | | | | | - | | | | - | |
Sales Tax (%) | | | 5.0 | | | | | | 7.0 | | | | 7.0 | | | | | | - | | | | - | | | | | | 5.0 | | | | 6.0 | | | | | | 8.0 | | | | 8.0 | |
| | | | | | | | | | | | | |
Gasoline Tax (¢/L) | | | 10.0 | | | | | | 21.17 | | | | 21.17 | 4 | | | | | 17.49 | | | | 19.73 | 5 | | | | | 15.0 | | | | 15.0 | | | | | | 14.0 | | | | 14.0 | |
|
| |
Diesel Fuel Tax (¢/L) | | | 4.0 | | | | | | 22.67 | | | | 22.67 | 6 | | | | | 18.35 | | | | 21.03 | 7 | | | | | 15.0 | | | | 15.0 | | | | | | 14.0 | | | | 14.0 | |
Tobacco Tax (¢/cigarette) | | | 10.780 | | | | | | 23.90 | | | | 24.70 | 8 | | | | | 25.00 | | | | 25.00 | | | | | | 25.00 | | | | 27.00 | | | | | | 29.50 | | | | 29.50 | |
Corporation Income Tax Credits | | | | | | | | | | | | | | | | | | | | | | | | | | | | | | | | | | | | | | | | | | | | |
Manufacturing (%) | | | - | | | | | | - | | | | - | | | | | | 10.0 | | | | 10.0 | 9 | | | | | 5.0 | | | | 6.0 | | | | | | 10.0 | | | | 9.0 | |
|
| |
Research and Development (%) | | | 35.0 | | | | | | 10.0 | | | | 10.0 | | | | | | 10.0 | | | | 10.0 | | | | | | 10.0 | | | | 10.0 | | | | | | 20.0 | | | | 15.0 | |
Political Contributions Tax Credit | | | | | | | | | | | | | | | | | | | | | | | | | | | | | | | | | | | | | | | | | | | | |
Maximum Eligible Contribution ($) | | | 1,275 | | | | | | 1,150 | | | | 1,150 | | | | | | 2,300 | | | | 2,300 | | | | | | 1,275 | | | | 1,275 | | | | | | 1,275 | | | | 2,325 | |
|
| |
Maximum Credit ($) | | | 650 | | | | | | 500 | | | | 500 | | | | | | 1,000 | | | | 1,000 | 10 | | | | | 650 | | | | 650 | | | | | | 650 | | | | 1,000 | |
| | | | | | | | | | |
| ⬛ | | Rate increased or tax credit decreased | | ☐ | | Rate decreased or exemption/credit increased | | - | | Not applicable |
| 1 | BC full premium for one adult is $900; full premium for a couple is $1,800; and children are exempt. |
| 2 | BC CIT small business rate down from 2.5% to 2.0% effective April 1, 2017. |
| 3 | NB CIT small business rate down from 3.5% to 3.0% effective April 1, 2017. |
| 4 | BC fuel tax rate includes a carbon tax on gasoline of 6.67¢/L. |
| 5 | AB fuel tax rate includes a carbon tax on gasoline of 4.49¢/L in 2017 and another 2.24¢/L in 2018. |
| 6 | BC fuel tax rate includes a carbon tax on diesel of 7.67¢/L. |
BUDGET 2017 Tax Measures / C11
| | | | | | | | | | | | | | | | | | | | | | | | | | | | | | | | | | | | | | | | | | | | | | | | | | | | | | | | |
| ON | | | | | QC | | | | | NB | | | | | NS | | | | | PE | | | | | NL | |
| | | | | | | | | | | | | | | | |
| Pre | | | Post | | | | | Pre | | | Post | | | | | Pre | | | Post | | | | | Pre | | | Post | | | | | Pre | | | Post | | | | | Pre | | | Post | |
| | | | | | | | | | | | | | | | | | | | | | | | | | | | | | | | | | | | | | | | | | | | | | | | | | | | | | | | |
| | | | | | | | | | | | | | | | |
| 13.16 | | | | 13.16 | | | | | | 25.75 | | | | 25.75 | | | | | | 20.30 | | | | 20.30 | | | | | | 21.00 | | | | 21.00 | | | | | | 18.37 | | | | 16.70 | | | | | | 16.80 | | | | 18.30 | |
|
| | |
| 10,011 | | | | 10,171 | | | | | | 11,550 | | | | 11,635 | | | | | | 9,758 | | | | 9,895 | | | | | | 8,481 | | | | 8,481 | | | | | | 8,000 | | | | 8,000 | | | | | | 8,802 | | | | 8,978 | |
| 900 | | | | 900 | | | | | | 1,625 | | | | 1,625 | | | | | | - | | | | - | | | | | | - | | | | - | | | | | | - | | | | - | | | | | | - | | | | - | |
| | | | | | | | | | | | | | | | |
| | 1.95 | | | | 1.95 | | | | | | 4.26 | | | | 4.26 | | | | | | - | | | | - | | | | | | - | | | | - | | | | | | - | | | | - | | | | | | 2.00 | | | | 2.00 | |
| | | | | | | | | | | | | | | | |
| | | | | | | | | | | | | | | | | | | | | | | | | | | | | | | | | | | | | | | | | | | | | | | | | | | | | | | | | |
|
| | |
| 4.5 | | | | 4.5 | | | | | | 8.0 | | | | 8.0 | | | | | | 3.5 | | | | 3.0 | 3 | | | | | 3.0 | | | | 3.0 | | | | | | 4.5 | | | | 4.5 | | | | | | 3.0 | | | | 3.0 | |
| | | | | | | | | | | | | | | | |
| | 11.5 | | | | 11.5 | | | | | | 11.9 | | | | 11.9 | | | | | | 14.0 | | | | 14.0 | | | | | | 16.0 | | | | 16.0 | | | | | | 16.0 | | | | 16.0 | | | | | | 15.0 | | | | 15.0 | |
| | | | | | | | | | | | | | | | |
| | 10.0 | | | | 10.0 | | | | | | 11.9 | | | | 11.9 | | | | | | 12.0 | | | | 12.0 | | | | | | 16.0 | | | | 16.0 | | | | | | 16.0 | | | | 16.0 | | | | | | 15.0 | | | | 15.0 | |
| | | | | | | | | | | | | | | | |
| | 500.0 | | | | 500.0 | | | | | | 500.0 | | | | 500.0 | | | | | | 500.0 | | | | 500.0 | | | | | | 350.0 | | | | 350.0 | | | | | | 500.0 | | | | 500.0 | | | | | | 500.0 | | | | 500.0 | |
| | | | | | | | | | | | | | | | |
| | | | | | | | | | | | | | | | | | | | | | | | | | | | | | | | | | | | | | | | | | | | | | | | | | | | | | | | | |
|
| | |
| - | | | | - | | | | | | - | | | | - | | | | | | 5.00 | | | | 5.00 | | | | | | 4.00 | | | | 4.00 | | | | | | 5.00 | | | | 5.00 | | | | | | 6.00 | | | | 6.00 | |
| | | | | | | | | | | | | | | | | | | | | | | | | | | | | | | | | | | | | | | | | | | | | | | | | | | | | | | | |
| 8.0 | | | | 8.0 | | | | | | 9.975 | | | | 9.975 | | | | | | 10.0 | | | | 10.0 | | | | | | 10.0 | | | | 10.0 | | | | | | 10.0 | | | | 10.0 | | | | | | 10.0 | | | | 10.0 | |
| | | | | | | | | | | | | | | | |
| 14.7 | | | | 14.7 | | | | | | 19.2 | | | | 19.2 | | | | | | 15.5 | | | | 15.5 | | | | | | 15.5 | | | | 15.5 | | | | | | 13.1 | | | | 13.1 | | | | | | 33.0 | | | | 33.0 | |
|
| | |
| 14.3 | | | | 14.3 | | | | | | 20.2 | | | | 20.2 | | | | | | 21.5 | | | | 21.5 | | | | | | 15.4 | | | | 15.4 | | | | | | 20.2 | | | | 20.2 | | | | | | 21.5 | | | | 21.5 | |
| 15.475 | | | | 15.475 | | | | | | 14.90 | | | | 14.90 | | | | | | 22.26 | | | | 25.52 | | | | | | 27.52 | | | | 27.52 | | | | | | 25.0 | | | | 25.0 | | | | | | 24.50 | | | | 24.50 | |
| | | | | | | | | | | | | | | | | | | | | | | | | | | | | | | | | | | | | | | | | | | | | | | | | | | | | | | | | |
| - | | | | - | | | | | | 4.0 | | | | 4.0 | | | | | | - | | | | - | | | | | | - | | | | - | | | | | | 10.0 | | | | 10.0 | | | | | | - | | | | - | |
|
| | |
| 14.5 | | | | 11.5 | | | | | | 37.5 | | | | 37.5 | | | | | | 15.0 | | | | 15.0 | | | | | | 15.0 | | | | 15.0 | | | | | | - | | | | - | | | | | | 15.00 | | | | 15.0 | |
| | | | | | | | | | | | | | | | | | | | | | | | | | | | | | | | | | | | | | | | | | | | | | | | | | | | | | | | | |
| 3,026 | | | | 3,026 | | | | | | 200 | | | | 200 | | | | | | 1,075 | | | | 1,075 | | | | | | 1,000 | | | | 1,000 | | | | | | 1,150 | | | | 1,150 | | | | | | 1,150 | | | | 1,150 | |
| 1,330 | | | | 1,330 | | | | | | 155 | | | | 155 | | | | | | 500 | | | | 500 | | | | | | 750 | | | | 750 | | | | | | 500 | | | | 500 | | | | | | 500 | | | | 500 | |
| 7 | AB fuel tax rate includes a carbon tax on diesel of 3.35¢/L in 2017 and another 2.68¢/L in 2018. |
| 8 | BC tobacco tax will rise to 24.7¢/cigarette effective on October 1, 2017. |
| 9 | The AB Capital Investment Tax Credit (CITC) is a two year non-refundable tax credit (2017 and 2018) for eligible capital expenditures on manufacturing, processing and tourism infrastructure. |
| 10 | AB, this amount can be claimed for each of two different types of receipts (provincial elections, senatorial). |
C12 / Tax Measures BUDGET 2017
CONTACTS FOR FURTHER INFORMATION
| | | | | | |
| | | |
| A | | Finance Research Division Manitoba Finance | | Telephone Fax E-mail | | 204-945-3757 204-945-5051 feedbackfin@gov.mb.ca |
| | | |
| B | | Manitoba Tax Assistance Office Manitoba Finance | | Telephone Toll-free Fax E-mail | | 204-948-2115 in Winnipeg 1-800-782-0771 in Manitoba 204-948-2263 tao@gov.mb.ca |
| | | |
| C | | Manitoba Growth, Enterprise and Trade | | Telephone Toll-free Fax E-mail | | 204-945-8468 in Winnipeg 1-800-282-8069 in Manitoba 204-945-1193 kristine.seier@gov.mb.ca |
| | | |
| D | | Taxation Division Manitoba Finance | | Telephone Toll-free Fax E-mail | | 204-945-5603 in Winnipeg 1-800-782-0318 in Manitoba 204-945-0896 mbtax@gov.mb.ca |
Budget Paper D
FISCAL ARRANGEMENTS
FISCAL ARRANGEMENTS
CONTENTS
| | |
INTRODUCTION | | D1 |
| |
MAJOR FEDERAL TRANSFERS TO PROVINCIAL AND TERRITORIAL GOVERNMENTS | | D1 |
| |
Equalization | | D1 |
| |
Canada Social Transfer | | D2 |
| |
Canada Health Transfer | | D3 |
| |
THE CURRENT FEDERAL HEALTH CARE FUNDING OFFER | | D4 |
| |
OTHER FEDERAL TRANSFERS TO PROVINCES AND TERRITORIES | | D6 |
| |
TRANSFERS TO PERSONS | | D7 |
| |
Canada Pension Plan Enhancement | | D8 |
| |
Pooled Registered Pension Plans | | D9 |
| |
CONCLUSION | | D9 |
BUDGET 2017 Fiscal Arrangements / D1
INTRODUCTION
Each year the federal government makes transfer payments to help fund important public services like health care, post-secondary education, social assistance, social services, and programs for seniors and children.
The design and operation of federal transfers has a significant impact on the lives of citizens in all provinces and territories, as well as on regional labour markets and economies. Provincial and territorial input into the workings of these programs is essential.
MAJOR FEDERAL TRANSFERS TO PROVINCIAL AND TERRITORIAL GOVERNMENTS
The vast majority of federal funding provided to the provinces and territories is through four major transfers including the Canada Health Transfer (CHT), Canada Social Transfer (CST) and Equalization/Territorial Formula Financing. Initial estimates suggest Manitoba will receive $3.7 billion in combined major transfers in 2017/18, up from $3.5 billion in 2016/17.
Major federal transfers are an important source of revenue for all provinces and territories. For Manitoba, the major transfers are budgeted to account for 22.8% of total provincial summary revenue in 2017/18, down from 26.9% in 2009/10.
Major federal transfers to Manitoba have been increasing at a more modest rate than in most other provinces and territories. While Manitoba’s combined major transfers were flat from 2009/10 to 2014/15, other provinces and territories received increases as high as 65%. Even with the recent growth, Manitoba’s total major transfers since 2009/10 have grown by less than 10% – well below the 38% average increase for all provinces and territories.
This lack of major transfer growth has added to the financial challenges facing the province, particularly in light of the increased demand for public services resulting from Manitoba’s rapidly growing population.
Manitoba’s population growth in 2016 was again among the strongest in the nation, growing by an estimated 1.7%, the second highest among provinces, and well above the 1.2% growth rate for Canada as a whole.
In fact, once population growth is taken into account, the province’s combined major federal transfers have actually declined by -1.2% on a per capita basis, or $34 per person, since 2009/10, and by almost -14% when both population growth and inflation are taken into account.
Per Capita Growth in Major Transfers,
by Province, 2009/10 to 2017/18
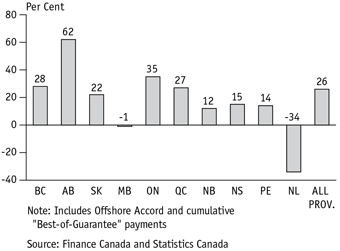
While Manitoba’s per capita major transfers have declined since 2009/10, total per capita major transfers to all provinces and territories have grown by 26.5% over the same period. Manitoba, and Newfoundland and Labrador are the only two provinces where combined per capita major federal transfers are lower in 2017/18 than they were in 2009/10.
Equalization
Canada has had a formal Equalization program since 1957. The program is financed entirely by the federal government. As equalization payments are unconditional, provinces can allocate the funding to best meet the needs of their residents.
Manitoba will receive $1.8 billion in Equalization in 2017/18. Equalization is expected to account for about
D2 / Fiscal Arrangements BUDGET 2017
Total Major Federal Transfer Entitlements to Manitoba, 2009/10 to 2017/18
| | | | | | | | | | | | | | | | | | | | | | | | | | | | | | | | | | | | |
| | | 9/10 | | | 10/11 | | | 11/12 | | | 12/13 | | | 13/14 | | | 14/15 | | | 15/16 | | | 16/17 | | | 17/18 | |
| | | (Millions of Dollars) | |
| | | | | | | | | |
CHT | | | 903 | | | | 943 | | | | 993 | | | | 1,057 | | | | 1,124 | | | | 1,156 | | | | 1,229 | | | | 1,310 | | | | 1,355 | |
| | | | | | | | | |
CST | | | 392 | | | | 404 | | | | 418 | | | | 426 | | | | 440 | | | | 453 | | | | 468 | | | | 485 | | | | 502 | |
| | | | | | | | | |
Equalization | | | 2,063 | | | | 1,826 | | | | 1,666 | | | | 1,671 | | | | 1,792 | | | | 1,750 | | | | 1,738 | | | | 1,736 | | | | 1,820 | |
| | | | | | | | | |
TTP | | | | | | | 175 | | | | 276 | | | | 201 | | | | 7 | | | | | | | | | | | | | | | | | |
| | | | | | | | | |
Total | | | 3,359 | | | | 3,348 | | | | 3,352 | | | | 3,355 | | | | 3,363 | | | | 3,359 | | | | 3,436 | | | | 3,530 | | | | 3,677 | |
| | | | | | | | | |
Per Capita | | | 2,783 | | | | 2,746 | | | | 2,721 | | | | 2,688 | | | | 2,660 | | | | 2,626 | | | | 2,655 | | | | 2,683 | | | | 2,749 | |
Note: Federal TTP was provided between 2010/11 and 2013/14 to ensure that a province’s total major transfers in one of those years was no lower than in the previous year.
Source: Finance Canada
11.3% of total Manitoba summary revenue in 2017/18, down from 16.5% of total summary revenue in 2009/10.
Equalization is the federal government’s main transfer program for reducing fiscal or revenue-raising disparities between provinces. Before any adjustments, the program calculates the revenues a province could raise on its own at typical rates of taxation and any shortfall relative to an all-province standard is paid out in Equalization.
Now that both the CHT and CST are allocated on a per capita basis, Equalization is the only major federal transfer that takes into account differences in the provinces’ revenue-raising capacities. The Equalization program is currently under review with the provinces and will be renewed in 2019/20.
In 2009/10, the federal government unilaterally announced it was limiting growth in the Equalization program to growth in the national economy, as measured by a three-year moving average of national, nominal Gross Domestic Product (GDP).
The impact of this decision has been significant, reducing funding for Equalization by $26.5 billion since 2009/10, including $2.5 billion in 2017/18. Federal Total Transfer Protection (TTP) payments were in place between 2010/11 and 2013/14, and acted to reduce the impact on provinces. TTP reduced the total loss by $2.2 billion to $24.3 billion. After taking the value of TTP payments into account, Manitoba’s cumulative loss has now reached $200 million.
While the constraints on Equalization have reduced expenditures for the federal government, they have undermined the purpose of the program, which is to bring the revenue-raising capacity of receiving-provinces up to the all-province standard. The result is increased revenue disparities among the provinces.
It is noteworthy that the legislated growth path for Equalization can also act as a payment floor. Should this situation occur, it would offset some of the $24 billion in funding reductions that have occurred to date under the caps.
Canada Social Transfer
The CST is a federal block transfer in support of post-secondary education, social assistance and social services, early childhood development, and early learning and child care. It accounts for only a minor portion of Manitoba’s total spending on these important social programs.
The CST has been allocated on an equal per capita basis since 2007/08 and is legislated to grow by 3% per year.
Manitoba will receive an estimated $502 million in CST funding in 2017/18, up from $485 million in 2016/17. The CST is expected to account for about 3.1% of total Manitoba summary revenue in 2017/18, the same share as in 2009/10.
BUDGET 2017 Fiscal Arrangements / D3
The federal government’s decision to maintain the CST growth track at 3% rather than increase it at the rate of nominal GDP, along with the other major transfers, will tend to reduce over time the federal share of provincial and territorial spending on post-secondary education and social services.
Canada Health Transfer
Like all provinces and territories, Manitoba faces significant challenges in maintaining health care services. Cost pressures continue to increase while the federal funding partnership continues to decline.
Health care is the single largest budget item for provinces and territories, typically accounting for about 40% of total government expenditures. Provinces have the primary responsibility for the delivery of health care under Canada’s Constitution Act.
The CHT is the federal government’s primary transfer in support of provincial and territorial government expenditures on health care. Funding is conditional on provinces and territories meeting the five conditions of the Canada Health Act (public administration, comprehensiveness, universality, portability and accessibility), as well as provisions relating to extra billing and user charges.
Manitoba will receive an estimated $1.36 billion in CHT funding in 2017/18, up from $1.31 billion in 2016/17. The CHT is expected to account for about 8.4% of total Manitoba summary revenue in 2017/18, up from 7.2% of total summary revenue in 2009/10.
The CHT has been allocated on an equal per capita basis since 2014/15 (i.e. its allocation is determined by each province and territory’s share of the national population – Manitoba’s population share is 3.65%).
CHT payments to all provinces and territories grew by 6% per year from 2006/07 to 2013/14 as part of the 10-Year Plan to Strengthen Health Care, the Health Accord signed by all First Ministers in 2004. The 6% escalator was subsequently extended for three years to 2016/17.
For 2017/18 and beyond, the federal government has legislated that growth in the total CHT will slow to
3% per year or at a rate equal to a three-year moving average of national, nominal GDP growth, whichever is higher.
The reduction in the growth rate of the CHT comes at the expense of provinces and territories that are left to address the rising cost of health care.
Cutting the rate of growth in the CHT significantly reduces federal support for health care in Manitoba, and the other provinces and territories.
A November 2016 report prepared for Canada’s Premiers through The Council of The Federation (COF), determined the change in the annual growth rate of the CHT from 6%, will reduce federal health transfers to provinces and territories by $1.1 billion in 2017/18 and $61.7 billion over 10 years.
Manitoba estimates the reduction in the CHT’s annual growth rate from 6% will reduce transfers to the province by $39 million in 2017/18 and about $2.2 billion over the next 10 years.
The COF report noted that the reduction in the CHT is occurring at a time when demands on the health care system are increasing. Population ageing alone is expected to cost provincial and territorial governments billions of dollars per year in added health care costs.
As part of its election commitment in 2015, the current federal government had indicated that it would pursue a new multi-year Health Accord and a long-term funding agreement with the provinces and territories to help strengthen the public health system, particularly with respect to home care and mental health services.
In December 2016, in the absence of promised negotiations with provinces and territories, the federal government presented a unilateral, time-limited offer at the Finance Ministers’ Meeting (3.5% fixed growth in the CHT for five years plus an additional $11 billion over ten years in money targeted for home care and mental health services). The provinces and territories unanimously rejected that offer, arguing the annual increase should be about 5.2% to better reflect the estimated annual average cost of providing health care services.
D4 / Fiscal Arrangements BUDGET 2017
| | | | | | | | |
| | THE CURRENT FEDERAL HEALTH CARE FUNDING OFFER | | |
| | The federal government’s health care offer is inadequate and does not achieve the sustainable funding partnership required to keep up with growing health care needs. Where once there was 50/50 cost sharing of health care costs between Manitoba and the federal government, today the province pays about 80% of total health care costs. The proposal currently on the table from the federal government will further erode the federal share of health spending and put additional fiscal strain on provinces and territories, including Manitoba. The current federal offer includes an equal per capita share of the legislated CHT which will increase by three per cent per year or by a three-year moving average of national, nominal GDP growth, whichever is higher. It also includes $11 billion over 10 years in targeted funding for home care and mental health services. Manitoba’s per capita share of the $11 billion in targeted federal funding is about $400 million over 10 years (and about $11 million in 2017/18). | | |
| | Comparison of Federal Health Funding Scenarios,
Manitoba Amounts, 10 Years 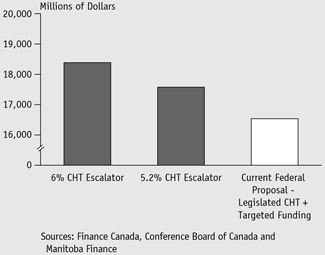
| | | | Federal Health Care Funding Offer
to Manitoba, 10-Year Amount (2017/18 to 2026/27) 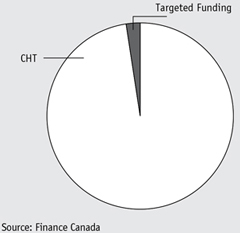
| | |
| | While Manitoba recognizes the need for additional federal funding for home care and mental health services, the $400 million over 10 years would account for less than 5% of what Manitoba projects it will invest in these two areas over the same time period. Under the federal offer made to other provinces, Manitoba would receive $18 million less from the federal government in 2017/18 than the research indicates will be needed to address the cost pressures facing the province’s health care system. A loss of $18 million over just one year is significant and would be enough to pay for 2,084 home care clients, 25,788 MRIs, 1,505 unilateral hip replacements or 180 people on hemodialysis. The federal government’s current offer will not be sufficient to meet the ever increasing fiscal pressures impacting Manitoba’s budget and health care system, particularly as the Manitoba population continues to grow and age. | | |
BUDGET 2017 Fiscal Arrangements / D5
| | | | | | | | | | | | |
| | Aspects of Manitoba’s health care needs are unique. For example, Manitoba has the highest rate of chronic kidney disease in the country. By 2024, more than 3,000 Manitobans will need treatment for kidney failure either by dialysis or transplant. Chronic kidney disease is disproportionately evident among Manitoba’s northern and remote communities, occurring at a rate of two to three times higher than that faced by other population segments in our province. These unique realities necessitate a strong federal partnership. Manitoba is pleased with the federal government’s recent commitment to funding aimed at improving health outcomes for First Nations and Inuit peoples. This investment is the action Manitoba was calling for and we look forward to working with our federal partners to meaningfully address disparities in Indigenous and non-Indigenous health services and health outcomes, including appropriate federal support of medical transportation. | | |
| | | | | | | Manitoba’s concern with the inadequacy of the federal offer is supported by a number of independent experts that looked at the sufficiency of the CHT’s new lower growth rate, including the Conference Board of Canada. A report prepared by the Conference Board of Canada on behalf of Canada’s Premiers suggests that health care costs are expected to grow by an annual average of 5.2% per year from 2015 to 2035. The Conference Board forecast of health costs was based on their assessment of key cost drivers in the health care system, including demographic changes (i.e. ageing and population growth), cost inflation and ongoing enrichment and adaptation to address changes in public expectations, professional standards, accessibility, innovation and technology. | | |
| | Canadian Health Care Cost Drivers, 2015 to 2035 | | | | | | |
| | Demographics | | | | | | | | | |
| | Population Growth | | | 0.9% | | | | | | |
| | Ageing | | | 1.0% | | | | | | |
| | Inflation | | | | | | | | | |
| | Consumer Price Index | | | 2.0% | | | | | | |
| | Health Care Inflation | | | 0.5% | | | | | | |
| | Sub-Total | | | 4.4% | | | | | | |
| | Ongoing Enrichment | | | | | | | | | |
| | Access, Adaptation and Innovation | | | 0.8% | | | | | | |
| | Total Average Annual Increase | | | 5.2% | | | | | | |
| | Source: The Conference Board of Canada | | | | | | | | | |
| | A February 2017 study from the Institute of Fiscal Studies and Democracy concluded that “beyond fiscal 2018-19, health care costs are expected to continue increasing at a pace well above the growth in the CHT proposed by the federal government. Consequently, the CHT is likely to fall over time as a share of total health expenditures.” It noted regardless of the forecasts used, the health care cost drivers are very real and growth in the CHT will be insufficient to meet the increasing pressures on provincial and territorial health care systems. In 2014, the Office of the Parliamentary Budget Officer aptly pointed out that “By indexing the Canada Health Transfer to GDP, the federal government has insulated itself from the impact of demographics on health spending. Federal spending on health transfers will grow inversely with health care costs; as the population ages, GDP growth will decline.” Manitoba has indicated a desire to return to the negotiating table to secure a partnership on health care. | | |
D6 / Fiscal Arrangements BUDGET 2017
Since the December 2016 meeting, nine provinces and the territories have been forced to accept the federal government’s unilateral approach on the dramatic reduction of the legislated CHT growth rate. Out of fear that their respective shares of the targeted federal funding supports for home care and mental health would otherwise be lost, bilateral agreements have resulted.
Manitoba is now the last remaining jurisdiction without a bilateral agreement. While the federal government cannot be dissuaded from its reduced CHT growth rate agenda, Manitoba continues to advocate for additional considerations that reflect the province’s unique health care needs and circumstances. This advocacy has already played a role in securing the large scale national investments being made by the federal government towards improving First Nations and Inuit Health Care Outcomes, which will significantly benefit Manitoba. And Manitoba’s share of the targeted home care and mental health funding has been secured – through the recent federal budget – pending the finalization of related negotiations.
Manitoba’s determination to manage the significant funding challenges created by the imposed federal government approach will continue, as it makes the best of a difficult situation now and over the longer term.
OTHER FEDERAL TRANSFERS TO PROVINCES AND TERRITORIES
In addition to the major transfer programs, the federal government also transfers funds to the provinces and territories to support investments in specific program areas. One prominent example is targeted funding provided through federal-provincial/territorial Labour Market Transfer Agreements (LMTAs). The federal government will transfer close to $3 billion through the LMTAs in 2017/18. This funding helps to support labour market development programs delivered by the provinces and territories.
The federal government has committed to collaborate with the provinces and territories to undertake a
significant reform of the LMTAs. Adequate, fairly distributed and flexible federal funding going forward will be necessary if provinces are to innovate and effectively address their unique and ever evolving labour market challenges.
Manitoba continues to be concerned with the manner in which funding provided through the Labour Market Development Agreements (LMDAs) is allocated to the provinces and territories. The national amount of core program funding transferred under the LMDAs has been fixed at $1.95 billion since 2000, by far the largest of the LMTAs. However, since the LMDA was fully implemented, Manitoba’s allocation has declined every year but one. This has resulted in a cumulative loss of over $60 million in LMDA funding for Manitoba since 2000/01.
LMDA Funding

In 2009/10 and 2010/11, in response to the recession, the federal government transferred an additional $1 billion nationally over 2 years through the LMDAs. The federal government also provided an additional $125 million nationally in 2016/17. Whereas this additional funding has helped to partially offset the ongoing reductions in Manitoba’s annual LMDA amount, it has not been enough to keep up with the increased need for skills training in the province.
BUDGET 2017 Fiscal Arrangements / D7
Manitoba’s capacity to meet ongoing demand for skills training through the LMDA remains well below pre-recession levels. For example, once adjusted for the number of regular Employment Insurance (EI) beneficiaries, Manitoba now has $800 less in LMDA funding per person than it did in 2008, and 20% less funding per person than the national average. Manitoba would like the federal government to consider a more equitable approach to allocating labour market funding as part of its commitment to improve the LMTAs.
LMDA Allocation Per Regular EI Beneficiary,
2008 to 2016
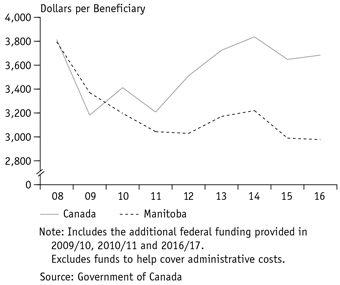
Currently, federal labour market transfers are administered through several separate agreements, each with their own specific monitoring and reporting requirements. In addition to the LMDA, which is for persons who are eligible for EI, there are separate agreements for non-EI eligible unemployed and low-skilled workers, older workers and persons with disabilities. These agreement-specific eligibility and accountability requirements add to the complexities and costs of delivering labour market programs in the provinces and territories.
In its most recent budget, the federal government has proposed reducing the number of labour market agreements from four to two, one for those who are eligible for EI (by maintaining the LMDAs), and a new, consolidated agreement for unemployed and
underemployed Canadians who are not eligible for EI. Manitoba feels this is a step in the right direction and looks forward to working with the federal government on the details of these agreements. A more streamlined approach should help to support more efficient and coherent labour market and skills development systems across Canada.
TRANSFERS TO PERSONS
In addition to funding transferred directly to provincial and territorial governments, the federal government will also transfer around $96 billion in 2017/18 directly to individuals through elderly benefits, EI benefits and children’s benefits. This represents almost one-third of total federal program spending.
Federal elderly benefits are provided through the Old Age Security (OAS) Program, which includes the Guaranteed Income Supplement (GIS). The OAS/GIS is an important component of Canada’s retirement income system, along with the Canada Pension Plan (CPP) and voluntary private savings.
Concerns with the adequacy of Canada’s retirement income system have received much attention over the past several years. Research commissioned by finance ministers suggests that some Canadians, particularly middle-income earners and younger workers, are at risk of not maintaining their standard of living in retirement. One of the main reasons for this is
Share of Private Sector Employees
Covered by an RPP, Ten Provinces
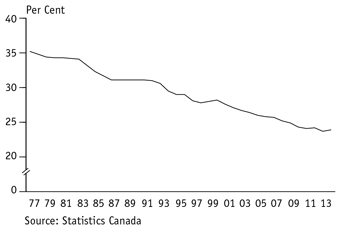
D8 / Fiscal Arrangements BUDGET 2017
the steady decline in registered pension plan (RPP) coverage. The share of private sector employees covered by an RPP has fallen from over 35% in the 1970’s, to under 25% today.
In 2010, based on significant research, finance ministers agreed to a multi-pronged strategy to strengthen the retirement income system. The strategy included:
| ● | | Considering a modest, phased-in and fully funded enhancement of the CPP. |
| ● | | Pension innovations that would allow financial institutions to offer broad-based defined contribution pension arrangements to multiple employers, all employees and to the self-employed. |
| ● | | Promoting financial literacy so that people who are saving for retirement will make better-informed decisions. |
In June 2016, federal and provincial finance ministers agreed on an approach for a modest enhancement of the CPP. On March 2, 2017, the federal legislation needed to fully implement the CPP enhancement came into force, following formal consent through Orders in Council from all provinces, with the exception of Quebec.
| | |
“I would like to thank Canada’s Finance Ministers for their hard work in reaching an historic agreement to make the CPP even better. Their commitment to improving the lives of Canadians in retirement is an example of what we can accomplish together—and of federalism at its best.” – The Honourable Bill Morneau, Minister of Finance Canada, News Release, March 2, 2017 | | |
Manitoba’s support for the CPP enhancement was provided after securing a commitment from the federal government to consider several Manitoba proposals for additional enhancements to help modernize the plan. At the December 2016 Federal, Provincial and Territorial Finance Ministers’ Meeting, all ministers agreed to prioritize the issues raised by Manitoba, including a comprehensive review of CPP supplementary
benefits, as part of the 2016-2018 Triennial Review of the CPP. Manitoba believes the CPP must continue to be affordable for workers and employers. The cost of any proposed changes, or combination of changes, must be subject to careful consideration in order to avoid impacts on overall contribution rates.
| | |
“Manitoba’s new provincial government successfully advocated with the federal, provincial and territorial governments for further research and analysis to be conducted on a number of modifications that would make the CPP not just bigger, but better as well” – Honourable Cameron Friesen, Minister of Finance, Government Resolution, Legislative Assembly of Manitoba, November 30, 2016 | | |
| | |
Canada Pension Plan Enhancement The CPP is a universal and portable public pension plan that is an important source of retirement income for virtually all Canadians. The CPP is financed by contributions from workers and employers, and is administered by the federal government. The CPP also provides contributors and their families with partial replacement of earnings in the case of disability or death. The upcoming CPP enhancement will increase the income replacement level from one-quarter to one-third, and the upper earnings limit by 14%. The CPP enhancement will also increase survivor and disability benefits subject to the amount of contributions made to the enhanced plan. The Government of Canada and the provinces are the joint stewards of the CPP. Major changes to the federal legislation governing the CPP require the formal consent of the Parliament of Canada and at least 7 out of the 10 provinces representing two-thirds of the population of the 10 provinces. | | |
BUDGET 2017 Fiscal Arrangements / D9
Pooled Registered Pension Plans
In addition to supporting a modest enhancement of the CPP, Manitoba will be partnering with the federal government and several other provinces in bringing Pooled Registered Pension Plans (PRPPs) to the province. PRPPs will provide Manitobans with another option to save for retirement.
A PRPP is an innovative new voluntary pension arrangement that pools contributions together to achieve larger scale and lower costs in relation to investment management and plan administration, allowing workers to keep more of their savings. PRPPs are straightforward in design and implementation so that it will be easier for small and medium sized businesses to offer plans to their employees. PRPPs are portable so that employees are able to maintain or transfer their plan when changing employers and/or moving to another province or territory.
Although Manitoba has relatively high pension coverage compared to the other provinces, still over two-thirds of private sector workers in Manitoba are not covered by an RPP. The implementation of PRPPs in Manitoba will help to increase pension coverage in the province.
CONCLUSION
Federal transfer payments to other levels of government and directly to persons play an important role in helping fund Canadian priorities. They also play an important role in helping to ensure that all provinces and territories have the financial means to offer their residents comparable public services at reasonably comparable levels of taxation.
Manitoba continues to be concerned with the federal government’s unilateral approach related to transfer programs and in particular its refusal to engage in meaningful discussions on a long-term and sustainable health care funding partnership.
The decision by the federal government to gradually reduce its share of Manitoba’s health care expenditures will increase the fiscal challenges facing the province as it seeks to maintain a balanced budgetary position over the long term, while still meeting the health care needs of a growing and ageing population.
D10 / Fiscal Arrangements BUDGET 2017