Exhibit 99.1
MANITOBA
2017/18
First Quarter Report
Honourable Cameron Friesen
Minister of Finance

| | |
| FIRST QUARTER REPORT | | APRIL TO JUNE 2017 |
SUMMARY
Budget 2017 provided the financial overview of the Government Reporting Entity (GRE) which includes core government, government business enterprises (such as Manitoba Hydro and Manitoba Public Insurance), and other reporting entities such as health authorities, social service authorities and school divisions.
Manitoba’s summary budget aligns with the accounting standards set by the Public Sector Accounting Board (PSAB) and fully reflects Generally Accepted Accounting Principles (GAAP). The financial information in this report is presented in the same format as the budget.
| | | | |
| GOVERNMENT REPORTING ENTITY | | | |
Millions of Dollars | | | | |
| | | 2017/18
Budget | |
Revenue | | | | |
Income Taxes | | | 4,194 | |
Other Taxes | | | 4,497 | |
Fees and Other Revenue | | | 2,307 | |
Federal Transfers | | | 4,163 | |
Net Income of Government Business Enterprises | | | 705 | |
Sinking Funds and Other Earnings | | | 235 | |
| |
Total Revenue | | | 16,101 | |
| |
Expenditure | | | | |
Health | | | 6,681 | |
Education | | | 4,400 | |
Families | | | 2,159 | |
Community, Economic and Resource Development | | | 1,531 | |
Justice and Other Expenditures | | | 1,294 | |
Debt Servicing | | | 991 | |
| |
Total Expenditure | | | 17,056 | |
| |
In-Year Adjustments/Lapse | | | (115 | ) |
| |
Net Income (Loss) | | | (840 | ) |
- 1 -
| | |
| FIRST QUARTER REPORT | | APRIL TO JUNE 2017 |
CORE GOVERNMENT
The core government budget provides information on the core government activities – the revenue and expenditure of government departments that are under the direct control of the Legislative Assembly.
These revenues and expenditures reflect the day-to-day decisions that ultimately determine the success of the government strategies, plans and programs.
| | | | |
| CORE GOVERNMENT | | | |
Millions of Dollars | | | | |
| | | 2017/18
Budget | |
Revenue | | | | |
Income Taxes | | | 4,194 | |
Other Taxes | | | 3,795 | |
Fees and Other Revenue | | | 584 | |
Federal Transfers | | | 3,851 | |
Net Income of Government Business Enterprises | | | 592 | |
| |
Total Revenue | | | 13,016 | |
| |
Expenditure | | | | |
Health | | | 6,105 | |
Education | | | 2,772 | |
Families | | | 2,033 | |
Community, Economic and Resource Development | | | 1,532 | |
Justice and Other Expenditures | | | 1,138 | |
Debt Servicing | | | 240 | |
| |
Total Expenditure | | | 13,820 | |
| |
In-Year Adjustments/Lapse | | | (35 | ) |
| |
Net Result for the Year | | | (769 | ) |
| |
Transfer to Fiscal Stablization Account | | | (10 | ) |
| |
Net Income (Loss) | | | (779 | ) |
- 2 -
| | |
| FIRST QUARTER REPORT | | APRIL TO JUNE 2017 |
QUARTERLY FINANCIAL RESULTS
The unaudited net result of the core government for the first three months of the fiscal year is a loss of $(63) million.
The three-month revenue variance of $27 million primarily reflects higher than anticipated Retail Sales Tax due to higher than projected economic growth.
The three-month expenditure variance of $(2) million is primarily the result of timing of expenditures in various departments.
A full year projection will be provided in the next quarterly report.
| | | | | | | | | | | | | | | | | | | | |
| CORE GOVERNMENT OPERATING STATEMENT | | | | | | | | | | | | | | | |
Millions of Dollars | | | | | | | | | | | | | | | | | | | | |
| | | Year-to-Date to June 30 | |
| UNAUDITED | | Actual | | | | | | Estimated | | | | | | Variance | |
| | | | | |
Revenue | | | | | | | | | | | | | | | | | | | | |
Income Taxes | | | 1,018 | | | | | | | | 1,018 | | | | | | | | - | |
Other Taxes | | | 992 | | | | | | | | 972 | | | | | | | | 20 | |
Fees and Other Revenue | | | 119 | | | | | | | | 124 | | | | | | | | (5 | ) |
Federal Transfers | | | 955 | | | | | | | | 952 | | | | | | | | 3 | |
Net Income of Government Business Enterprises | | | 157 | | | | | | | | 148 | | | | | | | | 9 | |
Sinking Funds and Other Earnings | | | - | | | | | | | | - | | | | | | | | - | |
| | | | | |
Total Revenue | | | 3,241 | | | | | | | | 3,214 | | | | | | | | 27 | |
| | | | | |
Expenditure | | | | | | | | | | | | | | | | | | | | |
Health, Seniors and Active Living | | | 1,624 | | | | | | | | 1,671 | | | | | | | | (47 | ) |
Education and Training | | | 766 | | | | | | | | 707 | | | | | | | | 59 | |
Families | | | 488 | | | | | | | | 487 | | | | | | | | 1 | |
Community, Economic and Resource Development | | | 265 | | | | | | | | 278 | | | | | | | | (13 | ) |
Justice and Other Expenditures | | | 211 | | | | | | | | 218 | | | | | | | | (7 | ) |
Debt Servicing Costs | | | (50 | ) | | | | | | | (55 | ) | | | | | | | 5 | |
| | | | | |
Total Expenditure | | | 3,304 | | | | | | | | 3,306 | | | | | | | | (2 | ) |
| | | | | |
Net Result | | | (63 | ) | | | | | | | (92 | ) | | | | | | | 29 | |
Core government revenue and expenditure details are provided in Appendix I and II on pages 10 and 11, and information on core government capital investment can be found in Appendix III on page 12.
- 3 -
| | |
| FIRST QUARTER REPORT | | APRIL TO JUNE 2017 |
QUARTERLY FINANCIAL RESULTS (Continued)
The three-month net result of $(63) million represents a variance of $20 million from the prior year. Revenue is up $111 million year-over-year, offset by an increase in expenditures of $91 million.
The year-over-year increase in revenue is primarily due to increases in Individual Income Tax, Retail
Sales Tax and Federal Transfers, as well as higher Corporations Taxes.
The year-over-year increase in expenditures reflects increased spending related to Health, Seniors and Active Living, Families and Education and Training.
| | | | | | | | | | | | | | | | | | | | |
| CORE GOVERNMENT COMPARISON TO PRIOR YEAR | |
Millions of Dollars | | | | | | | | | | | | | | | | | | | | |
| | | Year-to-Date to June 30 | |
| UNAUDITED | | 2017/18 | | | | | | 2016/17 | | | | | | Variance | |
| | | | | |
Revenue | | | 3,241 | | | | | | | | 3,130 | | | | | | | | 111 | |
| | | | | |
Expenditure | | | 3,304 | | | | | | | | 3,213 | | | | | | | | 91 | |
| | | | | |
Net Result | | | (63 | ) | | | | | | | (83 | ) | | | | | | | 20 | |
| | | | | | | | | | | | | | | | | | | | | |
- 4 -
| | |
| FIRST QUARTER REPORT | | APRIL TO JUNE 2017 |
STRATEGIC INFRASTRUCTURE INVESTMENT
Manitoba’s government is committed to spending at least $1 billion on strategic infrastructure in 2017/18 - roads and bridges, flood protection, hospitals, schools, universities and colleges, as well as municipal projects and other infrastructure.
Over $1.7 billion in strategic infrastructure investment is forecast for 2017/18.
| | | | |
| STRATEGIC INFRASTRUCTURE | | | |
Millions of Dollars | | | | |
| | | 2017/18
Budget | |
| |
Roads, Highways, Bridges and Flood Protection | | | | |
Highways Infrastructure and Airport Runway Capital | | | 510 | |
Maintenance and Preservation - Highways | | | 143 | |
Water Related Infrastructure | | | 60 | |
Transportation Equipment and Aircraft | | | 19 | |
Maintenance and Preservation - Water | | | 15 | |
Subtotal | | | 747 | |
| |
Health, Education and Housing | | | | |
Health | | | 358 | |
Education | | | 176 | |
Housing | | | 107 | |
Subtotal | | | 641 | |
| |
Other Provincial Infrastructure | | | | |
Municipal and Local Infrastructure | | | 270 | |
Public Service Buildings, Equipment and Technology | | | 88 | |
Parks, Cottage and Camping | | | 12 | |
Subtotal | | | 370 | |
| |
Total Strategic Infrastructure | | | 1,758 | |
- 5 -
| | |
| FIRST QUARTER REPORT | | APRIL TO JUNE 2017 |
BORROWINGS AND SUMMARY NET DEBT
Manitoba’s total borrowing requirement identified in Budget 2017 was $6.7 billion, including refinancing of $2.1 billion and new cash requirements (net of estimated repayments) of $4.6 billion.
New cash requirements are necessary for general government purposes, capital investments by departments, health facilities, post-secondary institutions and Manitoba Hydro. Estimated repayments are primarily for departmental capital investment and general purpose borrowings.
Borrowings are used to finance capital related projects and to finance the expenditures of priority government services in excess of generated income.
Budget 2017 projects a net debt to GDP ratio of 35.7%.
| | | | |
| CHANGE IN SUMMARY NET DEBT | | | |
Millions of Dollars | | | | |
| | | 2017/18
Budget | |
| |
2016/17 Summary Net Debt (Forecast) | | | 23,111 | |
Net Investment in Tangible Capital Assets | | | | |
Core Government | | | 418 | |
Other Reporting Entities | | | 403 | |
| | | 821 | |
| |
Plus: Projected (Income) Loss for the Year | | | | |
Core Government | | | 779 | |
Other Reporting Entities | | | 61 | |
| | | 840 | |
| |
Change in Net Debt | | | 1,661 | |
| |
Summary Net Debt | | | 24,772 | |
- 6 -
| | |
| FIRST QUARTER REPORT | | APRIL TO JUNE 2017 |
ECONOMIC REVIEW AND OUTLOOK
Overview
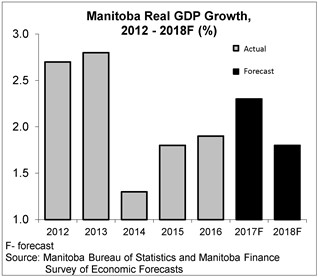
Manitoba’s economic outlook for 2017 has been revised up from budget projection due to sustained strength in the labour market, residential and non-residential building construction, and improvements in the broader national economy. The outlook for 2018 has been revised down as investment spending on several projects is expected to ease.
Manitoba’s real Gross Domestic Product (GDP) is forecast to increase by 2.3% in 2017, compared to 2.0% estimated in the budget. Growth in 2018 is revised down to 1.8% from
2.0%.
The International Monetary Fund (IMF) has increased its global economic growth forecast for 2017 and maintained its outlook for 2018. Stronger than anticipated growth in China and in the Euro area helped lift the IMF outlook.
The IMF, however, lowered the U.S. outlook from 2.3% to 2.1% in 2017 and from 2.5% to 2.1% in 2018. The revision reflects an assumption that fiscal policy will be less expansionary than previously assumed, given the uncertainty regarding timing of policy measures currently being considered.
Outperforming expectation, the Canadian outlook was increased to 2.6% in 2017 from 2.0% estimated in the budget. For 2018, the forecast is unchanged at 2.0%. Canada is now expected to surpass all G7 nations in growth in 2017 and is expected to be the second strongest in 2018.
The positive momentum in the overall Canadian economy has resulted in the Bank of Canada raising its key interest rate twice in 2017. Continued economic strength in Canada raises the likelihood of further interest rate increases.
Manitoba Economic Performance
Economic indicators are pointing to stronger than expected growth in Manitoba in 2017. Economic growth is expected to moderate in 2018.
Annual and quarterly economic statistics in the following section are on a calendar year basis. Annual and quarterly provincial economic statistics are often revised and, as a result, the assessment of trends could change from quarter to quarter.
Manitoba’s inflation rate has been below 1.5% since 2014. In 2017, the inflation rate has averaged 1.3%. A decline in food, clothing and footwear prices is being offset by increases in transportation and shelter costs.
Employment growth accelerated in the first eight months of 2017, adding 16,400 jobs since December 2016. The labour force has added 7,900 new workers. As demand for jobs outpaced supply, the unemployment rate has improved to 4.9% in August 2017, the lowest since January 2013 and the lowest in Canada.
With a tighter labour market, earnings are growing at a faster pace. Average weekly earnings in Manitoba were up 2.5% in the first six months of 2017, the highest increase
- 7 -
| | |
| FIRST QUARTER REPORT | | APRIL TO JUNE 2017 |
among provinces and higher compared to the 1.0% gain in 2016.
Compensation of employees, the largest component of the personal income tax base, increased by 3.3% in the first half of 2017 compared to 2.0% annual growth in 2016. While the growth in compensation of employees has strengthened, it is below the 4.1% average annual growth recorded over the last decade.
After remaining relatively flat through 2016, retail sales sharply increased in the first quarter of 2017 and have averaged 3.1% growth this year. The increases are largely due to higher fuel prices pushing up gasoline station sales, and sizable gains in building material, garden equipment, electronic and appliance stores sales.
Manufacturing sales have increased by 4.2% in the first six months on 2017, compared to 1.1% annual growth in 2016. Sales are led by printing product sales followed by food products and transportation equipment, the two largest industries within the sector.
Capital investment in total non-residential structures (which includes buildings and engineering projects like Bipole III and the Keeyask hydro generating station) increased by 10.6% last year. This was partially offset by a reduction in spending on residential structures, and machinery and equipment.
Investment in building structures in Manitoba set a new record in the second quarter of 2017 (annualized basis) as capital spending increased on several large business properties, including the True North Square in downtown Winnipeg. As a result, investment in non-residential buildings has averaged 22% growth in 2017 (year-to-date basis), third highest among provinces. Spending has increased by 49% on industrial buildings, 31% on commercial buildings and down 6% on institutional buildings.
Building permits are a forward-looking indicator for capital investment. So far in 2017, non-residential building permits on commercial, industrial and institutional properties are down by 12%.
In the first half of 2017, housing starts were up by 78%, the largest increase among provinces and well above the 7.1% national average increase. On an annualized basis, 7,100 housing units were started in the past year, a 30% increase and the highest since 2013. The number of single detached units were up 32% while multiple units were up 28%.
International merchandise exports have rebounded in 2017 with 2.7% growth in the first seven months of the year, compared to the 1.8% annual decline in 2016.
Export sales to non-U.S. markets have increased by 17%, bolstered by a 42% increase in sales to China. Exports to the U.S. have continued to decline, down by 4.0% so far in 2017. Lower sales of chemicals, oil, and livestock has contributed to the decline.
Lower exports is hampering Manitoba’s hog industry; as a result, inventories have increased to record levels. The cattle industry is relatively stable, as increased local processing is offsetting lower export volumes.
Timing and the deferral of sales payments, among other factors, propelled Manitoba’s crop receipts to a record $3.7 billion over a twelve month period ending in the first quarter of 2017. Livestock receipts were down by 5.4%. Total farm cash receipts increased by
4.8% in the first quarter, surpassing $6 billion over four quarters.
In 2017, Manitoba metal mining production levels are mostly lower compared to 2016. Zinc and silver extraction volumes are up in the first four months of 2017, compared to the same period in 2016. Nickel, copper and gold production have declined.
- 8 -
| | |
| FIRST QUARTER REPORT | | APRIL TO JUNE 2017 |
| | | | | | | | | | | | |
| Manitoba Outlook at a Glance | | | | | | | | | |
| (per cent change unless noted) | | | | | | | | | |
| | | 2016 | | | 2017f | | | 2018f | |
Gross Domestic Product | | | | | | | | | | | | |
Real | | | 1.9 | | | | 2.3 | | | | 1.8 | |
Nominal | | | 2.5 | | | | 4.4 | | | | 3.6 | |
Employment | | | -0.4 | | | | 1.2 | | | | 0.7 | |
Unemployment Rate (%) | | | 6.1 | | | | 5.6 | | | | 5.6 | |
Consumer Price Index | | | 1.3 | | | | 1.8 | | | | 2.1 | |
Population | | | 1.7 | | | | 1.4 | | | | 1.4 | |
f – Forecast
Sources: Statistics Canada, Manitoba Bureau of Statistics and Manitoba Finance Survey of Economic Forecasts (2017f – 2018f)
- 9 -
| | |
| FIRST QUARTER REPORT | | APRIL TO JUNE 2017 |
Appendix I
| | | | | | | | | | | | | | | | | | | | | | | | | | | | |
| 2017/18 CORE GOVERNMENT REVENUE BY SOURCE | | | | | | | | | | | | | | | | |
Thousands of Dollars | | | | | | | | | | | | | | | | | | | | | | | | | | | | |
| | | Year-to-Date to June 30 | | | | | | Full Year | |
UNAUDITED | | | Actual | | | | | | | | Estimated | | | | | | | | Variance | | | | | | | | Budget | |
Income Taxes | | | | | | | | | | | | | | | | | | | | | | | | | | | | |
Individual Income Tax | | | 778,664 | | | | | | | | 778,668 | | | | | | | | (4 | ) | | | | | | | 3,650,335 | |
Corporation Income Tax | | | 239,622 | | | | | | | | 239,622 | | | | | | | | - | | | | | | | | 543,240 | |
Subtotal: Income Taxes | | | 1,018,286 | | | | | | | | 1,018,290 | | | | | | | | (4 | ) | | | | | | | 4,193,575 | |
| | | | | | | |
Other Taxes | | | | | | | | | | | | | | | | | | | | | | | | | | | | |
Corporations Taxes | | | 75,229 | | | | | | | | 74,120 | | | | | | | | 1,109 | | | | | | | | 281,915 | |
Fuel Taxes | | | 84,663 | | | | | | | | 82,000 | | | | | | | | 2,663 | | | | | | | | 334,683 | |
Land Transfer Tax | | | 19,439 | | | | | | | | 20,479 | | | | | | | | (1,040 | ) | | | | | | | 84,109 | |
Levy for Health and Education | | | 116,742 | | | | | | | | 115,000 | | | | | | | | 1,742 | | | | | | | | 477,528 | |
Oil and Natural Gas Tax | | | 2,417 | | | | | | | | 1,752 | | | | | | | | 665 | | | | | | | | 6,658 | |
Retail Sales Tax | | | 627,278 | | | | | | | | 610,000 | | | | | | | | 17,278 | | | | | | | | 2,357,724 | |
Tobacco Tax | | | 65,514 | | | | | | | | 68,000 | | | | | | | | (2,486 | ) | | | | | | | 248,612 | |
Other Taxes | | | 623 | | | | | | | | 500 | | | | | | | | 123 | | | | | | | | 4,094 | |
Subtotal: Other Taxes | | | 991,905 | | | | | | | | 971,851 | | | | | | | | 20,054 | | | | | | | | 3,795,323 | |
| | | | | | | |
Fees and Other Revenue | | | | | | | | | | | | | | | | | | | | | | | | | | | | |
Fines and Costs and Other Legal | | | 14,604 | | | | | | | | 13,787 | | | | | | | | 817 | | | | | | | | 53,772 | |
Minerals and Petroleum | | | 4,603 | | | | | | | | 3,662 | | | | | | | | 941 | | | | | | | | 10,851 | |
Automobile and Motor Carrier Licences and Fees | | | 35,416 | | | | | | | | 38,400 | | | | | | | | (2,984 | ) | | | | | | | 153,770 | |
Parks: Forestry and Other Conservation | | | 2,391 | | | | | | | | 3,833 | | | | | | | | (1,442 | ) | | | | | | | 34,030 | |
Water Power Rentals | | | 31,168 | | | | | | | | 30,047 | | | | | | | | 1,121 | | | | | | | | 110,920 | |
Service Fees and Other Miscellaneous Charges | | | 20,202 | | | | | | | | 23,093 | | | | | | | | (2,891 | ) | | | | | | | 188,344 | |
Revenue Sharing from SOAs | | | 10,773 | | | | | | | | 10,773 | | | | | | | | - | | | | | | | | 32,680 | |
Subtotal: Fees and Other Revenue | | | 119,157 | | | | | | | | 123,595 | | | | | | | | (4,438 | ) | | | | | | | 584,367 | |
| | | | | | | |
Federal Transfers | | | | | | | | | | | | | | | | | | | | | | | | | | | | |
Equalization | | | 455,099 | | | | | | | | 455,100 | | | | | | | | (1 | ) | | | | | | | 1,820,400 | |
Canada Health Transfer (CHT) | | | 338,859 | | | | | | | | 338,859 | | | | | | | | - | | | | | | | | 1,355,400 | |
Canada Social Transfer (CST) | | | 125,405 | | | | | | | | 125,406 | | | | | | | | (1 | ) | | | | | | | 501,600 | |
Shared Cost and Other Transfers | | | 35,509 | | | | | | | | 32,660 | | | | | | | | 2,849 | | | | | | | | 173,440 | |
Subtotal: Federal Transfers | | | 954,872 | | | | | | | | 952,025 | | | | | | | | 2,847 | | | | | | | | 3,850,840 | |
| | | | | | | |
Net Income of Government | | | | | | | | | | | | | | | | | | | | | | | | | | | | |
Business Enterprises (GBEs) | | | | | | | | | | | | | | | | | | | | | | | | | | | | |
Manitoba Liquor and Lotteries Corporation | | | 157,000 | | | | | | | | 148,000 | | | | | | | | 9,000 | | | | | | | | 592,000 | |
| | | | | | | |
Total Revenue | | | 3,241,220 | | | | | | | | 3,213,761 | | | | | | | | 27,459 | | | | | | | | 13,016,105 | |
- 10 -
| | |
| FIRST QUARTER REPORT | | APRIL TO JUNE 2017 |
Appendix II
| | | | | | | | | | | | | | | | | | | | | | | | | | | | |
| 2017/18 CORE GOVERNMENT EXPENDITURE BY SECTOR/DEPARTMENT | | | | | | | | | | | | | |
Thousands of Dollars | | | | | | | | | | | | | | | | | | | | | | | | | | | | |
| | | Year-to-Date to June 30 | | | | | | Full Year | |
UNAUDITED | | | Actual | | | | | | | | Estimated | | | | | | | | Variance | | | | | | | | Budget | |
| | | | | | | |
Health | | | | | | | | | | | | | | | | | | | | | | | | | | | | |
Health, Seniors and Active Living | | | 1,623,919 | | | | | | | | 1,671,442 | | | | | | | | (47,523 | ) | | | | | | | 6,104,877 | |
| | | | | | | |
Education | | | | | | | | | | | | | | | | | | | | | | | | | | | | |
Education and Training | | | 766,056 | | | | | | | | 707,334 | | | | | | | | 58,722 | | | | | | | | 2,771,884 | |
| | | | | | | |
Families | | | | | | | | | | | | | | | | | | | | | | | | | | | | |
Families | | | 487,672 | | | | | | | | 486,650 | | | | | | | | 1,022 | | | | | | | | 2,033,357 | |
| | | | | | | |
Community, Economic and Resource Development | | | | | | | | | | | | | | | | | | | | | | | | | | | | |
Agriculture | | | 11,122 | | | | | | | | 13,327 | | | | | | | | (2,205 | ) | | | | | | | 191,506 | |
Growth, Enterprise and Trade | | | 25,569 | | | | | | | | 19,205 | | | | | | | | 6,364 | | | | | | | | 87,812 | |
Indigenous and Municipal Relations | | | 33,657 | | | | | | | | 47,123 | | | | | | | | (13,466 | ) | | | | | | | 441,360 | |
Infrastructure | | | 159,858 | | | | | | | | 162,391 | | | | | | | | (2,533 | ) | | | | | | | 666,659 | |
Sustainable Development | | | 35,032 | | | | | | | | 36,017 | | | | | | | | (985 | ) | | | | | | | 144,585 | |
Total Community, Economic and Resource | | | | | | | | | | | | | | | | | | | | | | | | | | | | |
Development | | | 265,238 | | | | | | | | 278,063 | | | | | | | | (12,825 | ) | | | | | | | 1,531,922 | |
| | | | | | | |
Justice and Other Expenditures | | | | | | | | | | | | | | | | | | | | | | | | | | | | |
Legislative Assembly | | | 10,248 | | | | | | | | 10,880 | | | | | | | | (632 | ) | | | | | | | 47,611 | |
Executive Council | | | 2,023 | | | | | | | | 2,254 | | | | | | | | (231 | ) | | | | | | | 3,425 | |
Civil Service Commission | | | 5,098 | | | | | | | | 5,165 | | | | | | | | (67 | ) | | | | | | | 21,404 | |
Employee Pensions and Other Costs | | | 739 | | | | | | | | (333 | ) | | | | | | | 1,072 | | | | | | | | 22,210 | |
Finance | | | 65,486 | | | | | | | | 62,599 | | | | | | | | 2,887 | | | | | | | | 265,799 | |
Justice | | | 104,127 | | | | | | | | 108,063 | | | | | | | | (3,936 | ) | | | | | | | 598,723 | |
Sport, Culture and Heritage | | | 19,284 | | | | | | | | 18,737 | | | | | | | | 547 | | | | | | | | 82,029 | |
Enabling Appropriations | | | - | | | | | | | | - | | | | | | | | - | | | | | | | | 40,322 | |
Other Appropriations | | | 4,521 | | | | | | | | 10,665 | | | | | | | | (6,144 | ) | | | | | | | 56,800 | |
Total Justice and Other Expenditures | | | 211,526 | | | | | | | | 218,030 | | | | | | | | (6,504 | ) | | | | | | | 1,138,323 | |
| | | | | | | |
Debt Servicing | | | (50,255 | ) | | | | | | | (55,485 | ) | | | | | | | 5,230 | | | | | | | | 240,000 | |
| | | | | | | |
Total Expenditure | | | 3,304,156 | | | | | | | | 3,306,034 | | | | | | | | (1,878 | ) | | | | | | | 13,820,363 | |
- 11 -
| | |
| FIRST QUARTER REPORT | | APRIL TO JUNE 2017 |
Appendix III
| | | | | | | | | | | | | | | | | | | | | | | | | | | | |
| 2017/18 CORE GOVERNMENT CAPITAL INVESTMENT BY DEPARTMENT | | | | |
Thousands of Dollars | | | | | | | | | | | | | �� | | | | | | | | | | | | | | | |
| | | Year-to-Date to June 30 | | | | | | Full Year | |
UNAUDITED | | | Actual | | | | | | | | Estimated | | | | | | | | Variance | | | | | | | | Budget | |
| | | | | | | |
Agriculture | | | - | | | | | | | | - | | | | | | | | - | | | | | | | | 552 | |
Education and Training | | | - | | | | | | | | - | | | | | | | | - | | | | | | | | - | |
Families | | | - | | | | | | | | - | | | | | | | | - | | | | | | | | 219 | |
Finance | | | 5,512 | | | | | | | | 5,512 | | | | | | | | - | | | | | | | | 62,000 | |
Health, Seniors and Active Living | | | - | | | | | | | | - | | | | | | | | - | | | | | | | | 1,254 | |
Infrastructure | | | 42,530 | | | | | | | | 42,530 | | | | | | | | - | | | | | | | | 589,035 | |
Justice | | | 111 | | | | | | | | - | | | | | | | | 111 | | | | | | | | 2,429 | |
Sport, Culture and Heritage | | | - | | | | | | | | - | | | | | | | | - | | | | | | | | 120 | |
Sustainable Development | | | 110 | | | | | | | | - | | | | | | | | 110 | | | | | | | | 15,439 | |
Internal Service Adjustments | | | - | | | | | | | | - | | | | | | | | - | | | | | | | | 17,450 | |
| | | | | | | |
Total Capital Investment | | | 48,263 | | | | | | | | 48,042 | | | | | | | | 221 | | | | | | | | 688,498 | |
- 12 -