Exhibit 99.1

PROVINCE OF MANITOBA
| | |
| | This description of Province of Manitoba is dated as of October 24th, 2017 and appears as Exhibit 99.1 to the Province’s Annual Report on Form 18-K to the U.S. Securities and Exchange Commission for the fiscal year ended March 31, 2017. |
This document (otherwise than as part of a prospectus contained in a registration statement filed under the Securities Act of 1933) does not constitute an offer to sell or the solicitation of an offer to buy any securities of Province of Manitoba (the Province). The delivery of this document at any time does not imply that the information herein is correct as of any time subsequent to its date.
TABLE OF CONTENTS
| | | | |
| | | Page | |
Further Information | | | 3 | |
Summary | | | 4 | |
Map of the Province of Manitoba | | | 7 | |
Province of Manitoba | | | 8 | |
General Information | | | 8 | |
Constitutional Framework | | | 8 | |
Provincial Government | | | 8 | |
Economy | | | 9 | |
General | | | 9 | |
Economic Structure | | | 11 | |
Total Exports and Imports | | | 20 | |
Foreign Merchandise Exports | | | 21 | |
Capital Investment | | | 23 | |
Labour Force | | | 24 | |
Energy | | | 25 | |
Government Finances | | | 25 | |
Budget | | | 27 | |
Core Government Revenue | | | 29 | |
Core Government Expenses | | | 30 | |
Crown Organizations and Government Business Enterprises | | | 32 | |
Public Debt | | | 33 | |
Borrowing Record | | | 33 | |
Direct Funded Borrowings | | | 33 | |
Guaranteed Borrowings of the Province | | | 34 | |
Maturity Schedule | | | 35 | |
Sinking Funds | | | 36 | |
Unfunded Debt | | | 36 | |
Consolidated Funded Borrowings of the Manitoba Public Sector | | | 36 | |
Selected Borrowings Information | | | 38 | |
Pension Liability | | | 39 | |
The Manitoba Hydro-Electric Board | | | 40 | |
Operations | | | 40 | |
Rate Matters | | | 41 | |
Statistical Information | | | 42 | |
Construction Program | | | 43 | |
Export Power Sales | | | 45 | |
Canadian Foreign Exchange | | | 48 | |
Tables of Supplementary Information | | | 49 | |
2
FURTHER INFORMATION
This document appears as an exhibit to the Province’s Annual Report to the U.S. Securities and Exchange Commission (the Commission) on Form 18-K for the fiscal year ended March 31, 2017. Additional information with respect to the Province is available in that Annual Report, in the other exhibits to that Annual Report and in amendments thereto. The Annual Report exhibits and amendments can be inspected and copied at the Commission’s website at http://www.sec.gov, or at the public reference facilities maintained by the Commission at: 100 F Street, N.E., Washington, D.C. 20549. Copies of those documents may also be obtained at prescribed rates from the Public Reference Section of the Commission at its Washington address or from Province of Manitoba, Department of Finance, Treasury Division, 350-363 Broadway, Winnipeg, Manitoba R3C 3N9, Canada. Please call the Commission at 1-800-SEC-0330 for further information on the public reference room.
The fiscal year of the Province ends March 31. Fiscal 2017 and 2016-2017 refer to the fiscal year ended March 31, 2017 and, unless otherwise indicated, 2016 means the calendar year ended December 31, 2016. Other fiscal years and calendar years are referred to in a corresponding manner.
In this document, unless otherwise specified or the context otherwise requires, all dollar amounts are expressed in Canadian dollars ($ or C$) and all references to dollars are to Canadian dollars. See “Canadian Foreign Exchange” for information regarding the rates of conversion of U.S. dollars into Canadian dollars.
At October 24, 2017, the daily average rate for U.S. dollars as reported by Bank of Canada, expressed in Canadian dollars, was $1.2666.
Totals in the statistical tables set forth in this document may not add due to rounding.
3
SUMMARY
The following information is qualified in its entirety by the more
detailed information in this document.
PROVINCE OF MANITOBA
Economy
| | | | | | | | | | | | | | | | | | | | | | | | |
| | | Year Ended December 31, | | | Compound Annual Growth Rate | |
| | | 2012 | | | 2013 | | | 2014 | | | 2015 | | | 2016 | | | 2012-2016 | |
| | | (In millions of dollars, unless otherwise indicated) | |
Nominal Gross Domestic Product | | $ | 59,802 | | | $ | 62,343 | | | $ | 63,745 | | | $ | 65,665 | | | $ | 67,298 | | | | 3.0% | |
Change in Real Gross Domestic Product | | | | | | | | | | | | | | | | | | | | | | | | |
Manitoba | | | 2.7% | | | | 2.8% | | | | 1.3% | | | | 1.8% | | | | 1.9% | | | | | |
Canada | | | 1.7% | | | | 2.5% | | | | 2.6% | | | | 0.9% | | | | 1.5% | | | | | |
Manufacturing Shipments | | $ | 16,333 | | | $ | 16,930 | | | $ | 17,427 | | | $ | 17,158 | | | $ | 17,382 | | | | 1.6 | |
Farm Cash Receipts | | | 5,146 | | | | 5,833 | | | | 5,978 | | | | 5,810 | | | | 5,927 | | | | 3.6 | |
Capital Investment | | | 7,795 | | | | 7,620 | | | | 8,633 | | | | 9,493 | | | | 10,213 | | | | 7.0 | |
Primary Household Income | | | 38,589 | | | | 40,185 | | | | 41,336 | | | | 43,166 | | | | 44,305 | | | | 3.5 | |
Population at July 1 (in 000’s) | | | 1,250 | | | | 1,266 | | | | 1,281 | | | | 1,295 | | | | 1,318 | | | | 1.3 | |
Average Unemployment Rate | | | 5.3% | | | | 5.4% | | | | 5.4% | | | | 5.6% | | | | 6.1% | | | | | |
Change in Consumer Price Index (Manitoba) | | | 1.6% | | | | 2.2% | | | | 1.9% | | | | 1.2% | | | | 1.3% | | | | | |
Average Exchange Rate (C$ per US$) | | | 0.9997 | | | | 1.0302 | | | | 1.1043 | | | | 1.2791 | | | | 1.3248 | | | | | |
Revenue and Expense of the Government Reporting Entity (1)
| | | | | | | | | | | | | | | | | | | | |
| | | Year Ended March 31, | |
| | | 2013 | | | 2014 | | | 2015 | | | 2016 | | | 2017 | |
| | | (In millions of dollars) | |
Total Revenue | | $ | 13,812 �� | | | $ | 14,414 | | | $ | 14,963 | | | $ | 15,054 | | | $ | 15,723 | |
Total Expense | | | (14,372) | | | | (14,936) | | | | (15,393) | | | | (15,893) | | | | (16,487) | |
| | | | | | | | | | | | | | | | | | | | |
Summary Net Income (Loss) | | $ | (560) | | | $ | (522) | | | $ | (430) | | | $ | (839) | | | $ | (764) | |
| | | | | | | | | | | | | | | | | | | | |
| (1) | See “Statement of Revenue and Expense of the Government Reporting Entity” on page 27. |
4
Net Direct Funded and Guaranteed Borrowings
| | | | | | | | | | | | | | | | | | | | |
| | | As of March 31, | |
| | | 2013 | | | 2014 | | | 2015 | | | 2016 | | | 2017 | |
| | | (In millions of dollars, unless otherwise indicated) | |
Consisting of | | | | | | | | | | | | | | | | | | | | |
Net Direct Funded Borrowings | | $ | 27,699 | | | $ | 30,074 | | | $ | 33,325 | | | $ | 37,753 | | | $ | 41,741 | |
Net Guaranteed Borrowings | | | 166 | | | | 265 | | | | 172 | | | | 110 | | | | 91 | |
| | | | | | | | | | | | | | | | | | | | |
| | $ | 27,865 | | | $ | 30,339 | | | $ | 33,497 | | | $ | 37,863 | | | $ | 41,831 | |
Issued for | | | | | | | | | | | | | | | | | | | | |
General Government Programs (1) | | $ | 14,828 | | | $ | 15,720 | | | $ | 16,777 | | | $ | 18,501 | | | $ | 20,270 | |
Self-Sustaining Purposes | | | 13,004 | | | | 14,599 | | | | 16,705 | | | | 19,352 | | | | 21,562 | |
Loans Payable to the Government of Canada and Government Business Enterprises (2) | | | 33 | | | | 19 | | | | 15 | | | | 10 | | | | 0 | |
| | | | | | | | | | | | | | | | | | | | |
| | $ | 27,865 | | | $ | 30,339 | | | $ | 33,497 | | | $ | 37,863 | | | $ | 41,831 | |
General Government Programs Borrowings as a Percentage of Nominal Gross Domestic Product | | | 24.8% | | | | 25.2% | | | | 26.3% | | | | 28.2% | | | | 30.1% | |
Self-Sustaining Purposes Borrowings as a Percentage of Nominal Gross Domestic Product | | | 21.7% | | | | 23.4% | | | | 26.2% | | | | 29.5% | | | | 32.0% | |
| (1) | Total borrowings issued for General Government Programs includes borrowings for Capital Assets, Teacher’s Retirement Allowance Fund and Civil Service Superannuation Fund. |
| (2) | Canadian generally accepted accounting principles (GAAP) for the public sector as recommended by the Public Sector Accounting Board (PSAB) of the Canadian Institute of Chartered Accountants (CICA) require certain amounts owing to the Federal Government and Government Business Enterprises be recorded as loans payable. |
5
Summary Net Debt
| | | | | | | | | | | | | | | | | | | | |
| | | As of March 31, | |
| | | 2013 | | | 2014 | | | 2015 | | | 2016 | | | 2017 | |
| | | (In millions of dollars, unless otherwise indicated) | |
Total Financial Assets (1) | | $ | 10,604 | | | $ | 10,702 | | | $ | 10,224 | | | $ | 10,582 | | | $ | 11,338 | |
| | | | | | | | | | | | | | | | | | | | |
Liabilities: | | | | | | | | | | | | | | | | | | | | |
Borrowings (2) | | | 20,772 | | | | 21,930 | | | | 23,241 | | | | 25,415 | | | | 27,397 | |
Accounts payable, accrued charges provisions and unearned revenue | | | 3,770 | | | | 3,951 | | | | 4,184 | | | | 4,184 | | | | 4,077 | |
Pension liability | | | 1,828 | | | | 2,038 | | | | 2,245 | | | | 2,354 | | | | 2,557 | |
| | | | | | | | | | | | | | | | | | | | |
Total Liabilities | | | 26,370 | | | | 27,919 | | | | 29,670 | | | | 31,953 | | | | 34,031 | |
| | | | | | | | | | | | | | | | | | | | |
Summary Net Debt | | $ | 15,766 | | | $ | 17,217 | | | $ | 19,446 | | | $ | 21,371 | | | $ | 22,693 | |
| | | | | | | | | | | | | | | | | | | | |
Summary Net Debt as a Percentage of Nominal Gross Domestic Product | | | 26.4% | | | | 27.6% | | | | 30.5% | | | | 32.5% | | | | 33.7% | |
| (1) | Includes cash, amounts receivable, loans and advances, investments, equity in government business enterprises and other financial assets. |
| (2) | Excludes borrowings incurred for and repayable by The Manitoba Hydro-Electric Board (Manitoba Hydro). |
6
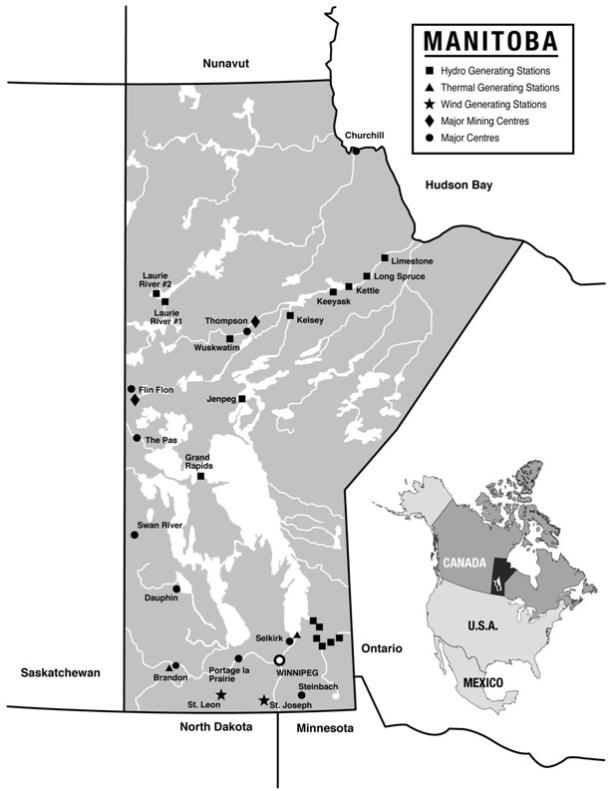
MAP OF THE PROVINCE OF MANITOBA
7
THE PROVINCE OF MANITOBA
General Information
The Province of Manitoba is located in the centre of Canada, north of the States of Minnesota and North Dakota. It is the most easterly of the three Provinces of Manitoba, Saskatchewan and Alberta, which together constitute the Prairie Region of Canada. Manitoba is bounded on the east by the Province of Ontario, on the north by Hudson Bay and the Territory of Nunavut, and on the west by the Province of Saskatchewan. Manitoba has 400 miles of northern coastline bordering on Hudson Bay.
Of Manitoba’s total area of 251,000 square miles, 39,000 square miles are lakes and rivers and 163,000 square miles are lands owned by Manitoba. Cultivated land comprises 28,000 square miles in the southern part of Manitoba. The northern part of the Province, which is part of the Canadian Shield, is composed largely of timberlands and extensive areas of mineralized rock structure.
The estimated population of Manitoba on July 1, 2017 was 1,338,109, an increase of 1.5% over the prior year. The Winnipeg Census Metropolitan Area had an estimated population of 828,000 in 2017, an increase of 2.0% over the prior year. Winnipeg, the capital of Manitoba, has a diversified economic base with significant activity in a variety of manufacturing and service sectors. Winnipeg is also a major air, rail and truck transportation hub by virtue of its geographical position in the centre of the continent.
The second-largest city in Manitoba is Brandon, with an estimated population of 53,102 in 2016 (latest figure available), an increase of 1.7% over the prior year. Brandon, in western Manitoba, is a major supply centre for the agriculture industry, as well as an agriculture-related manufacturing centre.
Constitutional Framework
Canada consists of a federation of Provinces and Territories. A constitutional division of powers between the Federal and Provincial governments was established by the British North America Act, 1867, an Act of the Parliament of the United Kingdom. By later enactments, including the Constitution Act, 1982, the power to amend the constitution of Canada (the Constitution) was transferred to Canada.
Under the Constitution, the Provinces are assigned jurisdiction over education, municipal institutions, property and civil rights, natural resources and other matters of purely provincial or local concern. The Legislature of each Province has exclusive jurisdiction over the borrowing of money on the sole credit of that Province. The Parliament of Canada has jurisdiction over areas not assigned to the Provincial Legislatures, including such matters as aboriginal persons’ civil rights, the Federal public debt and property, the regulation of trade and commerce, currency and coinage, banks and banking, national defence, foreign affairs, postal services, interprovincial transportation and communications undertakings. The Provinces and the Parliament of Canada have shared jurisdictions over immigration, health care, environment and agriculture.
Various constitutional issues have been under discussion in Canada for a number of years. On August 20, 1998, in response to a reference from the Federal Government, the Supreme Court of Canada ruled that under the Constitution and international law, Quebec may not secede unilaterally from Canada, but that if the people of Quebec voted to secede by a clear majority vote on a clear question, the other Provinces and the Federal Government would be obliged to enter into negotiations with Quebec with respect to secession, such negotiations to be guided by constitutional principles, including federalism, democracy, constitutionalism, the rule of law and the protection of minorities.
Provincial Government
The Provincial Government has general responsibility for the administration of all governmental activities and functions within Manitoba, other than those which are under the jurisdiction of the Federal Government. It carries out certain of these responsibilities through Provincial agencies, boards, commissions and Crown organizations. Certain other responsibilities have been delegated to cities, municipalities and semi-autonomous bodies such as school boards and regional health authorities.
The executive power in the Province is vested in the Lieutenant Governor acting on the advice of the Executive Council, which is responsible to the Legislative Assembly. The Lieutenant Governor is appointed by the Governor General in Council on the advice of the Prime Minister of Canada.
The Executive Council, which includes the Premier and Ministers of Departments of the Provincial Government, is appointed by the Lieutenant Governor, usually on the nomination of the leader of the party with the largest number of members in the Legislative Assembly. Members of the Executive Council are usually members of the Legislative Assembly.
8
The Legislative Assembly has 57 members who are elected for a term of four years, subject to earlier dissolution of the Assembly by the Lieutenant Governor, usually on the recommendation of the Executive Council. In the last general election of members of the Legislative Assembly, held on April 19, 2016, the Progressive Conservative Party of Manitoba was elected with 39 of 57 seats. In accordance with The Elections Act (Manitoba) (the Elections Act), the next Provincial election is to take place October 6, 2020.
The following table sets forth the results of the four most recent elections of the Province and the current standing of the Legislative Assembly.
| | | | | | | | | | | | | | | | |
| | | Number of Members | |
| | | 2003 | | | 2007 | | | 2011 | | | 2017 | |
Progressive Conservative Party of Manitoba | | | 20 | | | | 19 | | | | 19 | | | | 39 | |
New Democratic Party of Manitoba | | | 35 | | | | 36 | | | | 37 | | | | 13 | |
Manitoba Liberal Party | | | 2 | | | | 2 | | | | 1 | | | | 3 | |
Independent | | | | | | | | | | | | | | | 2 | |
| | | | | | | | | | | | | | | | |
Total | | | 57 | | | | 57 | | | | 57 | | | | 57 | |
| | | | | | | | | | | | | | | | |
ECONOMY
General
The Manitoba economy is among the most diversified in Canada, with 11 different sectors that each contributes more than 5% of real Gross Domestic Product (GDP). Manitoba’s major sectors are: manufacturing; finance, insurance and real estate; construction; transportation and warehousing; retail trade; wholesale trade; mining and oil and gas extraction; agriculture; professional and scientific services; utilities; and information and culture. Centrally located in Canada, Manitoba is a major transportation hub, with national and international air and rail cargo linkages and a substantial trucking industry.
Economic growth in Manitoba has been among the most stable in Canada, reflecting some of the Province’s structural characteristics, and resulting in a labour force characterised by low unemployment rates and high population growth. Manitoba’s interprovincial and international exports are diversified in both composition and destination. Historically and compared to other Provinces, Manitoba has generated a stable profile of annual growth in real GDP, employment, international exports, manufacturing sales and compensation of employees.
Economic growth in Manitoba improved in 2015 and 2016, following slower growth in 2014 due to low commodity prices and weak demand conditions. The Manitoba Bureau of Statistics estimated that Manitoba’s real GDP expanded 1.9% in 2016, compared to 1.8% in 2015 and 1.3% in 2014. In contrast, Canada’s real GDP increased by 1.5% in 2016 by 0.9% in 2015 and by 2.6% in 2014.
In 2016, Manitoba’s economic growth was supported by construction, finance, insurance and real estate, manufacturing and transportation and warehousing. Growth was offset by a decline in output in mining and oil and gas extraction, and the information and culture sectors.
The following table sets forth growth rates in 2016 for key economic indicators and selected sectors of the economy for Manitoba and Canada, as well as the unemployment rates for 2016.
| | | | | | | | |
| | | Manitoba (%) | | | Canada (%) | |
Housing Starts | | | -3.3 | | | | 1.2 | |
Retail Sales | | | 4.2 | | | | 5.1 | |
Manufacturing Sales | | | 1.3 | | | | 1.2 | |
Nominal Gross Domestic Product | | | 2.5 | | | | 2.1 | |
Real Gross Domestic Product | | | 1.9 | | | | 1.5 | |
Capital Investment | | | 7.6 | | | | -5.0 | |
Foreign Merchandise Exports | | | -1.8 | | | | -2.6 | |
Farm Cash Receipts | | | 2.0 | | | | 0.5 | |
Value of Mining Production | | | -9.7 | | | | N/A | |
Consumer Price Index | | | 1.3 | | | | 1.4 | |
Employment | | | -0.4 | | | | 0.7 | |
Average Unemployment Rate | | | 6.1 | | | | 7.0 | |
Population | | | 1.8 | | | | 1.2 | |
9
Reflecting year-to-date performance of domestic, national and international economic indicators in 2017, the latest survey from the private sector forecasts indicates that Manitoba’s real GDP is expected to expand by 2.3% in 2017, revised up by 0.3% from the Budget 2017 estimate. Manitoba’s forecast growth ranks fifth highest among Provinces in 2017. Nominal GDP is projected to increase by 4.6%, while consumer price inflation is expected to average 1.6% in 2017.
Statistics Canada’s Annual Capital and Repair Expenditures Survey published in February 2017 indicated that capital investment in Manitoba is expected to decrease by 4.2% to $9.8 billion in 2017, with a public capital investment decrease of 9.0% and a private capital investment increase of 2.0%. Public capital investment in 2017 will be affected by Manitoba Hydro’s plans, announced after this survey was released, as reflected under “The Manitoba Hydro-Electric Board - Capital Expenditures” on page 43.
The following table sets forth the 2017 year-to-date growth rates, where available, for key economic indicators and selected sectors of the economy for Manitoba and Canada, as well as the year-to-date unemployment rates.
| | | | | | | | | | |
| | | Manitoba (%) | | Canada (%) |
Housing Starts (September) | | | | 47.3 | | | | | 8.7 | |
Retail Sales (July) | | | | 3.2 | | | | | 6.8 | |
Manufacturing Sales (July) | | | | 4.6 | | | | | 6.8 | |
Foreign Merchandise Exports (August) | | | | 2.8 | | | | | 10.1 | |
Farm Cash Receipts (March) | | | | 4.8 | | | | | 1.0 | |
Consumer Price Index (August) | | | | 1.3 | | | | | 1.5 | |
Employment (September) | | | | 1.4 | | | | | 1.8 | |
Unemployment Rate (September) | | | | 5.4 | | | | | 6.5 | |
Population (July) | | | | 1.5 | | | | | 1.2 | |
10
The following table sets forth selected indicators of economic activity and compound annual growth rates for Manitoba and Canada for the calendar years 2012 through 2016. In this table and throughout this document, compound annual growth rates are calculated by distributing the aggregate amount of growth during the period on the basis of a constant annual rate of growth, compounded annually.
SELECTED ECONOMIC INDICATORS
| | | | | | | | | | | | | | | | | | | | | | | | |
| | | Year Ended December 31, | | | Compound
Annual
Growth Rate
2012-2016 | |
| | | 2012 | | | 2013 | | | 2014 | | | 2015 | | | 2016 | | |
| | | (In millions of dollars, unless otherwise indicated) | |
Nominal Gross Domestic Product (1) | | | | | | | | | | | | | | | | | | | | | | | | |
Manitoba | | $ | 59,802 | | | $ | 62,343 | | | $ | 63,745 | | | $ | 65,665 | | | $ | 67,298 | | | | 3.0% | |
Canada | | | 1,822,808 | | | | 1,897,531 | | | | 1,983,117 | | | | 1,986,193 | | | | 2,027,544 | | | | 2.7 | |
Real Gross Domestic Product (2) | | | | | | | | | | | | | | | | | | | | | | | | |
| | | | | | |
Manitoba | | $ | 55,665 | | | $ | 57,226 | | | $ | 57,967 | | | $ | 59,027 | | | $ | 60,139 | | | | 2.0 | |
Change | | | 2.7% | | | | 2.8% | | | | 1.3% | | | | 1.8% | | | | 1.9% | | | | | |
Canada | | $ | 1,668,524 | | | $ | 1,709,820 | | | $ | 1,753,683 | | | $ | 1,770,196 | | | $ | 1,796,178 | | | | 1.9 | |
Change | | | 1.7% | | | | 2.5% | | | | 2.6% | | | | 0.9% | | | | 1.5% | | | | | |
Primary Household Income | | $ | 38,589 | | | $ | 40,185 | | | $ | 41,336 | | | $ | 43,166 | | | $ | 44,305 | | | | 3.5 | |
Primary Household Income Per Capita (in dollars) | | | 30,864 | | | | 31,752 | | | | 32,271 | | | | 33,322 | | | | 33,613 | | | | 2.2 | |
Retail Sales | | | 16,657 | | | | 17,314 | | | | 18,071 | | | | 18,368 | | | | 19,147 | | | | 3.5 | |
Capital Investment | | | 7,795 | | | | 7,620 | | | | 8,633 | | | | 9,493 | | | | 10,213 | | | | 7.0 | |
Housing Starts (units) | | | 7,242 | | | | 7,465 | | | | 6,220 | | | | 5,501 | | | | 5,318 | | | | -7.4 | |
Change in Consumer Price Indices | | | | | | | | | | | | | | | | | | | | | | | | |
| | | | | | |
Manitoba | | | 1.6% | | | | 2.2% | | | | 1.9% | | | | 1.2% | | | | 1.3% | | | | | |
Canada | | | 1.5% | | | | 0.9% | | | | 2.0% | | | | 1.1% | | | | 1.4% | | | | | |
Population (July 1) (persons in 000’s) | | | | | | | | | | | | | | | | | | | | | | | | |
Manitoba | | | 1,250 | | | | 1,266 | | | | 1,281 | | | | 1,295 | | | | 1,318 | | | | 1.3 | |
Canada | | | 34,751 | | | | 35,152 | | | | 35,535 | | | | 35,833 | | | | 36,265 | | | | 1.1 | |
Employment (workers in 000’s) | | | 621.6 | | | | 625.8 | | | | 626.5 | | | | 636.2 | | | | 633.6 | | | | 0.5 | |
Average Unemployment Rate | | | 5.3% | | | | 5.4% | | | | 5.4% | | | | 5.6% | | | | 6.1% | | | | | |
Average exchange rate (C$ per US$) | | $ | 0.9997 | | | $ | 1.0302 | | | $ | 1.1043 | | | $ | 1.2791 | | | $ | 1.3248 | | | | | |
| (1) | Expressed at market prices. |
| (2) | Expressed at market prices in 2007 chained dollars. Chained dollars is a method of adjusting real dollar amounts for inflation over time, so as to allow comparison of figures from different years. |
Sources: Statistics Canada, Manitoba Bureau of Statistics, Manitoba Department of Finance and Bank for International Settlements
Economic Structure
The Province has a balanced and diversified economy. In 2016, goods-producing industries accounted for 30.0% of real GDP at basic prices. Manufacturing, the largest goods-producing industry, accounted for 9.8% of real GDP at basic prices, followed by construction for 8.4%, mining and oil and gas extraction for 5.0%, agriculture for 3.7%, and utilities for 3.0%.
The commercial service sector accounted for 48.5% of real GDP at basic prices. Finance, insurance and real estate, the largest commercial service industry, accounted for 9.6% of real GDP, followed by transportation and warehousing for 6.4%, retail trade for 5.8% and wholesale trade for 5.8%. The non-commercial service sector accounted for 21.1% of real GDP.
11
The following table sets forth the real gross domestic product by industry at basic prices and the compound annual growth rates for the calendar years 2012 through 2016.
REAL GROSS DOMESTIC PRODUCT AT BASIC PRICES BY INDUSTRY (1)
| | | | | | | | | | | | | | | | | | | | | | | | |
| | | Year Ended December 31, | | | Compound
Annual
Growth
Rate
2012-2016 | |
| | | 2012 | | | 2013 | | | 2014 | | | 2015 | | | 2016 | | |
| | | (In millions of 2007 chained dollars) | |
Goods-Producing Industries | | | | | | | | | | | | | | | | | | | | | | | | |
Manufacturing | | $ | 5,378 | | | $ | 5,438 | | | $ | 5,434 | | | $ | 5,323 | | | $ | 5,426 | | | | 0.2% | |
Construction | | | 3,650 | | | | 3,698 | | | | 4,043 | | | | 4,339 | | | | 4,658 | | | | 6.3 | |
Mining and oil and gas extraction | | | 3,335 | | | | 3,122 | | | | 3,005 | | | | 2,957 | | | | 2,785 | | | | -4.4 | |
Agriculture | | | 1,603 | | | | 2,163 | | | | 1,828 | | | | 2,003 | | | | 2,057 | | | | 6.4 | |
Utilities | | | 1,593 | | | | 1,627 | | | | 1,621 | | | | 1,655 | | | | 1,688 | | | | 1.4 | |
| | | | | | | | | | | | | | | | | | | | | | | | |
Total Goods-Producing Industries | | | 15,559 | | | | 16,049 | | | | 15,931 | | | | 16,277 | | | | 16,613 | | | | 1.7 | |
| | | | | | | | | | | | | | | | | | | | | | | | |
Service-Producing Industries | | | | | | | | | | | | | | | | | | | | | | | | |
Commercial Services | | | | | | | | | | | | | | | | | | | | | | | | |
Finance, Insurance and Real Estate | | | 4,801 | | | | 4,925 | | | | 4,987 | | | | 5,164 | | | | 5,317 | | | | 2.6 | |
Owner-Occupied Dwellings (2) | | | 4,175 | | | | 4,324 | | | | 4,457 | | | | 4,612 | | | | 4,721 | | | | 3.1 | |
Transportation and Warehousing | | | 3,234 | | | | 3,273 | | | | 3,360 | | | | 3,461 | | | | 3,561 | | | | 2.4 | |
Retail Trade | | | 2,889 | | | | 3,013 | | | | 3,112 | | | | 3,169 | | | | 3,247 | | | | 3.0 | |
Wholesale Trade | | | 2,837 | | | | 3,009 | | | | 3,214 | | | | 3,229 | | | | 3,226 | | | | 3.3 | |
Professional and Scientific | | | 1,541 | | | | 1,646 | | | | 1,719 | | | | 1,700 | | | | 1,701 | | | | 2.5 | |
Information and Culture | | | 1,571 | | | | 1,533 | | | | 1,525 | | | | 1,513 | | | | 1,493 | | | | -1.3 | |
Business Services | | | 1,169 | | | | 1,192 | | | | 1,235 | | | | 1,265 | | | | 1,271 | | | | 2.1 | |
Accommodation, Food and Beverage | | | 954 | | | | 978 | | | | 1,002 | | | | 1,021 | | | | 1,056 | | | | 2.6 | |
Arts, Entertainment and Recreation | | | 368 | | | | 350 | | | | 350 | | | | 375 | | | | 388 | | | | 1.3 | |
Other Services | | | 929 | | | | 944 | | | | 955 | | | | 961 | | | | 971 | | | | 1.1 | |
| | | | | | | | | | | | | | | | | | | | | | | | |
Total-Commercial Services Industries | | | 24,467 | | | | 25,188 | | | | 25,916 | | | | 26,471 | | | | 26,952 | | | | 2.4 | |
| | | | | | | | | | | | | | | | | | | | | | | | |
Non-Commercial Services | | | | | | | | | | | | | | | | | | | | | | | | |
Health and Social Services | | | 4,267 | | | | 4,267 | | | | 4,310 | | | | 4,363 | | | | 4,431 | | | | 1.0 | |
Public Administration | | | 4,316 | | | | 4,268 | | | | 4,248 | | | | 4,280 | | | | 4,276 | | | | -0.2 | |
Education | | | 2,849 | | | | 2,890 | | | | 2,914 | | | | 2,955 | | | | 2,994 | | | | 1.2 | |
| | | | | | |
| | | | | | | | | | | | | | | | | | | | | | | | |
| | | | | | | | | | | | | | | | | | | | | | | | |
Total Non-Commercial Services Industries | | | 11,432 | | | | 11,426 | | | | 11,472 | | | | 11,598 | | | | 11,702 | | | | 0.6 | |
| | | | | | | | | | | | | | | | | | | | | | | | |
Total Service-Producing Industries | | | 35,900 | | | | 36,613 | | | | 37,388 | | | | 38,069 | | | | 38,654 | | | | 1.9 | |
| | | | | | | | | | | | | | | | | | | | | | | | |
Real Gross Domestic Product at Basic Prices (3) | | $ | 51,374 | | | $ | 52,755 | | | $ | 53,435 | | | $ | 54,522 | | | $ | 55,571 | | | | 2.0 | |
| | | | | | | | | | | | | | | | | | | | | | | | |
| (1) | Real GDP measures value-added and therefore differs from the value of production or the value of shipments by industry. Real GDP at basic prices is the sum of all factor incomes from production in the Province. Real GDP at basic prices plus indirect taxes, minus subsidies, equals real GDP at market prices. Amounts in the table are expressed in 2007 chained dollars. |
| (2) | Imputed rent value of Owner-Occupied Dwellings. |
| (3) | Total real GDP at basic prices does not equal the sum of real GDP by industry due to the chaining of dollars. |
Source: Manitoba Bureau of Statistics.
12
Manufacturing. Manufacturing is the largest industrial sector of the Manitoba economy. Manufacturing is well diversified, producing a wide range of consumer and industrial goods. In 2016, manufacturing accounted for 9.8% of Manitoba’s real GDP and 10.0% of employment.
The largest manufacturing industry is food manufacturing, which produces a broad range of non-durable consumer products such as processed meat and potato products, grain and oilseed products, dairy products and industrial agricultural feed products. The second-largest manufacturing industry is transportation equipment, which comprises aerospace products and parts manufacturing, and motor vehicle body and trailer manufacturing. The aerospace industry is led by three multinational firms: Boeing Canada Technology, StandardAero, and Magellan Aerospace, as well as a number of other established regional and national firms. The motor vehicle body and trailer manufacturing sector specializes in the production of urban and intercity buses, fire trucks, motor homes, recreational vehicles, and trailers. A significant amount of the motor vehicle body manufacturing sector is concentrated in the two large bus manufacturers (Motor Coach Industries Int. Inc., and New Flyer Industries Inc.), which produce coach and transit buses for the North American market.
Other notable industries within manufacturing include machinery and equipment (agriculture implements); primary metals; chemicals (agricultural chemicals and pharmaceuticals); fabricated metal products (structural steel); wood products (cabinets, millwork and lumber); and printing and electrical equipment (industrial and hydroelectric transformers and electronic components).
Manufacturing in 2016: Manufacturing sales recovered in 2016 as national and international shipments improved for manufactured products. The recovery was relatively broad based among manufacturing industries with most reporting growth in sales. Total manufacturing sales from the Province increased by 1.3% to $17.4 billion compared to a 1.5% decline in 2015. In 2016, Manitoba sales of durable goods increased by 0.9%, and sales of non-durables increased by 1.8%.
In 2016, Manitoba manufacturing sales increased in three of seven subsectors: wood products (30.3%), food products (4.4%) and fabricated metals (1.6%). Sales decreased in chemicals (3.7%), furniture (2.9%) and machinery equipment (1.7%) and were unchanged in transportation equipment (0.0%).
Employment in Manitoba’s manufacturing industries declined by 1.5% in 2016, following five consecutive years of manufacturing employment growth.
13
The following table sets forth the gross value of manufacturing sales and the compound annual growth rates of the principal manufacturing industries in Manitoba for the calendar years 2012 through 2016.
GROSS VALUE OF MANUFACTURING SALES
| | | | | | | | | | | | | | | | | | | | | | | | |
| | | Year Ended December 31, | | | Compound
Annual
Growth Rate
2012-2016 | |
| | | 2012 | | | 2013 | | | 2014 | | | 2015 | | | 2016 | | |
| | | (In millions of dollars) | |
Non-Durables | | | | | | | | | | | | | | | | | | | | | | | | |
Food | | $ | 4,198.9 | | | $ | 4,610.7 | | | $ | 4,474.6 | | | $ | 3,962.9 | | | $ | 4,137.8 | | | | -0.4% | |
Chemicals | | | 1,200.7 | | | | 1,143.8 | | | | 1,245.8 | | | | 1,390.4 | | | | 1,338.9 | | | | 2.8 | |
Other Non-Durables | | | 1,862.1 | | | | 2,162.2 | | | | 2,266.6 | | | | 2,385.9 | | | | 2,399.3 | | | | 6.5 | |
Durables | | | | | | | | | | | | | | | | | | | | | | | | |
Total Transportation Equipment | | | 2,136.8 | | | | 2,146.0 | | | | 2,314.5 | | | | 2,758.7 | | | | 2,757.3 | | | | 6.6 | |
Machinery | | | 1,794.2 | | | | 1,985.9 | | | | 2,066.6 | | | | 1,804.9 | | | | 1,775.1 | | | | -0.3 | |
Fabricated Metals | | | 919.5 | | | | 850.6 | | | | 903.5 | | | | 785.5 | | | | 798.2 | | | | -3.5 | |
Furniture and Related Products | | | 472.2 | | | | 490.9 | | | | 539.2 | | | | 608.3 | | | | 590.7 | | | | 5.8 | |
Wood Products | | | 396.2 | | | | 440.3 | | | | 379.1 | | | | 356.9 | | | | 465.0 | | | | 4.1 | |
Other Durables | | | 3,352.8 | | | | 3,099.6 | | | | 3,237.1 | | | | 3,104.1 | | | | 3,119.4 | | | | -1.8 | |
| | | | | | | | | | | | | | | | | | | | | | | | |
| | | | | | | | | | | | | | | | | | | | | | | | |
Total | | $ | 16,333.4 | | | $ | 16,930.1 | | | $ | 17,427.1 | | | $ | 17,157.6 | | | $ | 17,381.7 | | | | 1.6% | |
| | | | | | | | | | | | | | | | | | | | | | | | |
Source: Statistics Canada.
14
Manufacturing in 2017: In the first seven months of 2017, the value of manufacturing sales in Manitoba increased 4.6% compared to the same period in 2016. Canadian manufacturing sales increased by 6.8% over the same period. In Manitoba, the principal increases were in transportation equipment (10.2%), food products (6.2%), machinery (6.1%), fabricated metals (5.8%) and furniture (2.4%). The principal decreases were in wood products (1.8%) and chemicals (0.9%).
Agriculture. Agriculture is an important contributor to the Manitoba economy. Crop and livestock agri-businesses produce a variety of commodities and have strong linkages to food manufacturing, transportation and warehousing, retail and wholesale trade, as well as finance, insurance and real estate. In 2016, the primary agriculture sector represented 3.7% of Manitoba’s real GDP, while the food and beverage manufacturing sector represented 2.1% of Manitoba’s real GDP. The sales of crops, livestock and processed food products represented 39.8% of total provincial exports. Manitoba’s 2016 marketed farm cash receipts were divided between 62.6% in crops and 37.4% in livestock.
Agriculture in 2016: Crop conditions during the 2016 season were mixed across the Province. Total seeded area was similar to 2015 and overall growing conditions were favorable. However, wind and hail damage hampered production in some regions while excessive moisture and wet conditions delayed the harvest in other regions. Despite weather conditions, Manitoba crop farmers produced the third largest harvest on record, just slightly below the previous record set in 2013. The yields were close to average and the quality was slightly below normal. Compared to the 2015 harvest, Manitoba grain producers reported an increase in overall volume of production during the 2016 crop season. Crop production increased for peas (109.9%), rye (74.2%), grain corn (48.4%) and soybeans (27.2%).Wheat production was unchanged, while barley (-4.6%), oats (-7.5%) and canola (-8.7%) production was down.
In addition, market conditions for grains and oilseeds were generally supportive in 2016 as high inventory levels from increased global production were met with strong demand resulting in notably higher prices for peas and soybeans as well as slight improvements in wheat, canola and corn prices. Given the larger volume of production in Manitoba coupled with stable to higher prices, total farm cash receipts increased by 12.5% in 2016. Oilseeds, vegetable and specialty crop receipts were up 24.6%, 13.3% and 8.9% respectively, while wheat declined 6.0%.
North American hog and cattle production continued to grow in 2016, resulting in lower prices in Manitoba. Prices were significantly lower for both cattle and calves. Correspondingly, total farm cash receipts from livestock production declined by 8.5% in 2016. Cash receipts from hog production, which account for 46% of livestock receipts, declined by 2.9%. Receipts from cattle and calf production declined by 22.6%, despite increased marketing at heavier weights.
Canadian agriculture benefits from a number of support programs designed to stabilize farm incomes by mitigating production and market risks. Payments under these programs are reflected as direct payments. Due mainly to increased crop and hail insurance claims, direct payments decreased by $82.7 million (or 27.2%) in 2016 following a $73.3 million (or 31.7%) increase in 2015.
15
The following table sets forth farm cash receipts and the compound annual growth rates for the calendar years 2012 through 2016.
FARM CASH RECEIPTS
| | | | | | | | | | | | | | | | | | | | | | | | |
| | | Year Ended December 31, | | | Compound
Annual
Growth Rate
2012-2016 | |
| | | 2012 | | | 2013 | | | 2014 | | | 2015 | | | 2016 | | |
| | | (In millions of dollars) | |
Crops | | | | | | | | | | | | | | | | | | | | | | | | |
Oilseeds | | $ | 1,267.7 | | | $ | 1,471.7 | | | $ | 1,478.8 | | | $ | 1,539.0 | | | $ | 1,918.2 | | | | 10.9% | |
Wheat | | | 768.7 | | | | 1,087.6 | | | | 911.6 | | | | 915.5 | | | | 860.9 | | | | 2.9 | |
Vegetables | | | 213.8 | | | | 231.4 | | | | 264.0 | | | | 250.8 | | | | 248.0 | | | | 7.4 | |
Specialty and Forage | | | 246.4 | | | | 313.4 | | | | 266.0 | | | | 245.7 | | | | 267.6 | | | | 2.1 | |
Other Grains | | | 170.9 | | | | 279.1 | | | | 199.0 | | | | 201.3 | | | | 207.2 | | | | 4.9 | |
Other (1) | | | 50.0 | | | | 85.2 | | | | 133.9 | | | | 23.5 | | | | 35.1 | | | | -8.5 | |
| | | | | | | | | | | | | | | | | | | | | | | | |
Total Crops | | | 2,717.5 | | | | 3,468.3 | | | | 3,253.6 | | | | 3,175.7 | | | | 3,572.9 | | | | 7.1 | |
| | | | | | | | | | | | | | | | | | | | | | | | |
| | | | | | |
Hogs | | | 915.2 | | | | 940.1 | | | | 1,205.6 | | | | 1,018.4 | | | | 988.4 | | | | 1.9 | |
Cattle and Calves | | | 450.3 | | | | 487.3 | | | | 703.3 | | | | 712.2 | | | | 551.6 | | | | 5.2 | |
Dairy | | | 248.8 | | | | 240.5 | | | | 255.8 | | | | 258.8 | | | | 252.2 | | | | 0.3 | |
Poultry and Eggs | | | 245.8 | | | | 251.8 | | | | 239.8 | | | | 250.9 | | | | 262.5 | | | | 1.7 | |
Other Livestock | | | 74.2 | | | | 73.8 | | | | 88.3 | | | | 89.9 | | | | 77.9 | | | | 1.2 | |
| | | | | | | | | | | | | | | | | | | | | | | | |
Total Livestock | | | 1,934.3 | | | | 1,993.4 | | | | 2,492.8 | | | | 2,330.2 | | | | 2,132.6 | | | | 2.5 | |
| | | | | | | | | | | | | | | | | | | | | | | | |
Direct Payments | | | 494.6 | | | | 370.9 | | | | 231.2 | | | | 304.5 | | | | 221.8 | | | | -18.2 | |
| | | | | | | | | | | | | | | | | | | | | | | | |
Total | | $ | 5,146.4 | | | $ | 5,832.7 | | | $ | 5,977.6 | | | $ | 5,810.4 | | | $ | 5,927.3 | | | | 3.6 | |
| | | | | | | | | | | | | | | | | | | | | | | | |
Net Cash Income (2) | | $ | 774.8 | | | $ | 1,254.9 | | | $ | 1,417.3 | | | $ | 1,133.0 | | | $ | 1,305.8 | | | | 13.9 | |
| (1) | Includes other crops and, as a negative amount, deferred payments on all crops. |
| (2) | Represents farm cash receipts less operating expenses. |
Sources: Manitoba Agriculture, Food and Rural Development and Statistics Canada.
Agriculture in 2017: For the 2017 growing season, many crop producers adjusted their crop mix away from barley and wheat in favour of soybeans, canola, oats, and corn. The 2017 season opened with an early spring and good soil moisture levels for seeding. The growing season was drier than average, but temperatures were moderate through the hottest part of summer. This weather pattern allowed crops to do well despite lower than average precipitation in some regions.
Preliminary estimates from Statistics Canada indicate higher than expected yields and an overall record in the volume of grain and oilseed produced in 2017. Compared to the 2016 harvest, crop production increased for oats (44.5%), soybeans (40.3%), grain corn (18.3%), and canola (15.3%), while wheat production decreased 8.7% and the barley harvest decreased by 24.5%. Soybeans have enjoyed rapid growth thanks to good profitability driving an ever-increasing share of acreage.
Manitoba hog inventory rose to a record level in early January 2017. International exports of hogs fell by 4.0% while hogs destined for processing increased by 1.1%. Cattle production has been relatively stable for a number of years. Last year, inventory increased by 2.3%, as interprovincial exports decreased by 1.0%.
Despite lower prices, timing and deferral of sales payments increased cash receipts from crop production by 9.3% in the first quarter of 2017, marking a new record for sales over a twelve month period ($3.7 billion). Livestock receipts were down by 5.4% in that quarter.
16
Mining and oil and gas extraction: mineral/petroleum. The mineral and petroleum industries make up the largest primary resource sector of Manitoba’s economy. The principal metallic minerals produced in Manitoba are nickel, copper, zinc and gold. Other metals produced include silver, platinum, cobalt, selenium, cesium and tellurium. Industrial mineral production consists principally of sand and gravel, stone, peat moss and lime, as well as granite, gypsum and limestone. Manitoba produces a light sour blend of crude oil that is exported via pipeline and by rail to refiners in eastern Canada, and the northeast and north-central areas of the U.S.
In 2016, the industry accounted for 5.0% of Manitoba’s GDP and 2.9% of total merchandise exports, and directly employed 5,200 workers. Manitoba produced 34.7% of Canadian zinc production in 2016, 11.1% of its nickel production, 6.1% of its copper production, 2.0% of gold production and 100% of its cesium production.
The Province has seven producing mines. With the recent expansion of the petroleum industry in the Province, diversity in Manitoba’s mineral/petroleum sector has broadened. In 2016, metallic minerals accounted for 52.7%, petroleum for 36.2%, and industrial minerals for 11.1%. Within the total value of production of metallic minerals, nickel accounted for 29.1%, copper 25.0%, zinc 25.3%, gold 15.2%, silver 2.5% and other metals 2.9%.
Minerals/petroleum in 2016: With weak global demand and inventories for most base metals and petroleum products building, commodity prices fell in 2016. This contributed to a lower value of production from Manitoba’s mineral/petroleum industry. Capital spending on exploration activity, however, increased to $55.1 million, a 17.5% increase over 2015, but below the previous five-year annual average of $76.4 million.
In 2016, the value of mineral/petroleum production decreased by 7.6% to $2.1 billion. Petroleum sales decreased by 15.8% as a result of declines in prices as well as production, while metallic mineral sales increased by 2.1%. Industrial mineral sales decreased by 18.3% in 2016. Within the metallic mineral industry, the value of zinc and gold sales increased by 35.8% and 7.4% respectively, while nickel and copper sales decreased by 15.7%, and 3.0%, respectively.
17
The following table sets forth the gross value of mining production and the compound annual growth rates for the calendar years 2012 through 2016.
GROSS VALUE OF MINING PRODUCTION
| | | | | | | | | | | | | | | | | | | | | | | | |
| | | Year Ended December 31, | | | Compound Annual Growth Rate | |
| | | 2012 | | | 2013 | | | 2014 | | | 2015 | | | 2016 | | | 2012-2016 | |
| | | (In millions of dollars) | |
Metals | | | | | | | | | | | | | | | | | | | | | | | | |
Nickel | | $ | 457.4 | | | $ | 423.3 | | | $ | 497.2 | | | $ | 376.8 | | | $ | 317.5 | | | | -8.7% | |
Zinc | | | 148.0 | | | | 153.0 | | | | 182.1 | | | | 203.1 | | | | 275.9 | | | | 16.9 | |
Copper | | | 320.5 | | | | 227.6 | | | | 290.9 | | | | 280.6 | | | | 272.2 | | | | -4.0 | |
Gold | | | 293.8 | | | | 226.3 | | | | 168.6 | | | | 154.7 | | | | 166.2 | | | | -13.3 | |
Other Metals | | | 66.1 | | | | 65.0 | | | | 52.8 | | | | 52.2 | | | | 58.0 | | | | -3.2 | |
| | | | | | | | | | | | | | | | | | | | | | | | |
Total Metals | | | 1,285.7 | | | | 1,095.2 | | | | 1,191.6 | | | | 1,067.4 | | | | 1,089.9 | | | | -4.0 | |
Petroleum | | | 1,600.0 | | | | 1,765.1 | | | | 1,669.1 | | | | 891.0 | | | | 750.0 | | | | -17.3 | |
Industrial Mining | | | 205.9 | | | | 211.0 | | | | 236.8 | | | | 280.5 | | | | 229.1 | | | | 2.7 | |
| | | | | | | | | | | | | | | | | | | | | | | | |
Total | | $ | 3,091.6 | | | $ | 3,071.3 | | | $ | 3,097.4 | | | $ | 2,238.90 | | | $ | 2,069.0 | | | | -9.6 | |
| | | | | | | | | | | | | | | | | | | | | | | | |
Sources: Natural Resources Canada and Manitoba Growth, Enterprise and Trade.
Minerals/petroleum in 2017: Although base metal prices and demand has remained low in 2017, the volume of production for zinc and silver in Manitoba increased through the first seven months of the year, while gold, copper and nickel have fallen. Output from the two new mines that opened in 2014 (Lalor Mine and Reed Mine) helped lift the volume of zinc production by 24.0%. Silver production was up 8.3% in the first seven months of 2017 compared to the same period last year. Over the same period, the volume of gold, copper, and nickel production was down 4.4%, 10.5%, and 4.2%, respectively.
Due to the current market conditions for base metals, depletion of reserves and environmental regulations, there are several new developments in the Manitoba metal mining sector. Vale Canada has suspended operations at its Birchtree nickel mine in Thompson, Manitoba in October 2017. The suspension will result in a 6,000 tonne-a-year reduction in nickel production from Vale’s Manitoba operations and impact 200 workers. Vale Canada will be closing its smelter by the end of 2018 due to federal environmental regulations that require smelters to cut sulphur dioxide by 85%.
Due to the depletion of reserves, Hudbay has indicated that Reed mine, located between Flin Flon and Snow Lake, is slated for closure in late 2018. Reed mine currently produces 15,000 tonnes of copper. Hudbay’s 777 mine, its only Flin Flon mine, is expected to shut down in 2019 or 2020. The 777 mine produces 51 tonnes of zinc and 25 tonnes of copper annually. The combined number of jobs expected to be lost range from 500 to 900 from Hudbay’s decision to close Reed and 777 mines.
A number of other potential projects are currently under development. Among them, the Lynn Lake Project by Alamos Gold Inc. is currently proceeding through a feasibility study. A preliminary economic assessment demonstrated the potential for annual production of 145,000 ounces of gold over a 12 year mine life. Klondex Mines Ltd. is ramping up production of its Rice Lake mine. The company is forecasting 50,000 ounces of gold production in 2017. Contingent on securing financing, Minnova Corporation is working towards restarting the Puffy Lake mine south of Sherridon with planned production of 48,000 ounces of gold per year for up to 11 years. There can be no assurance that any of these projects can in fact proceed.
18
Services. Manitoba’s central location in North America has been an important element in developing a diverse services-producing sector. Manitoba’s location provides direct access to markets in Ontario, the Western Provinces and the Northern Territories. To the south, the mid-continental trade corridor provides markets and development opportunities for Manitoba with the U.S. and Mexico.
The Port of Churchill (the Port) at the Hudson Bay has been operational on a seasonal basis for many years. On July 26, 2016, OmniTRAX, which owns the Port, together with the 1,000 km Hudson Bay Railway connecting the Port with Winnipeg, shut down the Port and reduced its freight train service to Churchill from twice a week to just once a week. On May 24, 2017, the Port’s rail link to Winnipeg became inoperable after heavy flooding washed out numerous bridges on the line. The closure of the Port and the breach of its rail link to Winnipeg has affected some 90 employees at the Port directly and has affected indirectly approximately 900 residents of Churchill. There have been ongoing discussions among OmniTRAX, the Provincial and Federal Governments and a consortium of First Nations in an attempt to find a way to resume the rail service and reopen the Port. However, these negotiations have not achieved success to date, and the timing of a resolution among the stakeholders is undetermined.
Manitoba’s service sector comprises a wide range of enterprises, including transportation and warehousing, finance and insurance, wholesale and retail trade, information and culture and personal services. Service-producing industries have expanded to account in 2016 for approximately 70% of total GDP in Manitoba. From 2012 through 2016, commercial service industries accounted for 47.7% of total employment in Manitoba, and non-commercial (primarily publicly funded) services accounted for 28.9% of total employment.
19
Manitoba’s central geographical location in North America allows for effective trade, communication and commerce with all North American time zones. The location has helped Winnipeg develop a far-reaching air, rail and truck transportation network. This network is complemented by the Winnipeg James Armstrong Richardson International Airport, one of only a few 24-hour unrestricted air cargo terminals in Canada. This advantage in transportation assists in supporting a relatively large transportation and warehousing industry that accounts for 6.4% of total economic activity in Manitoba and the second-largest commercial service industry in the Province.
Winnipeg is home to one of the largest trucking centres in North America, and two of Canada’s ten largest trucking firms headquartered in Manitoba. Winnipeg is also a major rail operations hub for both of Canada’s national railways, offering intermodal marshalling yards. Three rail links to the U.S. facilitate shipments throughout North America.
CentrePort Canada is North America’s largest tri-modal inland port and a Foreign Trade Zone strategically located at the hub of international trading corridors connecting to major markets across the globe. Located in the capital region of Winnipeg, CentrePort is a unique tri-modal hub for the distribution of goods to North American and global markets through access to on-site rail, truck and air cargo operations. Significant investments are underway at CentrePort’s 20,000 acre site, including a new rail park, which will provide prime co-location opportunities for rail intensive businesses. Key industry sectors include: Transportation and Logistics; Agribusiness and Food Processing; Biomedical; Advanced Manufacturing; E-Commerce; and Energy and Mines. To date, there are 51 companies in various stages of development on the site or otherwise included in the Foreign Trade Zone, including FedEx Freight, Boeing Canada, Magellan Aerospace, MacDon, GE Aviation, Paterson GlobalFoods, Bison Transport, Canada Cartage and North West Company. Recent additions include Rosenau Transport, Imperial Seed and Ply Gem.
Commodity trading and financial services are important components of Winnipeg’s economy. In particular, Winnipeg is the centre of Canada’s grain trade, and ICE Futures Canada, also located in Winnipeg, is the only commodities exchange and the second-largest futures exchange in Canada. Seven grain companies have their head or Canadian head offices in Winnipeg. Winnipeg is the headquarters of Investors Group, one of Canada’s largest mutual fund companies, and The Great-West Life Assurance Company, one of Canada’s largest life insurance companies. The finance and insurance service industries account for 5.9% of Manitoba’s real GDP.
Manitoba also serves as a regional wholesale centre for retailers and primary producers distributing agricultural products, machinery and equipment, retail goods and energy-related products. Retail and wholesale trade industries each contribute 5.8% respectively to the Province’s real GDP.
Manitoba has a well-developed tourism industry. The Province attracts significant national and international convention activity, and Winnipeg serves as a regional entertainment centre for portions of North Dakota, Minnesota and northwestern Ontario. Manitoba also offers excellent opportunities for outdoor recreational activities and has many public and private tourism facilities.
The continued success and popularity of the Canadian Museum of Human Rights, the expansion of the RBC Convention Center and the development of the True North Square will add to Winnipeg’s existing reputation as a significant destination for tourists and large conventions. True North Square is a one-million square foot development in downtown Winnipeg with a cost of approximately $400 million. The development will include a luxury hotel, Class-A office, residential and retail space and is scheduled to open in mid-2018.
Total Exports and Imports
In 2016, total exports of Manitoba goods and services to foreign markets and other Provinces decreased 0.5% to $35.12 billion. Total imports decreased 0.2% to $42.38 billion. The trade deficit was $7.27 billion. Total exports were equal to 52.2% of nominal GDP, while total imports were equal to 63.0% of nominal GDP.
20
The following table sets forth categories of selected trade indicators for the calendar years 2012 through 2016.
SELECTED TRADE INDICATORS
| | | | | | | | | | | | | | | | | | | | |
| | | Year Ended December 31, | |
| | | 2012 | | | 2013 | | | 2014 | | | 2015 | | | 2016 | |
| | | (In millions of dollars, unless otherwise indicated) | |
Exports of Goods and Services | | | | | | | | | | | | | | | | | | | | |
International | | $ | 14,967 | | | $ | 14,899 | | | $ | 15,642 | | | $ | 16,691 | | | $ | 16,441 | |
Interprovincial | | | 17,525 | | | | 18,302 | | | | 18,740 | | | | 18,603 | | | | 18,680 | |
| | | | | | | | | | | | | | | | | | | | |
Total Exports of Goods and Services | | | 32,492 | | | | 33,201 | | | | 34,382 | | | | 35,295 | | | | 35,121 | |
| | | | | | | | | | | | | | | | | | | | |
Ratio of Total Exports to Nominal Gross Domestic Product | | | 54.3% | | | | 53.3% | | | | 53.9% | | | | 53.7% | | | | 52.2% | |
Imports of Goods and Services | | | | | | | | | | | | | | | | | | | | |
International | | $ | 16,778 | | | $ | 17,675 | | | $ | 18,259 | | | $ | 20,350 | | | $ | 19,793 | |
Interprovincial | | | 21,430 | | | | 21,430 | | | | 22,296 | | | | 22,105 | | | | 22,595 | |
| | | | | | | | | | | | | | | | | | | | |
Total Imports of Goods and Services | | | 38,208 | | | | 39,105 | | | | 40,555 | | | | 42,455 | | | | 42,388 | |
Ratio of Total Imports to Nominal Gross Domestic Product | | | 63.9% | | | | 62.7% | | | | 63.6% | | | | 64.7% | | | | 63.0% | |
| | | | | | | | | | | | | | | | | | | | |
Trade Balance | | $ | (5,716) | | | $ | (5,904) | | | $ | (6,173) | | | $ | (7,160) | | | $ | (7,267) | |
| | | | | | | | | | | | | | | | | | | | |
Sources: Statistics Canada and Manitoba Bureau of Statistics.
Manitoba’s total exports and imports of goods and services are almost evenly distributed between interprovincial and international markets. In 2016, 47% of total export sales were destined for international markets and 53% were destined for interprovincial markets. In 2016, 53% of total import sales were from interprovincial markets and 47% were from international markets.
Manitoba exports more goods to international markets compared to services. Exports of goods and services for interprovincial markets are more evenly distributed. In 2016, goods exports accounted for 87.5% of all international exports (88.2% in 2015), while services accounted for 12.5% in 2016 (11.8% in 2015). Goods exports accounted for 47.9% of all interprovincial exports in 2016 (49.7% in 2015), while services accounted for 52.1% in 2016 (50.3% in 2015).
Manitoba imports more goods from international markets compared to services. Manitoba imports more services from interprovincial markets compared to goods. Goods imports accounted for 84.3% of all international imports in 2016 (85.2% in 2015), while services accounted for 15.7% in 2016 (14.8% in 2015). Goods imports accounted for 42.7% of all interprovincial imports in 2016 (43.7% in 2015), while services accounted for 57.3% in 2016 (56.3% in 2015).
Canada and the European Union have entered into the Canada/ European Union Comprehensive Economic and Trade Agreement (CETA). On September 21, 2017 CETA provisionally came into force. Provisional application means well over 90% of the agreement will be in force, including all tariff reductions, provisions on non-tariff barriers, government procurement obligations at the EU and member state levels, and temporary entry commitments. Full implementation will take effect after the ratification by national parliaments of Member states. Canada is now one of a few countries with preferential access to the European Union. Under CETA, 98% of tariff lines will be duty free and 99% of tariff lines are duty free within 7 years. Prior to CETA, only 25% of EU tariff lines are duty free. This agreement will provide expanded export opportunities for Manitoba beef, pork, wheat, canola, freshwater fish and electronics sectors. Manitoba’s services sector, the largest sector in Manitoba’s economy, will also have preferential access to the EU services market and Manitoba companies will gain access to the $3.3 trillion/year EU government procurement market.
The U.S. administration has announced its intention to renegotiate or withdraw from the North American Free Trade Agreement (“NAFTA”) with Canada and Mexico. In May 2017, the U.S. administration formally notified Congress of its intention to renegotiate NAFTA. Negotiations commenced in August 2017; however, at this stage, it is uncertain what the outcome of those negotiations will be or their extent. Consequently, it is unclear how this would impact the Province’s trade and economy.
Foreign Merchandise Exports
Foreign merchandise exports from Manitoba amounted to $13.5 billion in 2016. Manufactured products accounted for 66.9% of total foreign merchandise exports, while agriculture commodities accounted for 21.9%. Mining commodities and electricity sales each accounted for 2.9% of total foreign merchandise exports. Of total foreign merchandise exports for 2016, 68.0% were to the U.S., 19.8% to Asia, 4.6% to Europe and 2.7% to Mexico.
From 2012 to 2016, total foreign merchandise exports increased by 18.6% (representing a compound annual growth rate of 4.4%). Exports to the U.S. increased by 19.8% (representing a compound annual growth rate of 4.6%) and exports to all other countries increased by 16.3% (representing a compound annual growth rate of 3.8%).
In 2016, total foreign merchandise exports from Manitoba decreased by 1.8%, with exports to U.S. markets decreasing by 3.7% and exports to non-U.S. markets increasing by 2.7%.
21
The following table sets forth foreign exports by commodity and the compound annual growth rates for the calendar years 2012 through 2016.
FOREIGN EXPORTS BY COMMODITY (1)
| | | | | | | | | | | | | | | | | | | | | | | | |
| | | Year Ended December 31, | | | Compound Annual Growth Rate | |
| | | 2012 | | | 2013 | | | 2014 | | | 2015 | | | 2016 | | | 2012-2016 | |
| | | (In millions of dollars) | |
Manufacturing | | | | | | | | | | | | | | | | | | | | |
Food | | $ | 1,751.0 | | | $ | 1,907.1 | | | $ | 2,152.7 | | | $ | 2,141.9 | | | $ | 2,439.3 | | | | 8.6% | |
Transportation Equipment | | | 1,060.3 | | | | 1,132.8 | | | | 1,265.7 | | | | 1,580.2 | | | | 1,662.2 | | | | 11.9 | |
Chemicals | | | 837.0 | | | | 837.1 | | | | 719.7 | | | | 1,288.3 | | | | 1,242.2 | | | | 10.4 | |
Machinery | | | 1,132.3 | | | | 1,157.4 | | | | 1,252.7 | | | | 1,073.1 | | | | 980.6 | | | | -3.5 | |
Primary Metals | | | 1,054.8 | | | | 976.7 | | | | 1,040.7 | | | | 1,052.7 | | | | 788.0 | | | | -7.0 | |
Plastics | | | 283.1 | | | | 275.9 | | | | 319.7 | | | | 419.8 | | | | 427.3 | | | | 10.8 | |
Wood Products | | | 116.9 | | | | 143.5 | | | | 138.1 | | | | 131.7 | | | | 231.7 | | | | 18.7 | |
Fabricated Metal | | | 176.5 | | | | 164.7 | | | | 182.9 | | | | 198.4 | | | | 214.2 | | | | 5.0 | |
Paper and Allied | | | 215.2 | | | | 215.0 | | | | 238.6 | | | | 245.0 | | | | 198.0 | | | | -2.1 | |
Electrical Equipment | | | 139.4 | | | | 131.6 | | | | 162.4 | | | | 178.9 | | | | 179.9 | | | | 6.6 | |
Computers and Electronics | | | 151.0 | | | | 138.7 | | | | 152.0 | | | | 165.9 | | | | 178.8 | | | | 4.3 | |
Furniture and Fixtures | | | 106.9 | | | | 120.2 | | | | 134.1 | | | | 175.5 | | | | 172.9 | | | | 12.8 | |
Printing and Publishing | | | 81.8 | | | | 88.5 | | | | 95.2 | | | | 108.3 | | | | 112.0 | | | | 8.2 | |
Petroleum and Coal | | | 84.9 | | | | 136.6 | | | | 98.8 | | | | 60.3 | | | | 79.0 | | | | -1.8 | |
Other | | | 95.8 | | | | 107.3 | | | | 108.0 | | | | 108.4 | | | | 117.9 | | | | 5.3 | |
| | | | | | | | | | | | | | | | | | | | | | | | |
Total Manufacturing | | | 7,287.0 | | | | 7,532.9 | | | | 8,061.2 | | | | 8,928.5 | | | | 9,023.8 | | | | 5.5 | |
| | | | | | | | | | | | | | | | | | | | | | | | |
Agriculture | | | | | | | | | | | | | | | | | | | | |
Oilseeds | | | 887.1 | | | | 1,351.9 | | | | 1,252.9 | | | | 1,105.2 | | | | 1,259.4 | | | | 9.2 | |
Wheat | | | 554.5 | | | | 963.4 | | | | 1,118.0 | | | | 974.5 | | | | 850.1 | | | | 11.3 | |
Hogs | | | 207.0 | | | | 200.5 | | | | 286.6 | | | | 244.3 | | | | 229.0 | | | | 2.6 | |
Vegetables | | | 172.6 | | | | 165.9 | | | | 182.1 | | | | 134.1 | | | | 164.8 | | | | -1.1 | |
Cattle | | | 111.6 | | | | 182.9 | | | | 259.1 | | | | 196.4 | | | | 157.0 | | | | 8.9 | |
Other Grains | | | 141.0 | | | | 221.3 | | | | 190.2 | | | | 188.7 | | | | 177.3 | | | | 5.9 | |
Other Agriculture | | | 93.4 | | | | 107.4 | | | | 119.6 | | | | 130.8 | | | | 121.3 | | | | 6.8 | |
| | | | | | | | | | | | | | | | | | | | | | | | |
Total Agriculture | | | 2,167.2 | | | | 3,193.4 | | | | 3,408.5 | | | | 2,974.1 | | | | 2,959.1 | | | | 8.1 | |
| | | | | | | | | | | | | | | | | | | | | | | | |
| Mining and Oil and Gas Extraction | | | 1,210.8 | | | | 1,025.1 | | | | 1,157.9 | | | | 870.4 | | | | 392.3 | | | | -24.6 | |
| Electricity | | | 267.5 | | | | 342.6 | | | | 328.7 | | | | 370.1 | | | | 387.0 | | | | 9.7 | |
| Other | | | 430.1 | | | | 455.8 | | | | 494.2 | | | | 580.7 | | | | 719.1 | | | | 10.8 | |
| | | | | | | | | | | | | | | | | | | | | | | | |
Total | | $ | 11,362.6 | | | $ | 12,549.9 | | | $ | 13,450.5 | | �� | $ | 13,723.7 | | | $ | 13,481.3 | | | | 4.4 | |
| | | | | | | | | | | | | | | | | | | | | | | | |
| (1) | Most export data, except for some principal grains, are based on port-of-exit information; consequently, data for several categories do not reflect the true value of Provincial foreign exports. |
Source: Statistics Canada.
Total foreign exports for the first eight months of 2017 were up 2.8% compared to the first eight months of 2016. This compares to a 10.1% increase in foreign exports for Canada. On a year-to-date basis, Manitoba exports to the U.S. have decreased by 3.8% and Manitoba exports to other countries have increased by 17.2%.
22
Capital Investment
In 2016, capital investment in Manitoba increased 7.6%, the third largest increase nationally and well above Canada’s 5.0% decline. The largest percentage increases in capital investment occurred in real estate; education services; utilities (reflecting Manitoba Hydro’s current capital investments); wholesale trade and retail trade. Decreases in capital investment occurred in health care and social services; mining and oil and gas extraction; accommodation and food services; information and culture; manufacturing; other capital; construction; transportation and warehousing; arts, entertainment and recreation; and agriculture. In 2016, private investment decreased by 8.3%, while public investment increased by 25.4%.
23
The following table sets forth categories of capital investment and the compound annual growth rates for the calendar years 2012 through 2016.
CAPITAL INVESTMENT
| | | | | | | | | | | | | | | | | | | | | | | | |
| | | Year Ended December 31, | | | Compound Annual Growth Rate | |
| | | 2012 | | | 2013 | | | 2014 | | | 2015 | | | 2016 | | | 2012-2016 | |
| | | (In millions of dollars) | |
Utilities | | $ | 1,124.6 | | | $ | 1,278.6 | | | $ | 1,989.2 | | | $ | 2,473.8 | | | $ | 3,569.7 | | | | 33.5% | |
Public Administration | | | 1,317.6 | | | | 1,095.7 | | | | 963.1 | | | | 1,397.7 | | | | 1,402.4 | | | | 1.6 | |
Transportation and Warehousing | | | 597.7 | | | | 807.5 | | | | 1,243.5 | | | | 1,266.5 | | | | 1,221.3 | | | | 19.6 | |
Agriculture | | | 524.2 | | | | 583.2 | | | | 589.6 | | | | 589.6 | | | | 580.6 | | | | 2.6 | |
Real Estate | | | 204.3 | | | | 187.3 | | | | 261.6 | | | | 334.9 | | | | 512.9 | | | | 25.9 | |
Manufacturing | | | 458.9 | | | | 432.0 | | | | 470.5 | | | | 528.2 | | | | 471.0 | | | | 0.7 | |
Mining and Oil and Gas Extraction | | | 1,294.6 | | | | 1,157.1 | | | | 1,029.9 | | | | 771.0 | | | | 427.6 | | | | -24.2 | |
Education | | | 220.2 | | | | 234.9 | | | | 343.7 | | | | 284.5 | | | | 422.7 | | | | 17.7 | |
Wholesale Trade | | | 134.5 | | | | 169.6 | | | | 206.5 | | | | 279.6 | | | | 350.5 | | | | 27.1 | |
Retail Trade | | | 224.3 | | | | 280.4 | | | | 229.9 | | | | 255.3 | | | | 264.1 | | | | 4.2 | |
Information and Culture | | | 209.9 | | | | 201.1 | | | | 183.6 | | | | 300.2 | | | | 204.4 | | | | -0.7 | |
Construction | | | 212.4 | | | | 181.8 | | | | 234.1 | | | | 188.5 | | | | 171.7 | | | | -5.2 | |
Health Care and Social Services | | | 470.2 | | | | 407.5 | | | | 215.2 | | | | 267.3 | | | | 144.0 | | | | -25.6 | |
Accommodation and Food Services | | | 127.0 | | | | 146.4 | | | | 210.3 | | | | 159.7 | | | | 104.9 | | | | -4.7 | |
Arts, Entertainment and Recreation | | | 220.8 | | | | 226.5 | | | | 171.9 | | | | 99.0 | | | | 96.8 | | | | -18.6 | |
Other | | | 454.3 | | | | 230.2 | | | | 290.5 | | | | 296.7 | | | | 268.2 | | | | -12.3 | |
| | | | | | | | | | | | | | | | | | | | | | | | |
Total | | $ | 7,795.3 | | | $ | 7,619.8 | | | $ | 8,633.1 | | | $ | 9,492.6 | | | $ | 10,212.8 | | | | 7.0 | |
| | | | | | | | | | | | | | | | | | | | | | | | |
Private | | $ | 4,388.1 | | | $ | 4,3311 | | | $ | 5,537.0 | | | $ | 4,892.2 | | | $ | 4,485.1 | | | | 0.5 | |
Public | | $ | 3,407.2 | | | $ | 3,288.8 | | | $ | 3,096.0 | | | $ | 4,600.4 | | | $ | 5,727.8 | | | | 13.9 | |
Source: Statistics Canada.
Statistics Canada’s Annual Capital and Repair Expenditures Survey, published in February 2017, indicated that capital investment in Manitoba was expected to decrease by 4.2% in 2017. Private capital investment was expected to increase by 2.0% and public investment to decrease by 9.0%. The largest increases were expected to occur in mining and oil and gas extraction; arts, entertainment and recreation; information and culture; accommodation and food services; transportation and warehousing; retail trade; public administration; manufacturing; and construction. The largest decreases were expected to occur in wholesale trade; education services; utilities; real estate; other capital; health care and social services; and agriculture.
Labour Force
In 2016, employment decreased 0.4% compared to 2015, with growth occurring in: utilities; forestry, fishing, mining, quarrying, oil and gas; professional, scientific and technical services; agriculture; finance, insurance, real estate and leasing; construction; information, culture and recreation; and accommodation and food services. Declines were recorded in transportation and warehousing; public administration; educational services; other services; trade; business, building and other support services; manufacturing; and was unchanged in health care and social assistance. In 2016, the average unemployment rate in Manitoba was 6.1%, up from 5.6% in 2015, the second lowest of any Province in Canada and lower than Canada’s rate of 7.0%.
24
The following table sets forth selected labour force statistics for Manitoba and Canada for the calendar years 2012 through 2016.
LABOUR FORCE
| | | | | | | | | | | | | | | | | | | | |
| | | Annual Averages | |
| | | 2012 | | | 2013 | | | 2014 | | | 2015 | | | 2016 | |
Labour Force (in 000’s) | | | 656.6 | | | | 661.5 | | | | 662.1 | | | | 674.1 | | | | 674.9 | |
Employment (in 000’s) | | | 621.6 | | | | 625.8 | | | | 626.5 | | | | 636.2 | | | | 633.6 | |
Participation Rate (Manitoba) (%) | | | 68.9 | | | | 68.6 | | | | 67.8 | | | | 68.3 | | | | 67.6 | |
Participation Rate (Canada) (%) | | | 66.5 | | | | 66.5 | | | | 66.0 | | | | 65.8 | | | | 65.7 | |
Unemployment Rate (Manitoba) (%) | | | 5.3 | | | | 5.4 | | | | 5.4 | | | | 5.6 | | | | 6.1 | |
Unemployment Rate (Canada) (%) | | | 7.3 | | | | 7.1 | | | | 6.9 | | | | 6.9 | | | | 7.0 | |
Source: Statistics Canada.
In the first nine months of 2017, seasonally adjusted employment in Manitoba increased 1.4% compared to the same period for 2016, averaging 642,400 jobs. Employment increases were recorded in forestry, fishing, mining, quarrying, oil and gas; finance, insurance, real estate and leasing; business building and other support services; information, culture and recreation; transportation and warehousing; construction; public administration; professional, scientific and other technical services; manufacturing; trade; and educational services. Declines were recorded in utilities; agriculture; accommodation and food services; and health care and social assistance.
In the first nine months of 2017, the seasonally adjusted unemployment rate in Manitoba averaged 5.4%, down from 6.1% in the same period in 2016. In the first nine months of 2017, the seasonally adjusted unemployment rate in Canada averaged 6.5%. Manitoba’s seasonally adjusted labour force participation rate over the first nine months of 2017 averaged 67.2%, down from 67.6% in the same period in 2016. The seasonally adjusted labour force participation rate in Canada averaged 65.8% over the first nine months of 2017.
Energy
Refined petroleum and natural gas provided 43% and 28%, respectively, of the Province’s total energy needs in 2015, while 29% was provided by hydro-electric energy generated in the Province. For more information on hydro-electric energy generated in the Province, see “The Manitoba Hydro-Electric Board.”
GOVERNMENT FINANCES
Under the Canadian Constitution, the Province has the power to impose direct taxation within the Province in order to raise revenue for Provincial purposes. It also has exclusive jurisdiction over the borrowing of money on the sole credit of the Province.
Under the statutes of the Province, all public money is paid to the credit of the Minister of Finance and deposited into one Consolidated Fund of the Province. Money necessary to carry out the operations of the Province in each fiscal year is voted by the Legislative Assembly, with the exception of those expenses for which provision has already been made by special legislation, such as amounts required to service the debt of the Province and to fulfill guarantees made by the Province. In addition, the Lieutenant Governor in Council may, when the Legislative Assembly is not in session, authorize expenditures that are urgently and immediately required for the public good through the issuance of special warrants.
The accounts and financial statements of the Province are examined by the Auditor General, who is responsible to the Legislative Assembly and is required to make a report to the Legislative Assembly with respect to each fiscal year.
The Summary Financial Statements of the Province have been prepared in accordance with Canadian public sector accounting standards.
25
The Summary Financial Statements reflect the financial results of the Government Reporting Entity (GRE), which consists of various government components, Government Organizations (GOs), Government Business Enterprises (GBEs) and Government Business Partnerships (GBPs).
In order to be considered a part of the GRE for the Summary Financial Statements, an organization must be controlled by the Province. Control, as defined by the Public Sector Accounting Board (PSAB), is the power to govern the financial and operating policies of another organization with expected benefits or the risk of loss from the other organization’s activities.
GOs, with the exception of GBEs and GBPs, are consolidated after adjusting their accounting policies to a basis consistent with the accounting policies of the GRE. Inter-entity accounts and transactions are eliminated upon consolidation, except for retail sales tax. Where the fiscal year-end dates of Crown organizations are not the same as that of the GRE and their transactions significantly affect the financial statements, their financial results are updated to March 31.
GBEs are entities whose principal activities are carrying on businesses, including Manitoba Hydro, Deposit Guarantee Corporation of Manitoba, Manitoba Public Insurance Corporation, Workers Compensation Board, and Manitoba Liquor and Lotteries Corporation.
GBEs maintain their accounts in accordance with IFRS. They derive the majority of their revenues from sources outside the GRE and are reported in the Summary Financial Statements using the modified equity method of accounting. Under this method of accounting, the original investment of the Province in GBEs is initially recorded at cost and adjusted annually to include the net income or losses and other net equity changes of these enterprises, without adjusting their accounting policies to a basis consistent with that of the GRE. Inter-entity accounts and transactions among GBEs are not eliminated. Supplementary financial information describing the financial position and results of operations of these enterprises is presented in Table II of Supplementary Information.
The characteristics of a GBP are similar to a GBE except the organization is a partnership under shared control, rather than a government organization under the control of the Province. GBPs are accounted for in the summary financial statements using the modified equity method. The Province accrues its share of the GBP’s net income or losses, and other net equity changes, without adjusting the GBP’s accounting policies to a basis consistent with that of the GRE.
The Consolidated Fund of the Province reflects, on a combined basis, the transactions and balances of the Core Government (which records the operations of government departments and programs), the Trust Fund (which records the trust administration function) and other special funds of the Province, such as the Fiscal Stabilization Account. The Fiscal Stabilization Account serves to assist in stabilizing the fiscal position by supporting core government operations in a fiscal year or to repay debt. This Account is also available for special initiatives. Transfers to and from the Fiscal Stabilization Account are directed by the Minister of Finance, subject to approval by the Lieutenant Governor in Council. At March 31, 2017, the Fiscal Stabilization Account had $114.5 million in liquid assets (2016 — $114.5 million).
The revenues and expenses of the Provincial Government are recorded in the Summary Financial Statements on an accrual basis with the following specific accounting policies:
| | a) | Government of Canada Receipts — Transfer payments from the Government of Canada include all accruals determined for current year entitlements that have been authorized by March 31, for which any eligibility criteria have been met and that can be reasonably estimated. |
| | b) | Taxes — Revenues from individual and corporation income tax are accrued in the year earned based upon estimates made by the Government of Canada using statistical models. These revenues are recorded at estimated amounts after considering adjustments for tax concessions and other adjustments from the Government of Canada. Transfers made through the tax system are recognized as expenses. |
Revenues from other taxes are accrued in the year earned and are recorded net of tax concessions and other adjustments. Transfers made through the tax system are recognized as expenses.
| | c) | Other Revenue — All other revenues are recorded on an accrual basis, except when the accruals cannot be determined with a reasonable degree of certainty or when their estimation is impracticable. |
26
d) Expenses — All expenses incurred for goods and services received are recorded on an accrual basis.
Expenses include provisional amounts recorded in anticipation of costs which are quantifiable and have been identified as obligations.
Government transfers are recognized as expenses in the period in which the transactions are authorized, any eligibility criteria are met, and the amounts involved can be reasonably estimated.
The Summary Financial Statements do not include revenue and expenses of local government bodies such as municipalities, which carry out certain responsibilities delegated by the Province, except that Provincial assistance provided to those entities is included in the accounts of the Province as an expense.
STATEMENT OF REVENUE AND EXPENSE
OF THE GOVERNMENT REPORTING ENTITY
| | | | | | | | | | | | | | | | | | | | | | | | | |
| | | Year Ended March 31, |
| | | 2013 | | 2014 | | 2015 | | 2016 | | 2017 |
| | | (In millions of dollars) |
Revenue | | | | | | | | | | | | | | | | | | | | | | | | | |
Income taxes: | | | | | | | | | | | | | | | | | | | | | | | | | |
Corporation income tax | | | $ | 456 | | | | $ | 468 | | | | $ | 562 | | | | $ | 516 | | | | $ | 459 | |
Individual income tax | | | | 2,846 | | | | | 2,978 | | | | | 3,117 | | | | | 3,261 | | | | | 3,499 | |
Other taxes: | | | | | | | | | | | | | | | | | | | | | | | | | |
Retail sales tax | | | | 1,767 | | | | | 2,028 | | | | | 2,205 | | | | | 2,269 | | | | | 2,301 | |
Fuel taxes | | | | 332 | | | | | 329 | | | | | 334 | | | | | 332 | | | | | 336 | |
Levy for health and education | | | | 296 | | | | | 315 | | | | | 321 | | | | | 333 | | | | | 343 | |
Education property tax | | | | 578 | | | | | 634 | | | | | 663 | | | | | 711 | | | | | 793 | |
Other taxes | | | | 590 | | | | | 617 | | | | | 579 | | | | | 605 | | | | | 623 | |
Fees and other revenue | | | | 2,043 | | | | | 2,233 | | | | | 2,215 | | | | | 2,269 | | | | | 2,383 | |
Federal transfers: | | | | | | | | | | | | | | | | | | | | | | | | | |
Equalization | | | | 1,872 | | | | | 1,799 | | | | | 1,750 | | | | | 1,738 | | | | | 1,736 | |
Canada Health and Canada Social Transfers | | | | 1,487 | | | | | 1,524 | | | | | 1,621 | | | | | 1,697 | | | | | 1,798 | |
Shared cost and other | | | | 594 | | | | | 495 | | | | | 438 | | | | | 385 | | | | | 594 | |
Net income from government business enterprises | | | | 739 | | | | | 783 | | | | | 921 | | | | | 713 | | | | | 631 | |
Sinking funds and other investments earnings | | | | 212 | | | | | 211 | | | | | 237 | | | | | 225 | | | | | 227 | |
| | | | | | | | | | | | | | | | | | | | | | | | | |
Total Revenue | | | | 13,812 | | | | | 14,414 | | | | | 14,963 | | | | | 15,054 | | | | | 15,723 | |
| | | | | | | | | | | | | | | | | | | | | | | | | |
Expenses | | | | | | | | | | | | | | | | | | | | | | | | | |
Health | | | | 5,451 | | | | | 5,703 | | | | | 5,976 | | | | | 6,237 | | | | | 6,546 | |
Education | | | | 3,732 | | | | | 3,930 | | | | | 3,994 | | | | | 4,138 | | | | | 4,237 | |
Families | | | | 1,680 | | | | | 1,723 | | | | | 1,809 | | | | | 1,938 | | | | | 2,027 | |
Community, Economic and Resource Development | | | | 1,396 | | | | | 1,371 | | | | | 1,452 | | | | | 1,423 | | | | | 1,429 | |
Justice and Other Expenditures | | | | 1,274 | | | | | 1,388 | | | | | 1,321 | | | | | 1,302 | | | | | 1,318 | |
Debt Servicing | | | | 839 | | | | | 821 | | | | | 841 | | | | | 855 | | | | | 930 | |
| | | | | | | | | | | | | | | | | | | | | | | | | |
Total Expenses | | | | 14,372 | | | | | 14,936 | | | | | 15,393 | | | | | 15,893 | | | | | 16,487 | |
| | | | | | | | | | | | | | | | | | | | | | | | | |
Net Loss for the year | | | $ | (560) | | | | $ | (522) | | | | $ | (430) | | | | $ | (839) | | | | $ | (764) | |
| | | | | | | | | | | | | | | | | | | | | | | | | |
Budget
The Provincial Government prepares a budget each fiscal year, which estimates revenue and expenses for both Core Government operations and on a summary financial basis.
In June 2017, the Province enacted The Fiscal Responsibility and Taxpayer Protection Act (the Fiscal Responsibility
Act), which replaced previous balanced-budget legislation.
27
Under the Fiscal Responsibility Act, the Minister of Finance must table a budget for the government reporting entity every fiscal year, typically by April 30. At the same time, the Minister must table a fiscal responsibility strategy setting out the current and future financial objectives for the Government. Once the deficit has been eliminated, this strategy must also set out the Government’s debt reduction objectives.
Until the deficit is eliminated, the Government is not to incur a deficit that is more than the baseline amount. This amount is set by legislation as either the annual deficit amount projected for the 2017-2018 budget or (if it is lower) the lowest actual annual deficit amount for any fiscal year starting with fiscal 2017.
Once the deficit has been eliminated, then the Government must maintain balance by not incurring a deficit. The deficit or surplus amount is to be calculated on a summary basis. Certain amounts are excluded from the calculation, such as Manitoba Hydro’s net income or loss as well as the impact of natural disaster or war. Adjustments are to be made for amounts transferred to or from the Fiscal Stabilization Account. As part of the public accounts for each fiscal year, the Minister of Finance must report on the deficit or surplus amount and compare actual results with the budget and the fiscal responsibility strategy.
Each fiscal year, beginning with fiscal 2018, 20% of ministerial salaries are withheld pending the tabling of the public accounts for that year. The amount withheld increases to 40% if there are two consecutive years in which there is a contravening deficit. The withholding does not apply to new Ministers in the fiscal year of their appointments, and any increase in withholding to 40% does not apply to new Ministers in the second and third fiscal years following their appointment. These withholdings do not apply to Ministers appointed following a general election that has resulted in a change in government.
The portion of the amount withheld to be paid to Ministers is determined by the actual results for the year. If there is no deficit, the full amount withheld is to be paid to them. If there is a contravening deficit, the ministerial salary for that year is reduced by the full amount withheld. If there is a deficit that does not exceed the legislated requirement, the ministerial salary is reduced proportionally, with the full amount payable if the deficit is lower than the legislated requirement by $100 million or more.
A non-binding referendum must be held before the Government introduces any bill to increase the rate of tax under The Health and Post Secondary Education Tax Levy Act, The Income Tax Act or The Retail Sales Tax Act. The Fiscal Responsibility Act cannot be amended or repealed without being referred at the committee stage to a standing committee of the Legislative Assembly for public meetings to be held with not less than seven days’ notice.
Budget 2017, introduced on April 11, 2017, reaffirms the Government’s stated commitment to restoring fiscal discipline with a common sense approach to financial management, review processes and programs to eliminate waste and duplication to ensure that public funding delivers value for money. Beginning in fiscal 2017/18, the Government will begin to rebuild the Province’s savings, providing protection for core government operations in future years, by commencing transfers to the Fiscal Stabilization Account.
The Fiscal Responsibility Strategy included in the fiscal 2018 budget sets out the Government’s priorities for fiscal responsibility, as well as measurable outcomes, as follows:
| | | | | | |
Financial Management Priority | | | | | | Measurable Outcomes |
| Restoring Fiscal Discipline | | | | • Meeting Budget Targets |
| | |
| | | | • Stabilizing the Net Debt to GDP |
| | |
| | | | • Restoring Credit Ratings |
| | |
| Rebuilding the Economy | | | | • Sustainable Investment in Strategic Infrastructure |
| | |
| | | | • Employment Growth |
These priorities will be reported on at the time the Public Accounts for the year are released.
28
The following table sets forth the budgeted financing requirement for the GRE for fiscal year 2017:
BUDGETED FINANCING REQUIREMENT
(In millions of dollars)
| | | | |
Refinancing: | | | | |
General Government Programs | | $ | 942 | |
Manitoba Hydro | | | 415 | |
General Government Capital Investments | | | 234 | |
Civil Service Superannuation Fund | | | 350 | |
Other Self-Sustaining Programs | | | 152 | |
New Cash Requirements: | | | | |
Manitoba Hydro | | | 2,970 | |
General Government Programs | | | 779 | |
General Government Capital Investments | | | 418 | |
Other Self-Sustaining Programs | | | 468 | |
| | | | |
Total Provincial Financing Requirement | | $ | 6,728 | |
| | | | |
In the fiscal year 2017, the Province recorded a net loss of $764 million, which was $147 million better than anticipated by the fiscal 2016 budget. The total summary revenue was $15,723 million, $493 million higher than the fiscal 2016 budget estimate of $15,230 million. Summary expenses were $16,487 million, an increase of $346 million from the fiscal 2016 budget estimate of $16,141 million. The following discussion of Core Government Revenues and Expenses reflects budgeted and actual amounts used in the budgetary process of the Legislative Assembly, which may differ from corresponding amounts reflected in the Summary Financial Statements.
Core Government Revenue
Provincial Source Revenues. The Province expects to derive $9,165.3 million, or about 70.4% of its Total Revenue budgeted for the fiscal year ending March 31, 2018 of $13,016.1 million, from Provincial sources. In the fiscal year ending March 31, 2017, Total Revenue was $12,743.6 million, of which $8,912.8 million, or about 70.0%, was derived from Provincial sources.
Taxation in Canada is constitutionally divided between the Federal and Provincial Governments. The Federal Government collects taxes partly for its own expenditures and partly for distribution to the Provinces. The Federal Government has authority to levy both direct and indirect taxes, while Provinces may levy direct taxes only. Local governments derive their taxing powers from the Provinces.
Personal income taxes are levied by both the Federal and Provincial Governments. The Province has a personal income tax with three brackets and rates ranging up to 17.4% applied directly to taxable income, subject to certain tax credits. The personal income tax is collected on the Province’s behalf by the Federal Government. Personal income tax revenue for the fiscal year ending March 31, 2018 is budgeted at $3,650.3 million, up from $3,498.5 million received in fiscal 2017.
The Province levies a tax on the taxable income of corporations. The tax rate on taxable income of small businesses (with active business income of less than $450,000) is 0.0%. The general business tax rate is 12.0%. Corporation income tax revenue for the fiscal year ending March 31, 2018 is budgeted at $543.2 million, up from $459.1 million received in the previous fiscal year.
The Province applies a tax at a general rate of 8% on retail sales of most tangible personal property and some services, with major exemptions in respect of food for home consumption, domestic heating, children’s clothing under $150 per item, custom software, most farm machinery and all prescription drugs. Retail sales tax revenue in the fiscal year ending March 31, 2018 is budgeted at $2,357.7 million, up from $2,298.2 million received in the previous fiscal year.
The Province levies a tax of 14.0¢ per litre on gasoline and motive fuels. For the fiscal year ending March 31, 2018, the revenues from gasoline and motive fuel taxes are budgeted at $334.7 million, slightly down from $335.5 million received in the previous fiscal year. There is also a tobacco tax of 29.5¢ per cigarette and 28.5¢ per gram of fine-cut tobacco. Total tobacco tax
29
revenue for the fiscal year ending March 31, 2018 is budgeted at $248.6 million, up from $243.3 million received in the previous fiscal year.
A levy for financing health and post-secondary education is applied to total compensation paid to employees by Manitoba employers. Employers with annual payrolls under $1.25 million are exempt and those with payrolls between $1.25 million and $2.5 million are subject to reduced rates. The tax rate on taxable payroll is 2.15%. For the fiscal year ending March 31, 2018, the levy is budgeted to yield $477.5 million, up from $475.3 million received in the previous fiscal year.
Federal Government Transfers: Total transfer payments from the Government of Canada are budgeted to provide $3,850.8 million, or approximately 29.6%, of the Province’s total core revenue in the fiscal year ending March 31, 2018. This compares to $3,830.8 million, or approximately 30.1%, received in the previous fiscal year.
Unconditional transfers, primarily grants under a Federally-funded Provincial fiscal equalization formula and cash payments under the Canada Health Transfer (CHT) and Canada Social Transfer (CST), are budgeted to account for $3,677.4 million, or approximately 28.3% of total core revenue in 2017/18. This compares to $3,534.1 million, or 27.7%, received in the previous fiscal year. Conditional transfers, consisting mainly of Federal payments in respect of cost-shared programs for social and economic development, account for the remainder of the Government of Canada transfers.
Equalization and the CHT and CST (major transfers) are authorized by the Federal-Provincial Fiscal Arrangements Act (Canada) (Fiscal Arrangement Act).
The Government of Canada’s Equalization Program (the Equalization Program) is intended to ensure Provincial Governments have sufficient revenue to offer reasonably comparable public services at reasonably comparable levels of taxation. Formula-driven, it determines how much revenue each Province could raise on its own at typical levels of taxation and any shortfall relative to the Provincial average (the 10-Province “standard”) is partially or fully paid out in “Equalization”. Entitlements are announced in advance of the fiscal payment year and are not subject to revision. The Province has budgeted $1,820.4 million in Equalization revenue in the fiscal year ending March 31, 2018, up from $1,735.6 million received in the previous fiscal year.
The Equalization Program includes a growth ceiling introduced in 2009/10 that ensures annual growth in total program payments does not exceed growth in the economy as measured by a three-year moving average of national nominal Gross Domestic Product. This ceiling, combined with a relative strengthening in the Provincial economy, has reduced Manitoba’s Equalization entitlement in recent years, from $2,063.4 million in 2009/10 to $1,820.4 million in 2017/18.
The CHT is the primary Federal Transfer to Provinces and Territories in support of health care. Total CHT cash support for all Provinces and Territories will reach $37.1 billion in 2017/18. Starting in 2017/18, rather than a fixed annual escalator, the CHT will grow in line with a three-year moving average of national nominal GDP growth, with funding guaranteed to increase by at least 3% per year. The CHT is allocated on an equal per capita cash basis. The Province has budgeted $1,355.4 million in CHT revenue in 2017/18, up from $1,312.9 million received in the previous fiscal year.
The CST supports Provinces and Territories in the provision of post-secondary education, social assistance and social services, including early childhood development and childcare. It is allocated on an equal per capita cash basis across all Provinces and Territories and includes a 3% annual escalator. The Province has budgeted $501.6 million in CST revenue in 2017/18, up from $485.6 million received in the previous fiscal year.
The Fiscal Arrangements Act has a Provincial revenue stabilization provision that provides for Federal grants and interest-free loans if revenue from a Province’s own source revenues plus Equalization falls below 95% of the previous year’s level, excluding variations in natural resource revenue. The Province is not expected to require stabilization funding in 2017/18.
Core Government Expenses
Health. For the fiscal year ending March 31, 2018, expenditure for Health, Seniors and Active Living is budgeted at $6,104.9 million, an increase of 1.8% over the prior year’s budget. This is the largest single expense category and represents 44.2% of the Province’s total budgeted Expenditure Estimate. Health includes the Universal Health Benefits Plan, under which hospital and medical care is available to Manitoba residents without charge. Under this Plan, the Province pays all the operating costs, as well as the debt servicing costs, of approved capital construction for hospitals and personal care institutions.
Education. Education expenditure for the fiscal year ending March 31, 2018 is budgeted at $2,771.9 million, an increase of 1.3% over the prior year’s budget, and represents 20.1% of Manitoba’s total budgeted Expenditure Estimate. The major portion of this expense, amounting to $1,378.2 million, is for providing direct financial support to local school divisions for the
30
approved cost of public schools in the Province, as well as the debt servicing costs of approved capital construction for schools. The additional funds required to operate the public schools, plus any special projects undertaken by the school divisions, are derived from a property tax on the residents of the divisions. The education expenditure also includes financial support for the four universities and the three community colleges in the Province, which is budgeted in total to amount to $699.4 million for the fiscal year ending March 31, 2018.
Families. The Province’s social security program provides income security, financial assistance to the elderly, rehabilitation services for physically and mentally handicapped persons and child welfare services. This category represents 14.7% of the Province’s total budgeted Expenditure Estimate. For the fiscal year ending March 31, 2018, expenditure for families is budgeted at $2,033.4 million, an increase of 5.4% over the prior year’s budget.
Community, Economic and Resource Development. Expenditure on Community, Economic and Resource Development is budgeted at $1,531.9 million for the fiscal year ending March 31, 2018, an increase of 1.0% over the prior year’s budget. This represents 11.1% of Manitoba’s total budgeted Expenditure Estimate. The largest item in this category is Infrastructure, amounting to $666.7 million.
Expenditure for Provincial assistance to municipal governments is budgeted at $410.3 million for the fiscal year ending March 31, 2018 and includes $361.0 million funding to support the delivery of municipal services and infrastructure renewals, and $17.8 million for grants in lieu of taxes to municipalities.
Justice and Other Expenditures. Expenditure for Justice and Other Expenditures are budgeted at $1,138.3 million, an increase of 0.8% over the prior year’s budget and represents 8.2% of the Province’s total budgeted Expenditure Estimate.
The Province also provides property and cost-of-living tax credits to residents of Manitoba. These credits are reflected as expenditure under Justice and Other Expenditures, and are budgeted at $363.0 million for the fiscal year ending March 31, 2018.
Debt Servicing. The net cost of servicing total direct public borrowings after deducting recoveries from Crown organizations and GBEs, investment earnings and interest recovery on departments’ capital asset purchases is budgeted at $240.0 million. For the fiscal year ending March 31, 2018, the gross interest expense for the Province’s direct funded borrowings is estimated to be $1,722.4 million, which is reduced by $41.9 million of interest income, $1,108.6 million on borrowings in respect of which interest is recovered from Crown organizations and other government entities, and $331.9 million in interest recovery from other Provincial departments in respect of teachers’ pension funding and departments’ capital asset purchases.
31
CROWN ORGANIZATIONS AND GOVERNMENT BUSINESS ENTERPRISES (GBEs)
The Province provides certain services and promotes certain types of social and economic development through Crown organizations and GBEs (collectively, Crown organizations) which have access to financial assistance from the Province through advances, equity investments, guaranteed borrowings, loans and grants. Crown organizations, such as Manitoba Hydro, are intended to operate on a commercial basis, rather than be subsidized by the Province. The Province also operates other Crown organizations, such as The Manitoba Agricultural Services Corporation and The Manitoba Housing and Renewal Corporation, on a partially subsidized basis, with funds provided from departmental appropriations. With the exception of the Manitoba Liquor & Lotteries Corporation, the profits of which are transferred to the Province, Crown organizations generally retain their profits for their own requirements. Loans, advances, investments and grants are made as required for the operations of the organizations pursuant to appropriations in the Provincial Budget or through specific enactments by the Legislative Assembly.
A valuation allowance is provided in the accounts of the Province for decreases in the values of loans and advances made to Crown organizations, and is adjusted annually for changes that occur in the estimated realizable value of these assets, based on financial results applicable to the most recent fiscal year completed prior to April 1. This allowance is intended to provide for any accumulated operating and capital deficits of Crown organizations. The allowance as at March 31, 2017, was $240.4 million in respect of the Province’s total loans and advances to its Crown organizations at such date in the amount of $19,800.7 million.
The following table summarizes the loans and advances of the Province’s principal Crown organizations for the years 2012 through 2017 and the allowance for losses on realizations of assets as at March 31, 2017:
LOANS AND ADVANCES TO
CROWN ORGANIZATIONS AND GOVERNMENT BUSINESS ENTERPRISES (1)
| | | | | | | | | | | | | | | | | | | | | | | | |
| | | As at March 31, | |
| | | 2013 | | | 2014 | | | 2015 | | | 2016 | | | 2017 | | | 2017
Valuation
Allowance | |
| | | (In thousands of dollars) | |
The Manitoba Hydro-Electric Board (2) | | $ | 9,775,351 | | | $ | 10,683,355 | | | $ | 12,484,985 | | | $ | 14,436,151 | | | $ | 16,340,571 | | | $ | — | |
The Manitoba Housing and Renewal Corporation | | | 632,577 | | | | 746,426 | | | | 845,286 | | | | 970,185 | | | | 1,009,116 | | | | 183,699 | |
University of Manitoba | | | 457,169 | | | | 489,383 | | | | 519,849 | | | | 528,303 | | | | 530,299 | | | | — | |
The Manitoba Agricultural Services Corporation | | | 387,071 | | | | 438,108 | | | | 482,549 | | | | 595,478 | | | | 669,074 | | | | 17,952 | |
Manitoba Liquor & Lotteries Corporation | | | 241,321 | | | | 283,310 | | | | 341,988 | | | | 414,213 | | | | 420,599 | | | | — | |
University of Winnipeg | | | 103,488 | | | | 128,931 | | | | 139,010 | | | | 139,962 | | | | 138,666 | | | | — | |
Manitoba Development Corporation | | | 114,442 | | | | 102,894 | | | | 95,120 | | | | 96,071 | | | | 76,947 | | | | 24,667 | |
Other (3) | | | 266,474 | | | | 275,641 | | | | 309,508 | | | | 468,559 | | | | 615,446 | | | | 14,088 | |
| | | | | | | | | | | | | | | | | | | | | | | | |
Total | | $ | 11,977,892 | | | $ | 13,148,049 | | | $ | 15,218,297 | | | $ | 17,648,922 | | | $ | 19,800,719 | | | $ | 240,405 | |
| | | | | | | | | | | | | | | | | | | | | | | | |
| (1) | Crown organizations also have debt not guaranteed by the Province, which consists of $96.2 million held by Canada Mortgage and Housing Corporation, an agency of the Federal Government, $65.0 million held by various First Nations Bands and $0.36 million of assumed mortgages on existing properties. |
| (2) | Provincial advances have been adjusted by the foreign currency fluctuation on the direct borrowings of the Province for which Manitoba Hydro is responsible. |
| (3) | Includes post-secondary education institutions. |
32
Manitoba Hydro provides for a supply of electrical power adequate for the needs of Manitoba, and promotes economy and efficiency in the generation, distribution, supply and use of electrical power within Manitoba. See “The Manitoba Hydro-Electric Board.” Pursuant to legislation enacted in 2001, the Government may not privatize Manitoba Hydro unless approved by the voters of Manitoba in a referendum.
The Manitoba Housing and Renewal Corporation (MHRC) undertakes the construction of housing projects and administers various Provincially subsidized housing programs, including rental subsidies for low income families, housing grants for elderly persons and housing improvement programs. At March 31, 2017, MHRC had total assets of $1,135.9 million, represented by $253.6 million of projects completed or under construction, owned land held for development and/or sale having a book value of $59.2 million, loans and mortgages receivable of $124.1 million and other assets of $814.6 million.
The Manitoba Agricultural Services Corporation (MASC) provides credit for farmers principally through direct loans for capital purposes secured by first mortgages held by MASC and through guarantees of loans by Canadian chartered banks. MASC also provides crop insurance to farmers. At March 31, 2017, MASC had total assets of $1,192.3 million, of which $647.2 million represented receivables secured by first mortgages on farm land and buildings. For the fiscal year ended March 31, 2017, MASC’s operating income was $96.4 million, after Provincial operating grants of $98.3 million. As at March 31, 2017, the accumulated surplus of MASC was $461.1 million.
PUBLIC DEBT
Borrowing Record
The Province has always paid the full face amount of the principal of and premium and interest (if any) on (a) every direct obligation issued by it and (b) every indirect obligation on which it has been required to implement its guarantee, in each case promptly when due, in the currency in which, and country where, payable at the time of payment thereof, subject during wartime to any applicable laws or regulations forbidding trading with the enemy.
Direct Funded Borrowings of the Province
The Province borrows to fund its net cash requirement. The following table summarizes the direct funded borrowings of the Province by currency exposure as at March 31 for the years 2013 through 2017.
33
DIRECT FUNDED BORROWINGS (1)
| | | | | | | | | | | | | | | | | | | | |
| | | As at March 31, | |
| | | 2013 | | | 2014 | | | 2015 | | | 2016 | | | 2017 | |
| | | (In thousands of dollars) | |
Direct Funded Borrowings Payable in: | | | | | | | | | | | | | | | | | | | | |
Canadian Dollars (2) | | $ | 21,828,560 | | | $ | 24,229,040 | | | $ | 27,229,483 | | | $ | 29,627,982 | | | $ | 31,479,249 | |
Issues hedged to Canadian Dollars | | | 6,371,980 | | | | 6,154,381 | | | | 6,351,135 | | | | 8,260,514 | | | | 10,285,429 | |
U.S. Dollars | | | 1,726,520 | | | | 1,879,010 | | | | 1,775,620 | | | | 1,616,187 | | | | 932,540 | |
Issues hedged to U.S. Dollars | | | 343,666 | | | | — | | | | — | | | | — | | | | 666,100 | |
| | | | | | | | | | | | | | | | | | | | |
Total Direct Funded Borrowings | | | 30,270,726 | | | | 32,262,431 | | | | 35,356,238 | | | | 39,504,683 | | | | 43,363,318 | |
Less: Sinking Funds | | | (2,571,940) | | | | (2,188,735) | | | | (2,030,861) | | | | (1,751,198) | | | | (1,622,411) | |
| | | | | | | | | | | | | | | | | | | | |
Net Direct Funded Borrowings | | $ | 27,698,786 | | | $ | 30,073,696 | | | $ | 33,325,377 | | | $ | 37,753,485 | | | $ | 41,740,907 | |
| | | | | | | | | | | | | | | | | | | | |
Raised for the purpose of: | | | | | | | | | | | | | | | | | | | | |
General Government Programs (3) | | $ | 14,828,248 | | | $ | 15,720,219 | | | $ | 16,778,966 | | | $ | 18,501,398 | | | $ | 20,269,628 | |
The Manitoba Hydro-Electric Board | | | 9,443,408 | | | | 10,573,003 | | | | 12,370,447 | | | | 14,436,152 | | | | 16,340,570 | |
| Other Self-Sustaining | | | 3,393,897 | | | | 3,761,075 | | | | 4,161,262 | | | | 4,805,935 | | | | 5,130,709 | |
Borrowings | | | | | | | | | | | | | | | | | | | | |
Loans Payable to GBEs and Other | | | 33,233 | | | | 19,399 | | | | 14,702 | | | | 10,000 | | | | — | |
| | | | | | | | | | | | | | | | | | | | |
Net Direct Funded Borrowings | | $ | 27,698,786 | | | $ | 30,073,696 | | | $ | 33,325,377 | | | $ | 37,753,485 | | | $ | 41,740,907 | |
| | | | | | | | | | | | | | | | | | | | |
| (1) | Debentures payable in U.S. dollars and other foreign currencies are stated at the Canadian dollar equivalent using the exchange rates in effect on March 31 each year, adjusted for any foreign currency contracts entered into for settlement after those dates. All U.S. dollar borrowing has either been hedged to Canadian dollars or is the responsibility of Manitoba Hydro, which has significant U.S. dollar revenues. |
| (2) | Direct funded borrowings payable in Canadian dollars include debentures held by the Canada Pension Plan Investment Fund. Such securities are not negotiable, transferable or assignable, but are redeemable in whole or in part before maturity at the option of the Minister of Finance of Canada, on six months’ prior notice, when the Minister deems it necessary in order to meet the requirements of the Canada Pension Plan. At March 31, 2016 and 2017, the total amount of such securities was $492 million. |
| (3) | Borrowings for general government programs, including capital assets and pension funding, consist of the total direct funded borrowings of the Province, less borrowings issued for self-sustaining purposes. |
For additional information as to the direct funded borrowings of the Province, see “Tables of Supplementary Information — Table III.” Subsequent to March 31, 2017, the Province issued funded borrowings of $3,741.1 million in Canadian dollars, which was issued to finance maturing issues and to provide funding for Manitoba Hydro and for self-sustaining programs.
Guaranteed Borrowings of the Province
The following table summarizes the guaranteed borrowings of the Province by currency and purpose of issue as at March 31 for the years 2013 through 2017.
34
GUARANTEED BORROWINGS
| | | | | | | | | | | | | | | | | | | | |
| | | As at March 31, | |
| | | 2013 | | | 2014 | | | 2015 | | | 2016 | | | 2017 | |
| | | (In thousands of dollars) | |
Net Guaranteed Borrowings: | | | | | | | | | | | | | | | | | | | | |
Payable in Canadian Dollars (1) | | $ | 165,657 | | | $ | 262,458 | | | $ | 169,059 | | | $ | 110,024 | | | $ | 90,543 | |
| | | | | | | | | | | | | | | | | | | | |
Issued by: | | | | | | | | | | | | | | | | | | | | |
Manitoba Hydro | | $ | 163,157 | | | $ | 262,458 | | | $ | 169,059 | | | $ | 107,524 | | | $ | 88,043 | |
Other | | | 2,500 | | | | 2,500 | | | | 2,500 | | | | 2,500 | | | | 2,500 | |
| | | | | | | | | | | | | | | | | | | | |
Net Guaranteed Borrowings (1) | | $ | 165,657 | | | $ | 264,958 | | | $ | 171,559 | | | $ | 110,024 | | | $ | 90,543 | |
| | | | | | | | | | | | | | | | | | | | |
| (1) | The table does not include guarantees of the Province totaling $73.1 million as at March 31, 2017. |
For additional information as to guaranteed borrowings, see “Tables of Supplementary Information — Table IV.”
Maturity Schedule
The following table sets forth the maturity schedule by currency of the direct funded and guaranteed borrowings of the Province as at March 31, 2017:
MATURITY SCHEDULE
DIRECT AND GUARANTEED BORROWINGS (1)
| | | | | | | | | | | | | | | | | | | | |
Years Ending March 31, | | Canadian
Dollars (2) | | | U.S.
Dollars (3) | | | Gross
Maturities | | | Estimated
Sinking Funds
Withdrawal | | | Net
Maturities | |
| | | (In millions of dollars) | |
Short-Term Borrowings (4) | | $ | 1,625 | | | $ | — | | | $ | 1,625 | | | $ | — | | | $ | 1,625 | |
2018 (4) | | | 2,496 | | | | — | | | | 2,496 | | | | 397 | | | | 2,099 | |
2019 | | | 2,211 | | | | 533 | | | | 2,744 | | | | 409 | | | | 2,335 | |
2020 | | | 2,398 | | | | 666 | | | | 3,064 | | | | 236 | | | | 2,828 | |
2021 | | | 3,523 | | | | — | | | | 3,523 | | | | 218 | | | | 3,304 | |
2022 | | | 1,562 | | | | 400 | | | | 1,962 | | | | 290 | | | | 1,672 | |
| | | | | | | | | | | | | | | | | | | | |
| | | 13,816 | | | | 1,599 | | | | 15,414 | | | | 1,551 | | | | 13,863 | |
2023-2027 | | | 9,605 | | | | — | | | | 9,605 | | | | 69 | | | | 9,536 | |
2028-2037 | | | 4,040 | | | | — | | | | 4,040 | | | | 3 | | | | 4,037 | |
2038-2065 | | | 14,001 | | | | — | | | | 14,001 | | | | — | | | | 14,001 | |
| | | | | | | — | | | | | | | | — | | | | | |
2018-2053 Health Care Facilities | | | 394 | | | | — | | | | 394 | | | | — | | | | 394 | |
| | | | | | | | | | | | | | | | | | | | |
| | $ | 41,855 | | | $ | 1,599 | | | $ | 43,454 | | | $ | 1,622 | | | $ | 41,831 | |
| | | | | | | | | | | | | | | | | | | | |
| (1) | The table does not include guarantees of the Province totaling $73.1 million as at March 31, 2017. |
| (2) | Borrowings payable in Canadian dollars include borrowings swapped from other currencies. |
| (3) | Borrowings payable in U.S. dollars (U.S. $1.2 billion) are stated at the Canadian dollar equivalent as at March 31, 2017. |
| (4) | Short-Term Borrowings represent 90-day Treasury Bills and Promissory Notes outstanding. Short-Term Borrowings, together with the 2018 maturities, represent the total direct and guaranteed borrowings with a residual maturity of less than one year. |
35
Sinking Funds
The Minister of Finance may provide for the creation and management of sinking funds for the orderly retirement of borrowings and may authorize, by directive, the amounts, if any, to be allocated to the Province’s sinking fund. The amount allocated to the sinking fund by the Province for the fiscal year ended March 31, 2017, was nil. Currently, the Province’s sinking fund is invested principally in securities issued or guaranteed by the Government of Canada or the Canadian Provinces.
Manitoba Hydro is required by statute to provide, prior to its fiscal year end in each year, amounts for sinking funds which are not less than the sum of (a) 1% of the borrowings of, and Provincial advances to, Manitoba Hydro outstanding at the preceding fiscal year end and (b) 4% of the balance of cash and book value of securities in the sinking fund at such date. Interest earned on money and securities in the sinking fund is paid to Manitoba Hydro.
Unfunded Debt
The unfunded debt of the Province as at March 31, 2017 amounted to $2,525.6 million, including $913.6 million of accounts payable, $179.0 million of accrued interest and $1,433.0 million of other accrued charges. This unfunded debt was offset by current assets of the Province in the amount of $2,700.8 million, represented by $607.3 million of March 2017 tax revenue receivables, $289.7 million of other receivables, $9.7 million of interest receivable, $632.2 million of accounts receivable from the Federal and other governments and $1,413.5 million in cash and equivalents, less a valuation allowance of $251.7 million.
Consolidated Funded Borrowings of the Manitoba Public Sector
The Province supervises all financial activities of the Manitoba public sector. Certain public sector entities issue debt in their own names which is not guaranteed by the Province. Accordingly, not all funding within the public sector is reflected in the Province’s financial statements. The following table sets forth the consolidated funded borrowings of the Manitoba public sector as at March 31 for each of the years 2013 through 2017.
36
CONSOLIDATED FUNDED BORROWINGS OF THE MANITOBA PUBLIC SECTOR
| | | | | | | | | | | | | | | | | | | | |
| | | As at March 31, | |
| | | 2013 | | | 2014 | | | 2015 | | | 2016 | | | 2017 | |
| | | (In millions of dollars) | |
Issued for the purpose of: | | | | | | | | | | | | | | | | | | | | |
General Government Programs | | $ | 17,068 | | | $ | 17,799 | | | $ | 18,695 | | | $ | 20,252 | | | $ | 21,892 | |
Less Sinking Funds | | | (2,240) | | | | (2,078) | | | | (1,916) | | | | (1,751) | | | | (1,622) | |
| | | | | | | | | | | | | | | | | | | | |
Net General Government Programs | | | 14,828 | | | | 15,720 | | | | 16,779 | | | | 18,501 | | | | 20,270 | |
| | | | | | | | | | | | | | | | | | | | |
Manitoba Hydro | | | 9,941 | | | | 11,011 | | | | 12,719 | | | | 14,609 | | | | 16,494 | |
Less Sinking Funds | | | (332) | | | | (110) | | | | (115) | | | | — | | | | — | |
| | | | | | | | | | | | | | | | | | | | |
Net Manitoba Hydro | | | 9,609 | | | | 10,900 | | | | 12,605 | | | | 14,609 | | | | 16,494 | |
| | | | | | | | | | | | | | | | | | | | |
Other Crown Organizations, Public Sector Entities and Loans Payable | | | 5,261 | | | | 5,615 | | | | 6,096 | | | | 6,907 | | | | 7,294 | |
Less Sinking Funds | | | (264) | | | | (195) | | | | (126) | | | | (53) | | | | (66) | |
| | | | | | | | | | | | | | | | | | | | |
Net Other Crown Organizations, Public Sector Entities and Loans Payable | | | 4,998 | | | | 5,421 | | | | 5,970 | | | | 6,854 | | | | 7,228 | |
| | | | | | | | | | | | | | | | | | | | |
Net Public Sector Debt | | $ | 29,435 | | | $ | 32,042 | | | $ | 35,353 | | | $ | 39,964 | | | $ | 43,992 | |
| | | | | | | | | | | | | | | | | | | | |
Consisting of: | | | | | | | | | | | | | | | | | | | | |
Direct Debt of the Province (1) | | $ | 28,630 | | | $ | 30,502 | | | $ | 33,483 | | | $ | 37,112 | | | $ | 40,771 | |
Guaranteed Debt of the Province (1) | | | 166 | | | | 265 | | | | 172 | | | | 110 | | | | 91 | |
Non-Guaranteed Debt of Crown Organizations, Other Public Sector Entities and Loans Payable | | | 3,474 | | | | 3,658 | | | | 3,855 | | | | 4,545 | | | | 4,818 | |
| | | | | | | | | | | | | | | | | | | | |
Total Public Sector Debt | | | 32,270 | | | | 34,424 | | | | 37,510 | | | | 41,768 | | | | 45,680 | |
Less: Accumulated Sinking Funds | | | (2,836) | | | | (2,384) | | | | (2,156) | | | | (1,804) | | | | (1,688) | |
| | | | | | | | | | | | | | | | | | | | |
Net Public Sector Debt | | $ | 29,435 | | | $ | 32,042 | | | $ | 35,353 | | | $ | 39,964 | | | $ | 43,992 | |
| | | | | | | | | | | | | | | | | | | | |
| (1) | U.S. and other foreign currency borrowings included in the direct debt of the Province and the guaranteed debt of the Province are stated at the Canadian dollar equivalent using the exchange rates in effect on March 31 each year. |
37
Selected Borrowings Information
The following table sets forth certain information as to the funded borrowings of the Manitoba Public Sector and of the Province, as well as borrowings issued for General Government programs, including capital assets and pension funding (all net of accumulated sinking funds) as at March 31 for the years 2013 through 2017, including per capita data based upon population at July 1 of the preceding calendar year.
PUBLIC SECTOR BORROWINGS INFORMATION
| | | | | | | | | | | | | | | | | | | | |
| | | As at March 31, | |
| | | 2013 | | | 2014 | | | 2015 | | | 2016 | | | 2017 | |
Total Net Consolidated Funded Borrowings of the Manitoba Public Sector (in millions) | | $ | 29,435 | | | $ | 32,042 | | | $ | 35,353 | | | $ | 39,964 | | | $ | 43,992 | |
Per Capita | | | 23,548 | | | | 25,309 | | | | 27,598 | | | | 30,836 | | | | 33,378 | |
As a Percent of Primary Household Income | | | 76.3% | | | | 79.8% | | | | 85.4% | | | | 93.5% | | | | 99.3% | |
As a Percent of Nominal Gross Domestic Product | | | 49.2% | | | | 51.7% | | | | 55.1% | | | | 60.8% | | | | 65.4% | |
Total Net Direct Funded Borrowings of the Province (in millions) | | $ | 27,865 | | | $ | 30,339 | | | $ | 33,497 | | | $ | 37,863 | | | | 41,741 | |
Per Capita | | | 22,292 | | | | 23,964 | | | | 26,149 | | | | 29,216 | | | | 31,670 | |
As a Percent of Primary Household Income | | | 72.2% | | | | 75.6% | | | | 80.9% | | | | 88.6% | | | | 94.2% | |
As a Percent of Nominal Gross Domestic Product | | | 46.6% | | | | 48.9% | | | | 52.2% | | | | 57.6% | | | | 62.0% | |
Net Borrowings Issued for General Government Programs (in millions) | | $ | 14,828 | | | $ | 15,720 | | | $ | 16,777 | | | $ | 18,501 | | | $ | 20,270 | |
Per Capita | | | 11,863 | | | | 12,417 | | | | 13,098 | | | | 14,276 | | | | 15,379 | |
As a Percent of Primary Household Income | | | 38.4% | | | | 39.2% | | | | 40.5% | | | | 43.3% | | | | 45.8% | |
As a Percent of Nominal Gross Domestic Product | | | 24.8% | | | | 25.3% | | | | 26.2% | | | | 28.1% | | | | 30.1% | |
Starting in 2007, the Province has borrowed to fund a portion of its unfunded pension liabilities. These borrowings increase total net funded borrowings. As the proceeds are invested in pension assets, they do not increase Summary Net Debt of the Province.
SUMMARY NET DEBT
| | | | | | | | | | | | | | | | | | | | |
| | | As of March 31, | |
| | | 2013 | | | 2014 | | | 2015 | | | 2016 | | | 2017 | |
| | | (In millions of dollars, unless otherwise indicated) | |
Total Financial Assets (1) | | $ | 10,604 | | | $ | 10,702 | | | $ | 10,224 | | | $ | 10,582 | | | $ | 11,338 | |
| | | | | | | | | | | | | | | | | | | | |
Liabilities: | | | | | | | | | | | | | | | | | | | | |
Borrowings (2) | | | 20,772 | | | | 21,930 | | | | 23,241 | | | | 25,415 | | | | 27,397 | |
Accounts payable, accrued charges, provisions and unearned revenue | | | 3,770 | | | | 3,951 | | | | 4,184 | | | | 4,184 | | | | 4,077 | |
Pension liability | | | 1,828 | | | | 2,038 | | | | 2,245 | | | | 2,354 | | | | 2,557 | |
| | | | | | | | | | | | | | | | | | | | |
Total Liabilities | | | 26,370 | | | | 27,919 | | | | 29,670 | | | | 31,953 | | | | 34,031 | |
| | | | | | | | | | | | | | | | | | | | |
Summary Net Debt | | $ | 15,766 | | | $ | 17,217 | | | $ | 19,446 | | | $ | 21,371 | | | $ | 22,693 | |
| | | | | | | | | | | | | | | | | | | | |
Summary Net Debt as a Percentage of Nominal Gross Domestic Product | | | 26.4% | | | | 27.6% | | | | 30.5% | | | | 32.5% | | | | 33.7% | |
| (1) | Includes cash, accounts receivable, loans and advances, investments, equity in GBEs and other financial assets. |
| (2) | Excludes borrowings incurred for and repayable by Manitoba Hydro. |
38
Pension Liability
The Province participates in various pension plans. The two primary plans in which the Province directly participates are the Civil Service Superannuation Fund (CSSF) and the Teachers’ Retirement Allowances Fund (TRAF). In accordance with the Acts that provide for these plans, the Province is responsible for 50% of pension benefits earned by employees. These plans are joint trusteed plans. The Province’s pension liability reflects its share of the actuarial present values of pension benefits attributed to services rendered by employees and former employees, net of any plan assets which are set aside by the Province in irrevocable trusts.
Other pension plans in which the Province participates include the Members of the Legislative Assembly Plan, the Legislative Assembly Pension Plan, the Judges’ Supplemental Pension Plan and the Winnipeg Child and Family Services Employee Benefits Retirement Plan. The Province is responsible for any excess of accrued pension benefits over pension fund assets for these Plans.
The Province also includes several other pension plans in its pension liability. These other plans include post-secondary education pension plans and public school divisions’ pension plans. Post-secondary education pension plans include the University of Manitoba Pension Plans, the University of Winnipeg Pension Plan and the Brandon University Retirement Plan. Public school divisions’ pension plans include the Winnipeg School Division Pension Fund for Employees Other Than Teachers, Retirement Plan for Non-Teaching Employees of the St. James-Assiniboia School Division and Retirement Plan for Employees of Frontier School Division. The Province is responsible for any excess of accrued pension benefits over pension fund assets for these Plans.
Employees in the health sector are members of the Health Care Employees Pension Plan, a multi-employer defined benefit pension plan established between employees and participating boards. Because the Province does not sponsor this plan, the accrued benefit liability of this Plan is not recognized in the Summary Financial Statements. The annual net benefit plan expense is the amount of required contributions provided for employees’ services rendered during the year. In the year ended March 31, 2017, the Province expensed contributions to this Plan of $166 million (2016 — $151 million). At December 31, 2016, this Plan had an excess of net assets available for benefits over pension obligations of $255 million (December 31, 2015 — $212 million).
As at March 31, 2017, the Province’s total gross pension obligation for all these Plans (except health) was $9,064 million (2016 — $8,760 million) or $2,557 million net of plan assets (2016 — $2,354 million). The components of this obligation are set forth below.
An actuarial valuation and report of the Province’s liability to the CSSF was completed as at December 31, 2015. The report also provided a formula to update this liability on an annual basis. In accordance with this formula, the Province’s actuarial liability to the CSSF has been calculated at $2,961 million on an indexed basis as at March 31, 2017 (2016 — $2,848 million) or at $871 million net of plan assets as at March 31, 2017 (2016 — $827 million).
An actuarial report for TRAF was completed as of January 1, 2015 and provides a formula to update the Province’s pension liability, resulting in a pension liability of $3,933 million on an indexed basis at March 31, 2017 (2016 — $3,796 million) or $1,551 million net of plan assets at March 31, 2017 (2016 — $1,434 million).
An actuarial valuation and report of the Province’s liability to the other pension plans was calculated at $2,170 million on an indexed basis at March 31, 2017 (2016 — $2,116 million) or at $135 million net of plan assets at March 31, 2017 (2016 — $93 million).
The following table summarizes the estimated actuarial pension liability for the Province and Crown organizations excluding GBEs such as Manitoba Hydro. The balances are net of the Pension Assets Fund (described below).
| | | | | | | | |
| | | As at
March 31, | |
| | | 2016 | | | 2017 | |
| | | (In millions of dollars) | |
Civil Service Superannuation Fund | | $ | 827 | | | $ | 871 | |
Teachers’ Retirement Allowances Fund | | | 1,434 | | | | 1,551 | |
Other Pension Plans | | | 93 | | | | 135 | |
| | | | | | | | |
Pension Liability (1) | | $ | 2,354 | | | $ | 2,557 | |
| | | | | | | | |
| (1) | Includes unamortized actuarial gains and losses. |
39
Pension fund assets are held in the Pensions Assets Fund, which includes separately invested trust accounts for CSSF and TRAF.
The Province has from time to time set aside funds to address the Province’s unfunded pension liability. The Province transferred a total of $2.7 billion from the Operating Fund to CSSF and TRAF during the fiscal years from 2009 to 2017 to reduce its unfunded pension liability level.
Manitoba Hydro employees are eligible for pensions under The Civil Service Superannuation Act, which requires Manitoba Hydro to contribute 50% of the pension disbursements made to retired employees. As at March 31, 2017, Manitoba Hydro and its subsidiaries had a net pension liability of $540 million (2016 — $588 million), which consisted of an accrued benefit obligation of $1,712 million (2016 — $1,671 million) and pension assets of $1,172 million (2016 — $1,083 million). These amounts are not reflected in the above totals in respect of the Province’s pension liability.
THE MANITOBA HYDRO-ELECTRIC BOARD
The Manitoba Hydro-Electric Board (Manitoba Hydro) was established in 1949 by an Act of the Legislature of the Province as an agent of the Crown in right of the Province to provide for a supply of electrical power adequate for the needs of Manitoba, and to promote economy and efficiency in the generation, distribution, supply and use of electrical power within Manitoba.
In 1997, amendments were made to The Manitoba Hydro Act to allow wholesale competition and transmission access in the Manitoba electrical market and allow Manitoba Hydro to offer new products and services, create subsidiaries and enter into joint ventures and business alliances. The amendments also provided Manitoba Hydro with explicit authority to build new generation for export.
Manitoba Hydro currently provides electricity to approximately 573,000 customers and natural gas service to approximately 279,000 customers within the Province. In addition, Manitoba Hydro currently has 26 active counterparties for electricity exports in the U.S., Ontario and Saskatchewan.
As at March 31, 2017, Manitoba Hydro’s total generating capability was 5,679 megawatts. Of this generating capability, hydro-electric stations represented 91.8%, thermal-electric stations 8.0% (6.4% natural gas and 1.6% coal) and diesel-electric stations 0.2%. The diesel electric stations serve four isolated communities in northern Manitoba that are too remote to be served from the integrated system.
For the fiscal year ended March 31, 2017, 94.5% of the total energy supply of 38.5 billion kilowatt-hours was provided by self-renewing hydro-electric generation. The portion of total supply provided by thermal generation was 0.1%, by imports 2.8% and by wind purchase 2.6%.
Operations
Net income from consolidated operations for the fiscal year ended March 31, 2017 was $71 million, compared to net income of $49 million in the previous fiscal year. Net income increased $22 million as a result of a $20 million gain on the fair market value sale of property acquired over 75 years ago. On the operating side, revenue grew due to higher dependable export sales volumes, higher opportunity sales resulting from increased volumes due to higher generation, as well as higher domestic electricity revenues resulting from customer growth and rate increase impacts. These increases in revenue were mainly offset by higher finance expense, fuel and power purchased and capital taxes. Manitoba Hydro’s debt/equity ratio was 84:16.
Electricity
As at March 31, 2017, Manitoba Hydro owned and operated 15 hydro-electric generating stations having a total installed electric generating capability of 5,213 megawatts, including five stations with a total capability of 3,936 megawatts located on the Nelson River. Manitoba Hydro also owned and operated two thermal-electric generating stations having a total installed capability of 456 megawatts and four isolated diesel sites having an installed capacity of 10 megawatts.
As at March 31, 2017, the high voltage transmission facilities of Manitoba Hydro consisted of approximately 12,421 circuit kilometers.
40
For purposes of exporting surplus energy, Manitoba Hydro maintains interconnections with power facilities in the Provinces of Saskatchewan and Ontario, and in the States of North Dakota and Minnesota. Manitoba Hydro’s interconnections with Ontario have a firm export transfer capability of 200,000 kilowatts and a firm import transfer capability of 0 kilowatts. The interconnections with Saskatchewan have a firm export transfer capability of 175,000 kilowatts and a firm import transfer capability of 60,000 kilowatts. The interconnections with the United States have a firm export transfer capability of 2,100,000 kilowatts and a firm import transfer capability of 700,000 kilowatts. Additional non-firm import and export transfer capability may be available from time to time on all three interfaces depending on the operating conditions.
During the fiscal year ended March 31, 2017, Manitoba Hydro sold a total of 33.0 billion kilowatt-hours of electricity, representing an increase of 4.1% from the fiscal year ended March 31, 2016. The increase in Manitoba sales volumes was primarily due to customer growth. Extraprovincial sales increased 9.6% primarily due to an increase in dependable fixed and market based volumes as a result of new long-term contracts and higher generation.
Natural Gas
Manitoba Hydro’s subsidiary, Centra Gas, provides natural gas distribution and related energy services to approximately 279,000 customers that are located in nearly 100 communities throughout southern Manitoba. Centra Gas owns a network of transmission (1,937 kilometers) and distribution (8,326 kilometers) mains to meet the natural gas requirements of its customers.
For the year ended March 31, 2017, Centra Gas had total gas deliveries of 70.1 billion cubic feet, an increase of 7.6% from the prior year due to the impact of higher customer usage, colder weather and an increase in total number of customers. These gas deliveries were comprised of 18.5 billion cubic feet to residential customers, 28.3 billion cubic feet to commercial and industrial customers, and 23.3 billion cubic feet of transportation deliveries.
Rate Matters
Manitoba Hydro’s rates for electricity sales within the Province are set on an embedded cost of service basis and are subject to review and approval by The Manitoba Public Utilities Board (the PUB). On April 28, 2016, the PUB approved a 3.36% interim across-the-board rate increase effective August 1, 2016, with the revenues generated being placed into the Bipole III deferred revenue account. The PUB directed Manitoba Hydro to establish this deferral account to assist in offsetting in-service costs of the Bipole III transmission project. On July 31, 2017, the PUB approved an interim rate increase of 3.36% effective August 1, 2017 with the revenues generated being placed into the Bipole III deferred revenue account. The interim rate increase as well as the Manitoba Hydro proposed 7.9% increase on April 1, 2018 will be examined at the upcoming general rate application hearing scheduled to commence in December 2017. Manitoba Hydro’s electricity customers continue to have one of the lowest rate structures in North America.
Centra Gas files quarterly rate applications with the PUB based on the twelve-month forward price for Western Canadian gas supplies, which are designed to pass through to customers the impact of primary gas price changes. Centra Gas also makes periodic rate applications for changes in non-commodity costs and other gas costs. Centra Gas also offers a fixed rate service for primary natural gas supply which allows residential and commercial customers to fix their natural gas rates for terms of up to five years.
41
Statistical Information
The following table sets forth certain statistical information for the last five years.
| | | | | | | | | | | | | | | | | | | | |
| | | Year Ended March 31, | |
| | | 2013 | | | 2014 | | | 2015 | | | 2016 | | | 2017 | |
Electricity | | | | | | | | | | | | | | | | | | | | |
Installed Generating Capability (in megawatts) | | | 5,685 | | | | 5,725 | | | | 5,701 | | | | 5,690 | | | | 5,679 | |
Manitoba Firm Peak Demand (in megawatts) | | | 4,535 | | | | 4,720 | | | | 4,688 | | | | 4,460 | | | | 4,801 | |
Energy Supply (in millions of kilowatt-hours) | | | | | | | | | | | | | | | | | | | | |
Generated | | | 33,244 | | | | 35,406 | | | | 35,059 | | | | 35,004 | | | | 36,448 | |
Purchased (scheduled energy) | | | 2,435 | | | | 2,757 | | | | 2,419 | | | | 1,850 | | | | 2,062 | |
| | | | | | | | | | | | | | | | | | | | |
Total | | | 35,679 | | | | 38,163 | | | | 37,478 | | | | 36,854 | | | | 38,510 | |
| | | | | | | | | | | | | | | | | | | | |
Electric Energy Sales (in millions of kilowatt-hours) | | | | | | | | | | | | | | | | | | | | |
Manitoba | | | 21,477 | | | | 22,338 | | | | 22,458 | | | | 21,654 | | | | 21,960 | |
Extraprovincial (scheduled energy deliveries) | | | 9,087 | | | | 10,537 | | | | 9,811 | | | | 10,281 | | | | 11,271 | |
| | | | | | | | | | | | | | | | | | | | |
Total | | | 30,564 | | | | 32,875 | | | | 32,269 | | | | 31,935 | | | | 33,231 | |
| | | | | | | | | | | | | | | | | | | | |
Revenue from Sale of Power (in thousands of dollars) | | | | | | | | | | | | | | | | | | | | |
Manitoba | | $ | 1,341,011 | | | $ | 1,405,301 | | | $ | 1,424,380 | | | $ | 1,398,765 | | | $ | 1,422,132 | |
Extraprovincial | | | 328,651 | | | | 401,627 | | | | 384,286 | | | | 415,028 | | | | 460,049 | |
| | | | | | | | | | | | | | | | | | | | |
Total | | $ | 1,669,662 | | | $ | 1,806,928 | | | $ | 1,808,666 | | | $ | 1,813,793 | | | $ | 1,882,181 | |
| | | | | | | | | | | | | | | | | | | | |
Number of Customers | | | 548,774 | | | | 555,760 | | | | 561,869 | | | | 567,634 | | | | 573,438 | |
Average Revenue per kilowatt-hour | | | | | | | | | | | | | | | | | | | | |
Manitoba | | | 6.24¢ | | | | 6.29¢ | | | | 6.34¢ | | | | 6.46¢ | | | | 6.48¢ | |
Extraprovincial | | | 3.62¢ | | | | 3.81¢ | | | | 3.92¢ | | | | 4.04¢ | | | | 4.08¢ | |
Average Cost per kilowatt-hour of Electric Energy Sold (excluding finance expense) | | | 3.96¢ | | | | 4.05¢ | | | | 4.05¢ | | | | 4.26¢ | | | | 4.18¢ | |
Natural Gas | | | | | | | | | | | | | | | | | | | | |
Gas Deliveries (in billions of cubic feet) | | | | | | | | | | | | | | | | | | | | |
Residential | | | 21.2 | | | | 23.4 | | | | 21.1 | | | | 17.6 | | | | 18.5 | |
Commercial/Industrial | | | 30.0 | | | | 34.0 | | | | 30.7 | | | | 26.4 | | | | 28.3 | |
Transportation | | | 21.1 | | | | 23.0 | | | | 21.3 | | | | 21.2 | | | | 23.3 | |
| | | | | | | | | | | | | | | | | | | | |
Total | | | 72.3 | | | | 80.4 | | | | 73.1 | | | | 65.2 | | | | 70.1 | |
| | | | | | | | | | | | | | | | | | | | |
Number of Customers | | | 269,786 | | | | 272,228 | | | | 274,817 | | | | 276,858 | | | | 279,268 | |
Revenue from Sale of Natural Gas (in thousands of dollars) | | | | | | | | | | | | | | | | | | | | |
Residential | | $ | 199,210 | | | $ | 238,416 | | | $ | 212,951 | | | $ | 176,619 | | | $ | 172,140 | |
Commercial/Industrial | | | 123,701 | | | | 170,298 | | | | 209,288 | | | | 170,745 | | | | 165,327 | |
Transportation | | | 4,813 | | | | 3,945 | | | | 4,460 | | | | 5,253 | | | | 4,830 | |
Other | | | 1,296 | | | | 2,567 | | | | 2,616 | | | | 2,438 | | | | 2,316 | |
| | | | | | | | | | | | | | | | | | | | |
Total | | $ | 329,020 | | | $ | 415,226 | | | $ | 429,315 | | | $ | 355,055 | | | $ | 344,613 | |
| | | | | | | | | | | | | | | | | | | | |
Note 1: The financial information for the fiscal years 2013 and 2014 was prepared using Canadian Generally Accepted Accounting Standards (CGAAP) and fiscal years 2015 - 2017 were prepared using IFRS.
42
For information with respect to the operating financial results, balance sheet, statement of cash flows, comprehensive income of Manitoba Hydro and statement of changes in equity, see “Tables of Supplementary Information — Table V.”
Construction Program
Manitoba Hydro’s capital program includes expenditures for Major New Generation and Transmission, which provide increased capacity, energy or reliability, as well as expenditures to meet electricity and natural gas service replacements and expansions throughout the Province. The following table summarizes Manitoba Hydro’s capital expenditures for improvements and expansion of its facilities during the four-year period ended March 31, 2017, and the estimated capital expenditures during the five-year period ending March 31, 2022. The capital expenditures for fiscal year 2014 were prepared using CGAAP and fiscal years 2015 to 2017 were prepared using IFRS; with estimated capital expenditures for 2018 to 2022 based on a forecast approved by Manitoba Hydro’s Board of Directors in April 2017.
CAPITAL EXPENDITURES
| | | | | | | | | | | | | | | | | | | | | | | | | | | | |
| | | Year Ending March 31, (in thousands of dollars) | |
| | | | | | | | | | | | | | | Estimated | |
| | | 2014 | | | 2015 | | | 2016 | | | 2017 | | | 2018 | | | 2019 | | | 2020-2022 | |
Electricity | | | | | | | | | | | | | | | | | | | | | | | | | | | | |
Major New Generation & Transmission | | $ | 983,713 | | | $ | 1,355,898 | | | $ | 1,775,672 | | | $ | 2,412,321 | | | $ | 2,532,241 | | | $ | 2,219,225 | | | $ | 3,342,135 | |
Generation Upgrades | | | 115,901 | | | | 110,943 | | | | 110,130 | | | | 83,599 | | | | 95,014 | | | | 99,713 | | | | 333,204 | |
Transmission & Stations | | | 102,832 | | | | 143,506 | | | | 115,938 | | | | 126,741 | | | | 132,019 | | | | 133,616 | | | | 418,184 | |
Distribution & Other | | | 251,377 | | | | 269,858 | | | | 307,404 | | | | 319,243 | | | | 298,377 | | | | 289,583 | | | | 789,634 | |
Natural Gas | | | | | | | | | | | | | | | | | | | | | | | | | | | | |
Distribution & Other | | | 40,740 | | | | 41,819 | | | | 55,512 | | | | 69,238 | | | | 41,387 | | | | 44,050 | | | | 125,458 | |
| | | | | | | | | | | | | | | | | | | | | | | | | | | | |
Total | | $ | 1,494,563 | | | $ | 1,922,024 | | | $ | 2,364,656 | | | $ | 3,011,142 | | | $ | 3,099,038 | | | $ | 2,786,187 | | | $ | 5,008,615 | |
| | | | | | | | | | | | | | | | | | | | | | | | | | | | |
Major New Generation and Transmission capital expenditures (including demand side management programs) for the five-year period to March 31, 2022 are projected to be approximately $8.1 billion, including $1.9 billion for the Bipole III Reliability Project and $5.5 billion for the Keeyask Project and the associated new 500 kV interconnection to the U.S., and $0.5 billion for demand side management programs. The Bipole III Transmission Reliability and Keeyask Generation projects are required in order to further improve electrical system reliability, to meet the future energy requirements of the Province, and to take advantage of export market opportunities outside of the Province. This plan also includes a new 500 kV interconnection to the U.S. which facilitates access to that power market and provides increased transfer capability for both export and import purposes. Manitoba Hydro’s development plan includes demand side management (DSM) options targeted to realize electricity savings of 1,232 MW and 4,506 GWh, natural gas savings of 130 million cubic meters, and combined global greenhouse gas emission reductions of 3.3 million tonnes by 2030/31.
Bipole III is a new high voltage direct current (HVDC) transmission project required to improve overall system reliability and dependability, as well as to provide additional capacity for delivery of existing and proposed hydroelectric generation to southern markets. The 1,384 kilometer Bipole III route will originate at the new Keewatinohk Converter Station near Gillam, travel south and west of Lakes Winnipegosis and Manitoba, and terminate at the new Riel Converter Station on the east side of Winnipeg. Construction activities on the project have continued to progress with the Riel and Keewatinohk HVDC converter station buildings being enclosed in September of 2016, and the first converter transformers being installed at both sites, a major project milestone. To date, approximately 97% of all foundations have been installed for the 500 kV HVDC transmission line and approximately 59% of the required towers have been erected. Stringing of the line is 24% complete. The planned in-service date is 2018/19 with a projected total cost of approximately $5.0 billion.
The 695-megawatt Keeyask Generating Station is being developed on the Nelson River approximately 175 km northeast of Thompson in partnership with the Keeyask Cree Nations (KCN) — Tataskweyak Cree Nation, War Lake First Nation, Fox Lake Cree Nation and York Factory First Nation. The Joint Keeyask Development Agreement formalizing the Keeyask Hydropower Limited Partnership (KHLP) between Manitoba Hydro and the KCN was signed in 2009 and provides the KCN with a right to own up to 25 per cent of the partnership. Excavation of the spillway and the powerhouse are complete. Construction of the concrete structures including the spillway and service bay is nearly complete and work continues on the powerhouse and intake structures over the next two years. Construction of the earthworks structures including the north dam and north dyke is nearly complete with work continuing
43
on the central dam structures over the next two years and work on the south dam and south dyke structures beginning next year. The planned in-service date for the first unit is 2021/22 with a projected total cost of $8.7 billion, an increase of $2.2 billion from the previous control budget.
Associated with the Keeyask generating station, the Manitoba-Minnesota Transmission Project (MMTP) is a 213 kilometer 500 kV AC transmission line to be interconnected with the Great Northern Transmission Line (GNTL) at the Canada-US border. The MMTP project requires approval from federal and provincial regulatory authorities prior to construction commencing in 2018. The MMTP will interconnect with the GNTL at the Canada–US border near Roseau Minnesota and the GNTL will run approximately 360 kilometers south east to the new Iron Range 500-230 kV substation to be constructed near Grand Rapids, Minnesota. The planned in-service date for these projects is 2020/21, with a projected total cost of approximately $450 million for the MMTP and $560 million for Manitoba Hydro’s public portion of the GNTL project. Additionally, Manitoba Hydro estimates that it will pay approximately $300 million (2017 present value) in projected scheduling fees associated with the GNTL to Minnesota Power under the Minnesota Power 133 MW Power Purchase Agreement.
Manitoba Hydro remains focused on completing both the Bipole III Reliability Project and the Keeyask Project with minimal delay and the least possible increase in cost.
Sustaining capital expenditures, excluding Major New Generation and Transmission, total $2.7 billion over the five-year forecast period to 2021/22. Manitoba Hydro is investing in the replacement and refurbishment of existing assets to address the degradation and obsolescence of assets installed several decades ago, distribution assets to address increasing load requirements, as well as transmission capacity enhancements to address higher than average load growth and system expansion in certain rural and urban regions of the province. Manitoba Hydro projects that internally generated funds will be sufficient to fund the majority of these sustaining capital expenditures.
44
The following table summarizes the location and net winter capability of Manitoba Hydro’s integrated system existing and potential generating stations.
MANITOBA HYDRO INTEGRATED SYSTEM
EXISTING AND POTENTIAL GENERATING STATIONS
EXISTING GENERATING STATIONS
| | | | | | |
Generating Station | | River | | Net Winter
Capability | |
| | | | | (in megawatts) | |
Jenpeg | | Nelson | | | 91 | |
Kelsey | | Nelson | | | 295 | |
Kettle | | Nelson | | | 1,220 | |
Long Spruce | | Nelson | | | 980 | |
Limestone | | Nelson | | | 1,350 | |
Pine Falls | | Winnipeg | | | 83 | |
Great Falls | | Winnipeg | | | 129 | |
McArthur Falls | | Winnipeg | | | 55 | |
Seven Sisters | | Winnipeg | | | 165 | |
Slave Falls | | Winnipeg | | | 68 | |
Pointe Du Bois | | Winnipeg | | | 75 | |
Grand Rapids | | Saskatchewan | | | 479 | |
Laurie River I and II | | Laurie | | | 10 | |
Wuskwatim | | Burntwood | | | 213 | |
| | | | | | |
Total Hydraulic Capability | | | | | 5,213 | |
Brandon & Selkirk Thermal | | | | | 456 | |
| | | | | | |
Total Integrated System Capability | | | | | 5,669 | |
| | | | | | |
POTENTIAL GENERATING STATIONS (1)
| | | | | | |
| Generating Station | | River | | Net Winter | |
Conawapa | | Nelson | | | 1,485 | |
Gillam Island | | Nelson | | | 1,080 | |
Keeyask (under construction) | | Nelson | | | 695 | |
Birthday Rapids | | Nelson | | | 380 | |
Whitemud | | Nelson | | | 310 | |
Manasan | | Burntwood | | | 270 | |
Red Rock | | Nelson | | | 250 | |
First Rapids | | Burntwood | | | 210 | |
Granville Falls | | Churchill | | | 120 | |
Bonald | | Churchill | | | 110 | |
Notigi | | Burntwood | | | 120 | |
Early Morning | | Burntwood | | | 80 | |
| (1) | Capacity addition to the integrated system excluding impacts on adjacent generating stations. |
Export Power Sales
Manitoba Hydro enters into short-term and long-term power sales on an on-going basis to numerous utilities and markets in the upper mid-west United States and in Canada. Manitoba Hydro monitors the creditworthiness of, and exposures to, export sales customers in order to minimize credit risk.
Manitoba Hydro has a Coordination Agreement with Midcontinent Independent System Operator, Inc. (MISO) which allows Manitoba Hydro to participate in the MISO. The agreement provides Manitoba Hydro with non-discriminatory transmission access to the membership base of MISO. From its headquarters in central Indiana, MISO serves as the regional transmission organization for its transmission-owning members, and with the inclusion of committed operations, controls an interconnected transmission grid encompassing more than 191,000 megawatts of generation capacity and over 65,000 miles of high voltage transmission lines in all or parts of 15 states. This market operates similarly to other trading exchanges where power sales and purchases are transacted directly with the exchange rather than utilities transacting directly with one another. The market offers a broad range of electricity products, thereby providing additional sales opportunities to Manitoba Hydro.
45
In December 2016, Manitoba Hydro became a market participant and transmission service customer of the Southwest Power Pool (SPP) giving MH the ability to enter into physical and virtual energy transactions in the SPP market. The SPP market oversees the bulk electric grid and wholesale power market in 14 states in central US including Minnesota, North Dakota, South Dakota, Iowa and Montana. SPP is responsible for ensuring the reliable supply of power, adequate transmission infrastructure, and competitive wholesale electricity prices for a 546,000-square-mile region including more than 60,000 miles of high-voltage transmission lines.
46
The following table summarizes Manitoba Hydro’s current and future export power contracts.
| | |
| Executed Contracts | | Term |
|
| |
Northern States Power Company: 350 MW Diversity Exchange | | May 1, 2015 – April 30, 2025 |
375 (S)/ 325 (W) MW System Power Sale | | May 1, 2015 – April 30, 2025 |
125 MW System Power Sale | | May 1, 2021 – April 30, 2025 |
75 MW Diversity Exchange | | June 1, 2016 – May 31, 2020 |
1 MW on-peak/0.5MW off-peak Financial Swap | | January 1, 2017 – December 31, 2021 |
| |
Great River Energy: 200 MW Diversity Exchange | | November 1, 2014 – April 30, 2030 |
| |
Minnesota Power: 50 MW System Power Sale | | June 1, 2015 – May 31, 2020 |
3.3 TWh Non-Firm Energy Sale | | May 1, 2011 – April 30, 2022 |
250 MW System Power Sale | | June 1, 2020 – May 31, 2035 |
133 MW Energy Sale | | June 1, 2020 – May 31, 2040 |
50 MW Capacity Sale | | June 1, 2017 – May 31, 2020 |
| |
Minnesota Municipal Power Agency: 60 MW Energy Sale | | May 1, 2017 – May 31, 2022 |
| |
Wisconsin Public Service: 100 MW System Power Sale | | June 1, 2021 – May 31, 2027 |
100 MW Energy Sale | | June 1, 2027 – May 31, 2029 |
108 MW Energy Sale | | June 1, 2021 – May 31, 2023 |
108 MW System Power Sale | | June 1, 2016 – May 31, 2021 |
8 MW Energy Sale | | June 1, 2023 – May 31, 2029 |
308 MW System Power Sale | | TBD – May 31, 2036 |
| |
SaskPower: 25 MW System Power Sale | | November 1, 2015 – May 31, 2022 |
100 MW System Power Sale | | June 1, 2020 – May 31, 2040 |
| |
NextEra Energy: 100 MW Capacity Sale | | June 1, 2016 – May 31, 2018 |
30 MW Capacity Sale | | June 1, 2015 – May 31, 2018 |
| |
AEP Energy Partners: 79/50 MW Capacity Sale* | | June 1, 2016 – May 31, 2020 |
| |
Basin Electric Power Cooperative: 50 MW Capacity Sale | | June 1, 2018 – May 31, 2020 |
50 MW Capacity Sale | | June 1, 2020 – May 31, 2021 |
* the AEP sale is for 79 MW in the 2016/17 and 2017/18 years and reduces to 50 MW for the remainder of the term.
Definitions:
System Power Sale: Annual sales of both Capacity and Firm Energy.
Diversity Exchange: Seasonal swap of Capacity and Firm Energy.
Energy Sale: Long-term energy contracts with customers whereby Manitoba Hydro will offer energy under the contract when it has energy that is surplus to domestic customer and dependable export customer requirements.
Capacity Sale: Zonal resource capacity product sold in the MISO market.
Financial Swap: Contract where parties financially settle the difference between a fixed price and a specified floating price at an agreed upon node.
(S): Summer season.
(W): Winter season.
47
CANADIAN FOREIGN EXCHANGE
Canada maintains a floating exchange rate. Average noon spot exchange rates against the U.S. dollar are shown in the table below for the calendar years 2012 through 2016.
| | | | | | | | | | | | | | | | | | | | |
| | | Average Noon Spot Rates | |
Foreign Currency | | 2012 | | | 2013 | | | 2014 | | | 2015 | | | 2016 | |
| | | (Canadian dollars per unit of foreign currency) | |
United States Dollars (1) | | $ | 0.9996 | | | $ | 1.0299 | | | $ | 1.1045 | | | $ | 1.2787 | | | $ | 1.3248 | |
| (1) | The high and low spot rates for the U.S. dollar expressed in Canadian dollars for the calendar years 2012 through 2016 are as follows: |
| | | | | | | | | | | | | | | | | | | | |
| | | 2012 | | | 2013 | | | 2014 | | | 2015 | | | 2016 | |
High | | $ | 1.0418 | | | $ | 1.1107 | | | $ | 1.2663 | | | $ | 1.4284 | | | $ | 1.4226 | |
Low | | | 0.9710 | | | | 1.0187 | | | | 1.0713 | | | | 1.2139 | | | | 1.2818 | |
Source: Bank of Canada.
At March 31, 2017, the noon spot exchange rate for U.S. dollars as reported by Bank of Canada, expressed in Canadian dollars, was $1.3322.
48
TABLES OF SUPPLEMENTARY INFORMATION
| | | | |
| | | Page | |
I. Summary Financial Statements of the Province | | | | |
| |
— Consolidated Statement of Financial Position | | | 50 | |
| |
— Consolidated Statement of Revenue and Expense | | | 51 | |
| |
— Consolidated Statement of Accumulated Deficit | | | 52 | |
| |
— Consolidated Statement of Cash Flow | | | 53 | |
| |
II. Summary Financial Statements — Government Business Enterprises | | | | |
| |
— Consolidated Operating Results and Financial Position | | | 54 | |
| |
III. Statement of Direct Funded Borrowings of the Province | | | 55 | |
| |
IV. Statement of Securities Guaranteed by the Province | | | 62 | |
| |
V. The Manitoba Hydro-Electric Board Financial Statements | | | | |
| |
— Consolidated Statement of Operations | | | 63 | |
| |
— Consolidated Balance Sheet | | | 64 | |
| |
— Consolidated Statement of Cash Flows | | | 65 | |
| |
— Consolidated Statement of Comprehensive Income | | | 66 | |
| |
— Consolidated Statement of Changes in Equity | | | 66 | |
49
I. SUMMARY FINANCIAL STATEMENTS
CONSOLIDATED STATEMENT OF FINANCIAL POSITION
AS AT MARCH 31, 2017
(with comparative figures for 2016)
| | | | | | | | |
| | | 2016 | | | 2017 | |
| | | Restated | | | | |
| | | (In millions of dollars) | |
FINANCIAL ASSETS | | | | | | | | |
Cash and cash equivalents | | $ | 2,415 | | | $ | 2,783 | |
Temporary investments | | | 194 | | | | 376 | |
Amounts receivable | | | 1,576 | | | | 1,734 | |
Inventories for resale | | | 83 | | | | 67 | |
Portfolio investments | | | 1,567 | | | | 1,461 | |
Loans and advances | | | 1,447 | | | | 1,458 | |
Equity in government business enterprises | | | 3,281 | | | | 3,440 | |
Equity in government business partnerships | | | 19 | | | | 19 | |
| | | | | | | | |
TOTAL FINANCIAL ASSETS | | $ | 10,582 | | | $ | 11,338 | |
| | | | | | | | |
LIABILITIES | | | | | | | | |
Borrowings | | | 25,415 | | | | 27,397 | |
Accounts payable, accrued charges, provisions and unearned revenue | | | 4,184 | | | | 4,077 | |
Pension liability | | | 2,354 | | | | 2,557 | |
| | | | | | | | |
TOTAL LIABILITIES | | | 31,953 | | | | 34,031 | |
| | | | | | | | |
NET DEBT | | | (21,371) | | | | (22,693) | |
| | | | | | | | |
NON-FINANCIAL ASSETS | | | | | | | | |
Inventories held for use | | | 76 | | | | 77 | |
Prepaid expense | | | 59 | | | | 58 | |
Tangible capital assets | | | 12,486 | | | | 13,158 | |
| | | | | | | | |
| | | 12,621 | | | | 13,293 | |
| | | | | | | | |
ACCUMULATED DEFICIT | | $ | (8,750) | | | $ | (9,400) | |
| | | | | | | | |
50
I. SUMMARY FINANCIAL STATEMENTS
CONSOLIDATED STATEMENT OF REVENUE AND EXPENSE
FOR THE YEAR ENDED MARCH 31, 2017
(with comparative figures for 2016)
| | | | | | | | |
| | | 2016 | | | 2017 | |
| | | Restated | | | | |
| | | (In millions of dollars) | |
REVENUE | | | | | | | | |
Income taxes: | | | | | | | | |
Corporation income tax | | $ | 516 | | | $ | 459 | |
Individual income tax | | | 3,261 | | | | 3,499 | |
Other taxes: | | | | | | | | |
Retail sales tax | | | 2,269 | | | | 2,301 | |
Fuel taxes | | | 332 | | | | 336 | |
Levy for health and education | | | 333 | | | | 343 | |
Education property tax | | | 711 | | | | 793 | |
Other taxes | | | 605 | | | | 623 | |
Fees and other revenue | | | 2,269 | | | | 2,383 | |
Federal transfers: | | | | | | | | |
Equalization | | | 1,738 | | | | 1,736 | |
Canada Health and Canada Social Transfers | | | 1,697 | | | | 1,798 | |
Shared cost and other | | | 385 | | | | 594 | |
Net income from government business enterprises | | | 713 | | | | 631 | |
Sinking funds and other investment earnings | | | 225 | | | | 227 | |
| | | | | | | | |
TOTAL REVENUE | | | 15,054 | | | | 15,723 | |
| | | | | | | | |
EXPENSES | | | | | | | | |
Health | | | 6,237 | | | | 6,546 | |
Education | | | 4,138 | | | | 4,237 | |
Families | | | 1,938 | | | | 2,027 | |
Community, Economic and Resource Development | | | 1,423 | | | | 1,429 | |
Justice and Other Expenditures | | | 1,302 | | | | 1,318 | |
Debt Servicing | | | 855 | | | | 930 | |
| | | | | | | | |
TOTAL EXPENSES | | | 15,893 | | | | 16,487 | |
| | | | | | | | |
NET LOSS FOR THE YEAR | | $ | (839) | | | $ | (764) | |
| | | | | | | | |
51
I. SUMMARY FINANCIAL STATEMENTS
CONSOLIDATED STATEMENT OF ACCUMULATED DEFICIT
FOR THE YEAR ENDED MARCH 31, 2017
(with comparative figures for 2016)
| | | | | | | | |
| | | 2016 | | | 2017 | |
| | | Restated | | | | |
| | | (In millions of dollars) | |
Opening accumulated deficit as previously reported | | | $ (7,923) | | | | $ (8,812) | |
Changes in accounting policy (Note 1) | | | 19 | | | | 19 | |
Adjustments to accumulated deficit (Note 2) | | | 36 | | | | 43 | |
| | | | | | | | |
Opening accumulated deficit, as restated | | | (7,868) | | | | (8,750) | |
Other comprehensive income (loss) | | | (43) | | | | 114 | |
Net loss for the year | | | (839) | | | | (764) | |
| | | | | | | | |
Closing accumulated deficit | | | $ (8,750) | | | | $ (9,400) | |
| | | | | | | | |
Note 1:
In previous fiscal years the Province recorded its investment in North Portage Development Corporation (NPDC) as a portfolio investment using the cost method. Effective April 1, 2016 the Province is accounting for its investment in NPDC as a government business partnership. The change in the accounting policy for NPDC decreased the Government’s opening accumulated deficit and net debt by $19 million (2016 - $19 million). There was no impact on the statement of revenue and expenses due to the net results of NPDC during the year.
Note 2:
| | A. | Correction of Deferred Revenue |
During the year it was noted that recognition of certain revenue was incorrectly deferred resulting in an understatement of federal transfers – shared cost and other. The correction of this misstatement has resulted in a decrease in the opening accumulated deficit and net debt of $20 million (2016 - $20 million).
| | B. | Adjustment to Borrowings |
A correction was made to adjust certain borrowings of a controlled entity which should have been eliminated upon consolidation. This has resulted in a decrease in the opening accumulated deficit and net debt of $23 million (2016 - $16 million) and a reduction of $7 million in net loss in 2016.
The combined effect of these adjustments is a decrease in the opening accumulated deficit and net debt of $43 million (2016 - $36 million) and a reduction of $7 million in net loss in 2016.
52
I. SUMMARY FINANCIAL STATEMENTS
CONSOLIDATED STATEMENT OF CASH FLOW
FOR THE YEAR ENDED MARCH 31, 2017
(with comparative figures for 2016)
| | | | | | | | |
| | | 2016 | | | 2017 | |
| | | Restated | | | | |
| | | (In millions of dollars) | |
Cash and cash equivalents provided by (used in) | | | | | | | | |
Operating activities | | | | | | | | |
Net loss for the year | | | $ (839) | | | | $ (764) | |
Changes in non-cash items: | | | | | | | | |
Temporary investments | | | 21 | | | | (182) | |
Amounts receivable | | | 83 | | | | (198) | |
Valuation allowance | | | (20) | | | | 97 | |
Inventories | | | (21) | | | | 15 | |
Prepaids | | | (1) | | | | 1 | |
Accounts payable, accrued charges, provisions and deferrals | | | — | | | | (107) | |
Pension liability | | | 109 | | | | 203 | |
Amortization of foreign currency fluctuation | | | 6 | | | | 5 | |
Amortization of debt discount | | | (62) | | | | (21) | |
Unamortized losses on derivative contracts | | | 11 | | | | 5 | |
Loss on disposal of tangible capital assets | | | 53 | | | | 48 | |
Amortization of tangible capital assets | | | 624 | | | | 669 | |
| | | | | | | | |
| | | (36) | | | | (229) | |
Other comprehensive income (loss) | | | (43) | | | | 114 | |
Changes in equity in GBEs | | | (87) | | | | (159) | |
| | | | | | | | |
Cash provided by operating activities | | | (166) | | | | (274) | |
| | | | | | | | |
Capital Activities | | | | | | | | |
Acquisition of tangible capital assets | | | (1,702) | | | | (1,389) | |
| | | | | | | | |
Cash used in capital activities | | | (1,702) | | | | (1,389) | |
| | | | | | | | |
Investing activities | | | | | | | | |
Investments purchased | | | (2,856) | | | | (3,304) | |
Investments sold or matured | | | 1,035 | | | | 1,386 | |
| | | | | | | | |
Cash used in investing activities | | | (1,821) | | | | (1,918) | |
| | | | | | | | |
Financing activities | | | | | | | | |
Debt issued | | | 6,495 | | | | 6,681 | |
Debt redeemed | | | (2,374) | | | | (2,732) | |
| | | | | | | | |
Cash provided by financing activities | | | 4,121 | | | | 3,949 | |
| | | | | | | | |
Increase in cash and cash equivalents | | | 432 | | | | 368 | |
Cash and cash equivalents, beginning of year | | | 1,983 | | | | 2,415 | |
| | | | | | | | |
Cash and cash equivalents, end of year | | | $ 2,415 | | | $ | 2,783 | |
| | | | | | | | |
53
II. SUMMARY FINANCIAL STATEMENTS — GOVERNMENT BUSINESS ENTERPRISES (1)
CONSOLIDATED OPERATING RESULTS AND FINANCIAL POSITION
FOR THE YEAR ENDED MARCH 31, 2017 (2)
(with comparative figures for 2016)
| | | | | | | | | | | | | | | | | | | | |
| | | Utilities | | | Insurance | | | Finance | | | Total
2017 | | | Total
2016 | |
| | | (In millions of dollars) | |
Changes in Equity | | | | | | | | | | | | | | | | | | | | |
Results of Operations | | | | | | | | | | | | | | | | | | | | |
Revenue from Operations | | $ | 2,344 | | | $ | 1,616 | | | $ | 1,424 | | | $ | 5,384 | | | $ | 5,221 | |
| | | | | | | | | | | | | | | | | | | | |
Expenses: | | | | | | | | | | | | | | | | | | | | |
Operations | | | 1,628 | | | | 1,642 | | | | 827 | | | | 4,097 | | | | 3,876 | |
Debt servicing | | | 645 | | | | — | | | | 11 | | | | 656 | | | | 632 | |
| | | | | | | | | | | | | | | | | | | | |
Total Expenses | | | 2,273 | | | | 1,642 | | | | 838 | | | | 4,753 | | | | 4,508 | |
| | | | | | | | | | | | | | | | | | | | |
Net Income | | | 71 | | | | (26) | | | | 586 | | | | 631 | | | | 713 | |
Other comprehensive income (loss) | | | 67 | | | | 47 | | | | — | | | | 114 | | | | (43) | |
| | | | | | | | | | | | | | | | | | | | |
Total comprehensive income (loss) | | | 138 | | | | 21 | | | | 586 | | | | 745 | | | | 670 | |
Transfers to the Government | | | — | | | | — | | | | (586) | | | | (586) | | | | (583) | |
| | | | | | | | | | | | | | | | | | | | |
Net increase in equity in government business enterprises | | $ | 138 | | | $ | 21 | | | $ | — | | | $ | 159 | | | $ | 87 | |
| | | | | | | | | | | | | | | | | | | | |
| (1) | GBEs consist of the following as at March 31, 2017: |
Utilities:
The Manitoba Hydro-Electric Board
Insurance:
The Deposit Guarantee Corporation of Manitoba
The Manitoba Public Insurance Corporation
The Workers Compensation Board
Finance:
Manitoba Liquor & Lotteries Corporation
| (2) | For enterprises whose fiscal year is prior to March 31, the amounts reflected are as at their fiscal year ends. |
54
III. STATEMENT OF DIRECT FUNDED BORROWINGS OF THE PROVINCE
AS AT MARCH 31, 2017
| | | | | | | | | | | | | | | | | | | | |
Series | | Date of Maturity | | | Year of Issue | | | Coupon
Rate (%) | | | Amount Outstanding | | | Ref | |
| | | | | | | | | | | | (In thousands of dollars) | | | | |
(A) Payable in Canadian Dollars: | | | | | | | | | | | | | | | | | | | | |
Debenture Loans | | | | | | | | | | | | | | | | | | | | |
FX | | | 1-Jun-17 | | | | 2012 | | | | 1.85 | | | | 300,000 | | | | (1) | |
FJ | | | 22-Sep-17 | | | | 2007 | | | | 4.70 | | | | 250,000 | | | | (1) | |
PC | | | 5-Mar-18 | | | | 2007 | | | | 4.25 | | | | 250,000 | | | | (1) | |
GD | | | 5-Sep-18 | | | | 2013 | | | | 1.85 | | | | 300,000 | | | | (1) | |
GQ | | | 21-Nov-19 | | | | 2016 | | | | 1.15 | | | | 700,000 | | | | (1)(3) | |
FP | | | 3-Jun-20 | | | | 2010 | | | | 4.15 | | | | 800,000 | | | | (1) | |
GL | | | 5-Sept-20 | | | | 2015 | | | | 1.60 | | | | 350,000 | | | | (1) | |
GO | | | 5-Sept-21 | | | | 2016 | | | | 1.55 | | | | 900,000 | | | | (1) | |
FV | | | 1-Dec-21 | | | | 2011 | | | | 3.85 | | | | 600,000 | | | | (1) | |
GF | | | 2-Jun-23 | | | | 2013 | | | | 2.55 | | | | 900,000 | | | | (1) | |
GH | | | 2-Jun-24 | | | | 2014 | | | | 3.30 | | | | 900,000 | | | | (1) | |
DT | | | 22-Dec-25 | | | | 1995 | | | | 7.75 | | | | 300,000 | | | | (1)(3) | |
GJ | | | 2-Jun-25 | | | | 2015 | | | | 2.45 | | | | 1,700,000 | | | | (1) | |
GN | | | 2-Jun-26 | | | | 2016 | | | | 2.55 | | | | 1,900,000 | | | | (1) | |
GS | | | 2-Jun-27 | | | | 2017 | | | | 2.60 | | | | 300,000 | | | | (1) | |
CL | | | 5-Mar-31 | | | | 1991 | | | | 10.5 | | | | 599,945 | | | | (1) | |
FA | | | 5-Mar-37 | | | | 2004 | | | | 5.70 | | | | 700,000 | | | | (1) | |
PB | | | 5-Mar-38 | | | | 2007 | | | | 4.60 | | | | 950,000 | | | | (1) | |
FK | | | 5-Mar-40 | | | | 2008 | | | | 4.65 | | | | 800,000 | | | | (1) | |
FR | | | 5-Mar-41 | | | | 2010 | | | | 4.10 | | | | 1,300,000 | | | | (1) | |
FT | | | 5-Mar-42 | | | | 2011 | | | | 4.40 | | | | 400,000 | | | | (1) | |
GA | | | 5-Mar-43 | | | | 2012 | | | | 3.35 | | | | 550,000 | | | | (1) | |
GG | | | 5-Sept-45 | | | | 2013 | | | | 4.05 | | | | 1,500,000 | | | | (1) | |
GK | | | 5-Sept-46 | | | | 2015 | | | | 2.85 | | | | 1,950,000 | | | | (1) | |
GR | | | 5-Sept-48 | | | | 2017 | | | | 3.40 | | | | 600,000 | | | | (1) | |
FN | | | 5-Mar-50 | | | | 2009 | | | | 4.70 | | | | 350,000 | | | | (1) | |
| | | | | | | | | | | | | | | | | | | | |
Total Debenture Loans | | | | | | | | | | | | | | | 20,149,945 | | | | | |
| | | | | | | | | | | | | | | | | | | | |
Medium-Term Notes | | | | | | | | | | | | | | | | | | | | |
C126-MTN | | | 3-Apr-17 | | | | 2012 | | | | Floating | | | | 300,000 | | | | (1) | |
C011-MTN | | | 22-Sep-17 | | | | 1997 | | | | 6.50 | | | | 280,454 | | | | (1) | |
C012-MTN | | | 22-Sep-17 | | | | 1997 | | | | 6.50 | | | | 100,000 | | | | (1) | |
C132-MTN | | | 2-Apr-18 | | | | 2012 | | | | Floating | | | | 404,000 | | | | (1) | |
C023-MTN | | | 15-Nov-18 | | | | 1998 | | | | 5.50 | | | | 250,000 | | | | (1) | |
C084-MTN/RRB | | | 1-Dec-18 | | | | 2006 | | | | 1.738 | | | | 101,262 | | | | (1) | |
C135-MTN | | | 2-Apr-20 | | | | 2013 | | | | Floating | | | | 720,000 | | | | (1) | |
C077-MTN | | | 11-Feb-20 | | | | 2005 | | | | 4.75 | | | | 625,000 | | | | (1) | |
C138–MTN | | | 15-May-20 | | | | 2014 | | | | Floating | | | | 520,000 | | | | (1) | |
C144-MTN | | | 20-Aug-25 | | | | 2015 | | | | STEP | | | | 20,000 | | | | (6) | |
C119-MTN | | | 5-Sep-25 | | | | 2010 | | | | 4.40 | | | | 715,000 | | | | (1) | |
C127-MTN | | | 3-May-27 | | | | 2012 | | | | STEP | | | | 22,000 | | | | (6) | |
C136-MTN | | | 5-Sep-29 | | | | 2013 | | | | 3.25 | | | | 356,000 | | | | (1) | |
C074-MTN | | | 3-Dec-29 | | | | 2004 | | | | STEP | | | | 100,000 | | | | (6) | |
C116-MTN | | | 5-Mar-31 | | | | 2010 | | | | 6.30 | | | | 100,000 | | | | (5) | |
C134-MTN | | | 6-May-31 | | | | 2013 | | | | 3.05 | | | | 25,000 | | | | (1) | |
C049-MTN | | | 26-Jul-32 | | | | 2002 | | | | 4.31 | | | | 50,000 | | | | (1)(5) | |
55
| | | | | | | | | | | | | | | | | | | | |
Series | | Date of Maturity | | | Year of Issue | | | Coupon
Rate (%) | | | Amount Outstanding | | | Ref | |
| | | | | | | | | | | | (In thousands of dollars) | | | | |
C052-MTN | | | 29-Oct-32 | | | | 2002 | | | | 5.975 | | | | 30,000 | | | | (1) | |
C141-MTN | | | 5-Sept-33 | | | | 2014 | | | | 3.75 | | | | 80,000 | | | | (1) | |
C076-MTN | | | 19-Jan-35 | | | | 2005 | | | | STEP | | | | 75,000 | | | | (6) | |
C086-MTN | | | 30-Jun-36 | | | | 2006 | | | | STEP | | | | 50,000 | | | | (6) | |
C087-MTN/RRB | | | 1-Dec-36 | | | | 2006 | | | | 2.00 | | | | 117,065 | | | | (1) | |
C124-MTN | | | 5-Mar-39 | | | | 2011 | | | | 4.25 | | | | 210,000 | | | | (1) | |
C091-MTN | | | 16-Jul-39 | | | | 2007 | | | | STEP | | | | 100,000 | | | | (10) | |
C031-MTN | | | 5-Mar-40 | | | | 2000 | | | | 6.20 | | | | 276,000 | | | | (1) | |
C040-MTN | | | 5-Mar-42 | | | | 2002 | | | | 6.00 | | | | 350,000 | | | | (1) | |
C068-MTN | | | 5-Mar-44 | | | | 2004 | | | | 5.80 | | | | 120,000 | | | | (1) | |
C092-MTN | | | 5-Sept-44 | | | | 2007 | | | | 5.00 | | | | 157,035 | | | | (1) | |
C129-MTN | | | 5-Sept-52 | | | | 2012 | | | | 3.15 | | | | 610,000 | | | | (1) | |
C139-MTN | | | 5-Sept-54 | | | | 2014 | | | | 3.65 | | | | 75,000 | | | | (1) | |
C110-MTN | | | 5-Mar-60 | | | | 2009 | | | | 5.20 | | | | 325,000 | | | | (1) | |
C109-MTN | | | 5-Mar-63 | | | | 2009 | | | | 4.625 | | | | 255,000 | | | | (1) | |
C137-MTN | | | 5-Mar-63 | | | | 2013 | | | | 3.45 | | | | 784,000 | | | | (1) | |
| | | | | | | | | | | | | | | | | | | | |
| | | | | | | | | | | | | | | 8,302,816 | | | | | |
| | | | | | | | | | | | | | | | | | | | |
L004-MTN | | | 22-Sept-17 | | | | 2000 | | | | 6.50 | | | | 25,000 | | | | (1) | |
L003-MTN | | | 15-Nov-18 | | | | 2000 | | | | 5.50 | | | | 75,000 | | | | (1) | |
| | | | | | | | | | | | | | | | | | | | |
| | | | | | | | | | | | | | | 100,000 | | | | | |
| | | | | | | | | | | | | | | | | | | | |
H033 | | | 15-Nov-18 | | | | 2007 | | | | 5.50 | | | | 80,000 | | | | (1) | |
H058 | | | 15-May-20 | | | | 2013 | | | | Floating | | | | 100,000 | | | | (1) | |
H060 | | | 5-Sep-29 | | | | 2014 | | | | 3.25 | | | | 100,000 | | | | (1) | |
H061 | | | 5-Sep-33 | | | | 2014 | | | | 3.75 | | | | 50,000 | | | | (1) | |
| | | | | | | | | | | | | | | | | | | | |
| | | | | | | | | | | | | | | 330,000 | | | | | |
| | | | | | | | | | | | | | | | | | | | |
D147-MTN | | | 15-Nov-18 | | | | 2005 | | | | 5.50 | | | | 50,000 | | | | (1) | |
D152-MTN | | | 15-Nov-18 | | | | 2007 | | | | 5.50 | | | | 45,000 | | | | (1) | |
D150-MTN/RRB | | | 1-Dec-18 | | | | 2006 | | | | 1.738 | | | | 101,262 | | | | (1) | |
D025-MTN | | | 5-Mar-31 | | | | 2000 | | | | 6.30 | | | | 310,000 | | | | (1) | |
D129-MTN | | | 5-Mar-31 | | | | 2005 | | | | STEP | | | | 100,000 | | | | (5) | |
| | | | | | | | | | | | | | | | | | | | |
| | | | | | | | | | | | | | | 606,262 | | | | | |
| | | | | | | | | | | | | | | | | | | | |
Total Medium-Term Notes | | | | | | | | | | | | | | | 9,339,078 | | | | | |
| | | | | | | | | | | | | | | | | | | | |
Canadian Issues Swapped to USD: | | | | | | | | | | | | | | | | | | | | |
CAD$ | | | | | | | | | | | | | | | | | | | | |
GQ | | | 21-Nov-19 | | | | 2016 | | | | 1.15 | | | | (675,760) | | | | | |
| | | | | | | | | | | | | | | | | | | | |
| | | | | | | | | | | | | | | (675,760) | | | | | |
| | | | | | | | | | | | | | | | | | | | |
Foreign Issues Swapped to Canadian Dollars: | | | | | | | | | | | | | | | | | | | | |
| | | | | |
FY | | | 3-Apr-17 | | | | 2012 | | | | N/A | | | | 661,500 | | | | | |
BM | | | 15-Jan-18 | | | | 1988 | | | | N/A | | | | 254,960 | | | | | |
GE | | | 1-Jun-18 | | | | 2013 | | | | N/A | | | | 102,470 | | | | | |
EE | | | 15-Sept-18 | | | | 1998 | | | | N/A | | | | 228,380 | | | | | |
BU | | | 1-Dec-18 | | | | 1988 | | | | N/A | | | | 398,539 | | | | | |
FZ | | | 30-May-19 | | | | 2012 | | | | N/A | | | | 615,750 | | | | | |
CB | | | 15-Jan-20 | | | | 1990 | | | | N/A | | | | 369,400 | | | | | |
CD | | | 1-Apr-20 | | | | 1990 | | | | N/A | | | | 412,815 | | | | | |
GM | | | 30-Nov-20 | | | | 2015 | | | | N/A | | | | 1,334,700 | | | | | |
C150 | | | 19-May-21 | | | | 2016 | | | | N/A | | | | 61,827 | | | | | |
GB | | | 8-Aug-22 | | | | 2012 | | | | N/A | | | | 209,700 | | | | | |
GC | | | 6-Sep-22 | | | | 2012 | | | | N/A | | | | 592,710 | | | | | |
56
| | | | | | | | | | | | | | | | | | | | |
Series | | Date of Maturity | | | Year of Issue | | | Coupon
Rate (%) | | | Amount Outstanding | | | Ref | |
| | | | | | | | | | | | (In thousands of dollars) | | | | |
H059 | | | 13-Sep-23 | | | | 2013 | | | | N/A | | | | 198,185 | | | | | |
GI | | | 14-May-24 | | | | 2014 | | | | N/A | | | | 872,400 | | | | | |
C140 | | | 3-Mar-25 | | | | 2014 | | | | N/A | | | | 367,444 | | | | | |
C145 | | | 9-Jun-26 | | | | 2015 | | | | N/A | | | | 287,071 | | | | | |
GP | | | 22-Jun-26 | | | | 2016 | | | | N/A | | | | 642,750 | | | | | |
C157 | | | 17-Aug-27 | | | | 2017 | | | | N/A | | | | 101,270 | | | | | |
C155 | | | 28-Nov-28 | | | | 2016 | | | | N/A | | | | 185,360 | | | | | |
C113 | | | 29-Mar-30 | | | | 2010 | | | | N/A | | | | 102,923 | | | | | |
C148 | | | 24-Mar-31 | | | | 2016 | | | | N/A | | | | 297,748 | | | | | |
C142 | | | 11-Jun-35 | | | | 2015 | | | | N/A | | | | 43,200 | | | | | |
C146 | | | 11-Dec-35 | | | | 2015 | | | | N/A | | | | 82,993 | | | | | |
C154 | | | 25-Jun-39 | | | | 2016 | | | | N/A | | | | 58,600 | | | | | |
C143 | | | 25-Jun-40 | | | | 2015 | | | | N/A | | | | 680,511 | | | | | |
S002 | | | 31-Oct-40 | | | | 2011 | | | | N/A | | | | 55,864 | | | | | |
C147 | | | 25-Feb-41 | | | | 2016 | | | | N/A | | | | 130,985 | | | | | |
H062 | | | 25-Jun-41 | | | | 2016 | | | | N/A | | | | 71,261 | | | | | |
C151 | | | 25-Jun-41 | | | | 2016 | | | | N/A | | | | 339,110 | | | | | |
H057 | | | 17-Nov-42 | | | | 2012 | | | | N/A | | | | 39,463 | | | | | |
C149 | | | 27-Apr-46 | | | | 2016 | | | | N/A | | | | 58,391 | | | | | |
C152 | | | 8-Aug-46 | | | | 2016 | | | | N/A | | | | 50,838 | | | | | |
C153 | | | 30-Aug-46 | | | | 2016 | | | | N/A | | | | 76,291 | | | | | |
C156 | | | 5-Dec-46 | | | | 2016 | | | | N/A | | | | 61,554 | | | | | |
C158 | | | 25-Feb-47 | | | | 2017 | | | | N/A | | | | 103,748 | | | | | |
C120 | | | 14-Oct-50 | | | | 2010 | | | | N/A | | | | 70,300 | | | | | |
C128 | | | 25-Jun-52 | | | | 2012 | | | | N/A | | | | 64,420 | | | | | |
| | | | | | | | | | | | | | | | | | | | |
| | | | | | | | | | | | | | | 10,285,429 | | | | | |
| | | | | | | | | | | | | | | | | | | | |
Total Canadian Dollars | | | | | | | | | | | | | | | 39,098,691 | | | | | |
| | | | | | | | | | | | | | | | | | | | |
(B) Payable in U.S. Dollars: | | | | | | | | | | | | | | | | | | | | |
FY | | | 3-Apr-17 | | | | 2012 | | | | 1.30 | | | | 661,500 | | | | (1)(2) | |
BM | | | 15-Jan-18 | | | | 1988 | | | | 9.125 | | | | 266,440 | | | | (1)(2) | |
GE | | | 1-Jun-18 | | | | 2013 | | | | 1.125 | | | | 635,350 | | | | (1)(2) | |
EE | | | 15-Sep-18 | | | | 1988 | | | | 9.50 | | | | 266,440 | | | | (1)(2) | |
BU | | | 1-Dec-18 | | | | 1988 | | | | 9.625 | | | | 399,660 | | | | (1)(2) | |
FZ | | | 30-May-19 | | | | 2012 | | | | 1.75 | | | | 799,320 | | | | (1)(2) | |
CB | | | 15-Jan-20 | | | | 1990 | | | | 8.80 | | | | 333,050 | | | | (1)(2) | |
CD | | | 1-Apr-20 | | | | 1990 | | | | 9.25 | | | | 399,660 | | | | (1)(2) | |
GM | | | 30-Nov-20 | | | | 2015 | | | | 2.05 | | | | 1,332,200 | | | | (1)(2) | |
CO | | | 15-Sep-21 | | | | 1991 | | | | 8.875 | | | | 399,660 | | | | (1) | |
GC | | | 06-Sep-22 | | | | 2012 | | | | 2.10 | | | | 799,320 | | | | (1)(2) | |
GI | | | 14-May-24 | | | | 2014 | | | | 3.05 | | | | 1,065,760 | | | | (1)(2) | |
GP | | | 22-Jun-26 | | | | 2016 | | | | 2.125 | | | | 666,100 | | | | (1)(2) | |
| | | | | | | | | | | | | | | | | | | | |
| | | | | | | | | | | | | | | 8,024,460 | | | | | |
| | | | | | | | | | | | | | | | | | | | |
Swapped to Canadian Dollars: | | | | | | | | | | | | | | | | | | | | |
FY | | | 3-Apr-17 | | | | 2012 | | | | N/A | | | | (661,500) | | | | (1)(2) | |
BM | | | 15-Jan-18 | | | | 1988 | | | | N/A | | | | (266,440) | | | | (1)(2) | |
GE | | | 1-Jun-18 | | | | 2013 | | | | N/A | | | | (102,470) | | | | (1)(2) | |
EE | | | 15-Sep-18 | | | | 1988 | | | | N/A | | | | (266,440) | | | | (1)(2) | |
57
| | | | | | | | | | | | | | | | | | | | |
Series | | Date of Maturity | | | Year of Issue | | | Coupon
Rate (%) | | | Amount Outstanding | | | Ref | |
| | | | | | | | | | | | (In thousands of dollars) | | | | |
BU | | | 1-Dec-18 | | | | 1988 | | | | N/A | | | | (399,660) | | | | (1)(2) | |
FZ | | | 30-May-19 | | | | 2012 | | | | N/A | | | | (799,320) | | | | (1)(2) | |
CB | | | 15-Jan-20 | | | | 1990 | | | | N/A | | | | (333,050) | | | | (1)(2) | |
CD | | | 1-Apr-20 | | | | 1990 | | | | N/A | | | | (399,660) | | | | (1)(2) | |
GM | | | 30-Nov-20 | | | | 2015 | | | | N/A | | | | (1,332,200) | | | | (1)(2) | |
GC | | | 6-Sep-22 | | | | 2012 | | | | N/A | | | | (799,320) | | | | (1)(2) | |
GI | | | 14-May-24 | | | | 2014 | | | | N/A | | | | (1,065,760) | | | | (1)(2) | |
GP | | | 22-Jun-26 | | | | 2016 | | | | N/A | | | | (666,100) | | | | (1)(2) | |
| | | | | | | | | | | | | | | | | | | | |
| | | | | | | | | | | | | | | (7,091,920) | | | | | |
| | | | | | | | | | | | | | | | | | | | |
Canadian Issues Swapped to USD: | | | | | | | | | | | | | | | | | | | | |
GQ | | | 21-Nov-19 | | | | 2016 | | | | N/A | | | | 666,100 | | | | | |
| | | | | | | | | | | | | | | | | | | | |
| | | | | | | | | | | | | | | 666,100 | | | | | |
| | | | | | | | | | | | | | | | | | | | |
Total US Dollars | | | | | | | | | | | | | | | 1,598,640 | | | | | |
| | | | | | | | | | | | | | | | | | | | |
(A) Payable in Australian Dollars: | | | | | | | | | | | | | | | | | | | | |
GB | | | 8-Aug-22 | | | | 2012 | | | | 4.25 | | | | 203,480 | | | | (1)(2) | |
H059 | | | 13-Sep-23 | | | | 2013 | | | | 5.25 | | | | 203,480 | | | | (1)(2) | |
C140 | | | 3-Mar-25 | | | | 2014 | | | | 4.25 | | | | 381,525 | | | | (1)(2) | |
C145 | | | 9-Jun-26 | | | | 2015 | | | | 3.75 | | | | 295,046 | | | | (1)(2) | |
C157 | | | 17-Aug-27 | | | | 2017 | | | | 3.60 | | | | 103,032 | | | | (1)(2) | |
| | | | | | | | | | | | | | | | | | | | |
| | | | | | | | | | | | | | | 1,186,563 | | | | | |
| | | | | | | | | | | | | | | | | | | | |
Australian Dollar Issues swapped to Canadian Dollars: | | | | | | | | | | | | | | | | | | | | |
GB | | | 8-Aug-22 | | | | 2012 | | | | 4.25 | | | | (203,480) | | | | (1)(2) | |
H059 | | | 13-Sep-23 | | | | 2013 | | | | 5.25 | | | | (203,480) | | | | (1)(2) | |
C140 | | | 3-Mar-25 | | | | 2014 | | | | 4.25 | | | | (381,525) | | | | (1)(2) | |
C145 | | | 9-Jun-26 | | | | 2015 | | | | 3.75 | | | | (295,046) | | | | (1)(2) | |
C157 | | | 17-Aug-27 | | | | 2017 | | | | 3.60 | | | | (103,032) | | | | (1)(2) | |
| | | | | | | | | | | | | | | | | | | | |
| | | | | | | | | | | | | | | (1,186,563) | | | | | |
| | | | | | | | | | | | | | | | | | | | |
Total Australian Dollars | | | | | | | | | | | | | | | 0 | | | | | |
| | | | | | | | | | | | | | | | | | | | |
(B) Payable in Euros: | | | | | | | | | | | | | | | | | | | | |
C113 | | | 29-Mar-30 | | | | 2010 | | | | 4.00 | | | | 106,883 | | | | (1)(2) | |
C148 | | | 24-Mar-31 | | | | 2016 | | | | 1.281 | | | | 287,870 | | | | (1)(2) | |
C142 | | | 11-Jun-35 | | | | 2015 | | | | 1.39 | | | | 45,603 | | | | (1)(2) | |
C146 | | | 11-Dec-35 | | | | 2015 | | | | 1.86 | | | | 82,656 | | | | (1)(2) | |
C154 | | | 25-Jun-39 | | | | 2016 | | | | 2.75 | | | | 57,004 | | | | (1)(2) | |
C143 | | | 25-Jun-40 | | | | 2015 | | | | 1.77 | | | | 669,797 | | | | (1)(2) | |
S002 | | | 31-Oct-40 | | | | 2011 | | | | 3.24 | | | | 57,004 | | | | (1)(2) | |
58
| | | | | | | | | | | | | | | | | | | | |
Series | | Date of Maturity | | | Year of Issue | | | Coupon
Rate (%) | | | Amount Outstanding | | | Ref | |
| | | | | | | | | | | | (In thousands of dollars) | | | | |
C147 | | | 25-Feb-41 | | | | 2016 | | | | 1.74 | | | | 121,134 | | |
| (1)(2)
(1)(2) |
|
H062 | | | 25-Jun-41 | | | | 2016 | | | | 1.95 | | | | 64,130 | | | | (1)(2) | |
C151 | | | 25-Jun-41 | | | | 2016 | | | | 1.50 | | | | 334,899 | | | �� | (1)(2) | |
H057 | | | 17-Nov-42 | | | | 2012 | | | | 2.67 | | | | 44,178 | | | | (1)(2) | |
C152 | | | 8-Aug-46 | | | | 2016 | | | | 1.11 | | | | 49,879 | | | | (1)(2) | |
C158 | | | 23-Feb-47 | | | | 2017 | | | | 2.00 | | | | 106,883 | | | | (1)(2) | |
C120 | | | 14-Oct-50 | | | | 2010 | | | | 3.15 | | | | 71,255 | | | | (1)(2) | |
C128 | | | 25-Jun-52 | | | | 2012 | | | | 2.78 | | | | 71,255 | | | | (1)(2) | |
| | | | | | | | | | | | | | | | | | | | |
| | | | | | | | | | | | | | | 2,170,427 | | | | | |
| | | | | | | | | | | | | | | | | | | | |
Euro Issues swapped to Canadian Dollars: | | | | | | | | | | | | | | | | | | | | |
C113 | | | 29-Mar-30 | | | | 2010 | | | | 4.00 | | | | (106,883) | | | | (1)(2) | |
C148 | | | 24-Mar-31 | | | | 2016 | | | | 1.281 | | | | (287,870) | | | | (1)(2) | |
C142 | | | 11-Jun-35 | | | | 2015 | | | | 1.39 | | | | (45,603) | | | | (1)(2) | |
C146 | | | 11-Dec-35 | | | | 2015 | | | | 1.86 | | | | (82,656) | | | | (1)(2) | |
C154 | | | 25-Jun-39 | | | | 2016 | | | | 2.75 | | | | (57,004) | | | | (1)(2) | |
C143 | | | 25-Jun-40 | | | | 2015 | | | | 1.77 | | | | (669,797) | | | | (1)(2) | |
S002 | | | 31-Oct-40 | | | | 2011 | | | | 3.24 | | | | (57,004) | | | | (1)(2) | |
C147 | | | 25-Feb-41 | | | | 2016 | | | | 1.74 | | | | (121,134) | | | | (1)(2) | |
H062 | | | 25-Jun-41 | | | | 2016 | | | | 1.95 | | | | (64,130) | | | | (1)(2) | |
C151 | | | 25-Jun-41 | | | | 2016 | | | | 1.50 | | | | (334,899) | | | | (1)(2) | |
H057 | | | 17-Nov-42 | | | | 2012 | | | | 2.67 | | | | (44,178) | | | | (1)(2) | |
C152 | | | 8-Aug-46 | | | | 2016 | | | | 1.11 | | | | (49,879) | | | | (1)(2) | |
C158 | | | 23-Feb-47 | | | | 2017 | | | | 2.00 | | | | (106,883) | | | | (1)(2) | |
C120 | | | 14-Oct-50 | | | | 2010 | | | | 3.15 | | | | (71,255) | | | | (1)(2) | |
C128 | | | 25-Jun-52 | | | | 2012 | | | | 2.78 | | | | (71,255) | | | | (1)(2) | |
| | | | | | | | | | | | | | | | | | | | |
| | | | | | | | | | | | | | | (2,170,427) | | | | | |
| | | | | | | | | | | | | | | | | | | | |
Total Euros | | | | | | | | | | | | | | | 0 | | | | | |
| | | | | | | | | | | | | | | | | | | | |
(C) Payable in Hong Kong Dollars: | | | | | | | | | | | | | | | | | | | | |
C150 | | | 19-May-21 | | | | 2016 | | | | 1.78 | | | | 62,567 | | | | (1)(2) | |
C155 | | | 28-Nov-28 | | | | 2016 | | | | 2.57 | | | | 183,416 | | | | (1)(2) | |
| | | | | | | | | | | | | | | | | | | | |
| | | | | | | | | | | | | | | 245,983 | | | | | |
| | | | | | | | | | | | | | | | | | | | |
Hong Kong Dollar Issues swapped to Canadian Dollars: | | | | | | | | | | | | | | | | | | | | |
C150 | | | 19-May-21 | | | | 2016 | | | | 1.78 | | | | (62,567) | | | | (1)(2) | |
C155 | | | 28-Nov-28 | | | | 2016 | | | | 2.57 | | | | (183,416) | | | | (1)(2) | |
| | | | | | | | | | | | | | | | | | | | |
59
| | | | | | | | | | | | | | | | | | | | |
Series | | Date of Maturity | | | Year of Issue | | | Coupon
Rate (%) | | | Amount Outstanding | | | Ref | |
| | | | | | | | | | | | (In thousands of dollars) | | | | |
| | | | | | | | | | | | | | | (245,983) | | | | | |
| | | | | | | | | | | | | | | | | | | | |
Total Hong Kong Dollars | | | | | | | | | | | | | | | 0 | | | | | |
| | | | | | | | | | | | | | | | | | | | |
(D) Payable in Japanese Yen: | | | | | | | | | | | | | | | | | | | | |
C149 | | | 27-Apr-46 | | | | 2016 | | | | 0.80 | | | | 59,800 | | | | (1)(2) | |
C153 | | | 30-Aug-46 | | | | 2016 | | | | 0.70 | | | | 71,760 | | | | (1)(2) | |
C156 | | | 5-Dec-46 | | | | 2016 | | | | 0.70 | | | | 59,800 | | | | (1)(2) | |
| | | | | | | | | | | | | | | | | | | | |
| | | | | | | | | | | | | | | 191,360 | | | | | |
| | | | | | | | | | | | | | | | | | | | |
Japanese Yen Issues swapped to Canadian Dollars: | | | | | | | | | | | | | | | | | | | | |
C149 | | | 27-Apr-46 | | | | 2016 | | | | 0.80 | | | | (59,800) | | | | (1)(2) | |
C153 | | | 30-Aug-46 | | | | 2016 | | | | 0.70 | | | | (71,760) | | | | (1)(2) | |
C156 | | | 5-Dec-46 | | | | 2016 | | | | 0.70 | | | | (59,800) | | | | (1)(2) | |
| | | | | | | | | | | | | | | | | | | | |
| | | | | | | | | | | | | | | (191,360) | | | | | |
| | | | | | | | | | | | | | | | | | | | |
Total Japanese Yen | | | | | | | | | | | | | | | 0 | | | | | |
| | | | | | | | | | | | | | | | | | | | |
Builder Bonds (Payable in Canadian Dollars) | | | | | | | | | | | | | | | | | | | | |
| | | | | |
BB # 13 | | | 15-Jun-17 | | | | 2012 | | | | Floating | | | | 12,581 | | | | (6) | |
| | | 15-Jun-17 | | | | 2012 | | | | Fixed | | | | 275 | | | | (1) | |
| | | 15-Jun-17 | | | | 2012 | | | | Fixed | | | | 918 | | | | (1) | |
BB # 14 | | | 15-Jun-19 | | | | 2014 | | | | Floating | | | | 7,161 | | | | (6) | |
| | | 15-Jun-17 | | | | 2014 | | | | Fixed | | | | 3,989 | | | | (1) | |
| | | 15-Jun-19 | | | | 2014 | | | | Fixed | | | | 1,353 | | | | (1) | |
| | | 15-Jun-19 | | | | 2014 | | | | Fixed | | | | 471 | | | | (1) | |
BB # 15 | | | 15-Jun-20 | | | | 2015 | | | | Floating | | | | 2,825 | | | | (6) | |
| | | 15-Jun-18 | | | | 2015 | | | | Fixed | | | | 3,495 | | | | (1) | |
| | | 15-Jun-20 | | | | 2015 | | | | Fixed | | | | 453 | | | | (1) | |
| | | 15-Jun-20 | | | | 2015 | | | | Fixed | | | | 90 | | | | (1) | |
| | | | | | | | | | | | | | | | | | | | |
| | | | | | | | | | | | | | | 33,612 | | | | | |
| | | | | | | | | | | | | | | | | | | | |
Total Bonds and Debentures | | | | | | | | | | | | | | | 40,730,943 | | | | | |
| | | | | | | | | | | | | | | | | | | | |
Canada Pension Plan (Payable in Canadian Dollars) | | | | | | | | | | | | | | | | | | | | |
CPP237 | | | 1-May-19 | | | | 1999 | | | | 5.67 | | | | 14,639 | | | | (9) | |
CPPIB-001-MTN | | | 7-Aug-37 | | | | 2007 | | | | 5.04 | | | | 81,158 | | | | (1) | |
CPPIB-002-MTN | | | 1-Dec-38 | | | | 2009 | | | | 4.67 | | | | 102,577 | | | | (1) | |
CPPIB-003-MTN | | | 3-Dec-40 | | | | 2010 | | | | 4.38 | | | | 115,790 | | | | (1) | |
60
| | | | | | | | | | | | | | | | | | | | |
Series | | Date of Maturity | | | Year of Issue | | | Coupon
Rate (%) | | | Amount Outstanding | | | Ref | |
| | | | | | | | | | | | (In thousands of dollars) | | | | |
CPPIB-004-MTN | | | 16-Jan-42 | | | | 2012 | | | | 3.42 | | | | 104,459 | | | | (1) | |
CPPIB-005-MTN | | | 3-Jul-42 | | | | 2012 | | | | 3.33 | | | | 73,373 | | | | (1) | |
| | | | | | | | | | | | | | | | | | | | |
| | | | | | | | | | | | | | | 491,996 | | | | | |
| | | | | | | | | | | | | | | | | | | | |
Health Care Facilities | | | | | | | | | | | | | | | | | | | | |
| | | | | | | | | | | | | | | 393,909 | | | | | |
| | | | | | | | | | | | | | | | | | | | |
Province of Manitoba Promissory Notes | | | | | | | | | | | | | | | | | | | | |
| | | | | | | | | | | | | | | 0 | | | | | |
| | | | | | | | | | | | | | | | | | | | |
Immigrant Investor Program (IIP) | | | | | | | | | | | | | | | | | | | | |
| | | 2016-2022 | | | | Various | | | | | | | | 121,469 | | | | | |
| | | | | | | | | | | | | | | | | | | | |
Treasury Bills Payable in Canadian Dollars | | | | | | | | | | | | | | | | | | | | |
| | | 2016 | | | | Various | | | | | | | | 1,625,000 | | | | (7) | |
| | | | | | | | | | | | | | | | | | | | |
Total Borrowings | | | | | | | | | | | | | | | 43,363,317 | | | | | |
| | | | | | | | | | | | | | | | | | | | |
61
IV. STATEMENT OF SECURITIES GUARANTEED BY THE PROVINCE
AS AT MARCH 31, 2017
| | | | | | | | | | | | | | | | | | | | |
Series | | Date of
Maturity | | | Year of Issue | | | Interest
Rate (%) | | | Amount
Outstanding | | | Ref. | |
| | | | | | | | | | | | (In thousands of dollars) | | | | |
BORROWINGS OF SELF-SUPPORTING UTILITIES: | | | | | | | | | | | | | | | | | | | | |
The Manitoba Hydro-Electric Board | | | | | | | | | | | | | | | | | | | | |
Savings Bonds: (Payable in Canadian Dollars) | | | | | | | | | | | | | | | | | | | | |
Series 1 | | | 15-Jun-92 | | | | 1989 | | | | Matured | | | | $ 72 | | | | | |
Series 2 | | | 15-Jun-93 | | | | 1990 | | | | Matured | | | | 15 | | | | | |
Series 3 | | | 15-Jun-96 | | | | 1991 | | | | Matured | | | | 105 | | | | | |
Series 4 | | | 15-Jun-97 | | | | 1992 | | | | Matured | | | | 343 | | | | | |
Series 5 | | | 15-Jun-01 | | | | 1996 | | | | Matured | | | | 435 | | | | | |
Series 6 | | | 15-Jun-02 | | | | 1997 | | | | Matured | | | | 105 | | | | | |
| | | 15-Jun-00 | | | | 1997 | | | | Matured | | | | 133 | | | | | |
| | | 15-Jun-02 | | | | 1997 | | | | Matured | | | | 93 | | | | | |
Series 12 | | | | | | | | | | | | | | | | | | | | |
5 yr floating | | | 15-Jun-18 | | | | 2013 | | | | Floating | | | | 6,041 | | | | (6) | |
5 yr fixed annual | | | 15-Jun-18 | | | | 2013 | | | | 1.75 | | | | 467 | | | | (1) | |
5 yr fixed compound | | | 15-Jun-18 | | | | 2013 | | | | 1.75 | | | | 234 | | | | (1) | |
| | | | | | | | | | | | | | | | | | | | |
| | | | | | | | | | | | | | | 8,043 | | | | | |
| | | | | | | | | | | | | | | | | | | | |
Manitoba Hydro Promissory Notes | | | | | | | | | | | | | | | 0 | | | | | |
City of Winnipeg Hydro Bonds | | | | | | | | | | | | | | | 80,000 | | | | (1) | |
| | | | | | | | | | | | | | | | | | | | |
Total Self-Supporting Guaranteed Debt | | | | | | | | | | | | | | | 88,043 | | | | | |
| | | | | | | | | | | | | | | | | | | | |
Grow Bonds | | | | | | | | | | | | | | | 2,500 | | | | (8) | |
| | | | | | | | | | | | | | | | | | | | |
Total Securities Guaranteed | | | | | | | | | | | | | | | $90,543 | | | | | |
| | | | | | | | | | | | | | | | | | | | |
References:
| 1. | Non-callable/redeemable. |
| 2. | All or part swapped to Canadian dollars. |
| 3. | All or part swapped to U.S. dollars. |
| 5. | Extendable as per terms. |
| 6. | Redeemable at holder’s option, prior to maturity. |
| 7. | 91-day Treasury Bills issued by tender in the amount of $125,000,000 weekly. |
| 8. | The Province has only guaranteed the principal portion of the issue. |
| 9. | Held by and callable at par at the option of the Minister of Finance of Canada on 6 months’ notice, subject to the requirements of the Canada Pension Plan. |
| 10. | Putable at the holder’s option. |
62
V. THE MANITOBA HYDRO — ELECTRIC BOARD
CONSOLIDATED STATEMENT OF OPERATIONS
FOR THE YEAR ENDED MARCH 31,
| | | | | | | | | | | | | | | | | | | | |
| | | 2013 (CGAAP) | | | 2014 (CGAAP) | | | 2015 (IFRS) | | | 2016 (IFRS) | | | 2017 (IFRS) | |
| | | (In millions of dollars) | |
Revenues | | | | | | | | | | | | | | | | | | | | |
Domestic | | | | | | | | | | | | | | | | | | | | |
Electric | | $ | 1,341 | | | $ | 1,405 | | | $ | 1,424 | | | $ | 1,399 | | | $ | 1,419 | |
Gas | | | 329 | | | | 415 | | | | 427 | | | | 353 | | | | 342 | |
Extraprovincial | | | 329 | | | | 402 | | | | 384 | | | | 415 | | | | 460 | |
Other | | | 69 | | | | 70 | | | | 81 | | | | 91 | | | | 106 | |
| | | | | | | | | | | | | | | | | | | | |
| | | 2,068 | | | | 2,292 | | | | 2,316 | | | | 2,258 | | | | 2,327 | |
| | | | | | | | | | | | | | | | | | | | |
Expenses | | | | | | | | | | | | | | | | | | | | |
Cost of gas sold | | | 182 | | | | 252 | | | | 266 | | | | 181 | | | | 183 | |
Finance expense | | | 489 | | | | 470 | | | | 551 | | | | 620 | | | | 645 | |
Operating and administrative | | | 533 | | | | 558 | | | | 614 | | | | 614 | | | | 608 | |
Depreciation and amortization | | | 423 | | | | 442 | | | | 378 | | | | 394 | | | | 402 | |
Water rentals and assessments | | | 118 | | | | 125 | | | | 125 | | | | 126 | | | | 131 | |
Fuel and power purchased | | | 109 | | | | 140 | | | | 129 | | | | 117 | | | | 132 | |
Capital and other taxes | | | 105 | | | | 117 | | | | 115 | | | | 123 | | | | 135 | |
Other expenses | | | 30 | | | | 36 | | | | 77 | | | | 114 | | | | 104 | |
Finance income | | | - | | | | - | | | | (26) | | | | (23) | | | | (17) | |
| | | | | | | | | | | | | | | | | | | | |
| | | 1,989 | | | | 2,140 | | | | 2,229 | | | | 2,266 | | | | 2,323 | |
| | | | | | | | | | | | | | | | | | | | |
Net income (loss) before net movement in regulatory balances | | | 79 | | | | 152 | | | | 87 | | | | (8) | | | | 4 | |
| | | | | | | | | | | | | | | | | | | | |
Net movement in regulatory balances | | | - | | | | - | | | | 38 | | | | 47 | | | | 55 | |
| | | | | | | | | | | | | | | | | | | | |
Net Income | | $ | 79 | | | $ | 152 | | | $ | 125 | | | $ | 39 | | | $ | 59 | |
| | | | | | | | | | | | | | | | | | | | |
| | | | | |
Net income (loss) attributable to: | | | | | | | | | | | | | | | | | | | | |
Manitoba Hydro | | $ | 92 | | | $ | 174 | | | $ | 136 | | | $ | 49 | | | $ | 71 | |
Non-controlling interests | | | (13) | | | | (22) | | | | (11) | | | | (10) | | | | (12) | |
| | | | | | | | | | | | | | | | | | | | |
| | $ | 79 | | | $ | 152 | | | $ | 125 | | | $ | 39 | | | $ | 59 | |
| | | | | | | | | | | | | | | | | | | | |
63
V. THE MANITOBA HYDRO — ELECTRIC BOARD
CONSOLIDATED BALANCE SHEET
AS AT MARCH 31,
| | | | | | | | |
| | | 2016 (IFRS) | | | 2017 (IFRS) | |
| | | (In millions of dollars) | |
| ASSETS | | | | | | | | |
Current Assets | | | | | | | | |
Cash and cash equivalents | | $ | 955 | | | $ | 646 | |
Accounts receivable and accrued revenue | | | 372 | | | | 385 | |
Prepaid expenses | | | 40 | | | | 123 | |
Inventory | | | 117 | | | | 108 | |
| | | | | | | | |
| | | 1,484 | | | | 1,262 | |
| | | | | | | | |
Property, Plant and Equipment | | | 17,208 | | | | 19,757 | |
Non-Current Assets | | | | | | | | |
Sinking fund investments | | | - | | | | - | |
Goodwill | | | 107 | | | | 107 | |
Intangible assets | | | 194 | | | | 293 | |
Loans and other receivables | | | 300 | | | | 353 | |
| | | | | | | | |
| | | 601 | | | | 753 | |
| | | | | | | | |
Total assets before regulatory deferral balance | | | 19,293 | | | | 21,772 | |
Regulatory deferral balance | | | 486 | | | | 566 | |
| | | | | | | | |
| | $ | 19,779 | | | $ | 22,338 | |
| | | | | | | | |
| LIABILITIES AND RETAINED EARNINGS | | | | | | | | |
Current Liabilities | | | | | | | | |
Current portion of long-term debt | | $ | 326 | | | $ | 336 | |
Accounts payable and accrued liabilities | | | 722 | | | | 1,087 | |
Other liabilities | | | 80 | | | | 83 | |
Accrued interest | | | 104 | | | | 114 | |
| | | | | | | | |
| | | 1,232 | | | | 1,620 | |
| | | | | | | | |
Long-Term Debt | | | 14,201 | | | | 16,102 | |
Non-Current Liabilities | | | | | | | | |
Other long-term liabilities | | | 655 | | | | 638 | |
Employee future benefits | | | 859 | | | | 818 | |
Deferred revenue | | | 535 | | | | 653 | |
Provisions | | | 53 | | | | 70 | |
| | | | | | | | |
| | | 2,102 | | | | 2,179 | |
| | | | | | | | |
Total liabilities | | | 17,535 | | | | 19,901 | |
Equity | | | | | | | | |
Retained earnings | | | 2,828 | | | | 2,899 | |
Accumulated other comprehensive loss | | | (776) | | | | (709) | |
| | | | | | | | |
Equity attributable to Manitoba Hydro | | | 2,052 | | | | 2,190 | |
Non-controlling interests | | | 140 | | | | 170 | |
| | | | | | | | |
Total equity | | | 2,192 | | | | 2,360 | |
| | | | | | | | |
Total liabilities and equity before regulatory deferral balance | | | 19,727 | | | | 22,261 | |
Regulatory deferral balance | | | 52 | | | | 77 | |
| | | | | | | | |
| | $ | 19,779 | | | $ | 22,338 | |
| | | | | | | | |
64
V. THE MANITOBA HYDRO — ELECTRIC BOARD
CONSOLIDATED STATEMENT OF CASH FLOWS
FOR THE YEAR ENDED MARCH 31,
| | | | | | | | |
| | | 2016 (IFRS) | | | 2017 (IFRS) | |
| | | (In millions of dollars) | |
Operating Activities | | | | | | | | |
Cash receipts from customers | | $ | 2,331 | | | $ | 2,314 | |
Cash paid to suppliers and employees | | | (988) | | | | (875) | |
Interest received | | | 23 | | | | 17 | |
Interest paid | | | (582) | | | | (584) | |
| | | | | | | | |
| | | 784 | | | | 872 | |
| | | | | | | | |
Investing Activities | | | | | | | | |
Additions to property, plant and equipment | | | (2,322) | | | | (2,924) | |
Additions to intangible assets | | | (32) | | | | (122) | |
Additions to regulatory deferral balances | | | (90) | | | | (88) | |
Contributions received | | | 85 | | | | 134 | |
Cash paid to the City of Winnipeg | | | (16) | | | | (16) | |
Cash paid for mitigation obligations | | | (33) | | | | (21) | |
Cash paid for major development obligations | | | (22) | | | | (11) | |
Other | | | (4) | | | | 12 | |
| | | | | | | | |
| | | (2,434) | | | | (3,036) | |
| | | | | | | | |
Financing Activities | | | | | | | | |
Proceeds from long-term debt | | | 2,165 | | | | 2,186 | |
Retirement of long-term debt | | | (362) | | | | (320) | |
Repayment from /(advances to) external entities | | | 164 | | | | (53) | |
Proceeds from partnership issuances | | | 30 | | | | 42 | |
Sinking fund investment withdrawals | | | 246 | | | | 146 | |
Sinking fund investment purchases | | | (132) | | | | (146) | |
| | | | | | | | |
| | | 2,111 | | | | 1,855 | |
| | | | | | | | |
Net increase in cash and cash equivalents | | | 461 | | | | (309) | |
Cash and cash equivalents, beginning of year | | | 494 | | | | 955 | |
| | | | | | | | |
Cash and cash equivalents, end of year | | $ | 955 | | | $ | 646 | |
| | | | | | | | |
65
V. THE MANITOBA HYDRO — ELECTRIC BOARD
CONSOLIDATED STATEMENT OF COMPREHENSIVE INCOME
FOR THE YEAR ENDED MARCH 31,
| | | | | | | | |
| | | 2016 (IFRS) | | | 2017 (IFRS) | |
| | | (In millions of dollars) | |
Net Income | | $ | 39 | | | $ | 59 | |
Other comprehensive income (loss) | | | | | | | | |
Items that will not be reclassified to income | | | | | | | | |
Net experience gains (losses) on pensions | | | (8) | | | | 94 | |
Items that will be reclassified to income | | | | | | | | |
Cash flow hedges – unrealized foreign exchange losses on debt | | | (47) | | | | (47) | |
Items that have been reclassified to income | | | | | | | | |
Cash flow hedges – realized foreign exchange losses (gains) on debt | | | (1) | | | | 20 | |
| | | | | | | | |
| | | (56) | | | | 67 | |
| | | | | | | | |
Comprehensive Income (Loss) | | $ | (17) | | | $ | 126 | |
| | | | | | | | |
| | |
Comprehensive income (loss) attributable to: | | | | | | | | |
Manitoba Hydro | | $ | (7) | | | $ | 138 | |
Non-controlling interests | | | (10) | | | | (12) | |
| | | | | | | | |
| | $ | (17) | | | $ | 126 | |
| | | | | | | | |
CONSOLIDATED STATEMENT OF CHANGES IN EQUITY
FOR THE YEAR ENDED MARCH 31,
| | | | | | | | | | | | | | | | | | | | |
| | | Retained Earnings | | | Accumulated Other
Comprehensive
Income/(Loss) | | | Manitoba Hydro | | | Non-Controlling Interests | | | Total Equity | |
| | | (In millions of dollars) | |
| | | | | |
Balance as at April 1, 2015 | | $ | 2,779 | | | $ | (720) | | | $ | 2,059 | | | $ | 120 | | | $ | 2,179 | |
| | | | | | | | | | | | | | | | | | | | |
Net income (loss) | | | 49 | | | | - | | | | 49 | | | | (10) | | | | 39 | |
Other comprehensive loss | | | - | | | | (56) | | | | (56) | | | | - | | | | (56) | |
| | | | | | | | | | | | | | | | | | | | |
Comprehensive income (loss) | | | 49 | | | | (56) | | | | (7) | | | | (10) | | | | (17) | |
Change in ownership interest | | | - | | | | - | | | | - | | | | 30 | | | | 30 | |
| | | | | | | | | | | | | | | | | | | | |
Balance as at March 31, 2016 | | | 2,828 | | | | (776) | | | | 2,052 | | | | 140 | | | | 2,192 | |
| | | | | | | | | | | | | | | | | | | | |
Net income (loss) | | | 71 | | | | - | | | | 71 | | | | (12) | | | | 59 | |
Other comprehensive income | | | - | | | | 67 | | | | 67 | | | | - | | | | 67 | |
| | | | | | | | | | | | | | | | | | | | |
Comprehensive income (loss) | | | 71 | | | | 67 | | | | 138 | | | | (12) | | | | 126 | |
Change in ownership interest | | | - | | | | - | | | | - | | | | 42 | | | | 42 | |
| | | | | | | | | | | | | | | | | | | | |
Balance as at March 31, 2017 | | $ | 2,899 | | | $ | (709) | | | $ | 2,190 | | | $ | 170 | | | $ | 2,360 | |
| | | | | | | | | | | | | | | | | | | | |
66