Exhibit 99.1
MANITOBA
2017/18
Second Quarter Report
Honourable Cameron Friesen
Minister of Finance

| | |
SECOND QUARTER REPORT | | APRIL TO SEPTEMBER 2017 |
SUMMARY
Budget 2017 provided the financial overview of the Government Reporting Entity (GRE) which includes core government, government business enterprises (such as Manitoba Hydro and Manitoba Public Insurance), and other reporting entities such as health authorities, social service authorities and school divisions.
Manitoba’s summary budget aligns with the accounting standards set by the Public Sector Accounting Board (PSAB) and fully reflects Generally Accepted Accounting Principles
(GAAP). The financial information in this report is presented in the same format as the budget.
The summary forecast for fiscal year 2017/18 is a net loss of $(827) million, a variance of $13 million from the net loss of $(840) million included in Budget 2017, primarily related to under expenditures in the Manitoba Agricultural Services Corporation partially offset by a decrease in personal income tax revenue.
|
GOVERNMENT REPORTING ENTITY Millions of Dollars |
| | | | | | | | | | | | |
| | | 2017/18 Summary | |
| UNAUDITED | | Forecast | | | Budget | | | Variance | |
Revenue | | | | | | | | | | | | |
Income Taxes | | | 4,007 | | | | 4,194 | | | | (187 | ) |
Other Taxes | | | 4,536 | | | | 4,497 | | | | 39 | |
Fees and Other Revenue | | | 2,361 | | | | 2,307 | | | | 54 | |
Federal Transfers | | | 4,197 | | | | 4,163 | | | | 34 | |
Net Income of Government Business Enterprises | | | 685 | | | | 705 | | | | (20 | ) |
Sinking Funds and Other Earnings | | | 235 | | | | 235 | | | | - | |
Total Revenue | | | 16,021 | | | | 16,101 | | | | (80 | ) |
| | | |
Expenditure | | | | | | | | | | | | |
Health | | | 6,663 | | | | 6,681 | | | | (18 | ) |
Education | | | 4,413 | | | | 4,406 | | | | 7 | |
Families | | | 2,161 | | | | 2,159 | | | | 2 | |
Community, Economic and Resource Development | | | 1,415 | | | | 1,537 | | | | (122 | ) |
Justice and Other Expenditures | | | 1,275 | | | | 1,282 | | | | (7 | ) |
Debt Servicing | | | 981 | | | | 991 | | | | (10 | ) |
Total Expenditure | | | 16,908 | | | | 17,056 | | | | (148 | ) |
In-Year Adjustment/Lapse | | | (60 | ) | | | (115 | ) | | | 55 | |
NET INCOME (LOSS) | | | (827 | ) | | | (840 | ) | | | 13 | |
- 1 -
| | |
SECOND QUARTER REPORT | | APRIL TO SEPTEMBER 2017 |
CORE GOVERNMENT OUTLOOK
The core government outlook provides information on the core government activities – the revenue and expenditure of government departments that are under the direct control of the Legislative Assembly. These revenues and expenditures reflect the day-to-day decisions that ultimately determine the success of the government strategies, plans and programs.
The core government forecast for fiscal year 2017/18 is on budget, with a net loss $(779) million after a $10 million transfer to the fiscal stabilization account.
Revenue is under budget by $(106) primarily as a result of a decline in personal income tax revenue, as experienced by other provinces and linked to changes in federal income taxes announced in 2015. The reduction is partially
offset by increases in Corporate Income Tax and Retail Sales Tax.
Expenditures are projected to be under budget this year primarily in Health including lower costs due to previously announced Health capital project delays.
The 2017/18 Health budget was 1.8% larger than the previous year’s budget. Despite the lower projected spending in 2017/18, Health expenses are projected to be $115 million, or 1.9%, higher than 2016/17 actuals.
Program expenditures throughout government continue to be assessed for opportunities to reduce the growth of core government spending and improve the effectiveness with which government delivers results for Manitobans.
|
CORE GOVERNMENT Millions of Dollars |
| | | | | | | | | | | | |
| | | 2017/18 Core Government | |
| UNAUDITED | | Forecast | | | Estimated1 | | | Variance | |
Revenue | | | | | | | | | | | | |
Income Taxes | | | 4,007 | | | | 4,194 | | | | (187 | ) |
Other Taxes | | | 3,843 | | | | 3,795 | | | | 48 | |
Fees and Other Revenue | | | 612 | | | | 584 | | | | 28 | |
Federal Transfers | | | 3,856 | | | | 3,851 | | | | 5 | |
Net Income of Government Business Enterprises | | | 592 | | | | 592 | | | | - | |
Sinking Funds and Other Earnings | | | - | | | | - | | | | - | |
Total Revenue | | | 12,910 | | | | 13,016 | | | | (106 | ) |
| | | |
Expenditure | | | | | | | | | | | | |
Health | | | 5,997 | | | | 6,105 | | | | (108 | ) |
Education | | | 2,776 | | | | 2,778 | | | | (2 | ) |
Families | | | 2,035 | | | | 2,033 | | | | 2 | |
Community, Economic and Resource Development | | | 1,532 | | | | 1,538 | | | | (6 | ) |
Justice and Other Expenditures | | | 1,134 | | | | 1,126 | | | | 8 | |
Debt Servicing | | | 225 | | | | 240 | | | | (15 | ) |
Total Expenditure | | | 13,699 | | | | 13,820 | | | | (121 | ) |
In-Year Adjustment/Lapse | | | (20 | ) | | | (35 | ) | | | 15 | |
NET RESULT FOR THE YEAR | | | (769 | ) | | | (769 | ) | | | - | |
Transfer to Fiscal Stabilization Account | | | (10 | ) | | | (10 | ) | | | - | |
NET INCOME (LOSS) | | | (779 | ) | | | (779 | ) | | | - | |
| | 1. | Budget figures are adjusted to include allocations from Enabling Appropriations. |
- 2 -
| | |
SECOND QUARTER REPORT | | APRIL TO SEPTEMBER 2017 |
QUARTERLY FINANCIAL RESULTS
The unaudited net result of the core government for the first six months of the fiscal year is income of $20 million.
The six-month revenue variance of $145 million reflects increased retail sales and other activity and an over-payment in income taxes that will be recovered later in the year.
The six-month expenditure variance of $(203) million is primarily the result of timing of expenditures in various departments.
|
CORE GOVERNMENT OPERATING STATEMENT Millions of Dollars |
| | | | | | | | | | | | |
| | | Year-to-Date to September 30 |
| UNAUDITED | | Actual | | Estimated | | Variance |
Revenue | | | | | | | | | | | | |
Income Taxes | | | 2,144 | | | | 2,096 | | | | 48 | |
Other Taxes | | | 2,001 | | | | 1,929 | | | | 72 | |
Fees and Other Revenue | | | 263 | | | | 254 | | | | 9 | |
Federal Transfers | | | 1,900 | | | | 1,893 | | | | 7 | |
Net Income of Government Business Enterprises | | | 328 | | | | 319 | | | | 9 | |
Sinking Funds and Other Earnings | | | - | | | | - | | | | - | |
| | | | | | | | | | | | |
Total Revenue | | | 6,636 | | | | 6,491 | | | | 145 | |
| | | | | | | | | | | | |
| | | |
Expenditure | | | | | | | | | | | | |
Health | | | 3,116 | | | | 3,170 | | | | (54 | ) |
Education | | | 1,296 | | | | 1,380 | | | | (84 | ) |
Families | | | 1,001 | | | | 1,013 | | | | (12 | ) |
Community, Economic and Resource Development | | | 673 | | | | 715 | | | | (42 | ) |
Justice and Other Expenditures | | | 490 | | | | 493 | | | | (3 | ) |
Debt Servicing | | | 40 | | | | 48 | | | | (8 | ) |
| | | | | | | | | | | | |
Total Expenditure | | | 6,616 | | | | 6,819 | | | | (203 | ) |
| | | | | | | | | | | | |
| | | |
Net Result | | | 20 | | | | (328 | ) | | | 348 | |
| | | | | | | | | | | | |
Core government revenue and expenditure details are provided in Appendix I and II on pages 12 and 13, and information on core government capital investment can be found in Appendix III on page 14.
- 3 -
| | |
SECOND QUARTER REPORT | | APRIL TO SEPTEMBER 2017 |
QUARTERLY FINANCIAL RESULTS (Continued)
The six-month net result of $20 million represents a variance of $210 million from the prior year. Revenue is up $362 million year-over-year, offset by an increase in expenditures of $152 million.
The year-over-year increase in revenue is primarily due to increases in Individual
Income Tax, Retail Sales Tax and Federal Transfers.
The year-over-year increase in expenditures mainly reflects increased spending in 2017/18 related to Health, Seniors and Active Living.
|
CORE GOVERNMENT COMPARISON TO PRIOR YEAR Millions of Dollars |
| | | | | | | | | | | | |
| | | Year-to-Date to September 30 |
| UNAUDITED | | 2017/18 | | 2016/17 | | Variance |
| | | |
Revenue | | | 6,636 | | | | 6,274 | | | | 362 | |
| | | |
Expenditure | | | 6,616 | | | | 6,464 | | | | 152 | |
| | | | | | | | | | | | |
| | | |
Net Result | | | 20 | | | | (190 | ) | | | 210 | |
| | | | | | | | | | | | |
| | | | | | | | | | | | |
- 4 -
| | |
SECOND QUARTER REPORT | | APRIL TO SEPTEMBER 2017 |
STRATEGIC INFRASTRUCTURE INVESTMENT
The Manitoba government is committed to spending at least $1 billion on strategic infrastructure in 2017/18 - roads and bridges, flood protection, hospitals, schools, universities and colleges, as well as municipal projects and other infrastructure.
As of the second quarter, strategic infrastructure investment is forecast to exceed $1.4 billion in 2017/18, materially higher than the Manitoba government’s commitment.
It is important to ensure that investment decisions are financially sustainable over the long term and are assessed to provide the best value for money.
In order to ensure value for money while meeting government’s commitments, all capital spending decisions continue to be scrutinized.
|
STRATEGIC INFRASTRUCTURE Millions of Dollars |
| | | | | | | | | | | | |
| | | 2017/18 |
| | | | |
| | | Forecast | | Budget | | Variance |
| | | | |
Roads, Highways, Bridges and Flood Protection | | | | | | | | | | | | |
Highways Infrastructure and Airport Runway Capital | | | 478 | | | | 510 | | | | (32 | ) |
Maintenance and Preservation - Highways | | | 143 | | | | 143 | | | | - | |
Water Related Infrastructure | | | 54 | | | | 60 | | | | (6 | ) |
Transportation Equipment and Aircraft | | | 17 | | | | 19 | | | | (2 | ) |
Maintenance and Preservation - Water | | | 15 | | | | 15 | | | | - | |
| | | | | | | | | | | | |
Subtotal | | | 707 | | | | 747 | | | | (40 | ) |
| | | | | | | | | | | | |
Health, Education and Housing | | | | | | | | | | | | |
Health | | | 263 | | | | 358 | | | | (95 | ) |
Education | | | 123 | | | | 176 | | | | (53 | ) |
Housing | | | 105 | | | | 107 | | | | (2 | ) |
| | | | | | | | | | | | |
Subtotal | | | 491 | | | | 641 | | | | (150 | ) |
| | | | | | | | | | | | |
Other Provincial Infrastructure | | | | | | | | | | | | |
Municipal and Local Infrastructure | | | 209 | | | | 270 | | | | (61 | ) |
Public Service Buildings, Equipment and Technology | | | 61 | | | | 88 | | | | (27 | ) |
Parks, Cottage and Camping | | | 2 | | | | 12 | | | | (10 | ) |
| | | | | | | | | | | | |
Subtotal | | | 272 | | | | 370 | | | | (98 | ) |
| | | | | | | | | | | | |
Total Strategic Infrastructure | | | 1,470 | | | | 1,758 | | | | (288 | ) |
| | | | | | | | | | | | |
- 5 -
| | |
SECOND QUARTER REPORT | | APRIL TO SEPTEMBER 2017 |
BORROWINGS AND SUMMARY NET DEBT
At the end of the second quarter, Manitoba’s borrowing requirement has been revised to $6.5 billion, a reduction of $0.2 billion from Budget 2017, primarily due to reduced requirements for capital and general purpose borrowings.
Borrowings are used to finance capital related projects, and to finance the expenditures of priority government services in excess of generated income.
While these investments underpin and support Manitoba’s economic performance, Manitoba’s Government has committed to reduce the reliance on borrowings to ensure that the use of the debt is within reasonable and predictable limits.
Net debt to GDP is currently forecast at 34.8% compared to 35.7% included in Budget 2017.
| | |
| | CHANGE IN SUMMARY NET DEBT Millions of Dollars |
| | | | | | | | | | |
| | | | | 2017/18 | | 2017/18 |
| | | | Forecast | | Budget |
| | 2016/17 Summary Net Debt | | | 22,693 | | | | 23,111 | |
| | Net Investment in Tangible Capital Assets | | | | | | | | |
| | Core Government | | | 337 | | | | 418 | |
| | Other Reporting Entities | | | 340 | | | | 403 | |
| | | | | | | | | | |
| | | | | 677 | | | | 821 | |
| | | | | | | | | | |
| | Plus: Projected (Income) Loss for the Year | | | | | | | | |
| | Core Government | | | 779 | | | | 779 | |
| | Other Reporting Entities | | | 48 | | | | 61 | |
| | | | | | | | | | |
| | | | | 827 | | | | 840 | |
| | | | | | | | | | |
| | Change in Net Debt | | | 1,504 | | | | 1,661 | |
| | | | | | | | | | |
| | Summary Net Debt | | | 24,197 | | | | 24,772 | |
| | | | | | | | | | |
- 6 -
| | |
SECOND QUARTER REPORT | | APRIL TO SEPTEMBER 2017 |
ECONOMIC REVIEW AND OUTLOOK
Overview
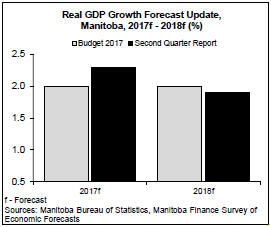
Economic growth was slightly stronger than expected in the first half the year. As a result, the outlook for 2017 has been revised up from Budget 2017. The Canada Summer Games combined with a sharp increase in capital spending on residential and non-residential structures and a record harvest have added to the rising sales in retail and manufacturing.
Growth is expected at 1.9% in 2018, which is slightly lower than this year due to one-time events. However, uncertainty remains elevated with concerns over persistent low commodity prices, rising interest rates and international trade agreements.
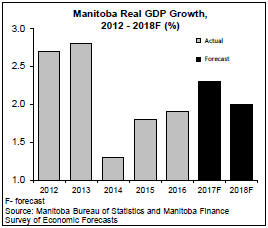
Manitoba’s real Gross Domestic Product (GDP) is forecast to increase by 2.3% in 2017, compared to 2.0% estimated in Budget 2017. Growth in 2018 is lowered to 1.9% from 2.0% in Budget to 2017.
Strengthening business and consumer confidence in the global economy and the corresponding increase in demand conditions, especially in Canada, Japan, Euro area and China, has prompted the International Monetary Fund (IMF) to raise its global economic outlook. Global growth is forecast to increase from 3.2% in 2016, the slowest pace
since the Great Recession, to 3.6% in 2017 and to 3.7% in 2018.
The outlook for the U.S. was lowered from earlier this year, due to weaker than expected growth in the first quarter and the impact of assumed major tax cuts being removed from the IMF outlook in 2017.
A solid pick-up in spending on capital equipment and on consumer durable goods in the second and third quarter of 2017 is offsetting the weakness, resulting in a U.S. growth forecast at 2.2% in 2017 and 2.3% in 2018.
The Canadian economy accelerated in the first half of the year and then moderated in the third quarter, averaging 3.2% quarterly growth in 2017 (annual rate). Net operating surpluses from corporations increased by 25% on a year-to-date basis compared to a 1.9% decline in 2016. Wages and salaries growth has increased as well.
These gains are supporting robust growth in consumer spending and a recovery in business capital investments, especially on machinery and equipment. Energy exports also surged in the second quarter.
Given these strong results, Bank of Canada (BoC) raised the target interest rate by 0.5% this year and raised its Canadian real GDP forecast to 3.1% for 2017, more than doubling the 1.4% growth estimated in 2016.
With the recovery boosting growth in 2017, Canadian growth is expected to moderate in 2018, as domestic demand is expected to return to a balance growth pattern.
The third quarter results indicates some moderation in Canadian growth with exports declining. The higher interest rates could temper interest sensitive spending going forward. Accordingly, the BoC is forecasting a deceleration in growth in 2018 to 2.1%, a full percentage slower than the 2017 forecast.
- 7 -
| | |
SECOND QUARTER REPORT | | APRIL TO SEPTEMBER 2017 |
The current momentum in global demand could provide a positive boost for the outlook in 2018. However, unexpected international trade restraints such as the recent countervailing duties imposed by the U.S. on Canadian aircraft and softwood lumber exports, can quickly and significantly change trade flows between the two countries, affecting businesses and workers on both sides.
The uncertainty on a renegotiated NAFTA also tempers the economic and inflation outlooks over the medium term.
Manitoba Economic Performance
In this Economic Review and Outlook report, annual, quarterly and monthly economic statistics are on a calendar year basis. These statistics are often revised and can change the assessment of economic performance over time.
Manitoba’s key economic indicators point to a noticeable strengthening of the recovery in the first half of 2017. The strength is relatively wide ranging among industrial sectors, has quickly reversed the decline in jobs in 2016, and is lifting incomes.
As with the national situation, preliminary third quarter data shows the momentum stabilizing and could result in a slower pace of growth in the second half of 2017 and into 2018.
Despite the strengthening economy, Manitoba’s inflation rate is relatively low and stable, averaging 1.4% in 2017, up marginally from 1.3% in 2016. Increasing costs for shelter and transportation is being offset by declining prices for food, clothing and footwear products.
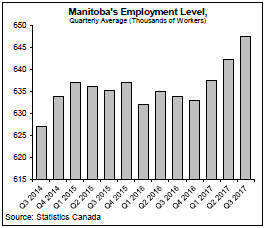
Manitoba’s employment growth accelerated over the last year, adding 13,500 jobs since November 2016. This is a reversal from the 2,600 job losses in 2016. The labour market has added 9,400 new workers over the same period.
With jobs being created faster than new workers entering the labour force, the unemployment rate has dropped to an average of 5.4% in 2017 from 6.1% in 2016, and averaging the second lowest in Canada.
Strong labour market conditions have lifted average weekly earnings growth to 2.4% in 2017, the highest increase among provinces and the strongest growth since 2014.
Compensation of employees increased by 4.0% in the first three quarters of 2017 compared to 2.2% annual growth in 2016.
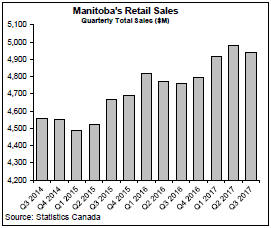
Manitoba’s retail sales soared in the first three quarters of 2017 and set a quarterly record with sales at almost $5 billion in the second quarter.
- 8 -
| | |
SECOND QUARTER REPORT | | APRIL TO SEPTEMBER 2017 |
Gains in retail receipts were largely attributed to grocery stores, building material and garden equipment stores and general merchandise stores. Sales at health and personal care stores and used car dealers continue to slow, dampening the overall strength, and could further moderate retail sales growth in the second half of 2017.
Manufacturing sales picked-up in the third quarter of 2016 and continued to climb through the third quarter of 2017. On a year-to-date basis, sales were up by 5.6% in 2017, compared to 1.3% annual growth in 2016.
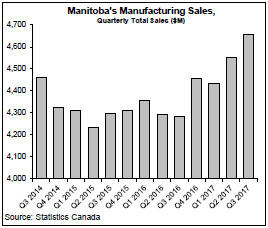
The increase in manufacturing sales were widely distributed among industries, but led by transportation equipment, processed foods, machinery and equipment, and primary metal product sales.
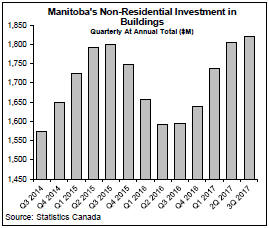
Investment from Manitoba Hydro’s capital program coupled with increased spending on commercial, industrial and institutional buildings is supporting strong growth in capital investment in Manitoba.
Total investment in non-residential building structures was up by 15% in the first nine months of 2017, setting a new record in the third quarter of 2017 (annualized basis), as spending ramped up on several large business properties, including the True North Square in downtown Winnipeg.
With the construction of a new $400 million pea-protein manufacturing facility in Portage La Prairie, relatively high capital spending levels will be sustained in the first half of 2018.
Production at this new facility is expected to begin in 2019 with approximately 150 new jobs.
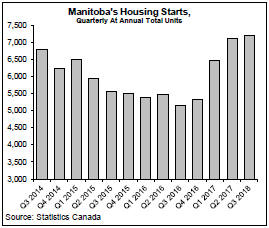
Strong fundamentals and one-time factors has resulted in new home construction activity being pulled forward into the first half of 2017.
The advance has boosted housing starts by 48% in the first nine months of the year, the largest increase among provinces and well above the 8.7% national average increase.
- 9 -
| | |
SECOND QUARTER REPORT | | APRIL TO SEPTEMBER 2017 |
On an annualized basis, almost 7,200 new residential units were started over a twelve-month period ending in the third quarter of 2017, the largest increase since 2013.
As new construction reverts back to market fundamentals, housing starts should show a decline in growth in 2018.
International merchandise exports rebounded from a 1.8% decline in 2016 to a 4.3% increase in the first ten months of 2017. Foreign merchandise sales were led by agricultural products, followed by processed food products, machinery and equipment, electricity and fabricated metal products. Sales have lagged for chemical products, primary metals and mining and oil extraction products.
Merchandise export sales to non-U.S. markets have increased by 18%, bolstered by a 37% increase in sales to China. Led by a reduction in the value of sales of chemical products and oil, exports to the U.S. have continued to decline, down by 2.0% so far in 2017, further to the 3.8% drop in 2016.
Due to current market conditions for base metals and environmental regulations, Vale Canada has placed its Birchtree nickel mine on “care and maintenance” and will be closing its smelter by the end of 2018. Also, Hudbay has indicated that Reed mine is slated for closure in late 2018 and its 777 mine is expected to shut down in 2019 or 2020.
Both mine operators are working on minimizing the employment impact through attrition, assigning workers to other plants or finding other opportunities in the industry.
There are a number of potential mining projects that are under development. Among them, the Lynn Lake Project by Alamos Gold Inc. is currently proceeding through a feasibility study. Klondex Mines Ltd. is ramping up production at its Rice Lake mine. Minnova Corporation is working towards restarting the Puffy Lake mine. In addition, a number of mines currently under “care and maintenance” could return to production, if base metal prices sharply rise.
Preliminary estimates from Statistics Canada indicate higher than expected crop yields and an overall record in the volume of grain and oilseed produced in 2017.
Compared to the 2016 harvest, crop production increased for oats (44.5%), soybeans (40.3%), grain corn (18.3%), and canola (15.3%), while wheat production decreased 8.7% and the barley harvest decreased by 24.5%.
Manitoba hog inventory rose to a record level in early January 2017. International exports of hogs fell by 4.0% while hogs destined for processing increased by 1.1%. Cattle production has been relatively stable for a number of years. Last year, inventory increased by 2.3%, as interprovincial exports decreased by 1.0%.
Timing and the deferral of sales payments, among other factors, propelled Manitoba’s crop receipts by 11.9%, to a record $4.0 billion over a twelve month period ending in the third quarter of 2017. Livestock receipts were down by 4.1%. Total farm cash receipts increased by 5.9%,, surpassing $6.2 billion over four quarters, the highest ever in Manitoba.
- 10 -
| | |
SECOND QUARTER REPORT | | APRIL TO SEPTEMBER 2017 |
| | | | | | | | | | | | | | | | |
Manitoba Outlook at a Glance | | | | | | | | | | | | | | | | |
(per cent change unless noted) | | | | | | | | | | | | | | | | |
| | | 2016 | | | | | 2017f | | | | | 2018f | |
Gross Domestic Product | | | | | | | | | | | | | | | | |
Real | | | 1.9 | | | | | | 2.3 | | | | | | 1.9 | |
Nominal | | | 2.5 | | | | | | 4.3 | | | | | | 3.8 | |
Employment | | | (0.4) | | | | | | 1.5 | | | | | | 0.9 | |
Unemployment Rate (%) | | | 6.1 | | | | | | 5.4 | | | | | | 5.4 | |
Consumer Price Index | | | 1.3 | | | | | | 1.6 | | | | | | 1.9 | |
Population | | | 1.8 | | | | | | 1.5 | | | | | | 1.3 | |
f – Forecast
Sources: Statistics Canada, Manitoba Bureau of Statistics and Manitoba Finance Survey of Economic Forecasts (2017f – 2018f)
- 11 -
| | |
SECOND QUARTER REPORT | | APRIL TO SEPTEMBER 2017 |
Appendix I
|
2017/18 CORE GOVERNMENT REVENUE BY SOURCE Thousands of Dollars |
| | | | | | | | | | | | | | | | | | | | | | | | | | |
| | | Year-to-Date to September 30 | | | | Full Year |
| UNAUDITED | | Actual | | Estimated | | Variance | | | | Forecast | | Budget | | Variance |
Income Taxes | | | | | | | | | | | | | | | | | | | | | | | | | | |
Individual Income Tax | | | 1,794,784 | | | | 1,767,182 | | | | 27,602 | | | | | | 3,438,335 | | | | 3,650,335 | | | | (212,000 | ) |
Corporation Income Tax | | | 349,296 | | | | 328,745 | | | | 20,551 | | | | | | 568,240 | | | | 543,240 | | | | 25,000 | |
| | | | | | | | | | | | | | | | | | | | | | | | | | |
Subtotal: Income Taxes | | | 2,144,080 | | | | 2,095,927 | | | | 48,153 | | | | | | 4,006,575 | | | | 4,193,575 | | | | (187,000 | ) |
| | | | | | | | | | | | | | | | | | | | | | | | | | |
| | | | | | | |
Other Taxes | | | | | | | | | | | | | | | | | | | | | | | | | | |
Corporations Taxes | | | 150,170 | | | | 144,104 | | | | 6,066 | | | | | | 283,915 | | | | 281,915 | | | | 2,000 | |
Fuel Taxes | | | 172,694 | | | | 167,161 | | | | 5,533 | | | | | | 339,683 | | | | 334,683 | | | | 5,000 | |
Land Transfer Tax | | | 52,018 | | | | 40,996 | | | | 11,022 | | | | | | 84,109 | | | | 84,109 | | | | - | |
Levy for Health and Education | | | 238,878 | | | | 230,018 | | | | 8,860 | | | | | | 482,528 | | | | 477,528 | | | | 5,000 | |
Oil and Natural Gas Tax | | | 3,796 | | | | 4,160 | | | | (364 | ) | | | | | 7,456 | | | | 6,658 | | | | 798 | |
Retail Sales Tax | | | 1,253,534 | | | | 1,210,411 | | | | 43,123 | | | | | | 2,392,724 | | | | 2,357,724 | | | | 35,000 | |
Tobacco Tax | | | 128,351 | | | | 130,956 | | | | (2,605 | ) | | | | | 248,612 | | | | 248,612 | | | | - | |
Other Taxes | | | 1,439 | | | | 1,393 | | | | 46 | | | | | | 4,109 | | | | 4,094 | | | | 15 | |
| | | | | | | | | | | | | | | | | | | | | | | | | | |
Subtotal: Other Taxes | | | 2,000,880 | | | | 1,929,199 | | | | 71,681 | | | | | | 3,843,136 | | | | 3,795,323 | | | | 47,813 | |
| | | | | | | | | | | | | | | | | | | | | | | | | | |
| | | | | | | |
Fees and Other Revenue | | | | | | | | | | | | | | | | | | | | | | | | | | |
Fines and Costs and Other Legal | | | 30,210 | | | | 28,687 | | | | 1,523 | | | | | | 57,771 | | | | 53,772 | | | | 3,999 | |
Minerals and Petroleum | | | 7,392 | | | | 6,463 | | | | 929 | | | | | | 12,821 | | | | 10,851 | | | | 1,970 | |
Automobile and Motor Carrier Licences and Fees | | | 85,828 | | | | 73,816 | | | | 12,012 | | | | | | 153,770 | | | | 153,770 | | | | - | |
Parks: Forestry and Other Conservation | | | 11,360 | | | | 13,368 | | | | (2,008 | ) | | | | | 38,354 | | | | 34,030 | | | | 4,324 | |
Water Power Rentals | | | 62,308 | | | | 62,207 | | | | 101 | | | | | | 120,127 | | | | 110,920 | | | | 9,207 | |
Service Fees and Other Miscellaneous Charges | | | 49,518 | | | | 53,094 | | | | (3,576 | ) | | | | | 197,362 | | | | 188,344 | | | | 9,018 | |
Revenue Sharing from SOAs | | | 16,695 | | | | 16,646 | | | | 49 | | | | | | 32,680 | | | | 32,680 | | | | - | |
| | | | | | | | | | | | | | | | | | | | | | | | | | |
Subtotal: Fees and Other Revenue | | | 263,311 | | | | 254,281 | | | | 9,030 | | | | | | 612,885 | | | | 584,367 | | | | 28,518 | |
| | | | | | | | | | | | | | | | | | | | | | | | | | |
| | | | | | | |
Federal Transfers | | | | | | | | | | | | | | | | | | | | | | | | | | |
Equalization | | | 910,197 | | | | 910,199 | | | | (2 | ) | | | | | 1,820,398 | | | | 1,820,400 | | | | (2 | ) |
Canada Health Transfer (CHT) | | | 688,615 | | | | 677,718 | | | | 10,897 | | | | | | 1,366,297 | | | | 1,355,400 | | | | 10,897 | |
Canada Social Transfer (CST) | | | 250,811 | | | | 250,811 | | | | - | | | | | | 501,600 | | | | 501,600 | | | | - | |
Shared Cost and Other Transfers | | | 50,561 | | | | 54,745 | | | | (4,184 | ) | | | | | 167,467 | | | | 173,440 | | | | (5,973 | ) |
| | | | | | | | | | | | | | | | | | | | | | | | | | |
Subtotal: Federal Transfers | | | 1,900,184 | | | | 1,893,473 | | | | 6,711 | | | | | | 3,855,762 | | | | 3,850,840 | | | | 4,922 | |
| | | | | | | | | | | | | | | | | | | | | | | | | | |
| | | | | | | |
Net Income of Government Business Enterprises (GBEs) | | | | | | | | | | | | | | | | | | | | | | | | | | |
Manitoba Liquor and Lotteries Corporation | | | 327,600 | | | | 319,000 | | | | 8,600 | | | | | | 592,000 | | | | 592,000 | | | | - | |
| | | | | | | | | | | | | | | | | | | | | | | | | | |
| | | | | | | | | | | | | | | | | | | | | | | | | | |
Total Revenue | | | 6,636,055 | | | | 6,491,880 | | | | 144,175 | | | | | | 12,910,358 | | | | 13,016,105 | | | | (105,747 | ) |
| | | | | | | | | | | | | | | | | | | | | | | | | | |
- 12 -
| | |
SECOND QUARTER REPORT | | APRIL TO SEPTEMBER 2017 |
Appendix II
|
2017/18 CORE GOVERNMENT EXPENDITURE BY SECTOR/DEPARTMENT Thousands of Dollars |
| | | | | | | | | | | | | | | | | | | | | | | | | | |
| | | Year-to-Date to September 30 | | | | Full Year |
| UNAUDITED | | Actual | | Estimated | | Variance | | | | Forecast | | Budget1 | | Variance |
Health | | | | | | | | | | | | | | | | | | | | | | | | | | |
Health, Seniors and Active Living | | | 3,115,757 | | | | 3,170,259 | | | | (54,502 | ) | | | | | 5,997,102 | | | | 6,104,877 | | | | (107,775 | ) |
| | | | | | | |
Education | | | | | | | | | | | | | | | | | | | | | | | | | | |
Education and Training | | | 1,296,340 | | | | 1,380,383 | | | | (84,043 | ) | | | | | 2,776,117 | | | | 2,778,432 | | | | (2,315 | ) |
| | | | | | | |
Families | | | | | | | | | | | | | | | | | | | | | | | | | | |
Families | | | 1,001,126 | | | | 1,013,262 | | | | (12,136 | ) | | | | | 2,035,357 | | | | 2,033,357 | | | | 2,000 | |
| | | | | | | |
Community, Economic and Resource Development | | | | | | | | | | | | | | | | | | | | | | | | | | |
Agriculture | | | 43,287 | | | | 36,811 | | | | 6,476 | | | | | | 191,506 | | | | 191,506 | | | | - | |
Growth, Enterprise and Trade | | | 36,110 | | | | 41,955 | | | | (5,845 | ) | | | | | 84,338 | | | | 86,198 | | | | (1,860 | ) |
Indigenous and Northern Relations | | | 15,475 | | | | 16,772 | | | | (1,297 | ) | | | | | 31,002 | | | | 31,108 | | | | (106 | ) |
Infrastructure | | | 320,720 | | | | 321,907 | | | | (1,187 | ) | | | | | 664,769 | | | | 666,659 | | | | (1,890 | ) |
Municipal Relations | | | 175,109 | | | | 213,051 | | | | (37,942 | ) | | | | | 408,765 | | | | 410,252 | | | | (1,487 | ) |
Sustainable Development | | | 82,124 | | | | 84,536 | | | | (2,412 | ) | | | | | 151,128 | | | | 152,394 | | | | (1,266 | ) |
| | | | | | | | | | | | | | | | | | | | | | | | | | |
Total Community, Economic and Resource Development | | | 672,825 | | | | 715,032 | | | | (42,207 | ) | | | | | 1,531,508 | | | | 1,538,117 | | | | (6,609 | ) |
| | | | | | | | | | | | | | | | | | | | | | | | | | |
| | | | | | | |
Justice and Other Expenditures | | | | | | | | | | | | | | | | | | | | | | | | | | |
Legislative Assembly | | | 20,945 | | | | 22,373 | | | | (1,428 | ) | | | | | 46,741 | | | | 46,829 | | | | (88 | ) |
Executive Council | | | 3,145 | | | | 2,865 | | | | 280 | | | | | | 4,861 | | | | 4,861 | | | | - | |
Civil Service Commission | | | 10,560 | | | | 11,338 | | | | (778 | ) | | | | | 21,404 | | | | 21,404 | | | | - | |
Employee Pensions and Other Costs | | | (809 | ) | | | 683 | | | | (1,492 | ) | | | | | 22,210 | | | | 22,210 | | | | - | |
Finance | | | 135,160 | | | | 127,964 | | | | 7,196 | | | | | | 264,150 | | | | 266,077 | | | | (1,927 | ) |
Justice | | | 258,563 | | | | 266,259 | | | | (7,696 | ) | | | | | 602,106 | | | | 602,106 | | | | - | |
Sport Culture and Heritage | | | 45,196 | | | | 34,816 | | | | 10,380 | | | | | | 78,519 | | | | 78,658 | | | | (139 | ) |
Enabling Appropriations | | | - | | | | - | | | | - | | | | | | 26,635 | | | | 26,635 | | | | - | |
Other Appropriations | | | 17,546 | | | | 26,458 | | | | (8,912 | ) | | | | | 67,111 | | | | 56,800 | | | | 10,311 | |
| | | | | | | | | | | | | | | | | | | | | | | | | | |
Total Justice and Other Expenditures | | | 490,306 | | | | 492,756 | | | | (2,450 | ) | | | | | 1,133,737 | | | | 1,125,580 | | | | 8,157 | |
| | | | | | | | | | | | | | | | | | | | | | | | | | |
Debt Servicing | | | 39,753 | | | | 47,836 | | | | (8,083 | ) | | | | | 225,000 | | | | 240,000 | | | | (15,000 | ) |
| | | | | | | | | | | | | | | | | | | | | | | | | | |
Total Expenditure | | | 6,616,107 | | | | 6,819,528 | | | | (203,421 | ) | | | | | 13,698,821 | | | | 13,820,363 | | | | (121,542 | ) |
| | | | | | | | | | | | | | | | | | | | | | | | | | |
| 1. | Budget figures are adjusted to include Enabling Appropriations. |
- 13 -
| | |
SECOND QUARTER REPORT | | APRIL TO SEPTEMBER 2017 |
Appendix III
|
2017/18 CORE GOVERNMENT CAPITAL INVESTMENT BY DEPARTMENT Thousands of Dollars |
| | | | | | | | | | | | | | | | | | | | | | | | | | |
| | | Year-to-Date to September 30 | | | | Full Year |
| UNAUDITED | | Actual | | Estimated | | Variance | | | | Forecast | | Budget | | Variance |
| | | | | | | |
Agriculture | | | - | | | | - | | | | - | | | | | | 552 | | | | 552 | | | | - | |
Education and Training | | | - | | | | - | | | | - | | | | | | - | | | | - | | | | - | |
Families | | | - | | | | - | | | | - | | | | | | 202 | | | | 219 | | | | (17 | ) |
Finance | | | 13,501 | | | | 18,136 | | | | (4,635 | ) | | | | | 37,795 | | | | 62,000 | | | | (24,205 | ) |
Health, Seniors and Active Living | | | - | | | | - | | | | - | | | | | | 854 | | | | 1,254 | | | | (400 | ) |
Infrastructure | | | 230,501 | | | | 255,428 | | | | (24,927 | ) | | | | | 547,861 | | | | 589,035 | | | | (41,174 | ) |
Justice | | | 234 | | | | 1,902 | | | | (1,668 | ) | | | | | 2,429 | | | | 2,429 | | | | - | |
Sport, Culture and Heritage | | | - | | | | - | | | | - | | | | | | 120 | | | | 120 | | | | - | |
Sustainable Development | | | 395 | | | | 1,845 | | | | (1,450 | ) | | | | | 5,101 | | | | 15,439 | | | | (10,338 | ) |
Internal Service Adjustments | | | - | | | | - | | | | - | | | | | | 15,450 | | | | 17,450 | | | | (2,000 | ) |
| | | | | | | | | | | | | | | | | | | | | | | | | | |
| | | | | | | |
Total Capital Investment | | | 244,631 | | | | 277,311 | | | | (32,680 | ) | | | | | 610,364 | | | | 688,498 | | | | (78,134 | ) |
| | | | | | | | | | | | | | | | | | | | | | | | | | |
- 14 -