Exhibit 99.1
SUMMARY BUDGET 2018/19

Summary Budget
For the Fiscal Year Ending March 31, 2019 (Millions of Dollars)
With Comparative Data for the Fiscal Year Ending March 31, 2018
| | | | | | | | | | | | | | | | | | | | |
| | | | | | | | | Per Cent Change |
| | | | | | | | | 2018/19 Budget |
| | | 2018/19 | | 2017/18 | | 2017/18 | | from 2017/18 |
| | | Budget | | Forecast | | Budget | | Forecast | | Budget |
| | | | | |
Revenue | | | | | | | | | | | | | | | | | | | | |
| | | | | |
Income Taxes | | | 4,041 | | | | 3,940 | | | | 4,194 | | | | 2.6 | | | | (3.6 | ) |
| | | | | |
Other Taxes | | | 4,800 | | | | 4,620 | | | | 4,497 | | | | 3.9 | | | | 6.7 | |
| | | | | |
Fees and Other Revenue | | | 2,333 | | | | 2,363 | | | | 2,307 | | | | (1.3 | ) | | | 1.1 | |
| | | | | |
Federal Transfers | | | 4,496 | | | | 4,195 | | | | 4,163 | | | | 7.2 | | | | 8.0 | |
| | | | | |
Net Income of Government Business Enterprises | | | 842 | | | | 758 | | | | 705 | | | | 11.1 | | | | 19.4 | |
| | | | | |
Sinking Funds and Other Earnings | | | 275 | | | | 252 | | | | 235 | | | | 9.1 | | | | 17.0 | |
| | | | | | | | | | | | | | | | | | | | |
| | | | | |
Total Revenue | | | 16,787 | | | | 16,128 | | | | 16,101 | | | | 4.1 | | | | 4.3 | |
| | | | | | | | | | | | | | | | | | | | |
| | | | | |
Expenditure | | | | | | | | | | | | | | | | | | | | |
| | | | | |
Health | | | 6,751 | | | | 6,633 | | | | 6,681 | | | | 1.8 | | | | 1.0 | |
| | | | | |
Education | | | 4,453 | | | | 4,405 | | | | 4,410 | | | | 1.1 | | | | 1.0 | |
| | | | | |
Families | | | 2,144 | | | | 2,128 | | | | 2,131 | | | | 0.8 | | | | 0.6 | |
| | | | | |
Community, Economic and Resource Development | | | 1,441 | | | | 1,275 | | | | 1,473 | | | | 13.0 | | | | (2.2 | ) |
| | | | | |
Justice and Other Expenditures | | | 1,600 | | | | 1,399 | | | | 1,370 | | | | 14.4 | | | | 16.8 | |
| | | | | |
Debt Servicing | | | 1,034 | | | | 964 | | | | 991 | | | | 7.3 | | | | 4.3 | |
| | | | | | | | | | | | | | | | | | | | |
| | | | | |
Total Expenditure | | | 17,423 | | | | 16,804 | | | | 17,056 | | | | 3.7 | | | | 2.2 | |
| | | | | | | | | | | | | | | | | | | | |
| | | | | |
Contingency for Writedown | | | – | | | | 50 | | | | – | | | | | | | | | |
| | | | | |
In-Year Adjustments/Lapse | | | (115 | ) | | | – | | | | (115 | ) | | | | | | | | |
| | | | | | | | | | | | | | | | | | | | |
| | | | | |
Net Income (Loss) | | | (521 | ) | | | (726 | ) | | | (840 | ) | | | | | | | | |
| | | | | | | | | | | | | | | | | | | | |
NOTES:
| • | | The 2017/18 forecast and budget have been restated to be consistent with the 2018/19 budget presentation. |
| • | | In-Year Adjustments/Lapse could be an increase in revenue and/or decrease in expenditures. |
| • | | Numbers may not add due to rounding. |
SUMMARY BUDGET 2018/19
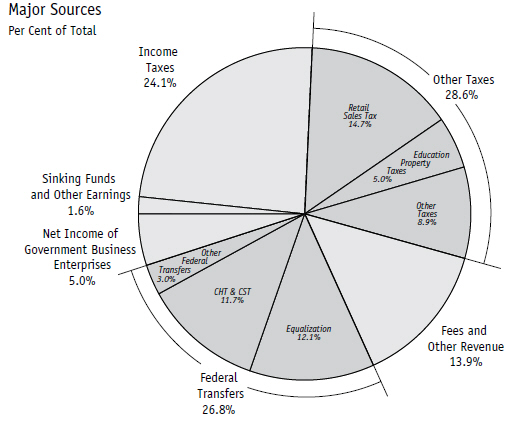
Revenue
Revenue in 2018/19 is projected to increase $686 million, or 4.3%, from the 2017/18 Budget. Income tax revenue is projected to decrease by $153 million, with a $176 million decrease in individual income tax revenue and an increase of $23 million in corporation income tax revenue. Budget 2018 projects a $303 million, or 6.7%, increase in other tax revenue, mainly reflecting growth in retail sales tax and the new carbon tax. Fees and other revenue is projected to increase $26 million, or 1.1%. Federal transfers are projected to increase $333 million, or 8.0%. Net income of Government Business Enterprises is projected to increase $137 million and sinking funds and other earnings is projected to increase by $40 million.
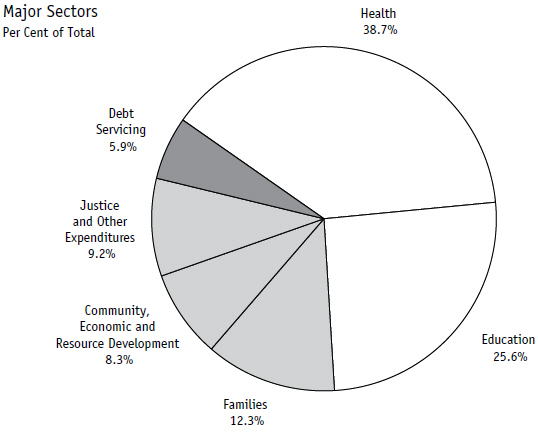
Expenditure
Expenditure in 2018/19 is projected to increase $367 million, or 2.2%, from the 2017/18 Budget. The growth in health expenditure is $70 million, or 1.0%. Education-related expenditure is increasing by $43 million, or 1.0%. Families is up $13 million, or 0.6%. Community, economic and resource development expenditure will decrease by $32 million, or 2.2%. The justice and other expenditures sector will increase by $230 million, or 16.8% mainly reflecting expenses of $102 million for the establishment of the new Conservation Trust Fund. Debt servicing is expected to increase by $43 million.
SUMMARY REVENUE
For the Fiscal Year Ending March 31, 2019 (Millions of Dollars)
With Comparative Data for the Fiscal Year Ending March 31, 2018
| | | | | | | | | | | | | | | | | | | | |
| | | | | | | | | Per Cent Change |
| | | | | | | | | 2018/19 Budget |
| | | 2018/19 | | 2017/18 | | 2017/18 | | from 2017/18 |
| Source of Revenue | | Budget | | Forecast | | Budget | | Forecast | | Budget |
| | | | | |
Income Taxes | | | | | | | | | | | | | | | | | | | | |
Individual Income Tax | | | 3,475 | | | | 3,388 | | | | 3,651 | | | | | | | | | |
Corporation Income Tax | | | 566 | | | | 552 | | | | 543 | | | | | | | | | |
| | | | | | | | | | | | | | | | | | | | |
Subtotal: Income Taxes | | | 4,041 | | | | 3,940 | | | | 4,194 | | | | 2.6 | | | | (3.6 | ) |
| | | | | | | | | | | | | | | | | | | | |
Other Taxes | | | | | | | | | | | | | | | | | | | | |
Carbon Tax | | | 143 | | | | – | | | | – | | | | | | | | | |
Corporations Taxes | | | 319 | | | | 300 | | | | 282 | | | | | | | | | |
Fuel Taxes | | | 345 | | | | 342 | | | | 334 | | | | | | | | | |
Land Transfer Tax | | | 89 | | | | 89 | | | | 84 | | | | | | | | | |
Levy for Health and Education | | | 352 | | | | 345 | | | | 342 | | | | | | | | | |
Retail Sales Tax | | | 2,463 | | | | 2,470 | | | | 2,360 | | | | | | | | | |
Tobacco Tax | | | 231 | | | | 234 | | | | 249 | | | | | | | | | |
Other Taxes | | | 10 | | | | 11 | | | | 11 | | | | | | | | | |
Education Property Taxes | | | 848 | | | | 829 | | | | 835 | | | | | | | | | |
| | | | | | | | | | | | | | | | | | | | |
Subtotal: Other Taxes | | | 4,800 | | | | 4,620 | | | | 4,497 | | | | 3.9 | | | | 6.7 | |
| | | | | | | | | | | | | | | | | | | | |
Fees and Other Revenue | | | | | | | | | | | | | | | | | | | | |
Fines and Costs and Other Legal | | | 57 | | | | 59 | | | | 54 | | | | | | | | | |
Minerals and Petroleum | | | 13 | | | | 14 | | | | 11 | | | | | | | | | |
Automobile and Motor Carrier Licences and Fees | | | 155 | | | | 154 | | | | 154 | | | | | | | | | |
Parks: Forestry and Other Conservation | | | 35 | | | | 38 | | | | 34 | | | | | | | | | |
Water Power Rentals | | | 111 | | | | 118 | | | | 111 | | | | | | | | | |
Service Fees and Other Miscellaneous Charges | | | 1,623 | | | | 1,657 | | | | 1,635 | | | | | | | | | |
Tuition Fees | | | 339 | | | | 323 | | | | 308 | | | | | | | | | |
| | | | | | | | | | | | | | | | | | | | |
Subtotal: Fees and Other Revenue | | | 2,333 | | | | 2,363 | | | | 2,307 | | | | (1.3 | ) | | | 1.1 | |
| | | | | | | | | | | | | | | | | | | | |
Federal Transfers | | | | | | | | | | | | | | | | | | | | |
Equalization | | | 2,037 | | | | 1,820 | | | | 1,820 | | | | | | | | | |
Canada Health Transfer (CHT) | | | 1,441 | | | | 1,365 | | | | 1,355 | | | | | | | | | |
Canada Social Transfer (CST) | | | 518 | | | | 502 | | | | 502 | | | | | | | | | |
Shared Cost and Other Transfers | | | 500 | | | | 508 | | | | 486 | | | | | | | | | |
| | | | | | | | | | | | | | | | | | | | |
Subtotal: Federal Transfers | | | 4,496 | | | | 4,195 | | | | 4,163 | | | | 7.2 | | | | 8.0 | |
| | | | | | | | | | | | | | | | | | | | |
Net Income of Government | | | | | | | | | | | | | | | | | | | | |
Business Enterprises (GBEs) | | | 842 | | | | 758 | | | | 705 | | | | 11.1 | | | | 19.4 | |
| | | | | | | | | | | | | | | | | | | | |
Sinking Funds and Other Earnings | | | 275 | | | | 252 | | | | 235 | | | | 9.1 | | | | 17.0 | |
| | | | | | | | | | | | | | | | | | | | |
Total Revenue | | | 16,787 | | | | 16,128 | | | | 16,101 | | | | 4.1 | | | | 4.3 | |
| | | | | | | | | | | | | | | | | | | | |
SUMMARY EXPENDITURE
For the Fiscal Year Ending March 31, 2019 (Millions of Dollars)
With Comparative Data for the Fiscal Year Ending March 31, 2018
| | | | | | | | | | | | | | | | | | | | |
| | | | | | | | | Per Cent Change |
| | | | | | | | | 2018/19 Budget |
| | | 2018/19 | | 2017/18 | | 2017/18 | | from 2017/18 |
| Sector/Department | | Budget | | Forecast | | Budget | | Forecast | | Budget |
| | | | | |
Health | | | | | | | | | | | | | | | | | | | | |
| | | | | |
Health, Seniors and Active Living | | | 6,751 | | | | 6,633 | | | | 6,681 | | | | 1.8 | | | | 1.0 | |
| | | | | |
Education | | | | | | | | | | | | | | | | | | | | |
| | | | | |
Education and Training | | | 4,453 | | | | 4,405 | | | | 4,410 | | | | 1.1 | | | | 1.0 | |
| | | | | |
Families | | | | | | | | | | | | | | | | | | | | |
| | | | | |
Families | | | 2,144 | | | | 2,128 | | | | 2,131 | | | | 0.8 | | | | 0.6 | |
| | | | | |
Community, Economic and Resource Development | | | | | | | | | | | | | | | | | | | | |
| | | | | |
Agriculture | | | 370 | | | | 228 | | | | 394 | | | | | | | | | |
| | | | | |
Growth, Enterprise and Trade | | | 107 | | | | 110 | | | | 113 | | | | | | | | | |
| | | | | |
Indigenous and Northern Relations | | | 34 | | | | 32 | | | | 32 | | | | | | | | | |
| | | | | |
Infrastructure | | | 402 | | | | 384 | | | | 400 | | | | | | | | | |
| | | | | |
Municipal Relations | | | 366 | | | | 362 | | | | 371 | | | | | | | | | |
| | | | | |
Sustainable Development | | | 162 | | | | 159 | | | | 163 | | | | | | | | | |
| | | | | | | | | | | | | | | | | | | | |
| | | | | |
Subtotal: Community, Economic and Resource Development | | | 1,441 | | | | 1,275 | | | | 1,473 | | | | 13.0 | | | | (2.2 | ) |
| | | | | | | | | | | | | | | | | | | | |
| | | | | |
Justice and Other Expenditures | | | | | | | | | | | | | | | | | | | | |
| | | | | |
Legislative Assembly | | | 49 | | | | 46 | | | | 46 | | | | | | | | | |
| | | | | |
Executive Council | | | 4 | | | | 4 | | | | 4 | | | | | | | | | |
| | | | | |
Civil Service Commission | | | 21 | | | | 21 | | | | 21 | | | | | | | | | |
| | | | | |
Employee Pensions and Other Costs | | | 81 | | | | 82 | | | | 77 | | | | | | | | | |
| | | | | |
Finance | | | 351 | | | | 347 | | | | 352 | | | | | | | | | |
| | | | | |
Justice | | | 671 | | | | 658 | | | | 661 | | | | | | | | | |
| | | | | |
Sport, Culture and Heritage | | | 87 | | | | 88 | | | | 83 | | | | | | | | | |
| | | | | |
Enabling Appropriations | | | 284 | | | | 74 | | | | 74 | | | | | | | | | |
| | | | | |
Other Appropriations | | | 52 | | | | 79 | | | | 52 | | | | | | | | | |
| | | | | | | | | | | | | | | | | | | | |
| | | | | |
Subtotal: Justice and Other Expenditures | | | 1,600 | | | | 1,399 | | | | 1,370 | | | | 14.4 | | | | 16.8 | |
| | | | | | | | | | | | | | | | | | | | |
| | | | | |
Debt Servicing | | | 1,034 | | | | 964 | | | | 991 | | | | 7.3 | | | | 4.3 | |
| | | | | | | | | | | | | | | | | | | | |
| | | | | |
Total Expenditure | | | 17,423 | | | | 16,804 | | | | 17,056 | | | | 3.7 | | | | 2.2 | |
| | | | | | | | | | | | | | | | | | | | |
Revenue, 2018/19
Expenditure, 2018/19
FISCAL RESPONSIBILITY STRATEGY 2018/19:
KEEPING OUR PROMISES
FISCAL RESPONSIBILITY STRATEGY 2018/19: KEEPING OUR PROMISES
CONTENTS
| | | | |
FISCAL RESPONSIBILITY STRATEGY: KEEPING OUR PROMISES | | | 9 | |
| |
MANITOBANS MAKING CHOICES | | | 11 | |
| |
FOCUS ON SUMMARY | | | 12 | |
| |
BUILDING THE BUDGET – FOCUS ON OUTCOMES | | | 14 | |
| |
REBUILDING THE ECONOMY | | | 21 | |
| |
SECURING OUR FUTURE: IMPROVEMENTS TO THE FISCAL RESPONSIBILITY AND TAXPAYER PROTECTION ACT | | | 24 | |
| |
THE PATH FORWARD | | | 25 | |
FISCAL RESPONSIBILITY STRATEGY: KEEPING OUR PROMISES
Our government inherited a legacy of unsustainable annual increases in spending, ballooning deficits, and faltering services. Our economy was becoming ever more dependent on public spending and increasingly exposed to risk of further credit downgrades and interest rate hikes.
We have a measured plan to deal with these challenges and make Manitoba the most improved province in Canada. This requires hard work. To keep our promise, we need to take nearly a billion dollars of wasteful spending out of our annual budget, focusing on outcomes and value for the money we are spending today in order to create better opportunities in the future.
Budget 2018 delivers on our commitment to restore stability to our finances, secure our public services and strengthen the economy for Manitobans, even as our debt servicing costs are budgeted to increase to over a billion dollars this year. We are also setting clear objectives to manage future financial volatility and to further improve financial transparency and accountability.
These are our promises. And we intend to fulfill these promises. Manitobans deserve a break.
Storm Clouds
Manitoba’s ability to withstand economic turbulence may be tested significantly over the coming year, as a number of factors combine to create a period of considerable volatility. As an economy that relies on export revenue in a number of key sectors, uncertainty over the future of the North American Free Trade Agreement casts an ominous shadow. The United States is Manitoba’s largest trading partner; the erosion of this relationship would have immediate and severe consequences for Manitoba. Within Canada, the increased frequency and severity of interprovincial trade disputes threatens to undermine the viability of both the New West Partnership and the Canadian Free Trade Agreement.
Manitoba’s tax competitiveness is also a growing issue. Tax reforms recently adopted by the United States government have significantly reduced both personal and corporate tax rates, challenging Manitoba’s ability to compete with American states for investment, job recruitment and skilled professionals. Exacerbating this challenge are recent tax increases implemented by the Government of Canada, which created significant volatility in provincial personal income tax receipts – from $160 million over expectations in 2016, to $262 million below expectations in 2017. We have yet to see evidence that income tax revenues will return to previous levels in 2018/19, which puts material pressure on Manitoba’s finances, despite a strong underlying economy.
Also looming over Manitoba’s economy is the probability of higher interest rates. Central banks throughout the world, including the Bank of Canada, have begun to slowly increase their rates and have signaled that additional rate hikes may occur over the coming year. In 2018/19, our borrowing costs will surpass one billion dollars – up $70 million year over year. This increase is attributable to increased debt from higher borrowings ($50 million) as well as the impact of higher interest rates ($20 million). On a full-year basis, the short-term impact of a 1% increase in interest rates could approach $100 million, with the longer term impact being much greater. To put this in context, debt servicing costs – if this were a government department – would be our fourth largest department – larger than Justice!
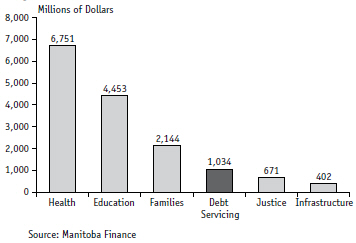
Major Areas of Spending
MANITOBANS MAKING CHOICES
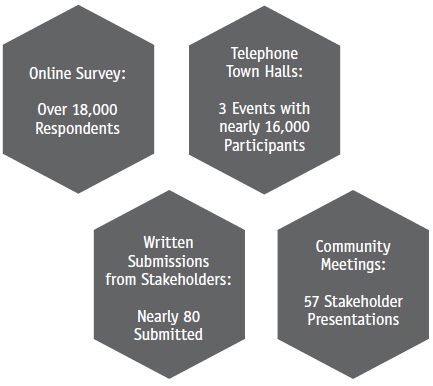
Budget 2018 is informed by pre-budget consultations that engaged close to 35,000 Manitobans, almost double the previous record set in 2017.
Our consultation process included an online survey, community consultations and three telephone-based town halls. In addition, hundreds of Manitobans submitted letters to the Minister of Finance, offering their input and highlighting their priorities for Budget 2018.
Here is what Manitobans told us:
Manitobans agree that:
| ● | | fixing our fiscal situation is a top priority |
| ● | | the current debt load is unsustainable |
| ● | | a moderate path to balancing the budget is reasonable |
| ● | | the Manitoba Civil Service can be streamlined through attrition and trimming senior management positions |
Manitobans want a health care system that is cost-effective and focused on delivering quality and timely care. They agree that:
| ● | | cost savings can be found within the system |
| ● | | wait times must be reduced, increasing the availability of high tech equipment and freeing up more personal care home beds |
| ● | | a health care premium is not right for Manitoba |
| ● | | the federal government should cover half of the province’s health care costs |
Manitobans want a cannabis policy that ensures:
| ● | | criminal gangs are out of the cannabis business |
| ● | | the safety of citizens, whether or not they are using cannabis |
FOCUS ON SUMMARY
For many years, annual government budgets focused on core government departments, and less attention was paid to other government entities such as the crown corporations. In 2007, Manitoba fully implemented Canadian Public Sector Accounting Standards which require the consolidation of all government entities under a single budgeting and reporting framework to improve transparency and provide citizens with a “whole of government” perspective. This comprehensive approach is consistent with the way most Manitobans and credit rating agencies assess governments’ fiscal performance, and ensures that public services are consistently and properly managed.
Summary statements acknowledge this reality by reporting on all entities of government that provide provincial public services paid for by Manitobans, whether through taxes or rate payments such as hydro or auto insurance. It is for this reason that Manitoba’s balanced budget legislation applies to Summary statements, and that a portion of the ministers’ pay is impacted by these results. By extension, any summary deficit increases net debt.
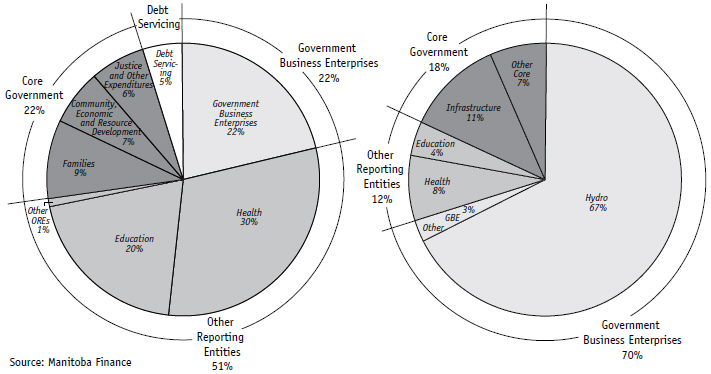
While accounting and budgeting has evolved to include other entities, the related financial decision-making framework has remained largely segregated, with government focused on the core departments over which the Legislative Assembly exercises direct control. The central Manitoba government departments not influenced by multiple Other Reporting Entities (ORE) make up only 22% of Manitoba’s summary expenditure budget, while the four crown corporations that are Government Business Enterprises (GBE) represent 22% of expenditures, 25% of revenue and 70% of capital investment.
In the summary budget, GBEs are consolidated on a modified equity basis. The following illustration shows the relative total scope of GBE expenditures compared to core government and OREs. For purposes of this illustration the Health and Education sectors are included with OREs as the majority of the departmental expenditures ultimately flow to school divisions and regional health authorities.
| | |
| Total 2018/19 Expenditures | | Total 2018/19 Capital |
| Per Cent of Total | | Per Cent of Total |
| | | | | | |
| | Summary Budget Defined Manitoba’s summary budget includes revenue forecasts and expenditure estimates for government departments as well as projections for the approximately 180 other reporting entities. This is a “whole of government” reporting approach for Manitoba’s public services. | | | | Impact of OREs and GBEs 
|
There are approximately 180 reporting entities across summary government, including major crown corporations (Manitoba Hydro, Manitoba Public Insurance and Manitoba Liquor and Lotteries), universities and colleges, | | | |
school divisions and the health and family services authorities, as well as major insurance providers like the Workers Compensation Board and the Manitoba Agricultural Services Corporation. Financial variability in even one of these entities dramatically impacts our ability to improve Manitoba’s fiscal position and directly impacts how much funding is available for other core programs and services.
We are asking reporting entities to take the same steps that government departments have taken – streamlining the workforce, reducing management structures and pivoting towards achieving the outcomes that Manitobans demand and deserve. We are also working to reduce volatility. Increasingly this will be a part of our plan to bring the summary budget into balance.
Taking Inventory
Prudent financial stewardship requires taking stock of what you own and assessing how much of it has value going forward. In the process of taking inventory, we have discovered that the previous government’s actions resulted in over-valued or worthless assets being held on our books, creating situations where we have liabilities that are not properly recorded and are unnecessarily exposing our finances to added risk. Over the past year, as we familiarized ourselves with the extent of these risks, we have taken prudent measures to put our financial house back in order. Recovering from past decisions and clarifying the status of our assets will restore public confidence in Government’s accounting practices and, more importantly, put our books on a more predictable and stable foundation. This work continues and further details of our progress will be provided upon release of the 2017/18 Public Accounts.
BUILDING THE BUDGET – FOCUS ON OUTCOMES
We are taking meaningful steps to create a sustainable financial future for Manitoba, and the results speak for themselves: since 2016, we have managed within the budgets we set and have reduced the deficit each year. In 2018, we will build on that progress.
Cost Drivers – Human Resources
Across Summary government, people are our strongest asset but also our largest cost driver.
| | | | | | | | | | | | | | | | | | | | |
Group | | Number of Employees
(Estimated) | | Total Pay
and Benefits | | Number of
Agreements | | |
Core Government | | | | 14,000 | | | | | $1.1 B | | | | | 9 | | | | | | |
Crown Corporations | | | | 10,000 | | | | | $0.9 B | | | | | 18 | | | | | | |
Healthcare | | | | 52,000 | | | | | $4.3 B | | | | | 182 | | | | | | |
Universities and Colleges | | | | 13,000 | | | | | $0.9 B | | | | | 24 | | | | | | |
Schools (K–12) | | | | 26,000 | | | | | $2.2 B | | | | | 119 | | | | | | |
Child Welfare Agencies | | | | 8,000 | | | | | $0.2 B | | | | | 11 | | | | | | |
Total | | | | 123,000 | | | | | $9.6 B | | | | | 363 | | | | | | |
Put another way, payroll approaching $10 billion represents a sizable majority of our total annual expenses, representing nearly 49 different unions and associations, and 20% of the total Manitoba workforce.
To manage these costs, we established sustainable salary expectations through The Public Services Sustainability Act. We are working to streamline collective bargaining in the health and education sectors, where there are currently 182 and 38 bargaining units, respectively. We have also reduced core government management by over 15% and have initiatives in place to harness the natural annual attrition rate to reduce the core government employee count by 8% over 4 years.
Cost Drivers – Previous Capital Investments
For many years, significant capital investments were undertaken without regard for their sustainability, and they are now compromising our ability to live within our means and make progress on eliminating the deficit. For example, in the Department of Infrastructure, capital debt repayment (including enabling expenses) represents 70% of its 2018/19 operating expenditures. Even if we were to choose to make no further capital investment in our highways and bridges, we would still be spending over $450 million annually for years to come, just to pay for the decisions of the past.
Last year’s budget highlighted the challenges resulting from past unsustainable capital spending levels; levels that had quadrupled over a period of 11 years to their peak in 2015/16, when growth at the rate of inflation would have resulted in only a 32% increase.
Debt Financed Capital Spending from
2004/05 to 2018/19
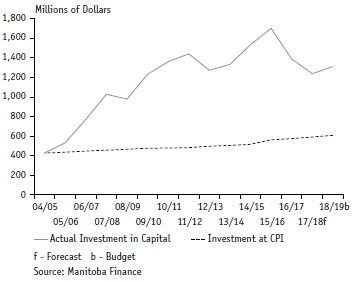
The level of growth in core debt-financed capital has resulted in a $2 billion increase in net debt over the past five years and a corresponding increase in interest costs to the Province, comprising a much larger share than in the past.
Not only did this growth reflect unprecedented and unsustainable increases – it also occurred without a focus on return on investment.
In response, our government has developed a comprehensive long-term strategy to bend the capital cost curve starting with a 6.9% reduction in Strategic Infrastructure from 2017/18 Budget levels. Through the later half of 2017, the Manitoba Government undertook significant work to develop tools to assess capital spending programs, resulting in some delays and related reductions in capital spending.
As promised in the 2016 Throne Speech, a new return on investment test to prioritize government investments is being applied to ensure Manitobans receive value for their money. We are making all of these changes to spend capital in more thoughtful ways, all while keeping our election promise to spend more than a billion dollars every year on Strategic Infrastructure.
The 2018/19 capital budget reflects priorities of:
| ● | | minimizing costs of asset ownership; |
| ● | | valuing “fix and repair” over conspicuous construction of unnecessary structures; |
| ● | | investing in schools for underserved communities that have been neglected in the past; |
| ● | | health transformation; and |
| ● | | environmental infrastructure in response to climate change. |
Strategic Infrastructure 2018/19
| | | | | | | | | | | | |
| Millions of Dollars | | 2018/19
Budget | | 2017/18
Forecast | | 2017/18
Budget |
| | | |
Roads, Highways, Bridges and Flood Protection | | | | | | | | | | | | |
| | | |
Highways Infrastructure and Airport Runway Capital | | | 355 | | | | 436 | | | | 510 | |
| | | |
Maintenance and Preservation – Highways | | | 136 | | | | 146 | | | | 143 | |
| | | |
Water Related Infrastructure | | | 104 | | | | 45 | | | | 60 | |
| | | |
Transportation Equipment and Aircraft | | | 17 | | | | 12 | | | | 19 | |
| | | |
Maintenance and Preservation – Water | | | 12 | | | | 14 | | | | 15 | |
| | | | | | | | | | | | |
| | | |
Subtotal | | | 624 | | | | 653 | | | | 747 | |
| | | |
Health, Education and Housing | | | | | | | | | | | | |
| | | |
Health | | | 319 | | | | 183 | | | | 358 | |
| | | |
Education | | | 168 | | | | 95 | | | | 176 | |
| | | |
Housing | | | 90 | | | | 95 | | | | 107 | |
| | | | | | | | | | | | |
| | | |
Subtotal | | | 577 | | | | 373 | | | | 641 | |
| | | |
Other Provincial Infrastructure | | | | | | | | | | | | |
| | | |
Municipal and Local Infrastructure | | | 178 | | | | 181 | | | | 189 | |
| | | |
Public Service Buildings, Equipment and Technology | | | 171 | | | | 57 | | | | 88 | |
| | | |
Parks, Cottage and Camping | | | 12 | | | | 1 | | | | 12 | |
| | | | | | | | | | | | |
| | | |
Subtotal | | | 361 | | | | 239 | | | | 289 | |
| | | | | | | | | | | | |
| | | |
Total Strategic Infrastructure | | | 1,562 | | | | 1,265 | | | | 1,677 | |
| | | | | | | | | | | | |
NOTES:
| • | | The 2017/18 forecast and budget have been restated to be consistent with the 2018/19 budget presentation. |
For too long, our capital spending priorities have focused on new, conspicuous head offices, while ignoring basic needs like schools and failing to maintain the institutions that we own. This budget sets the stage for a major investment in five new schools that will result in schools’ share of total capital spending increasing significantly in 2019/20. This investment reflects our commitment to addressing a history of neglect, which has resulted in too many students trying to learn in crowded schools and portable classrooms.
Last year, we announced that we would explore the feasibility and benefits of building schools under a Public-Private Partnerships (P3) model, and we retained KPMG to advise us on this approach and to share the experience of other jurisdictions. While we remain fully committed to the benefits of P3s and partnering with private enterprise, we will always turn to evidence and pursue the best value for money. For a number of reasons – including lack of scale for P3 schools, the increased timeline and expense of a P3 tendering process, the urgent need to open new schools and the value for money, we have decided to build these schools using an enhanced conventional tender. Informed by our review of the P3 construction process, the Public Schools Finance Board (PSFB) has incorporated new, leading-edge practices including tendering multiple schools simultaneously. As a result, the cost of constructing these five schools has been reduced by nearly $19 million, and three of the five schools will be completed a year ahead of schedule.
Cost Drivers – Health Care
| | | | |
Healthcare spending has grown to represent over 40% of our core budget. Over the past 20 years, healthcare budgets have tripled, from $1.9 billion in 1998 to $6.2 billion in 2018 without a commensurate improvement in outcomes. When we took office in 2016, per capita health expenditures in Manitoba were the fourth highest expenditure level amongst the provinces. At the same time, our wait times were consistently among the longest in Canada. We have turned to evidence in our review of Manitoba’s overall healthcare system. We have discovered that the current governance model is overly complex for a province of our size, and Manitobans are not receiving an optimal level of care. In addition, accountability for results is fractured and inadequate across the system. | | | | Manitoba Health, Seniors and Active Living Historical Budget Trend 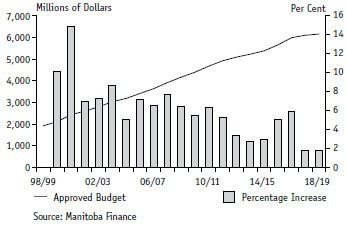
|
2017/18 was a pivotal year for health care in Manitoba. A new Transformation Management Office is overseeing reforms to reduce costs and improve services. At the same time, we have introduced new accountability within the system to better measure outcomes and put service delivery on a more sustainable path. Even the little changes are important. Our health-related entities will be moving from government not-for-profit accounting standards to Canadian Public Sector Accounting Standards in an effort to standardize reporting, and ensure the timely verification and compilation of information for summary budgeting and reporting. It is hard to believe that for years, our province’s health-related entities did not use the same accounting standards as the Government, impairing their capacity for effective information sharing and coordination.
Cost Drivers – Legalization of Cannabis
The current path toward legalization of cannabis has been rushed, and we have repeatedly expressed our concern that it is more important to get it right than to meet an arbitrary deadline.
We are focused on public safety, including elimination of the black market. If cannabis is not priced competitively, it will not gain market share and the black market will continue to thrive, which is bad for Manitobans and particularly bad for our children. Not knowing the expected tax revenue, or associated costs of cannabis, means that we are not building our budget on a hope of revenue that we cannot predict, because hope is not a plan.
What we know for certain, and all provinces agree, is that the province will bear the majority of the costs of legalizing cannabis, including healthcare, education, road safety, justice and more, and that we expect these increased costs to outweigh any revenue gains.
Focus on Outcomes
In the past, funding was provided to many of our most critical partners with limited or no reporting on outcomes – failure was not addressed and success was not rewarded.
We have talked about “bending the cost curve”, but this is about transforming our culture and rethinking how we do things. Focusing on outcomes is the only way to drive costs out of the system while preventing adverse impacts on the services Manitobans expect and deserve. Examples of our new approach to spending include:
| ● | | a new value for money assessment tool to guide our investments in cultural capital, including the Assiniboine Park Conservancy, Winnipeg Art Gallery, and Royal Aviation Museum of Western Canada; |
| ● | | block funding arrangements to reduce red tape and allow agencies to deliver the right services to the right people in the right way without relying on complex funding formulas or unintended incentives to drive costs and limit innovation. We have already introduced block funding for municipalities and some family services agencies and are continuing to explore other opportunities in this area; |
| ● | | a greater focus on competitive procurement processes as well as social impact procurement, including leveraging social enterprises and pay for performance models such as Social Impact Bonds; and |
| ● | | working toward consolidation of common functions, such as finance and administration. |
All of these tools require common approaches to public procurement processes that are transparent, comprehensive and drive value across the public sector. We are engaging support to develop better procurement practices that will harness savings across government in areas that range from information technology, to equipment purchases to maintenance and repair contracts.
We are also continuing to explore alternative service delivery opportunities, not only to improve service, but also to reduce costs. This year, we are reviewing options to improve the cost-effectiveness of aircraft services within government and will be issuing a Request for Proposals to explore better ways to achieve value in this program.
All of these innovative efforts will be carefully monitored for success. We are focusing on outcomes by deploying Balanced Scorecards throughout core government and, in the coming year, will also be reporting publicly on how we are doing – both our successes and where we find a need for improvement or a different approach.
Transforming the Public Service
In addition to the economic circumstances we face, rapid advances in technology and changes in Manitobans’ expectations also present significant challenges. To face these complex issues successfully, we must learn from proven good practices and leverage the talent and ideas of public servants, and create space for innovation to grow.
In February of this year, we shared Manitoba’s Transformation Strategy, setting out a bold vision for the future and providing a framework for public servants to take action to transform both their work and their culture. This strategy provides an opportunity to build a modern public service culture that will attract and retain diverse, skilled and innovative employees into the future. Introducing Balanced Scorecards and external reporting of outcomes is a key pillar in this initiative.
We are also advancing our commitment to Open Government. This spring, we will streamline Manitoba’s process for consulting with citizens. We will launch an online portal to centralize and simplify the mechanism through which citizens provide input into government programs and services. With improved information from citizens, the public service will be better equipped to focus its efforts on priorities that will advance outcomes for Manitobans.
Giving Manitobans a Well-Deserved Break
When our Government was elected in April 2016, Manitoba’s tax regime was out of line with other provinces: we had one of the lowest basic personal income tax exemptions, the tax treatment for small business income was not competitive, and we were handed the highest sales tax rate in Western Canada.
Soon after taking office, we proudly introduced tax bracket indexation, and are now continuing on our work. Budget 2018 makes significant strides to give Manitoba families and individuals a well-deserved tax break and restore a competitive tax environment.
Reducing the Provincial Sales
Tax from 8% to 7%
The following table shows provincial sales tax rates applicable before the 2016 budget and projected to 2020. Manitoba is the only province to announce a rate reduction. Manitoba’s rate will match British Columbia’s and be lower than any province east of Manitoba.
Our sales tax reduction will also improve Manitoba’s business tax competitiveness, stimulate the economy and put money back into the hands of Manitobans.
Provincial Sales Tax Rates
| | | | |
| | | 2016
(pre-budget) | | 2020 |
| | | |
British Columbia | | 7% | | 7% |
| | | |
Alberta | | n/a | | n/a |
| | | |
Saskatchewan | | 5% | | 6% |
| | | |
Manitoba | | 8% | | 7% |
| | | |
Ontario | | 8% | | 8% |
| | | |
Quebec | | 9.975% | | 9.975% |
| | | |
New Brunswick | | 8% | | 10% |
| | | |
Nova Scotia | | 10% | | 10% |
| | | |
Prince Edward Island | | 9% | | 10% |
| | | |
Newfoundland and
Labrador | | 8% | | 10% |
| | |
☐ Rate increase | | ☐Rate decrease |
Source: Manitoba Finance
Increasing the Basic Personal Amount – $2,020 by 2020
| | | | |
Provincial Basic Personal Amounts 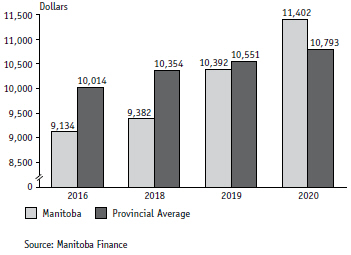
| | | | The “basic personal amount” is the amount of income that is exempt from personal income taxes or, put another way, the amount a person can earn before the government starts to tax you. The larger the basic personal amount, the better for all taxpayers. In 2016, Manitoba’s basic personal amount was the only one outside of Atlantic Canada that was below $10,000. We plan to increase Manitoba’s basic personal amount by $1,010 on January 1, 2019 and again by $1,010 on January 1, 2020 – or “$2,020 by 2020”. As a result, Manitoba’s basic personal amount will exceed $11,400 and outpace the provincial average across Canada. Increasing the basic personal amount will help all taxpayers, but will disproportionately benefit the working poor who will either no longer pay |
provincial income tax at all or have a much higher percentage of their income tax-free, keeping hard earned money in the homes of those who need it most. Through this change, we anticipate that by 2020 a total of 31,000 low income earners will no longer need to pay taxes.
Increasing the Small Business Income Threshold to $500,000
| | | | |
Provincial Corporation Income Tax Small Business Tax on $500,000 in 2016 and 2019 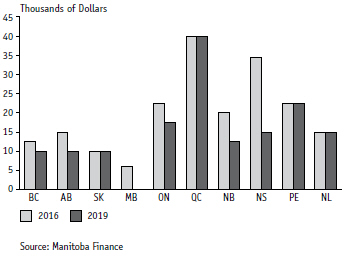
| | | | We know small businesses are the mainstay of the Manitoba economy. Manitoba recognizes their value by increasing the small business income threshold eligible for Manitoba’s 0% corporation income tax rate, the lowest in Canada. A small business with up to $500,000 taxable income will now be exempt from Manitoba corporate income tax. Lowering Taxes to the Benefit of all Manitobans The Manitoban economy is doing very well. At the same time, we see federal tax policies that threaten small businesses and challenge top income earners in Canada, alongside large reductions in US corporate and personal tax rates. Manitobans need a break, and businesses need to remain competitive in the Canadian and Global market place. |
REBUILDING THE ECONOMY
Climate and Green Plan
This past October, we released our Made-in-Manitoba Climate and Green Plan that aims to make Manitoba the cleanest, greenest and most climate resilient province in Canada. Our Plan integrates environmental and economic objectives across all of government based on four pillars – climate, jobs, water, and nature.
Our choices were either to agree to the federally-mandated carbon tax dictated and controlled by Ottawa, or to find our own “Made-in-Manitoba” carbon plan. Budget 2018 follows through on our commitment to develop a Made-in-Manitoba approach to reduce our greenhouse gas emissions. All carbon tax revenues received over the next four years will be returned to Manitobans through tax reductions.
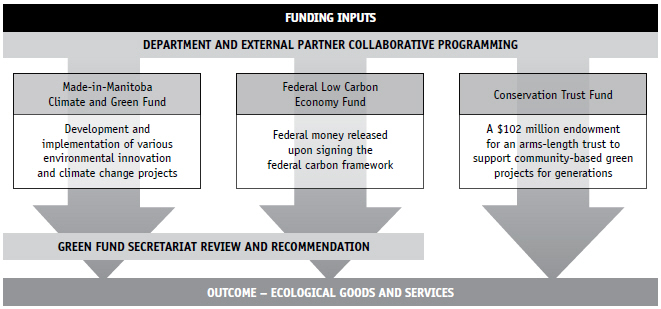
Budget 2018 includes the historic establishment of a $102 million Conservation Trust Fund to protect wetlands, grasslands, forests and natural areas by providing matching funds to partnerships with private investors, landowners and community based conservation organizations. We have also formed a “Made-in-Manitoba Climate and Green Fund” that will provide the necessary funds to implement our Made-in-Manitoba Climate and Green Plan, and we look forward to partnering with the federal government on climate change programs.
Economic Development
Jobs and economic growth remain at the centre of our plan for a better Manitoba. A stronger economy will allow for improvements in front line services and additional investments in the programs and initiatives most important to Manitoba families while also repairing the state of the province’s finances. Manitobans recognize that better services depend on a stronger economy, and we have taken the first steps on the road to making Manitoba the most improved jurisdiction for investment and job creation.
In the past, Manitoba did not have a clearly articulated, evidence-based approach to economic development, but rather, a disjointed collection of mismatched programs that were added, incrementally, over time. Further, programs that were added were not reviewed to determine if they had achieved their intended outcomes.
This past year, we undertook a comprehensive assessment of the state of our economic development efforts. We sat down with our business leaders to gather their views and give us their expert recommendations on how to make Manitoba the most improved province when it comes to attracting business investment.
Our report confirmed the absence of clearly defined goals and objectives, significant areas of mandate overlap amongst our many economic development agencies, and a lack of coordination within government departments.
We are committed to addressing these shortcomings, and have asked senior Manitoban business leaders to direct the next step of designing our overall strategy and reforming the way we attract business investment to our province.
Look North
As part of advancing economic development across Manitoba, we see the North as the key to unlocking our economic potential.
The Look North Report and Action Plan for Manitoba’s Northern Economy outlines a path forward to building stronger partnerships and a brighter economic future in the North. The report identifies six priority areas including northern mineral and other resource potential; Indigenous engagement and partnerships; strategic infrastructure investment; housing challenges and opportunities; enterprise eco-system of support; and education, training and workforce development.
A northern steering committee and joint action groups for each of the priority areas have been established to lead and engage stakeholders in the next phase of work to develop more detailed strategies and action plans to help unlock the tremendous economic potential that exists in this region.
At the same time, we have committed to establishing a mineral development protocol with First Nations to create a clear pathway forward and a stable and predictable consultation process that ensures First Nations are involved in all aspects of mineral development and share in the resulting benefits. We will continue our work with First Nations communities to define a mutually agreed process that will advance mineral development projects in Indigenous traditional territories.
The Look North Report highlighted access to broadband as a priority area and one of the most common topics to arise in discussions with northerners. Our government recently announced a $20 million contribution towards a $63-million project to bring high-speed Internet to 72 rural and remote communities in the province, 37 of which are First Nation communities and 18 of which are located in remote regions of northern Manitoba. This announcement is exemplary of how strong partnerships with our federal counterparts and Indigenous organizations can advance shared priorities and modernize and transform the economic future of the region.
Reducing Red Tape
According to industry estimates, federal, provincial and municipal regulations cost businesses in Manitoba $1.2 billion, of which $360 million is considered unnecessary. Seven out of ten business owners in Manitoba say red tape is limiting their ability to create jobs. Reducing this red tape is an important part of our plan to grow the
economy, and we are committed to becoming Canada’s most improved province by reducing the burden of regulatory requirements that are poorly designed, duplicative, contradictory, anachronistic or overly prescriptive.
The Regulatory Accountability Act that was introduced in June 2017 requires the measurement, tracking and reporting of regulatory requirements found in legislation, regulations, policies, and forms. As part of this process, more than 906,000 regulatory requirements were identified in the baseline count measured as of April 1, 2016.
This new Act introduces a number of innovative mechanisms to promote regulatory accountability and reduce red tape, including the 2-for-1 rule, which will require two regulatory requirements to be removed for every new one introduced.
Business is taking note. Stakeholders have publicly stated that Manitoba’s red tape measure is the best of its kind in North America. During Canada’s 2018 Red Tape Awareness Week, Manitoba received an “A” grade in the Canadian Federation of Independent Business’ (CFIB) 2018 Provincial Red Tape Report Card for significant progress on regulatory accountability and red tape reduction. This ties Manitoba for first with British Columbia and Quebec. By comparison, Manitoba’s last grade under the previous government in 2016 was an “F”, the worst grade amongst provinces.
Manitoba also won the CFIB’s 2018 Golden Scissors Award in recognition of its leadership on red tape reduction through introduction of The Regulatory Accountability Act and The Red Tape Reduction and Government Efficiency Act 2017.
Allowing the Private Sector to Flourish
The underlying economy in Manitoba is strong:
| ● | | Total employment increased by 10,500 workers, the largest gain in 15 years; |
| ● | | Private sector jobs increased by 11,800 workers, the largest gain in 15 years; |
| ● | | Second highest increase in average weekly earnings among provinces and highest since 2014; |
| ● | | Labour income growth has improved to 4.7% in 2017, compared to 0.8% in 2016; |
| ● | | Manufacturing sales increase by 5.3%, best in six years; |
| ● | | Wholesale merchandise sales increased by 7.4%, best since 2014; |
| ● | | Motor vehicle sales increased by 10.1%, best in 15 years; |
| ● | | Truck and SUV sales are up by 15.4%, best in 20 years; |
| ● | | Exports to the Non-U.S. markets increased by 13.0%, best in six years; |
| ● | | Manitoba crop farmers report a record volume of harvest (bushels) in 2017; and |
| ● | | Total farm cash receipts surpassed $6.5 billion in 2017, the highest ever in Manitoba. |
SECURING OUR FUTURE: IMPROVEMENTS TO THE FISCAL RESPONSIBILITY AND TAXPAYER PROTECTION ACT
The Fiscal Responsibility and Taxpayer Protection Act affirms fiscal discipline and accountability to Manitobans on sustainable financial management. It requires that governments show progress toward a balanced budget that is based on summary results.
Amendments will be introduced to strengthen the Act. The improvements will create greater incentives for difficult – yet essential – work in restoring our finances, and remove disincentives against early progress or the extra achievement beyond $100 million per year. Measuring progress from the 2017/18 budget, the Act will also allow for reinstatement of ministerial salary amounts withheld once a surplus is achieved in future. Finally, to improve transparency, we will now report each minister’s respective withheld salary amounts.
As a result of the tabled Budget 2017, the baseline (which is adjusted for things such as emergencies and Hydro net income) was calculated as follows:
The Fiscal Responsibility and Taxpayer Protection Act
Base Line Deficit Results
(Millions of Dollars)
| | | | |
| | | 2017/18
Budget | |
| |
Revenue | | | 16,101 | |
| |
Expenditure | | | 17,056 | |
| | | | |
| |
Net Result | | | (955) | |
| |
Year-end Adjustments/Lapse | | | (115) | |
| | | | |
| |
Net Income (Loss) | | | (840) | |
| | | | |
| |
Adjustments: | | | | |
| |
1) Net Income (Loss) Manitoba Hydro | | | 74 | |
| |
2) Fiscal Stabilization Fund | | | 10 | |
| | | | |
| |
Base Line Deficit | | | (924) | |
| | | | |
It is upon this baseline that the Government will be held accountable to make steady progress. In fact, results will need to show an improvement of $100 million a year, every year, in order for ministers to realize all of their pay.
THE PATH FORWARD
For a 13 year period prior to 2016/17, core expenditure budgets were consistently over spent. Over that period, total overspending was $1.7 billion excluding the costs of the 2011 flood, or almost $140 million per year on average.
For 2017/18, we are forecasting the second straight year of keeping spending below budgeted levels through careful management and steady execution of our promises, and we accomplished this despite the most significant reduction in individual income tax revenue in a generation and prudently adding a contingency for writedowns. The forecasted 2017/18 year-end results, as adjusted pursuant to the Act, are estimated as set forth below.
The Fiscal Responsibility and Taxpayer Protection Act
Base Line Deficit Results
(Millions of Dollars)
| | | | | | | | | | | | |
| | | 2017/18
Budget | | 2017/18
Forecast | | Increase/
(Decrease) |
| | | |
Revenue | | | 16,101 | | | | 16,128 | | | | 27 | |
| | | |
Expenditure | | | 17,056 | | | | 16,854 | | | | (202 | ) |
| | | | | | | | | | | | |
| | | |
Net Result | | | (955 | ) | | | (726 | ) | | | 229 | |
| | | |
Year-end Adjustments/Lapse | | | (115 | ) | | | – | | | | 115 | |
| | | | | | | | | | | | |
| | | |
Net Income (Loss) | | | (840 | ) | | | (726 | ) | | | 114 | |
| | | | | | | | | | | | |
| | | |
Adjustments: | | | | | | | | | | | | |
| | | |
1) Net Income (Loss) Manitoba Hydro | | | 74 | | | | 40 | | | | (34 | ) |
| | | |
2) Fiscal Stabilization Fund | | | 10 | | | | 10 | | | | – | |
| | | | | | | | | | | | |
| | | |
Base Line Deficit | | | (924 | ) | | | (776 | ) | | | 148 | |
| | | | | | | | | | | | |
| | |
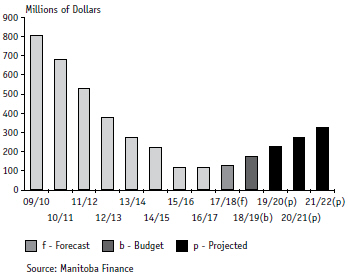
As we look forward to the next four years, our projections show steady progress on deficit reduction into the future, while at the same time delivering tax relief from the Cabinet table to the kitchen table of Manitobans. This revised projection differs from the projections offered as part of Budget 2017, showing a new and improved “trajectory” to budget reduction. We have also extended our forecast period by a further two years in order to provide further guidance in respect of our longer term plans. | | Summary Budget Deficit 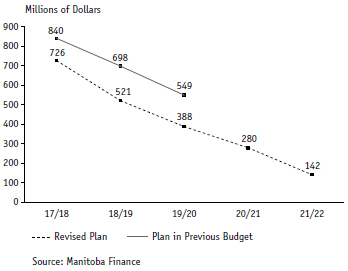
|
Summary Budget
(Millions of Dollars)
| | | | | | | | | | | | | | | | | | | | |
| | | 2017/18
Forecast | | 2018/19
Budget | | 2019/20
Projection | | 2020/21
Projection | | 2021/22
Projection |
| | | | | |
Revenue | | | 16,128 | | | | 16,787 | | | | 17,095 | | | | 17,243 | | | | 17,593 | |
| | | | | |
Expenditure | | | 16,854 | | | | 17,423 | | | | 17,598 | | | | 17,638 | | | | 17,850 | |
| | | | | |
Year-End Adjustments/Lapse | | | – | | | | (115 | ) | | | (115 | ) | | | (115 | ) | | | (115 | ) |
| | | | | | | | | | | | | | | | | | | | |
| | | | | |
Net Income (Loss) | | | (726 | ) | | | (521 | ) | | | (388 | ) | | | (280 | ) | | | (142 | ) |
| | | | | | | | | | | | | | | | | | | | |
Core Government
(Millions of Dollars)
| | | | | | | | | | | | | | | | | | | | |
| | | 2017/18
Forecast | | 2018/19
Budget | | 2019/20
Projection | | 2020/21
Projection | | 2021/22
Projection |
| | | | | |
Revenue | | | 12,945 | | | | 13,546 | | | | 13,898 | | | | 13,989 | | | | 14,302 | |
| | | | | |
Expenditure | | | 13,710 | | | | 14,170 | | | | 14,306 | | | | 14,306 | | | | 14,478 | |
| | | | | |
Year-End Adjustments/Lapse | | | – | | | | (35 | ) | | | (35 | ) | | | (35 | ) | | | (35 | ) |
| | | | | | | | | | | | | | | | | | | | |
| | | | | |
Net Result | | | (765 | ) | | | (589 | ) | | | (373 | ) | | | (282 | ) | | | (141 | ) |
| | | | | | | | | | | | | | | | | | | | |
| | | | | |
Fiscal Stabilization Account Transfer | | | (10 | ) | | | (50 | ) | | | (50 | ) | | | (50 | ) | | | (50 | ) |
| | | | | | | | | | | | | | | | | | | | |
| | | | | |
Net Income (Loss) | | | (775 | ) | | | (639 | ) | | | (423 | ) | | | (332 | ) | | | (191 | ) |
| | | | | | | | | | | | | | | | | | | | |
Fiscal Stablization Account
Through transfers to the Fiscal Stabilization Account, we are also steadily replenishing the Province’s savings that were previously drawn down – even when the economy was strong and revenue was growing.
Restoring Credit Rating
Credit rating agencies downgraded Manitoba last year, citing the past financial mismanagement of the Province’s affairs. In fact, there were three downgrades in a space of three years. Downgrades put the entire sustainability of the province at risk, and can cost us millions of dollars in higher borrowing costs. While the path to restore our credit ratings will need to be over the course of successive responsible budgets (there are no quick fixes), we are bending the curve. By introducing responsible budgets and deliberately executing them, we have worked to arrest this alarming trend.
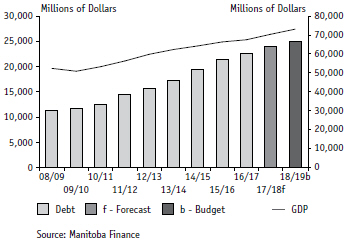
Debt to GDP
Looking to Budget 2019
We have already commenced work for building Budget 2019. We are starting our budgeting process earlier than ever before, and our efforts will be well underway by the summer. Next year’s budget process will also continue with the ongoing priorities of refining tax credits and reviewing our tax systems.
The Storm Clouds we have seen are real – we will remain on high vigilance. We are seeking ways to reduce volatility in our summary budget – for example by reviewing the past accounting policies taken in respect of entities like Workers Compensation Board, where there may be ways for better budgeting practices across summary government. In the meanwhile, we will continue our work in finding better value for money and more cost effective outcomes, while reducing Manitobans’ excessive tax burden and bringing the summary budget into balance.
Budget Paper A
ECONOMIC REVIEW AND OUTLOOK
ECONOMIC REVIEW AND OUTLOOK
CONTENTS
| | | | |
OVERVIEW | | | A1 | |
| |
INTERNATIONAL ECONOMIC DEVELOPMENTS | | | A2 | |
| |
THE CANADIAN ECONOMIC DEVELOPMENTS | | | A4 | |
| |
MANITOBA ECONOMY | | | A5 | |
| |
MANITOBA OUTLOOK | | | A18 | |
| |
CHANGING ECONOMIC AND FISCAL LANDSCAPE | | | A20 | |
| |
MANITOBA FINANCE SURVEY OF ECONOMIC FORECASTS 2017f–2019f | | | A23 | |
| | |
| | B U D G E T 2 0 1 8 E c o n o m i c R e v i e w a n d O u t l o o k / A 1 |
OVERVIEW
Manitoba’s economic performance indicators show an improvement in growth, which began in 2016 and strengthened in the first half of 2017. Most key indicators reveal a sharp acceleration in economic activity in 2017 compared to the two previous years.
| | |
Manitoba Real GDP Growth, 2013–2019f 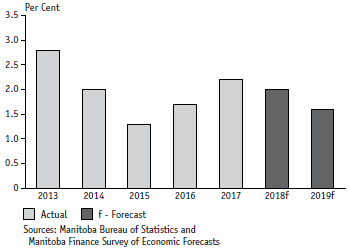
| | This momentum in economic growth is attributed to a number of factors. Stable commodity prices are supporting a recovery in national and international exports of goods and services. Strong provincial population growth is maintaining confidence and boosting capital spending on residential, commercial and industrial properties in Manitoba. Record harvest of grains and oilseeds is lifting output in agriculture and in a number of other supporting sectors. As well, Manitoba hosted the 2017 Canada Summer Games in Winnipeg. This provided an additional lift to domestic spending as spectator sports, performing arts, restaurants, accommodation and transportation facilities provided services for hundreds of visiting athletes, their families and spectators. |
Offsetting these gains were developments in Manitoba’s mining and oil extraction sector. Weak market fundamentals and depletion of reserves in certain sections of existing mines are lowering production and jobs in the sector. While further consolidation is expected in 2018 and 2019, activity could quickly turn around if prices surge, or exploration and technology reveal new finds or cost-efficient ways to extract natural resources.
As the impact from one-time transitory factors and commodity price recovery-fueled stimulus diminish, economic growth is expected to slow over the medium term. Some indicators, including employment, point to a slower pace of growth in the latter half of 2017. Similarly, several major projects completing or winding down are expected to slow the pace of capital spending in the near term.
The broad and sustained increase in global demand is expected to support Manitoba’s exports and business investment in manufacturing and wholesale capacity, while growth in population and jobs will continue to lift domestic spending. In addition, stable government infrastructure spending will add to growth.
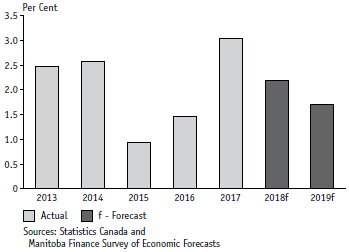
According to the Manitoba Bureau of Statistics, real GDP growth in Manitoba improved from a low of 1.3% in 2015 to 2.2% in 2017. The Manitoba Finance Survey of Economic Forecasts indicates 2.0% growth in 2018 and 1.6% growth in 2019. This compares to 2.3% and 1.8% growth forecast for Canada in 2018 and 2019, respectively.
The general economic outlook is subject to considerable risks associated with the ongoing North American Free Trade Agreement (NAFTA) renegotiations and higher interest rates. Federal measures to cool the housing market are elevating concerns of their impact on Manitoba’s relatively balanced housing market. In addition, corporate and
| | |
A 2 / E c o n o m i c R e v i e w a n d O u t l o o k B U D G E T 2 0 1 8 | | |
personal tax rate changes in the U.S. and Canada are placing a spotlight on global tax competitiveness. This could cause a measurable behavioural response by businesses and households.
INTERNATIONAL ECONOMIC DEVELOPMENTS
In 2017, after several years of below average growth, the global economy turned a corner. This global growth is broad-based as evidenced by the International Monetary Fund (IMF) highlighting positive year-over-year growth in 120 countries around the world, representing 75% of the global economic output, the best broad-based expansion since 2010.
| | |
Global Real GDP Growth, 2013–2019f 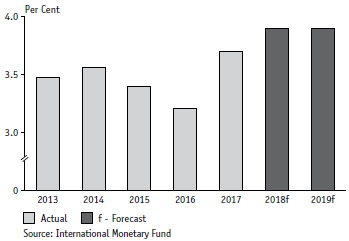
| | Citing tax cuts and infrastructure spending, the IMF upgraded U.S. economic growth by 0.4% to 2.7% in 2018 and by 0.6% to 2.5% in 2019. The strengthening recovery in the Eurozone and Japan is also cause for greater optimism. Progress in structural reforms in key Emerging Market Economies (EMEs), along with a gradual increase in commodity prices, should keep growth in emerging markets resilient and buoyant. Considering these factors, the IMF increased its global economic forecasts for 2018 and 2019. The global economy is expected to grow by 3.9% in 2018 and 2019, 0.2% higher for both years compared to its previous forecast and the highest growth since 2011. |
Advanced economies are expected to grow by 2.3% in 2018 and 2.2% in 2019, up 0.3% and 0.4% higher compared to earlier projections. EMEs are forecast to grow solidly at rates of 4.9% and 5.0% in 2018 and 2019, respectively.
While there is optimism and confidence coming from the expansion in global trade that is currently taking root, a considerable amount of risk clouds the outlook. Prolonged uncertainty on long-standing free trade agreements like NAFTA and United Kingdom’s membership in the European Union (EU) is weighing down investment spending and productivity. Government, business and household indebtedness is stretched and increasingly sensitive to further interest rate increases.
Furthermore, as is always the case, unexpected international trade frictions can quickly derail the expansion in global trade, while a wider rise in geopolitical tensions could increase volatility in financial and commodity markets.
U.S.
The U.S. is Manitoba’s largest international market, accounting for 65% of merchandise exports in 2017. The pace of economic growth in the U.S. significantly picked up, during the last three quarters of 2017, averaging 2.9%, close to its historical norm of 3.1%. U.S. labour markets have tightened and the unemployment rate has fallen to 4.1%,
| | |
| | B U D G E T 2 0 1 8 E c o n o m i c R e v i e w a n d O u t l o o k / A 3 |
| | |
the lowest since January 2001. Average hourly earnings grew by a noticeably higher than expected 2.9% year-over-year increase in January. Recently, the higher than expected increase in earnings stoked concerns of inflation, leading to a sharp increase in bond yields and financial market volatility. Other factors that are fueling higher inflation expectation and a corresponding rise in borrowing costs include a positive momentum in the economy, large personal and corporate income tax cuts, and the proposed $1.5 trillion infrastructure plan. If providing stimulus in an already tight labor market leads to a substantial increase in inflation and higher interest rates, some of the boost to economic growth will be lost. On the other hand, increased U.S. demand could further support rising global demand and trade. | | U.S. Real GDP Growth, 2013–2019f 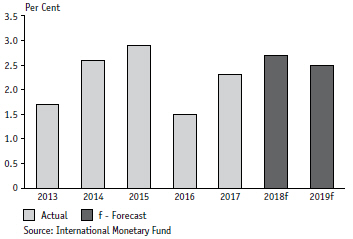
|
China
| | |
China is Manitoba’s second-largest global trading partner, accounting for 10.1% of total international merchandise trade in 2017. The Chinese economy is continuing its transition from investment and exports to consumer spending and services. The steady growth in the share of services to over half of the Chinese economy and accelerating consumer spending are indicative of the progress being made in rebalancing the economy. Significant headway in reforms in areas such as restructuring State-Owned Enterprises point to a more balanced and durable economic growth ahead. High indebtedness, especially at the sub-sovereign level and trade frictions between China and the U.S. are near term concerns. China, however, has monetary and fiscal policy space at the central government (federal) level to balance some of the risks. | | China Real GDP Growth, 2013–2019f 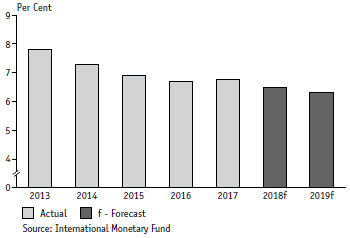
|
| | |
A 4 / E c o n o m i c R e v i e w a n d O u t l o o k B U D G E T 2 0 1 8 | | |
Japan
Japan is Manitoba’s third-largest overseas market with a 5.9% market share of international merchandise sales in 2017. Should a new Trans-Pacific Partnership agreement be reached, it would increase Manitoba’s trade with Japan and with the Asia-Pacific region.
Japan posted eight consecutive quarters of positive economic growth. Earnings growth is key to Japan’s economic recovery as consumer spending accounts for roughly 60% of the economy. Wages have improved and are likely to boost consumer spending going forward. Business investment is also picking up.
Interest rates are low in Japan and should be supportive of consumer spending and business investment. Government spending on infrastructure to host the 2020 Olympics will add to the economic momentum. As the global economy strengthens, Japanese exports to the rest of the world are also picking up. Despite the Bank of Japan’s accommodative policies, deflationary pressures remain.
Eurozone
The EU, which includes the Eurozone (countries using the euro as their currency), has the potential of becoming a significant trading partner of the province, with the Canada-European Union Comprehensive Economic and Trade Agreement (CETA) coming into force last September. The EU accounted for 4.3% of Manitoba’s total international merchandise exports.
Eurozone, buoyed by low energy prices, low interest rates and increasing exports, posted its best economic growth since the recovery began almost a decade ago. Consumer spending led the recovery and is expected to stay buoyant this year with steady gains in employment, rising wages and low interest rates. Exports should continue to grow with strengthening global demand. A tightening in production capacity should spur business investment spending in 2018.
THE CANADIAN ECONOMIC DEVELOPMENTS
The Canadian economy emerged from a year and a half of weak growth conditions at the end of 2016 and posted 3.0% real GDP growth in 2017, the highest among the G7 and more than twice the rate of 1.4% recorded in 2016.
The rebound was led by consumer spending, which increased by 3.5% in 2017, the largest increase since 2010. Business capital spending turned around and posted its first increase in three years. Growth in exports remained relatively steady, increasing by 1.0% both in 2017 and in 2016. Reflecting the strength in consumer and business spending, imports increased by 3.6%, the highest growth since 2011.
The acceleration in economic activity added 336,500 jobs in 2017, the best annual increase since the Great Recession. Quality of jobs materially improved. Roughly five out of six jobs were full-time and seven out of ten were in the private sector. Furthermore, the number of hours worked advanced 1.4% in 2017 compared to a gain of 0.8% in 2016. Average weekly earnings – a key driver of consumer spending – rebounded in 2017, increasing by 2.0% compared to a gain of 0.4% in 2016.
Despite a strong annual result for GDP growth in 2017, quarterly national economic accounts reveal a slower pace in the second half of the year. The deceleration was broad based among spending categories and indicates a leveling of demand following the transitory boost from an upturn in capital investment, low energy prices and from
| | |
| | B U D G E T 2 0 1 8 E c o n o m i c R e v i e w a n d O u t l o o k / A 5 |
larger Canada Child Benefit (CCB) transfers to households.
The current outlook factors in a slower pace of growth. After a lift from the CCB transfers and robust employment gains, consumer spending, which accounts for 57% of all expenditure in Canada, is expected to slow as interest rates continue to increase.
Strengthening global demand is expected to lift export sales and business investment in Canada, partially offsetting the weakness from the household sector. As a result, the Canadian economy is forecast to slow to 2.3% this year and to 1.8% in 2019. Nominal GDP is expected to increase by 4.1% in 2018 and 3.8% in 2019.
Economic and fiscal developments currently unfolding can materially change the outlook.
Canada Real GDP Growth,
2013–2019f
The uncertainty surrounding NAFTA, a trade deal that has been in place for almost a quarter of a century, can slow and discourage actual and planned investments in Canada. Major tax reforms in the U.S. and recent federal tax changes in Canada increase flight risks for capital, businesses and skilled workers from jurisdiction to jurisdiction.
Recent increases in interest rates, and the Bank of Canada’s (BoC) signal to move rates even higher, could reduce overall spending in the economy by more than expected. With relatively low interest rates in the past decade, a sensitivity to higher rates and higher debt servicing costs will be tested with each interest rate increase.
At the national level, consumers seem to be the most vulnerable to a downturn as they continue to add to household debt. The latest figures show the average Canadian household debt-to-disposable income at a record 172.1% in 2017. However, the BoC does have the flexibility to adjust interest rates down, as it did during the Great Recession and after the commodity price collapse in 2015.
A positive outcome on NAFTA combined with very accommodative U.S. tax cuts and infrastructure plan could boost capital investment and job creation in Canada. In addition, an acceleration in the broad based expansion in global trade could lift commodity prices and Canadian exports above current expectations.
MANITOBA ECONOMY
The Manitoba economy generates relatively stable annual economic growth over time, even during periods of increased volatility in financial and commodity markets. Over the long-term, the province maintained consistent average annual growth in most key economic indicators, including real GDP, employment and manufacturing sales when compared to other provinces.
Even with increased volatility, the trend in Manitoba’s 10-year average annual real GDP growth has been relatively stable over the last 15 years, while the national average has declined. The province surpassed the national average 10-year growth trend in 2009 and was the second highest among provinces in 2016.
| | |
A 6 / E c o n o m i c R e v i e w a n d O u t l o o k B U D G E T 2 0 1 8 | | |
Manitoba has been successful in attracting a record number of skilled workers, entrepreneurs and their families to the province. This has resulted in the province recording the fastest rate of population growth among provinces in the last three years. In 2017, the working age population exceeded 1,000,000 persons for the first time in Manitoba’s history. Moreover, population growth is providing confidence for investing in productive capacity and expanding domestic demand.
Also, in 2017, Manitoba posted a record level of capital investment in residential and non-residential buildings in the province. The number of housing starts were the highest level since 1987.
A number of other key performance indicators showed significant improvement in 2017:
| ● | | Total employment increased by 10,500 workers, the largest gain in 15 years. |
| ● | | Private sector jobs increased by 11,800 workers, the largest gain in 15 years. |
| ● | | Second-highest increase in average weekly earnings among provinces and the highest since 2014. |
| ● | | Labour income growth improved to 4.7% in 2017, compared to 0.8% in 2016. |
| ● | | Manufacturing sales increased by 5.3%, the best in six years. |
| ● | | Wholesale merchandise sales increased by 7.4%, the best since 2014. |
| ● | | Motor vehicle sales increased by 10.1%, the best in 15 years. |
| ● | | Truck and SUV sales increased by 15.4%, the best in 20 years. |
| ● | | Exports to Non-U.S. markets increased by 13.0%, the best in six years. |
| ● | | Manitoba crop farmers reported a record volume of harvest (bushels) in 2017. |
| ● | | Total farm cash receipts surpassed $6.5 billion in 2017, the highest ever in Manitoba. |
| ● | | Highest number of births since 1972. |
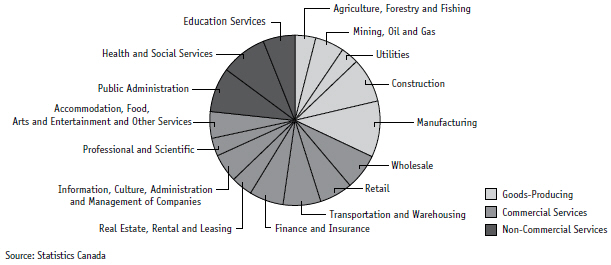
Manitoba GDP By Industry Shares, 2016
| | |
| | B U D G E T 2 0 1 8 E c o n o m i c R e v i e w a n d O u t l o o k / A 7 |
Reflecting this momentum, real GDP growth increased to 2.2% in 2017, up from 1.7% in 2016 and 1.3% in 2015. As some of the boost from transitory factors and prior commodity price shock ease, economic activity is expected to moderate to a sustainable pace going forward in Canada and in Manitoba.
The Manitoba economy will continue to benefit from a broad and balanced mix of medium-sized sectors. With the range in contribution from the smallest to largest sector being the narrowest among provincial economies, no single industry dominates overall production and jobs.
The strength of the Manitoba economy is not limited to its diverse economic base. Centrally located in North America, the province has a recognized and extensive manufacturing, wholesale trade, transportation and warehousing network that produces and distributes raw commodities and goods and services across Canada and globally. Almost half of the provincial exports are destined for foreign markets while the other half are destined for Canadian provincial markets. This distribution is the most balanced among provinces.
Diversity in markets and production lowers Manitoba’s foreign trade exposure for domestically produced goods and services as well as jobs. Furthermore, the mix of primary commodities, processed products and services contained in provincial exports reduces Manitoba’s overall supply chain dependence on imported items that are embodied in exports.
In this Economic Review and Outlook Report, annual, quarterly and monthly economic statistics are on a calendar year basis. These statistics are often revised and can change the assessment of economic performance over time.
Population
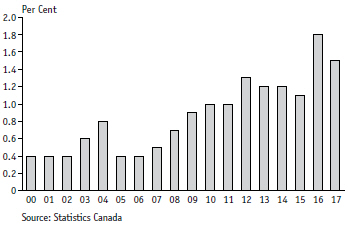
Manitoba’s population was estimated at 1,338,109 persons in 2017, an annual increase of 19,994 persons or 1.5%. This follows a record annual increase of 22,693 persons or 1.8% in 2016.
In the past decade, population increased by 1.2% annually, 50% higher than the long-term average rate of 0.8%. In the last three years, Manitoba showed the fastest population growth among provinces, averaging 1.5% annual growth, well above the national average of 1.1%.
Most of this growth is due to a concerted effort by the Manitoba Provincial Nominee Program (MPNP) to use immigration to recruit for labour market and entrepreneurial needs. The MPNP is an economic immigration program designed to attract job-ready skilled workers and active investors. It has been an important part of the immigration system since 1998.
The renewal of the MPNP is streamlining the application process to achieve better and quicker outcomes. It has already reduced application-processing time to under six-months and it has eliminated the $100,000 deposit previously required from business investors.
Manitoba’s Annual Population Growth,
2000–2017
| | |
A 8 / E c o n o m i c R e v i e w a n d O u t l o o k B U D G E T 2 0 1 8 | | |
Recent enhancements will make it easier for international students with a Manitoba education to build careers and settle in the province. Priority will be given to business investors who start a business within the first 12 months of their arrival in Manitoba, particularly those who start a business outside of Winnipeg. For skilled workers, priority will be given to candidates with close family connections in Manitoba and spouses who have the language proficiency, training and experience to quickly find in-demand jobs.
In addition to immigration, population growth has been increasingly supported by the natural rate of increase. Given a younger demographic arriving through immigration and the echo boom cohort maturing into the prime child rearing age, the number of births has increased to noteworthy levels. From a low of 13,764 births in 2001/02, the number of births has increased to a record 17,641 births in 2016/17.
As the proportion of younger people increase, the median age has declined, making Manitoba’s overall population age younger. The median population age peaked at 37.8 years from 2008 to 2013 and has since declined. In 2017, the median age fell to 37.4 years, the third lowest among provinces and below Canada (40.6 years).
The demographic dynamics are reflected in the labour market. Since 1990, Manitoba once again has the majority of the working age population in 20 to 29 year age cohort, surpassing the 50 to 59 year age cohort in 2016. The second-largest working age cohort is aged 30 to 39 years.
In addition, Manitoba has a proportionally higher share of youth in the population compared to other provinces. As a result, the labour supply is expected to continue to increase over the medium term.
Labour Market
Displaying the smallest swings in annual average growth, Manitoba’s labour market is the most stable in Canada. It reflects a balance in supply and demand, with employment and labour force growing at a steady 1.0% annual pace since 1976.
Manitoba’s Employment Level, Quarterly Average Fourth Quarter 2014–Fourth Quarter 2017
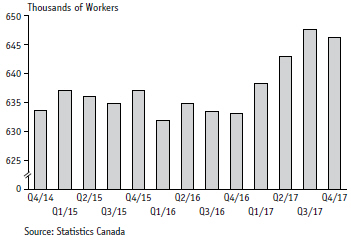
The labour market has shown resilience in absorbing a record increase in population, while maintaining the second-lowest unemployment rate and the third-highest labour force participation rate in Canada.
Last year was an exceptional year for Manitoba’s labour market. The number of working age Manitobans surpassed 1,000,000 individuals for the first time. The number of jobs increased by 10,500, the largest gain in 15 years. An average of 644,100 workers were employed during the year, the highest ever.
Most of the employment growth was due to full-time jobs, which increased by 9,200 or 1.8%. Part-time employment increased by 1,300 workers, or 1.1%. Youth employment increased
| | |
| | B U D G E T 2 0 1 8 E c o n o m i c R e v i e w a n d O u t l o o k / A 9 |
by 2,200 jobs, the first increase in three years and the largest increase in 11 years. Employment growth in the private sector was exceptionally strong and rose by 11,800 workers, or 2.5%. This was the largest increase in private sector jobs in 15 years.
The strong growth in jobs reduced the number of unemployed by 4,600 workers, the largest annual reduction in the number of unemployed since 1998. It also cut the unemployment rate for 2017 to 5.4% from 6.1% in 2016.
The service sector added 9,700 jobs or 92% of all the jobs in 2017 and the goods producing sector added 800 jobs. The leading job creating industries were finance and insurance (3,500), retail trade (1,600), business, building and support services (1,200), construction (1,200), transportation and warehousing (1,100) and mining and oil extraction (1,000). Some of the gains were offset by losses in utilities (-1,000), forestry, logging and fishing (-500), real estate and leasing (-400) and agriculture (-300).
As the labour market tightened, compensation for employees improved in 2017. Average weekly earnings rose by 2.4% in 2017 after gaining 1.0% in 2016. Correspondingly, labour income increased by 4.7% last year following a 0.8% gain in 2016.
Housing
Residential investment is an important component of the provincial economy. In 2017, capital investment in residential structures was estimated at a record $4.4 billion, or 6.2% of total nominal expenditures in the province. These expenditures include spending on new housing construction, renovations and acquisition costs.
Rapid increases in home prices in some Canadian cities has brought housing affordability into sharper focus in Canada. In contrast, housing remains very affordable in Manitoba. Housing Trends and Affordability is a quarterly publication by Royal Bank of Canada (RBC) on housing affordability in Canada’s major cities. In its latest report, RBC notes affordability in Winnipeg remains roughly in line with its long-term trends.
Manitoba’s Housing Starts,
Quarterly At Annual Total Units
Fourth Quarter 2014–Fourth Quarter 2017
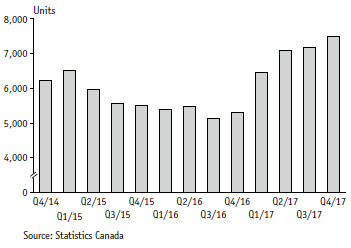
Housing affordability in Winnipeg is further illustrated by the low prices of housing in the city. According to RBC’s report, the average price of a single-family detached home and condominium apartment in the city are $314,900 and $246,900, respectively, making them the third most and second most affordable in their respective categories among the cities tracked by the report.
Manitoba’s new housing market picked-up in 2017. With growing demand, supply responded with housing starts increasing by 41% in 2017 to 7,501 units, the highest since 1987. The increase was partially motivated by the new
| | |
A 10 / E c o n o m i c R e v i e w a n d O u t l o o k B U D G E T 2 0 1 8 | | |
City of Winnipeg impact fee, which advanced housing starts in Winnipeg. However, construction was strong not just in Winnipeg, but also throughout Manitoba. Total starts increased by 39% in Winnipeg and by 49% elsewhere in 2017.
The overall housing market in Manitoba has been on a positive trend since the early 2000s, but a number of factors led to a historical increase in new residential construction in the early years of the post-Great Recession recovery. Housing starts topped the 7,000 mark in both 2012 and 2013, the highest since the mid-1980s when the baby boom cohort purchased homes.
The surge in 2012 and 2013 led to some overbuilding, especially in smaller cities and rural Manitoba, where absorption rates are slower. As a result, provincial housing starts fell in 2014 and 2015.
Factors driving new housing include record international immigration, echo boom cohort purchasing homes, low mortgage rates, demand for independent housing for seniors and general affordability of housing in the province compared to other regions of Canada.
Given the strong population growth and high number of sales every year, the increased housing supply will be absorbed, but the total number of starts are expected to decline in 2018 as construction returns to more balanced conditions. According to the forecast survey, housing starts in Manitoba should average 6,200 in 2018 and 6,500 in 2019. This is expected to lower housing investment spending in 2018.
A number of external factors, however, has elevated uncertainty in Manitoba’s housing market. To cool the Canadian housing market, the federal government, through the Department of Finance, the Office of the Superintendent of Financial Institutions (OSFI) and the Canada Revenue Agency, has imposed a number of measures.
These measures include stress testing all new mortgage applicants on their ability to service mortgages in a rising interest rate environment and restricting capital gains tax exemptions from the sale of a house to just one transaction per year for Canadian citizens and permanent residents.
Furthermore, the move by the BoC to raise interest rates will increase the cost of holding a mortgage. The 0.75% increase in rates in the last nine months has already pushed up the benchmark 5-year conventional mortgage rate from 4.64% in June 2017 to 5.14% in January 2018.
Manufacturing
Manufacturing is Manitoba’s largest industrial sector accounting for 9.7% of total economic output (real GDP at basic prices). Manufacturers employ 10% of all workers in the province and contribute almost 11% of total wages and salaries. The sector spent over $550 million annually, on average in the last three years, on construction and on machinery.
Manitoba’s manufacturing sales passed the $18 billion mark in 2017 to $18.3 billion, up from $17.4 billion in 2016 and beating the record for sales established in 2014. The growth rate was 5.3% in 2017, the highest growth in six years. The increase in 2017 is well above the 1.5% average annual pace in the previous five years.
Last year’s growth in manufacturing sales was broad-based with over two-thirds of the reporting manufacturing industries posting higher sales.
| | |
| | B U D G E T 2 0 1 8 E c o n o m i c R e v i e w a n d O u t l o o k / A 11 |
Manitoba’s largest manufacturing industry is food processing. Sales in this industry rose by 5.1% in 2017 following a 4.4% increase in 2016. Over the past decade, this industry has grown and diversified, and now produces a broad range of non-durable consumer products such as processed meat, dairy products, frozen french fries, grain and oilseed products, agricultural feed products and a variety of vegetables.
Food processing is also getting a boost in Manitoba. With recent developments, the industry is expanding and further diversifying. Roquette’s is constructing a new $400 million pea-protein production facility near Portage la Prairie that will begin production in 2019. The new facility will be the largest in the world with a capacity to process 120,000 tonnes of peas annually.
Manitoba’s Manufacturing Sales, Quarterly Total Sales Fourth Quarter 2014–Fourth Quarter 2017
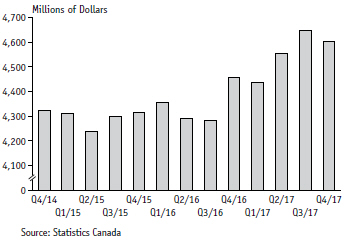
In addition, Simplot confirmed a $460 million expansion plan to more than double its food processing capacity for frozen french fries and formed potatoes in the province. When completed in 2019, the footprint of its Portage la Prairie facility will increase from 180,000 to 460,000 square feet. These two new facilities will not only add value to Canadian grown peas and potatoes, it will create close to 240 permanent jobs.
Transportation equipment, the province’s second-largest manufacturing industry, recorded 9.3% growth in sales to over $3 billion for the first time. This industry specializes in aerospace products, parts and repair and heavy vehicle production. Manitoba has the third-largest aerospace industry in Canada. Three multinational firms underpin this industry: Boeing Canada Technology, StandardAero and Magellan Aerospace, as well as a number of other established regional and national firms.
Manitoba’s heavy vehicle-manufacturing sector focuses on producing buses, fire trucks, motor homes, recreational vehicles and trailers. Manitoba is home to North America’s largest manufacturer of inter-city coaches and urban transit buses for the Canadian and U.S. market. The province also has Canada’s largest manufacturing facility of fire-fighting equipment including fire trucks, custom-built pumpers, aerial ladders and water delivery tankers.
Machinery manufacturing, the province’s third-largest manufacturing industry, staged a remarkable turnaround in 2017. After declining in the previous two years by over 14%, sales accelerated by 9.7% in 2017. The sharp increase was a result of a rebound in demand for agricultural, construction and mining machinery. Manitoba’s machinery manufacturing is largely concentrated in the production of agricultural machinery and equipment. Manitoba has the only farm tractor manufacturing facility in Canada and the largest manufacturer of windrowers (swathers).
Sales from electrical equipment, appliance and component manufacturers increased by 13.7% in 2017. Other industries which reported strong gains include fabricated metals (10.2%), printing (6.3%) and primary metals (3.6%). Two reporting industries saw sales decline in 2017. Furniture manufacturing sales slipped by 1.2% followed by wood product sales declining 0.6%.
| | |
A 12 / E c o n o m i c R e v i e w a n d O u t l o o k B U D G E T 2 0 1 8 | | |
Most of the manufactured products from Manitoba are sold outside of the province, with the bulk going to the international markets. Reflecting weaker international demand following the Great Recession, the share of domestic and interprovincial sales of manufactured products have increased while international sales share has declined. The key international markets are U.S. China, and Mexico, while the key provincial markets are Ontario, Alberta and Quebec.
Based on the international and interprovincial trade flow information released by Statistics Canada in June 2017, from 2010 to 2014, 78% of manufactured products were exported. On average, 41% were shipped to international markets while 37% were sold in interprovincial markets. The remaining 22% were used either as inputs or as final products within Manitoba.
Agriculture
Agriculture is an important contributor to Manitoba’s economy. Crop, livestock and agri-food enterprises produce a variety of raw commodities and processed products. Agriculture in Manitoba has built a solid and durable network with food manufacturing, transportation and warehousing, retail trade, wholesale trade, as well as finance, insurance and real estate sectors.
Primary agriculture (crops and livestock) represents 3.6% of Manitoba’s industrial output, while food and beverage manufacturing represents 1.9% of Manitoba’s industrial output, for a combined contribution of 5.5%. These two sectors generated a record of approximately $10.8 billion in sales last year.
The scale of agriculture in Manitoba is relatively large. According to Statistics Canada, land use for agriculture in 2016 (both improved and unimproved land) totaled over 17.6 million acres. About 11.5 million acres (46,661 square kilometers) or 65% was used for crop production and 3.3 million acres or 19% was used for livestock pasture. Manitoba’s land use for agriculture and for crop production accounts for 11% and 12% of the Canadian total, respectively.
Given the scale of the operations, Manitoba represents a significant share of the total Canadian supply of crops (grains and oilseeds) and livestock. In 2017, Manitoba produced 100% of Canadian sunflower seeds, 35% of rye, 29% of soybeans, 22% of potatoes, 22% of oats, 15% of canola and 15% of wheat. The number of hogs and pigs on Manitoba farms represented 24% of the Canadian total while cattle and calves represented 9%.
With close proximity to raw materials, skilled workers and a competitive cost environment, food processing continues to grow in Manitoba, with new investment in pea and potato processing facilities. This increases value-added processing of Canadian grown agricultural commodities and jobs in the province.
Statistics Canada’s supply and use tables show that on average 40% of agricultural commodities are domestically used, while 60% are exported (38% international and 22% interprovincial). Once the commodities are processed into food and beverage products, a larger share is exported. On average 70% of the processed food and beverage products are exported in a somewhat even share, 35% to international and 30% to interprovincial markets. The remaining 30% are used within Manitoba.
The key international markets for Manitoba’s primary agricultural commodities are the U.S., China, Japan, Mexico and European Union. The key interprovincial markets are Ontario, Alberta, Saskatchewan and British Columbia.
Production and market conditions were favourable for Manitoba agriculture in 2017. Crop producers reaped a record harvest; cattle, calves and hog producers increased the number of livestock on their farms.
| | |
| | B U D G E T 2 0 1 8 E c o n o m i c R e v i e w a n d O u t l o o k / A 13 |
| | | | |
Estimates from Statistics Canada indicate higher than expected crop yields and an overall record in the volume of grains and oilseeds produced in 2017. Compared to the 2016 harvest, crop production increased for dry beans (63%), oats (44%), soybeans (27%), canola (21%), sunflower seeds (14%), corn (9%) and wheat (4%). Production for peas (51%), flaxseed (-34%), barley (-26%) and rye (-18%) declined in 2017. In Manitoba, farmers reported record soybean production for the sixth consecutive year, up 26.9% from 2016 to 2.2 million tonnes in 2017. This was entirely the result of a 45.1% increase in harvested area to a record 2.3 million acres. Through over a decade of significant challenges in the livestock sector (the bovine spongiform encephalopathy crisis, U.S. Country of Origin Labeling trade restrictions, rising costs, severe weather conditions and porcine epidemic | | | | Manitoba’s Marketed Farm Cash Receipts, Quarterly Total Sales Fourth Quarter 2014–Fourth Quarter 2017 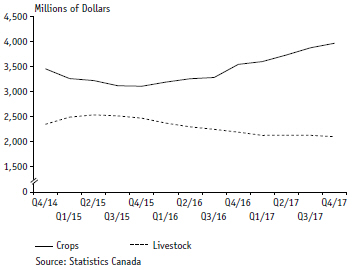
|
diarrhea outbreak), cattle farms significantly curtailed their operations in Manitoba. The number of cattle and calves fell from a record 1,735,000 head in 2005 to 1,155,000 head in 2015, a one-third reduction in scale.
In an effort to rebuild capacity in the industry, Manitoba Agriculture is engaging stakeholders to gain their input and leadership in developing a Livestock Growth Strategy for Manitoba. One of the goals in the strategy includes a ten-year growth target to increase the number of beef cows on Manitoba farms from 430,000 head in 2015 to 574,000 head in 2025. Last year’s results were encouraging, showing the first notable turnaround in cattle and calves production, with the inventory increasing by 1.7%, the largest increase since 2004.
Hog production, which requires a shorter gestation period, can adjust to market conditions quicker. The hog inventory in Manitoba fell quickly and sharply in 2008 and 2009, and took eight years, until 2015 to recover. Production has continued to increase and has almost caught up to Ontario (3,444,000) with inventory at a record of 3,340,000 pigs in 2017, the third highest among provinces following Quebec and Ontario.
Agricultural commodity prices are mostly determined in the broader external market. Crop prices are influenced by global supply and demand conditions, while livestock prices react to Canadian and U.S. market conditions. Both crop and livestock prices have generally declined from record or near record levels as supply conditions exceeded demand. As demand conditions improved, prices have stabilized with modest gains in 2017.
Gains in crop and livestock production led to a record increase in farm cash receipts. Total farm cash receipts increased by 8.8% in 2017, the highest growth among provinces. In 2017, total farm cash receipts rose to a record $6.5 billion. Cash receipts from wheat, canola and hogs exceeded $1.0 billion in 2017.
The Comprehensive Economic Trade Agreement (CETA) between Canada and the EUs is expected to support agriculture in Manitoba. CETA will improve market access for key agricultural product exports, such as meats, grains,
| | |
A 14 / E c o n o m i c R e v i e w a n d O u t l o o k B U D G E T 2 0 1 8 | | |
oilseeds, fruits, vegetables and processed products. With CETA’s provisional application, almost 94% of the EU’s agricultural tariff lines are now duty-free. Canadian beef, pork, bison and sweet corn will also benefit from annual duty-free tariff rate quotas.
Wholesale Trade
Wholesale merchants have benefited from Manitoba’s central location and Manitoba’s transportation hub, which links Eastern Canada, Western Canada and the U.S. Midwest. Wholesale trade, as an essential part of the Prairie economy, contributes in the distribution of farm products and agricultural supplies.
Wholesale trade is the second-largest commercial services sector in Manitoba, generating 6.2% of Manitoba’s total industrial output. Only Ontario has a larger wholesale sector, contributing 6.9% of the provinces output. Record levels of capital spending on facilities and machinery have contributed to expand the scale of wholesale trade in the province. From 2009 to 2017, spending on construction increased by 24% annually, while spending on machinery and equipment increased by 18% annually.
In 2017, wholesale merchants employed almost 21,000 workers, or about 3.2% of all employees in Manitoba. Workers in the sector earned on average $1,123 per week in 2017, approximately 23% higher than the overall industrial aggregate of $910 per week.
Like the broader Manitoba economy, wholesale trade is relatively balanced. There is a cluster of large merchant wholesalers who contribute to between 12% to 21% of total sales, and another cluster of medium-sized wholesalers who contribute to between 6% to 8% of total sales.
Manitoba’s Wholesale Trade Sales,
Quarterly Total Sales
Fourth Quarter 2014–Fourth Quarter 2017
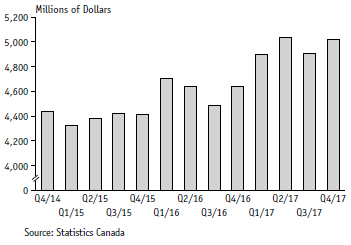
A bumper crop combined with an increase in business investment and consumer spending accelerated sales in 2017. Total sales from wholesale trade reached almost $20 billion in 2017, a 7.3% increase from 2016, and the fastest pace recorded since 2014.
Sales of machinery, equipment and supplies, which account for 21% of total sales in wholesale, increased by 10.5% to over a record $4.1 billion in 2017. Construction, mining and industrial machinery sales marked a notable rebound of 8.2% growth in sales after declining in each of the previous two years. Farm, lawn, garden machinery and equipment sales increased by 4.1% in 2017 following 8.2% increase in 2016.
Agriculture supplies merchants, distributors of agricultural feed, seed and chemicals, have experienced exceptional growth in sales over the last eight years. Sales rose by 12.7%
| | |
| | B U D G E T 2 0 1 8 E c o n o m i c R e v i e w a n d O u t l o o k / A 15 |
annually over this period, to $3.5 billion in 2017. Agriculture supplies sales increased by 6.1% in 2017 and now account for almost 18% of total wholesale trade sales.
The record volume of grain and oil seed harvest helped boost sales of farm products sales by 20.8% in 2017. Other wholesale merchants who reported gains include motor vehicle and parts (9.1%), food, beverage and tobacco (9.1%), personal and household goods (2.5%) and building materials and supplies (2.5%).
Mining and Oil Production
Mining and petroleum sector is the largest primary resource industry in the province; it generated 5.0% of the total industrial output in 2016.
The principal metallic minerals produced in Manitoba are nickel, copper, zinc and gold. Other metals produced include silver, platinum, cobalt, selenium, cesium and tellurium. Industrial mineral production consists principally of sand and gravel, stone, peat moss and lime, as well as granite, gypsum and limestone. Manitoba produces a light sour blend of crude oil that is exported via pipeline and by rail to refiners in eastern Canada, the northeast and north-central areas of the U.S.
Manitoba Mining Investment, 2009–2017
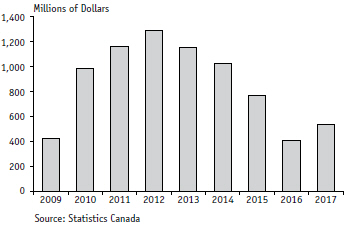
The global volatility in oil and base metal prices continues to exert a significant impact on the provincial mining sector, with sales consistently declining since 2011. With current prices well below the peak levels, total nominal value of mining and oil production totaled $2.2 billion in 2016, down close to $1.0 billion or 31.4% from the record in 2011. Petroleum output fell the most, declining by $141 million, or 16%, to $750 million in 2016. Offsetting the aforementioned decline, both metals and non-meatal mining increased in 2016. Metals mining advanced by $46.2 million, or 4.3%, to $1.113 billion, while non-metals mining advanced by $23.8 million, or 8.5%, to $304.3 million in 2016.
Capital spending in the mining sector is an important contributor to economic growth. When commodity prices were increasing and remained at high levels, capital spending in Manitoba accelerated at an exceptional compounded annual growth rate of 45% between 2009 and 2012 to $1.3 billion. Spending remained above $1.0 billion in 2013 and 2014, but as commodity prices fell, total investment dropped to $407.7 million in 2016. Spending was almost evenly divided in oil extraction, mining and quarrying.
According to the latest available Annual Capital and Repairs Expenditures survey published by Statistics Canada, mining investment broke a four-year trend of declines and increased by roughly 32% to $537.5 million in 2017.
Results for the volumes of production for Manitoba’s largest metals were mixed in 2017. Production volumes of gold and zinc surged in 2017 by 24.1% and 19.3%, respectively. Copper and Nickel production volumes, on the other hand, fell by 11.6% and 12.6%, respectively.
| | |
A 16 / E c o n o m i c R e v i e w a n d O u t l o o k B U D G E T 2 0 1 8 | | |
Prices for metals and minerals are improving, but remain well below the highs seen in the early part of the economic recovery. As a result of lower prices, depletion of reserves and environmental regulations, operations at three mines in Northern Manitoba have been affected. Citing weak nickel prices, Vale Canada put its Birchtree mine operations in Thompson under care and maintenance in October 2017. Vale is also slated to close its smelter and refinery in Thompson in July 2018 due to changes in federal environmental regulations. As a result of the Birchtree closure, 6k tonnes a year of nickel production is expected to be lost or delayed.
Citing depletion of reserves, Hudbay Minerals Inc., the operator of Reed mine, announced that it will close the mine in late 2018. The closure of Reed mine will decrease annual copper production in the province by 15k tonnes. The company also announced that it intends to close the 777 mine in late 2020. Should the 777 mine be closed as planned, it would lead to the decrease of 51k tonnes of zinc and 25k tonnes of copper production annually.
A number of projects, currently in their advanced development stages, could help offset the aforementioned. An example is the Lynn Lake Project by Alamos Gold, which recently concluded a positive feasibility study that estimated the mine could produce 143,000 ounces of gold, on average, per annum during its expected mine life span of 10.4 years. Another is Minnova Corporation’s Puffy Lake Project. A preliminary economic assessment conducted by the firm concluded that the project has the potential to produce 48,100 ounces of gold per annum over a 10+ year mine life.
The new provincial mineral development protocol, agreed to by the provincial government and First Nation communities, should further enhance Manitoba’s reputation as a top-tier destination for mining investment. By clearly defining a pathway forward and by engaging First Nation communities in the various phases of mineral development, the new mining protocol provides a stable and predictive consultation process.
The protocol ensures that Manitoba is informed of, and addresses potential adverse effects to the exercise of Aboriginal and Treaty rights and shares with First Nation communities the benefits of mineral development.
As a result of widening global demand and supply imbalances, international crude oil prices fell sharply between mid-2014 and late 2016. Reflecting these factors, crude oil production in the province also fell from an all-time record of 3.06 million m3 in 2012 to 2.33 million m3 in 2016.
International Merchandise Exports
Manitoba’s international merchandise exports amounted to $13.8 billion in 2017. This international export information is compiled from administrative records used by customs agencies and does not include foreign exports of services, investment income, capital and financial flows. At the provincial level, this monthly information is often subject to large revisions and as a result, the assessment of trends could materially change.
The Manitoba economy tends to have lower exposure to international trade compared to the national economy. In information published by Statistics Canada in June 2017, 19.2% of total industrial output from Manitoba was driven by foreign demand in 2013 (latest available), well below the national average of 21.7%. International demand accounted for 10.7% of all jobs in Manitoba. This compares to 14.5% national average.
The drop in oil and other commodity prices in 2014 and 2015 stalled the steady expansion in international merchandise exports from Manitoba, particular to the two main markets, U.S. and China.
While low commodity prices are disproportionately affecting commodity producing regions, they are supporting all regions by lowering inflation and lifting demand. Linking to this demand, Manitoba’s international exports
| | |
| | B U D G E T 2 0 1 8 E c o n o m i c R e v i e w a n d O u t l o o k / A 17 |
| | | | |
rebounded by 2.6% in 2017, more than reversing the 2.0% decline in 2016 and setting a new record for sales. Exports to Non-U.S. regions accelerated by 13.0% in 2017, the best in six years. Exports to nine of the top-10 Non-U.S. countries reported gains in 2017. The U.S. is Manitoba’s largest international market accounting for 64.8% of merchandise exports in 2017. The main U.S. markets in 2017 were Minnesota and Illinois, each accounting for over 10% of total U.S. sales. Other U.S. states accounting for a 5% share or more included Texas, North Dakota, Tennessee, California and Iowa. Manitoba’s second largest foreign market was China accounting for 10.1% of foreign sales in 2017. This was the first double-digit export share to | | | | Manitoba’s International Merchandise Exports, Quarterly At Annual Total Exports
Fourth Quarter 2014–Fourth Quarter 2017 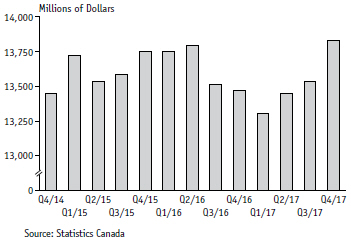
|
China, beating the previous record of 8.5% from 2012. Merchandise trade to China expanded rapidly from 2004 to 2011, but has since leveled.
Other key international markets in 2017 were Japan with a 5.9% share of international merchandise exports followed by the EU at 4.3% and Mexico at 2.9%.
Export sales to China marked an exceptional rebound. After declining in the past three years by 7.3%, sales to China jumped by 45.5% in 2017, the best one-year increase in 10 years, to a record $1.4 billion. Exports to Japan and Mexico also posted impressive gains of 9.6% and 11.3%, respectively, in 2017.
Low prices and weak demand among other factors continue to impact U.S. sales, particularly for primary products. Exports have declined in each of the past two years by a total reduction of 6.1%. This erased most of the gains from the previous four years and lowered total sales to just under $9 billion. Sales from mining and oil extraction declined to only $156 million in 2017 from over $1.0 billion in 2014. Sales from agriculture fell to $886 million down from $1.4 billion in 2014.
The diversity in exports of manufactured products has moderated the overall slowdown in sales to the U.S. Total manufacturing exports increased 1.2% in 2016 and declined by 0.8% in 2017. Large declines in chemical products, primary metal products and paper products were offset by gains in two of the largest manufacturing industries, food products and transportation equipment.
The growth in international exports to a wide range of countries in 2017 provides much optimism that Manitoba’s export sector will continue to broaden its base and reduce its exposure from any single market. The recent trade agreement with the EU will further advance this goal. Under this new trade agreement, 98% of tariff lines are duty free and 99% of tariff lines will be duty free within seven years. Prior to agreement, only 25% of EU tariff lines were duty free.
This agreement will provide expanded export opportunities for Manitoba beef, pork, wheat, canola, freshwater fish and electronics sectors. Manitoba’s services sector, the largest sector in Manitoba’s economy, will also
| | |
A 18 / E c o n o m i c R e v i e w a n d O u t l o o k B U D G E T 2 0 1 8 | | |
have preferential access to the EU services market. This access is expected to benefit service sectors, such as construction engineering and architectural services. Furthermore, the trade agreement offers Manitoba firms the opportunity to bid on contracts in European government procurement markets, which alone is estimated to be worth $3.3 trillion annually.
The likelihood of reaching a deal on a new Trans-Pacific Partnership (TPP) trade agreement is increasing. The eleven remaining countries of TPP concluded discussions and finalized the text of the agreement in January 2018. Should a new TPP deal be reached, it would afford Manitoba exporters access to some of the fastest-growing, populous and prosperous regions in the Asia-Pacific region.
MANITOBA OUTLOOK
The positive growth in 120 countries around the world is progressively expanding demand for goods and services and creating jobs. It prompted the IMF to lift its global growth forecast to 3.9% in 2018 and 2019, the strongest in six years.
In Manitoba, the recovery from the prior commodity price shock, stronger local, interprovincial and international demand increased growth to 2.2% in 2017, a sharp improvement from 1.3% growth in 2015.
As demand conditions return to a more sustainable level, growth is expected to remain relatively stable in the outlook. In addition, the balance in Manitoba’s interprovincial and international trade combined with the broad and diverse industrial base will continue to minimize fluctuations in annual growth. The current Manitoba Finance Survey of Economic Forecasts calls for 2.0% growth in 2018 and 1.6% in 2019. Nominal GDP is projected to increase by 3.8% in 2018 and by 3.5% in 2019.
There are many risks to the Manitoba outlook. NAFTA negotiations resulting in a significant alteration in trade could have lasting impact on economic activity in all three member countries. The behavioral impact from increasing interest rates and major tax changes in the U.S. and Canada could have a material impact on capital and labour mobility.
However, the strengthening global economy is encouraging and could elevate commodity prices, international export demand and investment in Manitoba above current expectations. The spinoffs from investing approximately $860 million in Manitoba’s food processing capacity is expected to accelerate spending in rural Manitoba. In addition, the exceptional pace of growth in population and the record number of workers in Manitoba could provide a larger than expected support for domestic demand.
| | |
| | B U D G E T 2 0 1 8 E c o n o m i c R e v i e w a n d O u t l o o k / A 19 |
Manitoba Outlook at a Glance
| | | | | | | | | | | | |
| | | 2017 | | | 2018f | | | 2019f | |
| | | (Per Cent Change Unless Noted) | |
Gross Domestic Product | | | | | | | | | | | | |
Real | | | 2.2 | | | | 2.0 | | | | 1.6 | |
Nominal | | | 4.3 | | | | 3.8 | | | | 3.5 | |
Employment | | | 1.7 | | | | 0.8 | | | | 0.5 | |
Unemployment Rate (%) | | | 5.4 | | | | 5.3 | | | | 5.3 | |
Consumer Price Index | | | 1.6 | | | | 2.1 | | | | 2.1 | |
Population | | | 1.5 | | | | 1.2 | | | | 1.3 | |
f – Forecast
Sources: Statistics Canada, Manitoba Bureau of Statistics and Manitoba Finance Survey of Economic Forecasts (2018f–2019f)
| | |
A 20 / E c o n o m i c R e v i e w a n d O u t l o o k B U D G E T 2 0 1 8 | | |
CHANGING ECONOMIC AND FISCAL LANDSCAPE
The general economic outlook is subject to risks, including from tax policy developments in the U.S. and Canada, the ongoing North American Free Trade Agreement (NAFTA) renegotiations and rising interest rates.
In the biggest tax overhaul since 1987, the U.S. government deeply cut personal and corporate income taxes in 2018. Newly introduced measures lowered statutory rates for most personal income brackets and increased standard deductions that increase disposable incomes and spurs economic growth.
U.S. corporate tax relief in the form of deductions for certain businesses and a 14 percentage point reduction in the corporate tax rate from 35% to 21% is expected to encourage business investment, increase profitability, repatriate capital and heighten the competitiveness of the American economy.
The following chart shows the competitive edge for the U.S. relative to Canada and the Organisation for Economic Co-operation and Development (OECD) countries when comparing the combined average national and subnational corporate income tax rates:
| | | | |
Corporate Income Tax Rates Canada, U.S., OECD 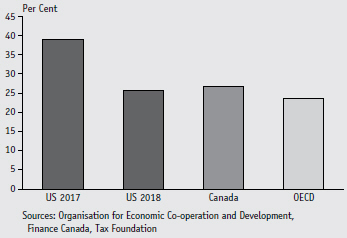
| | | | Manitoba remains competitive compared to key U.S. trading partners on the small business tax rate. Manitoba’s small business tax rate is currently at 0% on income up to $450,000, which will increase to $500,000 in 2019. Manitoba’s general corporate income tax rate of 12% is above the average of our key U.S. trading partners but remains below the 13% Canadian provincial average. The combined Manitoba and federal general corporate income tax rate of 27% is comparable to the 26.6% median of our ten largest U.S. state trading partners. On personal income taxation, the U.S. tax reforms reduced the tax rates and adjusted the thresholds applicable on most incomes. For individual states that |
tax personal income, the top combined U.S. federal-state rate was reduced to around 42.5%, down from 45%. In comparison, the current combined Canadian federal-provincial income tax rate in Canada averages 50%, and 50.4% in Manitoba.
In Canada, recent federal changes have increased the tax burden for some taxpayers. Measures announced in December 2015 raised taxes on top earners from 29% to 33%, which resulted in significant tax planning activity that shifted personal income from one year to another. In its most recent Budget, the federal government acknowledged that high-income individuals recognized additional income in the 2015 tax year and lower income in the 2016 tax year when the 33% tax bracket came into effect.
Tax planning behaviour that moved additional income from 2016 to 2015 has generated significant variances in budgeted revenue for the federal government, provinces, and territories, adding volatility in estimating government revenue. In Manitoba, the increase in the top federal tax rate has resulted in tax planning that attributed $160 million in positive variance in personal income taxes in 2016/17 and is lowering them by approximately $262 million in 2017/18.
| | |
| | B U D G E T 2 0 1 8 E c o n o m i c R e v i e w a n d O u t l o o k / A 21 |
As initially signalled in Budget 2017, and confirmed in Budget 2018 following brief consultations over the summer of 2017, the federal government has increased taxes on many private corporations, in particular, related to income splitting and passive investments. These measures will further complicate reporting and estimating personal and corporate income tax revenues given the anticipated tax planning and reconfiguration of corporate structures.
“The US tax reforms are anticipated to reinforce these uncertainty effects and dampen investment growth further. Firms may decide to redirect some of their planned investment spending from Canada to the United States to benefit from the lower corporate taxes. The negative effects of US tax reforms on Canadian investment...are expected to subtract 0.5 per cent from the level of investment by the end of 2019.”
—Monetary Policy Report, January 2018, Bank of Canada
“The reduction in corporate tax rates will put American companies on par with major trading partners in Europe and Canada. Meantime, the ability to fully expense investments should extend the upswing in business spending. A tax break to repatriate foreign earnings will also help, even if companies do not need the funds to finance investments given resurgent profits and record liquid assets. Companies are already using their tax windfall to lift worker pay.”
—North America Outlook, February 7, 2018, BMO Capital Markets
“The complexity of both TCJA [U.S. Tax Cuts and Jobs Act] reforms and the numerous non-tax factors that drive investment and labour mobility decisions make it difficult to gauge the potential impacts on Canada. Mobility of capital tends to be higher than labour, which along with growing NAFTA uncertainties, increases the likelihood of a slow bleed of investment from Canada to south of the border.”
—The Implications for Canada of U.S. Tax Reform, February 12, 2018 TD Economics
“This leads us back to one of the major issues we have discussed over the past year – trade. In our opinion, US protectionism was already bad for Canada. Whether NAFTA is successfully re-negotiated or not, businesses will be somewhat tentative on betting too heavily that Canadian exports have long-term, unfettered access to the US. With a revitalized tax code, CEOs have another reason to locate in (or worse yet, relocate to) the US.”
—US Tax Reforms And Its Negative Consequences, February 12, 2018 CIBC Capital Markets Inc.
The economic situation is also rapidly changing. After almost a decade of ultra low interest rates, many leading central banks around the world are raising them. The U.S. Federal Reserve started in December 2015 and has raised rates four times, for a cumulative increase of 1.25%. The Bank of Canada (BoC) raised bank rates by 0.75% over the same period.
Canadian and U.S. monetary authorities have both signalled further rate increases in a process to normalize rates to where inflation remains in check. Rates could be lowered to support growth should recession condition re-emerge.
The fact that rates have been so low for so long, businesses, households and governments have developed long-term plans based on a low interest rate environment. Bond yields, loans, mortgages and credit rates are currently all established at relatively low interest rates. As these instruments mature and adjust to higher interest rates, the higher servicing costs will lower expenditures in the economy. For highly leveraged instruments, the possibility of defaults increase at every interest rate increase, even at small increments.
| | |
A 22 / E c o n o m i c R e v i e w a n d O u t l o o k B U D G E T 2 0 1 8 | | |
As interest rates increase, household spending is likely to slow, especially for big-ticket items, such as homes and vehicles. Higher credit card charges could also affect discretionary spending. For businesses, the risk return decisions may curtail capital spending if returns from fixed guaranteed investments become attractive. Government finances will also come under stress as new bond issues and refinancing will be at higher interest rates.
As evidenced by the increased volatility in the financial markets that is due to expectation of higher inflation rate and corresponding higher interest rates, the timing of interest rate increases can quickly slow economic growth. Given the elevated level in indebtedness, economic forecasts are currently factoring in slower economic growth over the medium term due to higher interest rates.
The ongoing negotiations to modernize North American Free Trade Agreement, a free trade agreement between the U.S., Canada and Mexico, currently seem far from a conclusion. Major issues remain unresolved between the three trading partners on areas, such as auto content, supply management, government procurement, the dispute resolution mechanism and the sunset clause.
The prolonged uncertainty on this trade agreement, that has been in place for almost a quarter of a century, and has benefited businesses and workers in all three countries, has lowered investment intentions. According to the BoC, trade policy uncertainty is expected to reduce the level of investment in Canada by about 2% by the end of 2019.
These economic and fiscal dynamics currently unfolding create significant risks of migration of capital, businesses and skilled workers from jurisdiction to jurisdiction. Economic and fiscal competitiveness is now in the spotlight with tax reforms in the U.S. and Canada. Provinces and territories are evaluating the longer-term implications from these actions.
Economic conditions and corporate and personal income tax rates are among many factors considered when making decisions about where to live, invest or locate. The implications for Canada, provinces and territories from economic uncertainty, the U.S. tax reforms and federal tax policy actions continue to be evaluated by governments. Manitoba will continue to focus on maintaining long-term fiscal sustainability and improving the effectiveness of the tax system, while examining how to improve Manitoba’s competitiveness with neighboring jurisdictions and trading partners.
Starting with Budget 2016, steps are being taken to improve the tax system by eliminating ineffective tax credits and other wasteful tax expenditures. The Government’s regulatory environment is also being revamped to find and remove unnecessary delays and burdens for doing business in Manitoba for businesses, non-profit organizations, local governments and residents.
As introduced in Budget 2016, the personal income tax brackets are now annually indexed to the rate of inflation, lowering taxes for all Manitobans.
Budget 2018 also announces that the Basic Personal Amount will be increased by $1,010 in 2019 and an additional $1,010 in 2020, or $2,020 by 2020. This significant tax saving measure means that Manitoba’s forecasted exemption increases to $10,392 in 2019 and $11,402 in 2020.
In Budget 2018, the competitiveness of the small business tax rate is also enhanced by increasing the income threshold from $450,000 to $500,000, saving a corporation up to an additional $6,000 per year.
The personal and corporate tax measures announced in Budget 2018 are further outlined in the Tax Measures paper.
| | |
| | B U D G E T 2 0 1 8 E c o n o m i c R e v i e w a n d O u t l o o k / A 23 |
MANITOBA FINANCE SURVEY OF
ECONOMIC FORECASTS 2017f–2019f
Real GDP Growth Forecast (%)
| | | | | | | | |
| | | 2017f | | 2018f | | 2019f | | |
| | | | | |
CA | | 3.0 | | 2.3 | | 1.8 | | |
| | | | | | | | | |
| | | | | |
NL | | -1.8 | | 1.2 | | 1.8 | | |
| | | | | | | | | |
| | | | | |
PE | | 2.2 | | 1.7 | | 1.3 | | |
| | | | | | | | | |
| | | | | |
NS | | 1.3 | | 1.2 | | 1.0 | | |
| | | | | | | | | |
| | | | | |
NB | | 1.6 | | 1.1 | | 1.0 | | |
| | | | | | | | | |
| | | | | |
QC | | 2.9 | | 2.1 | | 1.6 | | |
| | | | | | | | | |
| | | | | |
ON | | 2.9 | | 2.3 | | 1.9 | | |
| | | | | | | | | |
| | | | | |
MB | | 2.2 | | 2.0 | | 1.6 | | |
| | | | | | | | | |
| | | | | |
SK | | 1.9 | | 2.1 | | 1.9 | | |
| | | | | | | | | |
| | | | | |
AB | | 4.3 | | 2.5 | | 2.0 | | |
| | | | | | | | | |
| | | | | |
BC | | 3.3 | | 2.6 | | 1.9 | | |
| | | | | | | | | |
Nominal GDP Growth Forecast (%)
| | | | | | | | |
| | | 2017f | | 2018f | | 2019f | | |
| | | | | |
CA | | 5.3 | | 4.1 | | 3.8 | | |
| | | | | | | | | |
| | | | | |
NL | | 1.8 | | 4.0 | �� | 4.4 | | |
| | | | | | | | | |
| | | | | |
PE | | 4.1 | | 3.6 | | 3.3 | | |
| | | | | | | | | |
| | | | | |
NS | | 3.1 | | 3.0 | | 2.8 | | |
| | | | | | | | | |
| | | | | |
NB | | 3.8 | | 3.0 | | 2.8 | | |
| | | | | | | | | |
| | | | | |
QC | | 4.3 | | 3.7 | | 3.3 | | |
| | | | | | | | | |
| | | | | |
ON | | 4.9 | | 4.2 | | 3.8 | | |
| | | | | | | | | |
| | | | | |
MB | | 4.3 | | 3.8 | | 3.5 | | |
| | | | | | | | | |
| | | | | |
SK | | 5.0 | | 4.3 | | 4.5 | | |
| | | | | | | | | |
| | | | | |
AB | | 7.7 | | 4.9 | | 4.8 | | |
| | | | | | | | | |
| | | | | |
BC | | 5.7 | | 4.7 | | 4.0 | | |
| | | | | | | | | |
Unemployment Rate Forecast (%)
| | | | | | | | |
| | | 2017 | | 2018f | | 2019f | | |
| | | | | |
CA | | 6.3 | | 5.9 | | 5.8 | | |
| | | | | | | | | |
| | | | | |
NL | | 14.8 | | 14.5 | | 14.3 | | |
| | | | | | | | | |
| | | | | |
PE | | 9.8 | | 9.5 | | 9.4 | | |
| | | | | | | | | |
| | | | | |
NS | | 8.4 | | 8.1 | | 8.1 | | |
| | | | | | | | | |
| | | | | |
NB | | 8.1 | | 8.1 | | 8.0 | | |
| | | | | | | | | |
| | | | | |
QC | | 6.1 | | 5.5 | | 5.4 | | |
| | | | | | | | | |
| | | | | |
ON | | 6.0 | | 5.6 | | 5.5 | | |
| | | | | | | | | |
| | | | | |
MB | | 5.4 | | 5.3 | | 5.3 | | |
| | | | | | | | | |
| | | | | |
SK | | 6.3 | | 5.9 | | 5.7 | | |
| | | | | | | | | |
| | | | | |
AB | | 7.8 | | 6.8 | | 6.5 | | |
| | | | | | | | | |
| | | | | |
BC | | 5.1 | | 4.8 | | 4.9 | | |
| | | | | | | | | |
Employment Growth Forecast (%)
| | | | | | | | |
| | | 2017 | | 2018f | | 2019f | | |
| | | | | |
CA | | 1.9 | | 1.4 | | 0.9 | | |
| | | | | | | | | |
| | | | | |
NL | | -3.7 | | -0.6 | | -0.3 | | |
| | | | | | | | | |
| | | | | |
PE | | 3.1 | | 0.7 | | 0.4 | | |
| | | | | | | | | |
| | | | | |
NS | | 0.6 | | 0.4 | | 0.2 | | |
| | | | | | | | | |
| | | | | |
NB | | 0.4 | | 0.3 | | 0.2 | | |
| | | | | | | | | |
| | | | | |
QC | | 2.2 | | 1.5 | | 0.8 | | |
| | | | | | | | | |
| | | | | |
ON | | 1.8 | | 1.6 | | 1.0 | | |
| | | | | | | | | |
| | | | | |
MB | | 1.7 | | 0.8 | | 0.5 | | |
| | | | | | | | | |
| | | | | |
SK | | -0.2 | | 0.6 | | 0.8 | | |
| | | | | | | | | |
| | | | | |
AB | | 1.0 | | 1.8 | | 1.2 | | |
| | | | | | | | | |
| | | | | |
BC | | 3.7 | | 1.5 | | 1.0 | | |
| | | | | | | | | |
f – Forecast
Source: Statistics Canada, Manitoba Bureau of Statistics and Manitoba Finance Survey of Economic forecasts
| | |
A 24 / E c o n o m i c R e v i e w a n d O u t l o o k B U D G E T 2 0 1 8 | | |
MANITOBA ECONOMIC STATISTICS, 2013 TO 2017
| | | | | | | | | | | | | | | | | | | | |
| | | 2013 | | | 2014 | | | 2015 | | | 2016 | | | 2017 |
| | | | | | (Millions of Dollars) | | | |
POPULATION | | | | | | | | | | | | | | | | | | | | |
| | | | | |
July 1 (000’s) | | | 1,266 | | | | 1,281 | | | | 1,295 | | | | 1,318 | | | | 1,338 | |
| | | | | |
GROSS DOMESTIC PRODUCT 1 | | | | | | | | | | | | | | | | | | | | |
| | | | | |
Nominal | | | 62,302 | | | | 64,201 | | | | 66,299 | | | | 67,455 | | | | 70,360 | |
| | | | | |
Real (chained 2007 dollars) | | | 57,182 | | | | 58,327 | | | | 59,056 | | | | 60,044 | | | | 61,353 | |
| | | | | |
INVESTMENT | | | | | | | | | | | | | | | | | | | | |
| | | | | |
Residential Construction | | | 3,476 | | | | 3,556 | | | | 3,381 | | | | 3,431 | | | | 3,921 | |
| | | | | |
Housing Starts (no. of units) | | | 7,465 | | | | 6,220 | | | | 5,501 | | | | 5,318 | | | | 7,501 | |
| | | | | |
Building Permits | | | 2,608 | | | | 2,815 | | | | 2,313 | | | | 2,626 | | | | 2,964 | |
| | | | | |
Non-Residential Building Construction | | | 1,477 | | | | 1,700 | | | | 1,860 | | | | 1,729 | | | | 1,889 | |
| | | | | |
Total Capital and Repair Investment | | | 7,620 | | | | 8,633 | | | | 9,493 | | | | 8,862 | | | | 9,139 | |
| | | | | |
Private Capital Investment | | | 4,331 | | | | 5,537 | | | | 4,892 | | | | 4,154 | | | | 4,411 | |
| | | | | |
Public Capital Investment | | | 3,289 | | | | 3,096 | | | | 4,600 | | | | 4,708 | | | | 4,727 | |
| | | | | |
SECTORS | | | | | | | | | | | | | | | | | | | | |
| | | | | |
Manufacturing Shipments | | | 16,930 | | | | 17,427 | | | | 17,158 | | | | 17,382 | | | | 18,305 | |
| | | | | |
Retail Trade | | | 17,314 | | | | 18,071 | | | | 18,368 | | | | 19,147 | | | | 19,820 | |
| | | | | |
Wholesale Trade | | | 15,819 | | | | 17,193 | | | | 17,546 | | | | 18,473 | | | | 19,844 | |
| | | | | |
Farm Cash Receipts | | | 5,833 | | | | 5,983 | | | | 5,867 | | | | 5,948 | | | | 6,474 | |
| | | | | |
Crops | | | 3,468 | | | | 3,260 | | | | 3,190 | | | | 3,598 | | | | 4,080 | |
| | | | | |
Livestock | | | 1,993 | | | | 2,491 | | | | 2,372 | | | | 2,128 | | | | 2,184 | |
| | | | | |
Direct Payments | | | 371 | | | | 231 | | | | 305 | | | | 222 | | | | 210 | |
| | | | | |
Mining and Petroleum | | | 3,071 | | | | 3,097 | | | | 2,239 | | | | 2,168 | | | | N/A | |
| | | | | |
Mining | | | 1,306 | | | | 1,428 | | | | 1,348 | | | | 1,418 | | | | 1,656 | |
| | | | | |
Petroleum | | | 1,765 | | | | 1,669 | | | | 891 | | | | 750 | | | | N/A | |
| | | | | |
New Car Sales (no. of units) | | | 56,275 | | | | 57,783 | | | | 57,986 | | | | 57,428 | | | | 63,228 | |
| | | | | |
FOREIGN EXPORTS | | | | | | | | | | | | | | | | | | | | |
| | | | | |
Total Exports | | | 12,550 | | | | 13,451 | | | | 13,752 | | | | 13,473 | | | | 13,821 | |
| | | | | |
U.S. | | | 8,407 | | | | 9,093 | | | | 9,528 | | | | 9,161 | | | | 8,949 | |
| | | | | |
LABOUR MARKET | | | | | | | | | | | | | | | | | | | | |
| | | | | |
Labour Force (000’s) | | | 661.5 | | | | 662.1 | | | | 674.1 | | | | 674.9 | | | | 680.9 | |
| | | | | |
Employment (000’s) | | | 625.8 | | | | 626.5 | | | | 636.2 | | | | 633.6 | | | | 644.1 | |
| | | | | |
Participation Rate (%) | | | 68.6 | | | | 67.8 | | | | 68.3 | | | | 67.6 | | | | 67.2 | |
| | | | | |
Unemployment Rate (%) | | | 5.4 | | | | 5.4 | | | | 5.6 | | | | 6.1 | | | | 5.4 | |
| | | | | |
Average Weekly Earnings ($) | | | 827.34 | | | | 862.99 | | | | 880.17 | | | | 888.52 | | | | 909.87 | |
| | | | | |
CONSUMER PRICE INDEX | | | | | | | | | | | | | | | | | | | | |
| | | | | |
(Index, 2002 = 100) | | | 123.0 | | | | 125.3 | | | | 126.8 | | | | 128.4 | | | | 130.5 | |
1 Manitoba Bureau of Statistics
Sources: Statistics Canada, Manitoba Bureau of Statistics and Manitoba Finance.
Sums may not add due to rounding.
| | |
| | B U D G E T 2 0 1 8 E c o n o m i c R e v i e w a n d O u t l o o k / A 25 |
| | | | | | | | | | | | | | | | | | | | |
| 2013 | | 2014 | | 2015 | | 2016 | | 2017 | | |
| (Annual Percentage Change) | | |
| | | | | | | | | | | | | | | | | | | | POPULATION |
| | | | | |
| | 1.2 | | | | 1.2 | | | | 1.1 | | | | 1.8 | | | | 1.5 | | | July 1 (000’s) |
| | | | | |
| | | | | | | | | | | | | | | | | | | | GROSS DOMESTIC PRODUCT1 |
| | | | | |
| | 4.2 | | | | 3.0 | | | | 3.3 | | | | 1.7 | | | | 4.3 | | | Nominal |
| | | | | |
| | 2.8 | | | | 2.0 | | | | 1.3 | | | | 1.7 | | | | 2.2 | | | Real (chained 2007 dollars) |
| | | | | |
| | | | | | | | | | | | | | | | | | | | INVESTMENT |
| | | | | |
| | 8.2 | | | | 2.3 | | | | -4.9 | | | | 1.5 | | | | 14.3 | | | Residential Construction |
| | | | | |
| | 3.1 | | | | -16.7 | | | | -11.6 | | | | -3.3 | | | | 41.0 | | | Housing Starts (no. of units) |
| | | | | |
| | 4.9 | | | | 7.9 | | | | -17.9 | | | | 13.5 | | | | 12.9 | | | Building Permits |
| | | | | |
| | 9.3 | | | | 15.0 | | | | 9.4 | | | | -7.0 | | | | 9.2 | | | Non-Residential Building Construction |
| | | | | |
| | -2.3 | | | | 13.3 | | | | 10.0 | | | | -6.6 | | | | 3.1 | | | Total Capital and Repair Investment |
| | | | | |
| | -1.3 | | | | 27.8 | | | | -11.6 | | | | -15.1 | | | | 6.2 | | | Private Capital Investment |
| | | | | |
| | -3.5 | | | | -5.9 | | | | 48.6 | | | | 2.3 | | | | 0.4 | | | Public Capital Investment |
| | | | | |
| | | | | | | | | | | | | | | | | | | | SECTORS |
| | | | | |
| | 3.7 | | | | 2.9 | | | | -1.5 | | | | 1.3 | | | | 5.3 | | | Manufacturing Shipments |
| | | | | |
| | 3.9 | | | | 4.4 | | | | 1.6 | | | | 4.2 | | | | 3.5 | | | Retail Trade |
| | | | | |
| | -0.6 | | | | 8.7 | | | | 2.1 | | | | 5.3 | | | | 7.4 | | | Wholesale Trade |
| | | | | |
| | 13.3 | | | | 2.6 | | | | -1.9 | | | | 1.4 | | | | 8.8 | | | Farm Cash Receipts |
| | | | | |
| | 27.6 | | | | -6.0 | | | | -2.2 | | | | 12.8 | | | | 13.4 | | | Crops |
| | | | | |
| | 3.1 | | | | 25.0 | | | | -4.8 | | | | -10.3 | | | | 2.6 | | | Livestock |
| | | | | |
| | -25.0 | | | | -37.7 | | | | 31.7 | | | | -27.2 | | | | -5.4 | | | Direct Payments |
| | | | | |
| | -0.7 | | | | 0.9 | | | | -27.7 | | | | -3.2 | | | | - | | | Mining and Petroleum |
| | | | | |
| | -12.4 | | | | 9.4 | | | | -5.6 | | | | 5.2 | | | | 16.8 | | | Mining |
| | | | | |
| | 10.3 | | | | -5.4 | | | | -46.6 | | | | -15.8 | | | | - | | | Petroleum |
| | | | | |
| | 7.7 | | | | 2.7 | | | | 0.4 | | | | -1.0 | | | | 10.1 | | | New Car Sales (no. of units) |
| | | | | |
| | | | | | | | | | | | | | | | | | | | FOREIGN EXPORTS |
| | | | | |
| | 10.5 | | | | 7.2 | | | | 2.2 | | | | -2.0 | | | | 2.6 | | | Total Exports |
| | | | | |
| | 9.8 | | | | 8.2 | | | | 4.8 | | | | -3.8 | | | | -2.3 | | | U.S. |
| | | | | |
| | | | | | | | | | | | | | | | | | | | LABOUR MARKET |
| | | | | |
| | 0.7 | | | | 0.1 | | | | 1.8 | | | | 0.1 | | | | 0.9 | | | Labour Force (000’s) |
| | | | | |
| | 0.7 | | | | 0.1 | | | | 1.5 | | | | -0.4 | | | | 1.7 | | | Employment (000’s) |
| | | | | |
| | - | | | | - | | | | - | | | | - | | | | - | | | Participation Rate (%) |
| | | | | |
| | - | | | | - | | | | - | | | | - | | | | - | | | Unemployment Rate (%) |
| | | | | |
| | 0.6 | | | | 4.3 | | | | 2.0 | | | | 0.9 | | | | 2.4 | | | Average Weekly Earnings ($) |
| | | | | |
| | | | | | | | | | | | | | | | | | | | CONSUMER PRICE INDEX |
| | | | | |
| | 2.2 | | | | 1.9 | | | | 1.2 | | | | 1.3 | | | | 1.6 | | | (Index, 2002 = 100) |
1 Manitoba Bureau of Statistics
Sources: Statistics Canada, Manitoba Bureau of Statistics and Manitoba Finance.
Sums may not add due to rounding.
| | |
A 26 / E c o n o m i c R e v i e w a n d O u t l o o k B U D G E T 2 0 1 8 | | |
Budget Paper B
SUPPLEMENTARY FINANCIAL INFORMATION
SUPPLEMENTARY FINANCIAL INFORMATION
CONTENTS
| | | | |
MANITOBA SUMMARY FINANCIAL STATISTICS | | | B2 | |
| |
CAPITAL INVESTMENT | | | B4 | |
| |
LOAN REQUIREMENTS | | | B5 | |
| |
BORROWING REQUIREMENTS | | | B6 | |
| |
SUMMARY NET DEBT | | | B7 | |
| |
SPECIAL ACCOUNTS | | | B8 | |
| |
SUMMARY BUDGET USER’S GUIDE | | | B9 | |
| |
Structure Of The Summary Budget | | | B9 | |
| |
Frequently Asked Questions | | | B10 | |
| |
Glossary Of Key Terms | | | B12 | |
| |
Entities Included in Summary Budget | | | B14 | |
| | |
B 2 / S u p p l e m e n t a r y F i n a n c i a l I n f o r m a t i o n B U D G E T 2 0 1 8 | | |
Manitoba Summary Financial Statistics
| | | | | | | | | | | | | | | | | | | | | | | | |
| | | 2018/19
Budget | | 2017/18
Forecast | | 2016/17
Actual | | 2015/16
Actual | | 2014/15
Actual | | 2013/14
Actual |
| | | | |
SUMMARY FINANCIAL STATEMENTS | | | | | | | | | | | (Millions of Dollars) | | | | | |
| | | | | | |
Revenue | | | | | | | | | | | | | | | | | | | | | | | | |
| | | | | | |
Income Taxes | | | 4,041 | | | | 3,940 | | | | 3,958 | | | | 3,777 | | | | 3,679 | | | | 3,446 | |
Other Taxes | | | 4,800 | | | | 4,620 | | | | 4,396 | | | | 4,250 | | | | 4,102 | | | | 3,923 | |
Fees and Other Revenue | | | 2,333 | | | | 2,363 | | | | 2,383 | | | | 2,269 | | | | 2,215 | | | | 2,233 | |
Federal Transfers | | | 4,496 | | | | 4,195 | | | | 4,128 | | | | 3,820 | | | | 3,809 | | | | 3,818 | |
Net Income of Government Business Enterprises | | | 842 | | | | 758 | | | | 631 | | | | 713 | | | | 921 | | | | 783 | |
Sinking Funds and Other Earnings | | | 275 | | | | 252 | | | | 227 | | | | 225 | | | | 237 | | | | 211 | |
| | | | | | | | | | | | | | | | | | | | | | | | |
Total Revenue | | | 16,787 | | | | 16,128 | | | | 15,723 | | | | 15,054 | | | | 14,963 | | | | 14,414 | |
| | | | | | | | | | | | | | | | | | | | | | | | |
Expenditures (excluding Debt Servicing) | | | 16,389 | | | | 15,840 | | | | 15,557 | | | | 15,038 | | | | 14,552 | | | | 14,115 | |
Debt Servicing | | | 1,034 | | | | 964 | | | | 930 | | | | 855 | | | | 841 | | | | 821 | |
| | | | | | | | | | | | | | | | | | | | | | | | |
Expenditure | | | 17,423 | | | | 16,804 | | | | 16,487 | | | | 15,893 | | | | 15,393 | | | | 14,936 | |
| | | | | | |
Contingency for Writedowns | | | – | | | | 50 | | | | – | | | | – | | | | – | | | | - | |
| | | | | | |
In-Year Adjustments/Lapse | | | (115 | ) | | | – | | | | – | | | | – | | | | – | | | | - | |
| | | | | | | | | | | | | | | | | | | | | | | | |
| | | | | | |
Net Income (Loss) | | | (521 | ) | | | (726 | ) | | | (764 | ) | | | (839 | ) | | | (430 | ) | | | (522 | ) |
| | | | | | | | | | | | | | | | | | | | | | | | |
| | | | | | |
Provincial Borrowings, Guarantees & Obligations | | | | | | | | | | | | | | | | | | | | | | | | |
General Government Programs | | | 12,086 | | | | 11,857 | | | | 11,921 | | | | 10,632 | | | | 9,460 | | | | 9,105 | |
General Government Programs–Pension Liability | | | 2,695 | | | | 2,695 | | | | 2,795 | | | | 2,695 | | | | 2,595 | | | | 2,595 | |
The Manitoba Hydro-Electric Board | | | 21,965 | | | | 19,365 | | | | 16,429 | | | | 14,543 | | | | 12,540 | | | | 10,838 | |
Other Crown Organizations | | | 4,144 | | | | 3,757 | | | | 3,554 | | | | 3,311 | | | | 2,827 | | | | 2,511 | |
Health Facilities | | | 1,619 | | | | 1,673 | | | | 1,578 | | | | 1,499 | | | | 1,338 | | | | 1,252 | |
Government Enterprises and Other | | | – | | | | – | | | | – | | | | – | | | | 5 | | | | 9 | |
Capital Investments | | | 5,971 | | | | 5,639 | | | | 5,556 | | | | 5,174 | | | | 4,724 | | | | 4,020 | |
| | | | | | | | | | | | | | | | | | | | | | | | |
Subtotal | | | 48,480 | | | | 44,986 | | | | 41,833 | | | | 37,854 | | | | 33,489 | | | | 30,330 | |
| | | | | | |
Other Obligations | | | | | | | | | | | | | | | | | | | | | | | | |
Pension Liability | | | 9,817 | | | | 9,378 | | | | 8,879 | | | | 8,314 | | | | 7,947 | | | | 7,456 | |
Pension Assets | | | (6,893 | ) | | | (6,633 | ) | | | (6,322 | ) | | | (5,960 | ) | | | (5,702 | ) | | | (5,418 | ) |
| | | | | | | | | | | | | | | | | | | | | | | | |
Net Pension Liability | | | 2,924 | | | | 2,745 | | | | 2,557 | | | | 2,354 | | | | 2,245 | | | | 2,038 | |
Debt incurred for and Repayable by The Manitoba Hydro Electric Board | | | (21,855 | ) | | | (19,249 | ) | | | (16,341 | ) | | | (14,435 | ) | | | (12,371 | ) | | | (10,573 | ) |
Education Debt held by Government Enterprises | | | 545 | | | | 590 | | | | 628 | | | | 621 | | | | 620 | | | | 600 | |
Other Debt of Crown Organizations | | | 285 | | | | 289 | | | | 292 | | | | 301 | | | | 279 | | | | 281 | |
| | | | | | | | | | | | | | | | | | | | | | | | |
Subtotal | | | (18,101 | ) | | | (15,625 | ) | | | (12,864 | ) | | | (11,159 | ) | | | (9,227 | ) | | | (7,654 | ) |
| | | | | | | | | | | | | | | | | | | | | | | | |
Total Summary Borrowings, Guarantees and Obligations | | | 30,379 | | | | 29,361 | | | | 28,969 | | | | 26,695 | | | | 24,262 | | | | 22,676 | |
| | | | | | | | | | | | | | | | | | | | | | | | |
| | | | | | |
Adjustments to arrive at Summary Net Debt | | | | | | | | | | | | | | | | | | | | | | | | |
Guarantees | | | (110 | ) | | | (116 | ) | | | (91 | ) | | | (110 | ) | | | (172 | ) | | | (265 | ) |
Net Financial Assets | | | (5,225 | ) | | | (5,293 | ) | | | (6,185 | ) | | | (5,214 | ) | | | (4,644 | ) | | | (5,194 | ) |
| | | | | | | | | | | | | | | | | | | | | | | | |
| | | | | | |
Summary Net Debt | | | 25,044 | | | | 23,952 | | | | 22,693 | | | | 21,371 | | | | 19,446 | | | | 17,217 | |
| | | | | | | | | | | | | | | | | | | | | | | | |
NOTES
| • | | In-year adjustments/lapse could be an increase in revenue and/or decrease in expenditures. |
| • | | Numbers may not add due to rounding. |
| | |
| | B U D G E T 2 0 1 8 S u p p l e m e n t a r y F i n a n c i a l I n f o r m a t i o n / B 3 |
Manitoba Summary Financial Statistics
| | | | | | | | | | | | | | | | | | | | | | | | |
| | | 2018/19 | | | 2017/18 | | | 2016/17 | | | 2015/16 | | | 2014/15 | | | 2013/14 | |
| | | Budget | | | Forecast | | | Actual | | | Actual | | | Actual | | | Actual | |
| |
| | | (Percentage Change) | |
Annual Change | | | | | | | | | | | | | | | | | | | | | | | | |
Income Taxes | | | 2.6 | | | | (0.5) | | | | 4.8 | | | | 2.7 | | | | 6.8 | | | | 4.4 | |
Other Taxes | | | 3.9 | | | | 5.1 | | | | 3.4 | | | | 3.6 | | | | 4.6 | | | | 10.1 | |
Fees and Other Revenue | | | (1.3) | | | | (0.8) | | | | 5.0 | | | | 2.4 | | | | (0.8) | | | | 9.3 | |
Federal Transfers | | | 7.2 | | | | 1.6 | | | | 8.1 | | | | 0.3 | | | | (0.2) | | | | (3.4) | |
Total Revenue | | | 4.1 | | | | 2.6 | | | | 4.4 | | | | 0.6 | | | | 3.8 | | | | 4.4 | |
Debt Servicing | | | 7.3 | | | | 3.7 | | | | 8.8 | | | | 1.7 | | | | 2.4 | | | | (2.1) | |
Total Expenditure | | | 3.7 | | | | 1.9 | | | | 3.7 | | | | 3.2 | | | | 3.1 | | | | 3.9 | |
Summary Net Debt | | | 4.6 | | | | 5.5 | | | | 6.2 | | | | 9.9 | | | | 12.9 | | | | 9.2 | |
| |
| | | (Per Cent) | |
| | | | | | |
Per Cent of GDP | | | | | | | | | | | | | | | | | | | | | | | | |
| | | | | | |
Income Taxes | | | 5.5 | | | | 5.6 | | | | 5.9 | | | | 5.7 | | | | 5.7 | | | | 5.5 | |
Other Taxes | | | 6.6 | | | | 6.6 | | | | 6.5 | | | | 6.4 | | | | 6.4 | | | | 6.3 | |
Fees and Other Revenue | | | 3.2 | | | | 3.4 | | | | 3.5 | | | | 3.4 | | | | 3.5 | | | | 3.6 | |
Federal Transfers | | | 6.2 | | | | 6.0 | | | | 6.1 | | | | 5.8 | | | | 5.9 | | | | 6.1 | |
Total Revenue | | | 23.0 | | | | 22.9 | | | | 23.3 | | | | 22.7 | | | | 23.3 | | | | 23.1 | |
Debt Servicing | | | 1.4 | | | | 1.4 | | | | 1.4 | | | | 1.3 | | | | 1.3 | | | | 1.3 | |
Total Expenditure | | | 23.9 | | | | 23.9 | | | | 24.4 | | | | 24.0 | | | | 24.0 | | | | 24.0 | |
Summary Net Debt | | | 34.3 | | | | 34.0 | | | | 33.6 | | | | 32.2 | | | | 30.3 | | | | 27.6 | |
| | | | | | |
Per Cent of Revenue | | | | | | | | | | | | | | | | | | | | | | | | |
| | | | | | |
Income Taxes | | | 24.1 | | | | 24.4 | | | | 25.2 | | | | 25.1 | | | | 24.6 | | | | 23.9 | |
Other Taxes | | | 28.6 | | | | 28.6 | | | | 28.0 | | | | 28.2 | | | | 27.4 | | | | 27.2 | |
Fees and Other Revenue | | | 13.9 | | | | 14.7 | | | | 15.2 | | | | 15.1 | | | | 14.8 | | | | 15.5 | |
Federal Transfers | | | 26.8 | | | | 26.0 | | | | 26.3 | | | | 25.4 | | | | 25.5 | | | | 26.5 | |
Net Income of Government Business Enterprises | | | 5.0 | | | | 4.7 | | | | 4.0 | | | | 4.7 | | | | 6.2 | | | | 5.4 | |
Sinking Funds and Other Earnings | | | 1.6 | | | | 1.6 | | | | 1.4 | | | | 1.5 | | | | 1.6 | | | | 1.5 | |
Debt Servicing | | | 6.2 | | | | 6.0 | | | | 5.9 | | | | 5.7 | | | | 5.6 | | | | 5.7 | |
| |
| | | (Dollars) | |
| | | | | | |
Dollars Per Capita | | | | | | | | | | | | | | | | | | | | | | | | |
| | | | | | |
Total Revenue | | | 12,395 | | | | 12,053 | | | | 11,929 | | | | 11,621 | | | | 11,682 | | | | 11,389 | |
Total Expenditure | | | 12,865 | | | | 12,558 | | | | 12,508 | | | | 12,269 | | | | 12,017 | | | | 11,802 | |
Debt Servicing | | | 763 | | | | 720 | | | | 706 | | | | 660 | | | | 657 | | | | 649 | |
Summary Net Debt | | | 18,492 | | | | 17,900 | | | | 17,216 | | | | 16,498 | | | | 15,182 | | | | 13,604 | |
| | | | | | |
Memorandum Items | | | | | | | | | | | | | | | | | | | | | | | | |
| | | | | | |
Population (000s) * | | | 1,354.3 | | | | 1,338.1 | | | | 1,318.1 | | | | 1,295.4 | | | | 1,280.9 | | | | 1,265.6 | |
GDP at Market Prices | | | 73,034 | | | | 70,360 | | | | 67,455 | | | | 66,299 | | | | 64,201 | | | | 62,302 | |
* official population July 1
NOTE: Numbers may not add due to rounding.
Source: Manitoba Finance
| | |
B 4 / S u p p l e m e n t a r y F i n a n c i a l I n f o r m a t i o n B U D G E T 2 0 1 8 | | |
CAPITAL INVESTMENT
Capital investment, both in core government and the Other Reporting Entities, continues to be a priority for government. An investment made to construct or enhance capital assets is a benefit to Manitobans for the provision of services needed into the future.
Net investment in tangible capital assets is projected to be $14.3 billion as at March 31, 2019.
Tangible Capital Assets – Net Book Value
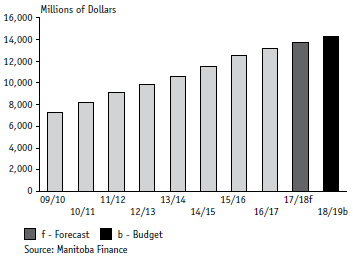
Tangible Capital Assets – Net Book Value
Projection as at March 31, 2019 and March 31, 2018
| | | | | | | | | | |
| | | 2018/19 Budget | | 2017/18 Forecast |
| |
| | | (Millions of Dollars) |
| | |
Cost of Assets, Beginning of Year | | | | 23,321 | | | | | 22,083 | |
| | |
Additions | | | | 1,310 | | | | | 1,238 | |
| | | | | | | | | | |
| | |
Cost, End of Year | | | | 24,631 | | | | | 23,321 | |
| | | | | | | | | | |
| | |
Accumulated Amortization, Beginning of Year | | | | 9,630 | | | | | 8,925 | |
| | |
Amortization | | | | 739 | | | | | 705 | |
| | | | | | | | | | |
| | |
Accumulated Amortization, End of Year | | | | 10,369 | | | | | 9,630 | |
| | | | | | | | | | |
| | |
Net Book Value | | | | 14,262 | | | | | 13,691 | |
| | | | | | | | | | |
| | |
| | B U D G E T 2 0 1 8 S u p p l e m e n t a r y F i n a n c i a l I n f o r m a t i o n / B 5 |
LOAN REQUIREMENTS
The Loan Act, 2018 will provide borrowing and capital authority and, in some cases, guarantee authority for government and its agencies. This authority is in addition to that voted in the printed estimates.
The Loan Act, 2018 will include provisions for the Non-Budgetary Capital Program, as well as for bridge financing and future year commitments. The Loan Act, 2018 will provide incremental capital authority of $2.8 billion.
Non-Budgetary Capital Program, 2018/19
(Thousands of Dollars)
| | | | | |
Manitoba Hydro-Electric Board | | | | $2,783,000 | |
Health Capital Program | | | | 314,961 | |
Manitoba Agricultural Services Corporation | | | | 173,650 | |
Manitoba Public Schools Finance Board | | | | 153,666 | |
Manitoba Housing and Renewal Corporation | | | | 129,930 | |
Manitoba Water Services Board | | | | 94,489 | |
Manitoba Liquor and Lotteries Corporation | | | | 71,700 | |
Manitoba Student Aid Program | | | | 45,684 | |
Manitoba Centennial Centre Corporation | | | | 34,900 | |
Business Support (including Manitoba Industrial Opportunities Program) | | | | 28,100 | |
Special Operating Agencies Financing Authority – Vehicle Equipment Management Agency | | | | 21,430 | |
Post-Secondary Institutions | | | | 14,000 | |
Communities Economic Development Fund | | | | 11,000 | |
Shared Health | | | | 3,827 | |
Northern Affairs Communities | | | | 2,700 | |
Miscellaneous Corporations, Agencies and Other Programs | | | | 8,148 | |
| | | | | |
| | | | $3,891,185 | |
| | | | | |
Incremental Capital Authority Requirements for Non-Budgetary Programs, 2018/19
(Thousands of Dollars)
| | | | | |
Manitoba Hydro-Electric Board | | | | $2,083,000 | |
Manitoba Agricultural Services Corporation | | | | 252,252 | |
Health Capital Program | | | | 153,971 | |
Manitoba Housing and Renewal Corporation | | | | 96,918 | |
Manitoba Liquor and Lotteries Corporation | | | | 65,700 | |
Manitoba Student Aid Program | | | | 60,584 | |
Manitoba Water Services Board | | | | 42,402 | |
Manitoba Centennial Centre Corporation | | | | 35,500 | |
Communities Economic Development Fund | | | | 5,550 | |
Special Operating Agencies Financing Authority – Vehicles and Equipment Management Agency | | | | 5,000 | |
Shared Health | | | | 4,332 | |
Special Operating Agencies Financing Authority – Crown Lands and Property Agency | | | | 550 | |
| | | | | |
| | | | $2,805,759 | |
| | | | | |
| | |
B 6 / S u p p l e m e n t a r y F i n a n c i a l I n f o r m a t i o n B U D G E T 2 0 1 8 | | |
BORROWING REQUIREMENTS
Manitoba’s borrowing requirements with respect to both general and self-sustaining borrowings is estimated to total $6.4 billion in 2018/19, of which $2.3 billion is required for refinancing purposes. New cash requirements, net of estimated repayments, are $4.1 billion, which includes requirements for general government purposes, capital investments by departments and the Manitoba Hydro-Electric Board. To date, approximately $0.6 billion of funding for 2018/19 has been completed.
BORROWING REQUIREMENTS 2018/19
| | | | | | | | | | | | | | | | |
| | | Refinancing | | | New Cash
Requirements | | | Estimated
Repayments | | | Borrowing
Requirements | |
| |
| | | (Thousands of Dollars) | |
Government Business Enterprises | | | | | | | | | | | | | | | | |
| | | | |
Manitoba Hydro-Electric Board | | | 1,587,361 | | | | 2,600,400 | | | | - | | | | 4,187,761 | |
| | | | |
Manitoba Liquor and Lotteries Corporation | | | 75,000 | | | | 76,600 | | | | 50,619 | | | | 100,981 | |
| | | | | | | | | | | | | | | | |
Subtotal | | | 1,662,361 | | | | 2,677,000 | | | | 50,619 | | | | 4,288,742 | |
| | | | | | | | | | | | | | | | |
| | | | |
Other Borrowings | | | | | | | | | | | | | | | | |
| | | | |
General Purpose Borrowings | | | 477,548 | | | | 635,000 | | | | - | | | | 1,112,548 | |
Capital Investment Assets | | | 65,036 | | | | 659,376 | | | | 288,000 | | | | 436,412 | |
Health Facilities | | | 80,000 | | | | 140,000 | | | | 100,621 | | | | 119,379 | |
Public Schools Finance Board | | | - | | | | 153,666 | | | | - | | | | 153,666 | |
Other Crowns and Organizations | | | - | | | | 528,914 | | | | 221,292 | | | | 307,622 | |
| | | | | | | | | | | | | | | | |
Subtotal | | | 622,584 | | | | 2,116,956 | | | | 609,913 | | | | 2,129,627 | |
| | | | | | | | | | | | | | | | |
| | | | |
Total Borrowing Requirements | | | 2,284,945 | | | | 4,793,956 | | | | 660,532 | | | | 6,418,369 | |
| | | | | | | | | | | | | | | | |
| | |
| | B U D G E T 2 0 1 8 S u p p l e m e n t a r y F i n a n c i a l I n f o r m a t i o n / B 7 |
SUMMARY NET DEBT
Changes in Summary Net Debt
(Millions of Dollars)
| | | | |
2017/18 Summary Net Debt (Forecast)
Net Investment in Tangible Capital Assets | | | 23,952 | |
Core Government | | | 371 | |
Other Reporting Entities | | | 200 | |
| | | | |
| | | 571 | |
| | | | |
| |
Plus: Projected (Income) Loss for the Year | | | | |
Core Government | | | 639 | |
Other Reporting Entities | | | (118 | ) |
| | | | |
| | | 521 | |
| | | | |
Change in Net Debt | | | 1,092 | |
| | | | |
| |
2018/19 Summary Net Debt (Budget) | | | 25,044 | |
| | | | |
In Budget 2018, the net debt to GDP ratio is forecast to be 34.3%. Net debt is an important indicator of a government’s financial position, as this highlights the affordability of future government services. Summary net debt represents the difference between the Government Reporting Entity’s total liabilities less financial assets; it reflects the residual liability that must be financed by future revenues. It is important to measure changes in net debt against the growth of the economy, as measured by the nominal GDP.
| | |
B 8 / S u p p l e m e n t a r y F i n a n c i a l I n f o r m a t i o n B U D G E T 2 0 1 8 | | |
SPECIAL ACCOUNTS
Fiscal Stabilization Account
The Fiscal Stabilization Account is projected to have a balance of $125 million as at March 31, 2018, after a transfer of $10 million from core government in 2017/18.
The Fiscal Stabilization Account is expected to have a balance of $175 million as of March 31, 2019 after the budgeted transfer of $50 million from core government in 2018/19, re-building the province’s savings and providing protection for core government operations in future years.
FISCAL STABILIZATION ACCOUNT
Projection as at March 31, 2019, and March 31, 2018
| | | | | | | | |
| | | 2018/19 Budget | | 2017/18 Forecast |
| | | (Millions of Dollars) |
| | |
Balance, Beginning of Year | | | 125 | | | | 115 | |
| | |
Transfer from Core Government | | | 50 | | | | 10 | |
| | | | | | | | |
| | |
Balance, End of Year | | | 175 | | | | 125 | |
| | | | | | | | |
Pension Assets Fund
The trust conditions of the funds held in the Pension Assets Fund are irrevocably restricted for pension purposes only. Net investment earnings of pension assets include the expected rate of return during the year, as well as adjustments to market-related value. Market fluctuations of pension assets are not recorded in the year in which they occur, but are recognized over the employee average remaining service life.
The Fund is expected to have a balance of $4,831 million by the end of the 2018/19 fiscal year.
Pension Assets Fund
Projection as at March 31, 2019 and March 31, 2018
| | | | | | | | |
| | | 2018/19 Budget | | | 2017/18 Forecast | |
| | | (Millions of Dollars) | |
Balance, Beginning of Year | | | 4,680 | | | | 4,547 | |
| | | | | | | | |
| | |
Contributions and Revenue | | | | | | | | |
| | |
Net Investment Earnings | | | 289 | | | | 280 | |
| | |
Departments and Crown Corporations | | | 233 | | | | 217 | |
| | | | | | | | |
| | | 522 | | | | 497 | |
| | | | | | | | |
Transfers | | | | | | | | |
Teachers’ Retirement Allowances Fund and Civil Service Superannuation Fund payments | | | (371) | | | | (364) | |
| | | | | | | | |
Balance, End of Year | | | 4,831 | | | | 4,680 | |
| | | | | | | | |
| | |
| | B U D G E T 2 0 1 8 S u p p l e m e n t a r y F i n a n c i a l I n f o r m a t i o n / B 9 |
SUMMARY BUDGET USER’S GUIDE
Introduction
This document guides readers through the format of the Manitoba Budget. It includes a general explanation of the Structure of the Summary Budget and a list of Frequently Asked Questions, a Glossary of Key Terms and a list of Entities Included in the Summary Budget.
STRUCTURE OF THE SUMMARY BUDGET
The Summary Budget presents a high-level overview of revenue and expenditure of the entire Government Reporting Entity (GRE).
Revenue is reported under six categories.
| ● | | Income Taxes – are entirely revenue of core government. |
| ● | | Other Taxes – includes the Retail Sales Tax and all of the other tax revenues of core government, as well as property taxes levied to support school funding. |
| ● | | Fees and Other Revenue – includes fees such as automobile licences, park and forestry fees, and fees collected by Crown organizations such as fees for non-insured health services and rental revenue for Manitoba Housing and Renewal Corporation (MHRC). Tuition fees collected by universities and colleges are also included in this category. |
| ● | | Federal Transfers – Equalization, Canada Health Transfer, Canada Social Transfer, and other grants and transfers are mostly received by core government, although some federal funds are provided directly to entities not included in core government, such as housing subsidies to MHRC, insurance premiums for agriculture programs and grants for public education. |
| ● | | Net Income of Government Business Enterprises (GBE) – represents the net income of all GBEs. This income is added to the summary financial statements on a modified equity basis and includes the income of Manitoba Liquor and Lotteries Corporation, whose net income continues to be recorded as revenue of core government. |
| ● | | Sinking Funds and Other Earnings – are interest and other investment earnings on sinking funds and other investments held by core government and Other Reporting Entities (ORE). For core government estimates purposes, investment revenue is netted against debt servicing costs. |
Expenditure has been classified by major sectors. See page B14 for a list of entities in the GRE.
| ● | | Health – represents all health-related expenditures including the activities of Manitoba Health, Seniors and Active Living; all Regional Health Authorities; hospitals and other health-related entities in the GRE. |
| ● | | Education – represents costs associated with all primary, secondary and post-secondary education, including the operations of universities and colleges, the activities of Manitoba Education and Training, and full funding for teachers’ pensions and programs funded by other sources. This also includes youth programs, workforce training, and immigration services. |
| ● | | Families – includes costs related to social service programs, including the activities of Manitoba Families and its authorities and Manitoba Housing and Renewal Corporation. |
| | |
B 10 / S u p p l e m e n t a r y F i n a n c i a l I n f o r m a t i o n B U D G E T 2 0 1 8 | | |
| ● | | Community, Economic and Resource Development – includes expenditures related to infrastructure and other government services, including the activities of Manitoba Agriculture; Manitoba Growth, Enterprise and Trade; Manitoba Indigenous and Northern Relations; Manitoba Infrastructure; Manitoba Municipal Relations; and Manitoba Sustainable Development. |
| ● | | Justice and Other Expenditures – includes costs for Manitoba Justice and the activities of the Legislative Assembly; Executive Council; Civil Service Commission, Employee Pensions and Other Costs; Manitoba Finance; Manitoba Sport, Culture and Heritage; and Enabling and Other Appropriations. |
| ● | | Debt Servicing – reflects the cost of interest and related expenses for the Teachers’ Retirement Allowances Fund, the Civil Service Superannuation Plan, capital funding and general purpose borrowings associated with all provincial summary borrowings, excluding debt servicing costs for debt incurred and repayable by the Manitoba Hydro-Electric Board. Debt servicing costs related to those borrowings are included in the net income of GBEs. |
In-Year Adjustments/Lapse – could be an increase in revenue and/or a decrease in expenditure.
Net Income (Loss) is the “bottom line” – the result after expenditure is subtracted from revenue. This represents the GRE’s financial result for the fiscal year.
FREQUENTLY ASKED QUESTIONS
| Q1 | What is a Summary Budget? |
| A | A Summary Budget is a comprehensive picture of core government expenditure and revenue together with high-level projections for the operations of Crown organizations, GBEs and public sector organizations such as regional health authorities, school divisions, universities and colleges. |
It is called a Summary Budget because the revenue and expenditure of general program and departmental operations of the government – the services of government usually associated with the Legislature – and the additional functions that are indirectly controlled by the provincial government, such as public schools and universities, are consolidated.
For example, public school expenditures paid for by school division property taxes and provincial support payments are shown together in one sum. This approach allows taxpayers to see the total cost of providing public school services.
| Q2 | How can I tell how much the government raises as revenue and plans to spend on core government programs and services? |
| A | Details of core government expenditure and revenue are presented in the Estimates of Expenditure and Revenue tabled in the Legislature. |
| Q3 | What entities are included in the Summary Budget and where can I get more information about their plans? |
| A | A listing of all the entities in the GRE is included on page B14. The Summary Budget combines the Estimates of Expenditure and Revenue for core government with projections for OREs. Questions about financial information of OREs should be directed to the appropriate entity. |
| | |
| | B U D G E T 2 0 1 8 S u p p l e m e n t a r y F i n a n c i a l I n f o r m a t i o n / B 11 |
| Q4 | As Manitoba’s Budget is presented for the GRE, will the government use the revenues of OREs to pay for core government operations? |
| A | A Summary Budget does not change the way in which core government operations are funded. Under the Summary Budget, only revenues from those Crown entities that have traditionally been used to support government programs and services (Manitoba Liquor and Lotteries Corporation and the Special Operating Agencies established by government) will continue to be used to support core government operations. |
| Q5 | If the government is not controlling the OREs directly, why does the government combine their revenue and expenses with its own in the Summary Budget? |
| A | The Manitoba government acted on the recommendations of the Office of the Auditor General for Manitoba. Generally Accepted Accounting Principles and the Public Sector Accounting Board standards for senior Canadian governments require all governments to prepare their annual financial statements on this basis. |
| Q6 | How do core government and summary expenses differ? |
| A | Core government expenses reflect the departmental expenditure estimates of the Manitoba government that are presented and approved by the Legislative Assembly. These expenditures include grants to OREs. The summary expenditures include incremental expenses of OREs that are financed from sources other than core government. The summary total reflects the total cost of the service provided, under the various sectors, that are financed by core government and the OREs. |
| Q7 | How does the Summary Budget treat pension liabilities? |
| A | The pension liability is recorded in full in the Summary Financial Statements and therefore, changes in this liability are reflected in the Summary Budget. The pension expenses include amounts that are funded through the appropriations of core government as well as summary adjustments for actuarially determined increases in the value of the outstanding pension liability. Pension expenses related to the Teachers’ Retirement Allowances Fund are included in the education sector. |
| Q8 | What is Other Comprehensive Income (OCI) and how does it impact the government’s summary results? |
| A | OCI applies to certain OREs, and represents unrealized gains or losses in fair market value of financial instruments, such as investments held for sale or debt held in a foreign currency. Changes in OCI are based upon “mark-to-market” variances at year end and therefore, are a one-day snapshot of the change in value when compared to the same day in the previous year. Because OCI represents an unrealized gain or loss, it does not impact an ORE’s annual operating results, and therefore, does not impact the government’s Summary Net Income. However, OCI does impact the balance sheet and therefore, will impact the government’s net debt and net debt to GDP. |
When the underlying investments are sold, or when the foreign held debt is retired, OCI gains or losses are realized, which will correspondingly impact an ORE’s net income and therefore the government’s summary net income.
| | |
B 12 / S u p p l e m e n t a r y F i n a n c i a l I n f o r m a t i o n B U D G E T 2 0 1 8 | | |
GLOSSARY OF KEY TERMS
Borrowings: Borrowings are securities issued in the name of the government to capital markets investors. Securities include debentures, treasury bills, promissory notes, medium-term notes and Manitoba Savings Bonds.
Core Government: A component of the GRE. Represents the operations of government, including the revenues directly under the government’s control, and the programs and services delivered by government departments.
Crown Organization: An organization in the GRE that is wholly owned or established by the government, such as a Crown corporation (ex. Manitoba Housing and Renewal Corporation).
Debt Servicing Cost: Interest and other expenses associated with provincial borrowings.
Fair Market Value: Represents the value obtainable for an asset, financial or non-financial, if disposed of on the open market.
Federal Recoveries and Transfers: Revenues that are either received or receivable from the federal government.
Financial Assets: Assets of the government such as cash, investments, loans and accounts receivable that could be readily converted to cash in order to pay the government’s liabilities or finance its future operations.
General Purpose Debt: General program borrowings including any government securities that are not self-sustaining, or are not associated with the acquisition of capital assets.
Government Business Enterprises (GBEs): A Crown organization delegated with the financial and operating authority to carry on a business. It sells goods or services to individuals and organizations outside the GRE and can maintain its business on those revenues.
Government Reporting Entity (GRE): Includes core government and Crown organizations, GBEs and public sector organizations such as regional health authorities, school divisions, universities and colleges.
Gross Domestic Product (GDP): Represents the total market value of all final goods and services produced in the Manitoba economy.
Guarantees: In the normal course of business, the government may provide a guarantee to honour the repayment of debt or loans of an organization, primarily GBEs. Such a guarantee is provided on the Manitoba Hydro Savings Bonds.
Infrastructure Assets: A subset of tangible capital assets that are used by the general public, such as parks, highways and bridges.
Net Debt to GDP Ratio: The ratio of government net debt relative to the total market value of all final goods and services produced in the Manitoba economy. Net debt represents the total liabilities of the government less its financial assets. It is widely used by credit rating agencies and other analysts to evaluate the financial situation and trends of jurisdictions in regard to their relative credit worthiness.
Net Financial Assets: Assets of the government (such as cash, investments, loans and accounts receivable) less accounts payable, that could be readily converted to cash in order to pay the government’s liabilities or finance its future operations.
Non-Financial Assets: Includes physical items such as tangible capital assets (ex. buildings and roads) and consumable goods such as inventories that are not normally converted to cash.
Obligations: Long-term, non-interest-bearing liabilities of the government, which may or may not carry specific repayment terms.
| | |
| | B U D G E T 2 0 1 8 S u p p l e m e n t a r y F i n a n c i a l I n f o r m a t i o n / B 13 |
Other Comprehensive Income (OCI): An accounting recognition of unrealized gains and losses in fair market value of financial instruments, such as investments held as available for sale or trading or debt held in a foreign currency. Currently, OCI accounting standards apply only to OREs, except not-for-profit organizations. It is measured as the change in “mark-to-market” valuations, interest rates, or foreign exchange rates at year end and therefore, is a one-day snapshot of the change in value when compared to the same day in the previous year.
Other Reporting Entities (OREs): Entities in the GRE such as Crown organizations, GBEs and public sector organizations such as regional health authorities, school divisions, universities and colleges that are directly or indirectly controlled by the government, as prescribed by the Public Sector Accounting Board – excludes core government.
Pension Assets Fund: Financial assets that are set aside to provide for the orderly retirement of the government’s pension obligations.
Pension Liability: Outstanding actuarially calculated pension liability of the government and participating Crown organizations. The expense includes amounts funded through the appropriations of core government as well as for the actuarially determined increases in the pension liability.
Public Sector Accounting Board (PSAB): A board established under the Chartered Professional Accountants of Canada responsible for setting accounting standards for the public sector.
Replacement Value of Assets: Represents the cost of replacing capital assets at current values.
Sinking Funds: Funds that are readily convertible to cash and set aside to provide for the orderly retirement of borrowings as they become due.
Summary Budget: Includes revenue forecasts and expenditure estimates for core government as well as high-level projections for the entities directly or indirectly controlled by government, as prescribed by the PSAB.
Summary Net Debt: Represents the total liabilities of the GRE less its financial assets. This is the residual amount that will have to be paid or financed by future revenue.
Tangible Capital Assets: Assets with a useful life extending beyond one year which are acquired, constructed or developed and held for use, not for resale.
| | |
B 14 / S u p p l e m e n t a r y F i n a n c i a l I n f o r m a t i o n B U D G E T 2 0 1 8 | | |
ENTITIES INCLUDED IN SUMMARY BUDGET
HEALTH
Manitoba Health, Seniors and Active Living
Addictions Foundation of Manitoba
CancerCare Manitoba
Manitoba Health Services Insurance Plan
Manitoba Hospital Capital Financing Authority
Not-for-Profit Personal Care Homes
Regional Health Authorities (including controlled organizations)
Interlake-Eastern Regional Health Authority
Northern Regional Health Authority Inc.
Prairie Mountain Health
Southern Health-Santé Sud
Winnipeg Regional Health Authority
Rehabilitation Centre for Children, Inc.
Shared Health
St. Amant
EDUCATION
Manitoba Education and Training
Assiniboine Community College
Brandon University
Manitoba Learning Resource Centre
Public School Divisions
Public Schools Finance Board
Red River College
Université de Saint-Boniface
University College of The North
University of Manitoba
University of Winnipeg
FAMILIES
Manitoba Families
First Nations of Northern Manitoba Child and Family Services Authority
General Child and Family Services Authority
Manitoba Housing and Renewal Corporation
Métis Child and Family Services Authority
Southern First Nations Network of Care
COMMUNITY, ECONOMIC AND RESOURCE DEVELOPMENT
Agriculture
Manitoba Agriculture
Farm Machinery and Equipment Act Fund
Food Development Centre
Manitoba Agricultural Services Corporation
Veterinary Science Scholarship Fund
Growth, Enterprise and Trade
Manitoba Growth, Enterprise and Trade
Abandonment Reserve Fund
Co-operative Loans and Loans Guarantee Board
Cooperative Promotion Board
Communities Economic Development Fund
Economic Development Winnipeg Inc.*
Entrepreneurship Manitoba
Industrial Technology Centre
Manitoba Development Corporation
Manitoba Potash Corporation
Manitoba Opportunities Fund Ltd.
Mining Community Reserve
Mining Rehabilitation Reserve Fund
Office of the Fire Commissioner
Quarry Rehabilitation Reserve Fund
Research Manitoba
Travel Manitoba
North Portage Development Corporation**
Workplace Safety and Health Public Education Fund
Indigenous and Northern Relations
Manitoba Indigenous and Northern Relations
Infrastructure
Manitoba Infrastructure
Crown Lands and Property Agency
Manitoba Trucking Productivity Improvement Fund
NOTES:
* Economic Development Winnipeg Inc. is a government partnership.
** North Portage Development Corporation is a government business partnership.
| | |
| | B U D G E T 2 0 1 8 S u p p l e m e n t a r y F i n a n c i a l I n f o r m a t i o n / B 15 |
Municipal Relations
Municipal Relations
Community Revitalization Fund
Manitoba Community Services Council Inc.
Manitoba Water Services Board
Sustainable Development
Manitoba Sustainable Development
Fish and Wildlife Enhancement Fund
Manitoba Habitat Heritage Corporation
Manitoba Hazardous Waste Management Corporation
Pineland Forest Nursery
Waste Reduction and Recycling Support Fund
JUSTICE AND OTHER EXPENDITURES
Legislative Assembly
Legislative Assembly
Executive Council
Executive Council
Civil Service Commission
Civil Service Commission
Employee Pensions and Other Costs
Pension Assets Fund
Finance
Manitoba Finance
Insurance Council of Manitoba
Leaf Rapids Town Properties Ltd.
Manitoba Centennial Centre Corporation
Manitoba Education, Research and Learning Information Networks (MERLIN)
Manitoba Financial Services Agency
Materials Distribution Agency
Special Operating Agencies Financing Authority
Vehicle and Equipment Management Agency
Justice
Manitoba Justice
Financial Literacy Fund
Funeral Board of Manitoba
Helen Betty Osborne Memorial Foundation
Land Titles Assurance Fund
Legal Aid Manitoba
Liquor and Gaming Authority of Manitoba
Manitoba Horse Racing Commission
Manitoba Law Reform Commission
The Public Guardian and Trustee of Manitoba
Victims Assistance Fund
Vital Statistics Agency
Sport, Culture and Heritage
Manitoba Sport, Culture and Heritage
Le Centre culturel franco-manitobain
Manitoba Arts Council
Manitoba Combative Sports Commission
Manitoba Film and Sound Recording Development Corporation
Sport Manitoba Inc.
GOVERNMENT BUSINESS ENTERPRISES
Deposit Guarantee Corporation of Manitoba
Manitoba Hydro-Electric Board
Manitoba Liquor and Lotteries Corporation
Manitoba Public Insurance Corporation
Workers Compensation Board of Manitoba
SPECIAL ACCOUNTS, not attached to Sector or Department
Fiscal Stabilization
| | |
B 1 6 / S u p p l e m e n t a r y F i n a n c i a l I n f o r m a t i o n B U D G E T 2 0 1 8 | | |
Budget Paper C
TAX MEASURES
TAX MEASURES
CONTENTS
| | | | |
FISCAL SUMMARY OF TAX MEASURES | | | C1 | |
| |
INTRODUCTION | | | C2 | |
| |
CARBON TAX | | | C3 | |
| |
PERSONAL TAX MEASURES | | | C4 | |
| |
BUSINESS TAX MEASURES | | | C6 | |
| |
TAX CREDIT EXTENSIONS | | | C8 | |
| |
ON-GOING TAX MEASURES | | | C8 | |
| |
ADMINISTRATIVE AND TECHNICAL TAX MEASURES | | | C9 | |
| |
INTERPROVINCIAL COMPARISON OF TAX RATES | | | C10 | |
| |
CONTACTS FOR FURTHER INFORMATION | | | C12 | |
| | |
| | B U D G E T 2 0 1 8 T a x M e a s u r e s / C 1 |
FISCAL SUMMARY OF TAX MEASURES
A positive amount means an increase in revenue or a decrease in expenditure.
| | | | | | | | |
| | | 2018/19 | | Full Year |
| | | Millions of Dollars |
Carbon Tax | | | 143.0 | | | | 248.0 | |
| | |
Personal Tax Measures | | | | | | | | |
| | |
Basic Personal Amount–increased | | | -19.0 | | | | -156.0 | |
| | |
Primary Caregiver Tax Credit–red tape reduction | | | -0.2 | | | | -0.2 | |
| | |
Education Property Tax Credit–red tape reduction | | | -0.1 | | | | -0.1 | |
| | |
Tobacco tax–aligned | | | 7.0 | | | | 7.0 | |
| | | | | | | | |
| | | -12.3 | | | | -149.3 | |
| | |
Business Tax Measures | | | | | | | | |
| | |
Small Business Deduction–increased | | | -1.8 | | | | -7.0 | |
| | |
Child Care Centre Development Tax Credit–introduced | | | -0.4 | | | | -0.4 | |
| | |
Small Business Venture Capital Tax Credit–enhanced | | | -0.2 | | | | -0.2 | |
| | |
Credit Unions and Caisses Populaires Profits Tax–eliminated | | | -0.3 | | | | -1.0 | |
| | |
Retail Sales Tax–exemptions | | | -1.4 | | | | -1.5 | |
| | |
Credit Unions Special Deduction–phased elimination | | | 0.8 | | | | 15.0 | |
| | |
Rental Housing Construction Tax Credit–eliminated | | | 0.0 | | | | 3.1 | |
| | |
Labour-Sponsored Funds Tax Credit–eliminated | | | 0.1 | | | | 0.1 | |
| | | | | | | | |
| | | -3.2 | | | | 8.1 | |
| | |
Tax Credit Extensions | | | | | | | | |
| | |
Manitoba Book Publishing Tax Credit–extended | | | -0.2 | | | | -0.6 | |
| | |
Cultural Industries Printing Tax Credit–extended | | | -0.2 | | | | -0.8 | |
| | | | | | | | |
| | | -0.4 | | | | -1.4 | |
| | |
On-going Tax Measures | | | | | | | | |
| | |
Personal income tax brackets–indexation | | | -9.4 | | | | -10.1 | |
| | | | | | | | |
| | |
Total Fiscal Impact | | | 117.7 | | | | 95.3 | |
| | | | | | | | |
| | |
C 2 / T a x M e a s u r e s B U D G E T 2 0 1 8 | | |
INTRODUCTION
Budget 2018 announces personal and business tax measures that continue the government’s efforts toward making Manitoba the most improved province in Canada on tax relief by 2020.
As government focuses on addressing our fiscal challenges through this Budget and in the years ahead, we have continued to listen to Manitobans so that their priorities and suggestions inform government direction. Budget 2018 is informed first and foremost by pre-budget consultations that engaged close to 35,000 Manitobans. This is almost double the number of citizens that participated in the most extensive pre-budget consultation Manitobans had ever seen in preparation for Budget 2017, which had included over 18,000 interactions with Manitobans. Consultations included an online survey, community engagement and three telephone town halls. In addition, hundreds of Manitobans wrote the Minister of Finance to offer their input and highlight their priorities for Budget 2018.
The tax measures announced in this Budget will continue to grow our economy, creating jobs and encouraging new investment, and will also serve to more efficiently provide the benefits and services that Manitobans expect and deserve.
These measures also support the Minister of Finance’s mandate to restore the fiscal integrity of the province and move to a balanced budget.
| | |
| | B U D G E T 2 0 1 8 T a x M e a s u r e s / C 3 |
CARBON TAX
2018/19 revenue impact: +$143.0 million
Manitoba’s carbon tax will impose a $25 tax per tonne of greenhouse gas emissions beginning on September 1, 2018 and will apply to gas, liquid, and solid fuel products intended for combustion (referred to as fuels) in Manitoba. The carbon tax is estimated to generate $248 million in government revenue during the first twelve months.
Households and businesses will be impacted by the carbon tax in different ways, proportional to their use of carbon-emitting fuels. The majority of the costs incurred by the tax come from space heating and transportation fuels. Figure 1 illustrates the increased costs for the main types of fuel consumed in Manitoba, with the full list of fuels to be outlined in legislation.
The existing International Fuel Tax Agreement (IFTA) rules for commercial transportation and trucking that prorate fuel-use charges to a jurisdiction will also apply to the carbon tax in Manitoba.
Certain fuel uses will not be subject to the carbon tax. Exemptions are provided to protect Manitoba sectors and industries that are trade-exposed to jurisdictions which do not have a comparable carbon price, to protect Manitoba’s agricultural sector, and to only apply the carbon tax on emissions occurring in Manitoba. In addition to these fossil fuel exemptions, other emissions, including from agricultural processes, as well as from landfills and other sources, will also be exempted. An overview of the main exemptions is outlined below.
Agricultural process emissions: All agricultural process-related emissions are exempted from the carbon tax (e.g., emissions from soil and animals).
Marked fuels: All marked fuels, including marked gasoline and marked diesel, will be exempted from the carbon tax. It’s estimated that 90 per cent of marked fuels in Manitoba are consumed in the agricultural sector, with the remainder consumed by the fishing, forestry, mining and other sectors. Exempting all eligible marked fuel uses from the tax will ease the compliance requirement on fuel providers and users.
Output-Based Pricing System (OBPS) Entities: Until 2019, all entities that are to be included by the government in the OBPS will receive an exemption or a refund from the carbon tax on all their emissions from fuels consumed on-site and process emissions. The OBPS will apply to entities emitting at least 50,000 tonnes of CO2eq per year with smaller emitters able to opt-in upon review and approval by the government.
The carbon tax on transportation fuels will be collected and remitted to the province through the existing fuel tax system. The carbon tax on natural gas will be collected by Manitoba Hydro. Carbon levies on other carbon-intensive fuels will be required to be collected and remitted by the purchaser to the province.
Figure 1. Carbon Tax Rates by Select Fuel Type (2018–2022)
| | | | |
Fuel Type | | Carbon Tax
Rate Per Unit | | |
| | |
Gasoline | | 5.32 ¢/L | | |
| | |
Diesel | | 6.71 ¢/L | | |
| | |
Natural Gas | | 4.74 ¢/m3 | | |
| | |
Propane | | 3.87 ¢/L | | |
Additional administrative guidance will be made available on the collection of the carbon tax.
The estimated full-year revenue impact in 2020 is +$248.0 million.
For more information, please contact Location D, page C12.
| | |
C 4 / T a x M e a s u r e s B U D G E T 2 0 1 8 | | |
PERSONAL TAX MEASURES
Basic Personal Amount
2018/19 revenue impact: -$19.0 million
Budget 2018 announces the largest ever enhancement to the Basic Personal Amount (BPA) over the coming two years. Effective for the 2019 tax year, the BPA will be increased from $9,382 to $10,392, equal to $109 tax savings for an individual. Effective for the 2020 tax year, the BPA will be increased from $10,392 to $11,402, equal to another $109 tax savings for an individual. This increases the BPA by a combined $2,020 by 2020.
This measure will remove over 31,000 taxpayers from the tax rolls and save Manitobans over $77 million in 2019 and an additional $78 million in 2020.
The $2,020 by 2020 plan advances the savings of indexation to Manitobans. By having the benefit of this higher BPA in 2020, Manitobans will save an estimated $675 million between 2018 and 2028.
The BPA is one of the non-refundable tax credits every Manitoba resident is entitled to claim on their income tax return. Budget 2016 announced indexing of the BPA and personal income tax brackets starting in 2017. Indexing of the BPA removed an estimated 2,170 Manitobans from the tax rolls and saved Manitobans $10 million in 2017. Indexing the BPA in 2018 will remove another 1,730 Manitobans off the tax rolls and will have saved Manitobans a cumulative $18 million over two years.
The estimated full-year revenue impact in 2020 is -$156.0 million.
Figure 2. Cumulative Impacts of Increases to the BPA
| | | | | | | | | | | | | | | | | | | | | | | | | |
Year | | BPA | | Individual
Taxpayer Savings1 | | Incremental
Taxpayer Savings2 | | Taxes Saved
by Manitobans | | Individuals
no Longer
Paying Tax |
| | | | | |
2017 | | | | $9,271 | | | | | $1,001 | | | | | $15 | | | | | $10 million | | | | | 2,170 | |
| | | | | |
2018 | | | | $9,382 | | | | | $1,013 | | | | | $27 | | | | | $18 million | | | | | 3,900 | |
| | | | | |
2019 | | | | $10,392 | | | | | $1,122 | | | | | $136 | | | | | $95 million | | | | | 19,700 | |
| | | | | |
2020 | | | | $11,402 | | | | | $1,231 | | | | | $245 | | | | | $173 million | | | | | 35,500 | |
1 Savings calculated as the value of the BPA times the lowest personal income tax rate of 10.8%.
2 Savings for an individual resulting from the increase to the higher BPA alone.
For more information, please contact Location B, page C12.
| | |
| | B U D G E T 2 0 1 8 T a x M e a s u r e s / C 5 |
Primary Caregiver Tax Credit
2018/19 and full-year revenue impact: -$0.2 million
Effective immediately, the process for claiming the Primary Caregiver Tax Credit will be simplified by removing complicated paperwork. The requirement to complete an application for pre-approval by the Regional Health Authorities or Manitoba Families is eliminated. Instead of seeking approval of an application, caregivers will now only be required to complete a registration form, submit a copy of the form to Manitoba Finance, and continue to claim the credit on the income tax return. Individual caregivers who applied to Manitoba Health or Families between January 1, 2018 and March 12, 2018 will have their forms forwarded to Manitoba Finance for registration.
The claim process will also be significantly simplified by implementing a flat $1,400 annual credit available to all eligible caregivers. This eliminates the requirement to calculate the credit based on the number of days that care was provided. The requirement to provide a minimum of 90-days of care before eligibility commences remains in place.
These improvements are a result of a continuous improvement Lean exercise that was undertaken by government with the goal of making it easier for caregivers to access the credit.
For more information, please contact Location B, page C12.
Education Property Tax Credit
2018/19 and full-year fiscal impact: -$0.1 million
Effective for 2019, the calculation of the Education Property Tax Credit will be based on school taxes and the $250 deductible will be eliminated. The Seniors’ Education Property Tax Credit would also be calculated on the school tax portion. This change makes all property tax credits, including the Education Property Tax Credit, Farmland School Tax Rebate, Seniors’ School Tax Rebate, and the School Tax Credit for Homeowners based on school taxes.
Annual school taxes that are equal to or greater than $700 receive the full rebate amount. A renter paying at least $3,500 of rent per year will be eligible for the full $700 basic credit. Prior to the elimination of the deductible, this amount was over $4,700.
For more information, please contact Location B, page C12.
Tobacco Tax
2018/19 and full-year revenue impact: +$7.0 million
Effective midnight, March 12, 2018, the Tobacco Tax rate for fine cut tobacco is increased from 28.5¢ per gram to 45¢ per gram. The Tobacco Tax rate on cigarettes, cigars and raw leaf tobacco remains unchanged.
For more information, please contact Location D, page C12.
| | |
C 6 / T a x M e a s u r e s B U D G E T 2 0 1 8 | | |
BUSINESS TAX MEASURES
Small Business Deduction
2018/19 revenue impact: -$1.8 million
Budget 2018 increases the small business income limit eligible for the small business deduction from $450,000 to $500,000 on January 1, 2019. Canadian-controlled private corporations that qualify for the small business deduction pay a 0% rate of Manitoba corporation income tax. The savings for a corporation as a result of this enhancement are up to $6,000 per year.
The estimated additional full-year savings for corporations is $7 million.
For more information, please contact Location B, page C12.
Child Care Centre Development Tax Credit
2018/19 and full-year revenue impact: -$0.4 million
A new refundable corporation income tax credit is introduced to stimulate the creation of licensed child care centres in work places.
The tax credit will be available for private corporations that create new child care centres for a total benefit of $10,000 per new infant or preschool space created, claimable over five years. The credit would be available for licensed spaces created by a taxable corporation that is not primarily engaged in child care services, effective after Budget day and before 2021. The total number of spaces will initially be limited to 200 under this program, but may be increased over time.
For more information, please contact Location E, page C12.
Small Business Venture Capital Tax Credit
2018/19 and full-year revenue impact: -$0.2 million
Effective March 12, 2018, the $15 million revenue cap on the size of an eligible corporation is eliminated and the investment minimum is lowered from $20,000 to $10,000. These enhancements will allow larger corporations to access the credit while also allowing for smaller investments by shareholders.
The Small Business Venture Capital Tax Credit promotes, among Manitoba-resident individuals and companies, the acquisition of equity capital in emerging enterprises that require larger amounts of capital. This 45 per cent investment tax credit offsets Manitoba income tax otherwise payable.
For more information, please contact Location C, page C12.
Credit Unions and Caisses Populaires Profits Tax
2018/19 revenue impact: -$0.3 million
Credit unions and caisses populaires in Manitoba are currently subject to a 1 per cent profits tax on taxable income over $400,000. Effective January 1, 2019, the Credit Unions and Caisses Populaires Profits Tax is eliminated.
The estimated full-year revenue impact is -$1 million.
For more information, please contact Location D, page C12.
| | |
| | B U D G E T 2 0 1 8 T a x M e a s u r e s / C 7 |
Retail Sales Tax
2018/19 revenue impact: -$1.4 million
The following exemptions will be applied effective May 1, 2018:
| ● | | Drill bits designed specifically for oil or gas exploration or development; and |
| ● | | Fertilizer bins used in a farming operation. |
The estimated full-year revenue impact is -$1.5 million.
For more information, please contact Location D, page C12.
Credit Unions Special Deduction
2018/19 revenue impact: +$0.8 million
The special tax deduction which currently allows credit unions and caisses populaires to pay a lower rate of tax on a portion of their income is being phased out over five years beginning on January 1, 2019. Some provinces and the federal government have also eliminated or are currently phasing out this tax benefit. Credit unions will continue to have access to the small business deduction, as do Canadian-controlled private corporations.
The estimated full-year revenue impact when fully implemented in 2023 is +$15.0 million.
For more information, please contact Location A, page C12.
Labour-Sponsored Funds Tax Credit
2018/19 and full-year revenue impact: +$0.1 million
The Labour-Sponsored Funds Tax Credit is eliminated for shares acquired after 2018. The credit was first introduced in 1991-92 and is virtually unused by Manitobans.
For more information, please contact Location C, page C12.
Rental Housing Construction Tax Credit
No revenue impact in 2018/19
Effective for January 1, 2019, the Rental Housing Construction Tax Credit is eliminated. Projects currently under provincial review or with provincial approvals are not affected. No new project applications will be processed after 2018 and any future projects must be available for use before 2021.
The estimated full-year revenue impact is +$3.1 million.
For more information, please contact Location F, page C12.
| | |
C 8 / T a x M e a s u r e s B U D G E T 2 0 1 8 | | |
TAX CREDIT EXTENSIONS
2018/19 fiscal impact: -$0.4 million
The following tax credits are extended:
The Manitoba Book Publishing Tax Credit, scheduled to expire on December 31, 2018, is extended for one year to December 31, 2019. This program assists the development of Manitoba’s book publishing industry.
The Cultural Industries Printing Tax Credit, scheduled to expire on December 31, 2018, is extended for one year to December 31, 2019. This program assists the development of Manitoba’s printing industry.
For more information, please contact Location G, page C12.
ON-GOING TAX MEASURES
Indexing of Personal Income Tax Brackets
2018/19 revenue impact: -$9.4 million
Entrenched in legislation in 2016, Manitoba personal income tax brackets have been indexed to inflation by the Manitoba Consumer Price Index (CPI) beginning in the 2017 tax year. The tax brackets will continue to be indexed in future years as forecasted in the table below.
The table illustrates the savings for taxpayers that result from indexation under each of Manitoba’s three tax brackets.
The estimated full-year revenue impact is -$10.1 million.
Figure 3.
| | | | | | | | |
Tax Year | | Tax Rates | | 10.80% | | 12.75% | | 17.40% |
| | | | |
2016 | | Brackets | | $0 to $31,000 | | $31,000 to $67,000 | | over $67,000 |
| | | | |
2017 | | | | $0 to $31,465 | | $31,465 to $68,005 | | over $68,005 |
| | | | |
| | | | savings of $9 | | savings of $56 | | savings of $56 |
| | | | |
2018 | | | | $0 to $31,843 | | $31,843 to $68,821 | | over $68,821 |
| | Maximum | | | | | | |
| | taxpayer | | savings of $7 | | savings of $45 | | savings of $45 |
| | savings from | | | | | | |
2019f | | indexation | | $0 to $32,448 | | $32,448 to $70,129 | | over $70,129 |
| | | | |
| | | | savings of $12 | | savings of $73 | | savings of $73 |
| | | | |
2020f | | | | $0 to $33,129 | | $33,129 to $71,601 | | over $71,601 |
| | | | |
| | | | savings of $13 | | savings of $82 | | savings of $82 |
Total savings by 2020 | | $42 | | $255 | | $255 |
f = forecasted indexation based on CPI projections
For more information, please contact Location B, page C12.
| | |
| | B U D G E T 2 0 1 8 T a x M e a s u r e s / C 9 |
ADMINISTRATIVE AND TECHNICAL TAX MEASURES
Tax Administration and Miscellaneous Taxes Act
Streamlining tobacco tax enforcement measures and administration of the insurance corporations tax.
For more information, please contact Location D, page C12.
Income Tax Act
The process that allows new or first time homeowners who are eligible to apply the basic $700 Education Property Tax Credit on the property tax statement for their principal residence is being streamlined, reducing costs for Manitobans and the province. Instead of applying to Manitoba Finance during a limited period of the year, homeowners will be able to self-assess and notify their municipal office at any time throughout the year.
| ● | | Homeowners who notify their municipality before the printing of the municipal property tax statement for the year will have the credit applied starting in that year. |
| ● | | Homeowners who notify their municipality after the printing of the municipal property tax statement for the year may claim the credit on their personal income tax return for that year and will receive the credit on their property tax statement in subsequent years. |
A new or first time homeowner could include, for example, someone moving to Manitoba, someone leaving rental accommodations and moving into a home, or someone in a newly constructed home. Homeowners who already receive the tax credit on their property tax statement are not impacted.
These enhancements are made as the result of a Lean continuous improvement exercise.
Community Enterprise Development Tax Credit regulations will be amended to remove ambiguity respecting Cooperative’s access to the program and improve administration.
Research and Development Tax Credit provisions will be updated to ensure consistency with changes that have been made to the federal Income Tax Act.
Small business deduction for credit union provisions are being amended retroactively to ensure that the administration of this credit reflects Manitoba’s legislation and policy.
Right-of-recovery provisions are amended to reflect the federal administration of the deduction of Manitoba tax credits from taxpayers who have taxes owing in other provinces.
Green Energy Equipment Tax Credit regulation making powers are amended to allow the Minister of Finance to create retroactive regulations for this tax credit.
For more information, please contact Location A, page C12.
Chiropractors Act
Amendments will be made to allow chiropractors to provide their professional services through a professional corporation.
| | |
C 10 / T a x M e a s u r e s B U D G E T 2 0 1 8 | | |
INTERPROVINCIAL COMPARISON OF TAX RATES (applicable to end of 2018/19)
Data as of March 1, 2018
| | | | | | | | | | | | | | | | | | | | | | | | |
| | | CAN | | BC | | AB | | SK | | MB | | ON |
| | | | | | |
Personal Income Tax | | | | | | | | | | | | | | | | | | | | | | | | |
| | | | | | |
Basic Personal AmountA | | $ | 11,809 | | | $ | 10,412 | | | $ | 18,915 | | | $ | 16,065 | | | $ | 10,392 | | | $ | 10,354 | |
| | | | | | |
Top Rate (%) | | | 33 | | | | 16.8 | | | | 15 | | | | 14.5 | | | | 17.4 | | | | 20.53 | |
| | | | | | |
Health Care Premiums ($) | | | | | | | 450 | | | | | | | | | | | | | | | | 900 | |
| | | | | | |
Health and Education Tax (%) | | | | | | | 1.95 | | | | | | | | | | | | 2.15 | | | | 1.95 | |
| | | | | | |
Corporation Income Tax (%) | | | | | | | | | | | | | | | | | | | | | | | | |
| | | | | | |
Small | | | 10 | | | | 2 | | | | 2 | | | | 2 | | | | 0 | | | | 3.5 | |
| | | | | | |
Large | | | 15 | | | | 12 | | | | 12 | | | | 12 | | | | 12 | | | | 11.5 | |
| | | | | | |
Manufacturing | | | 15 | | | | 12 | | | | 12 | | | | 10 | | | | 12 | | | | 10 | |
| | | | | | |
Small business limit ($000) | | | 500 | | | | 500 | | | | 500 | | | | 600 | | | | 500 | | | | 500 | |
| | | | | | |
Capital Tax on Banks (%) | | | | | | | | | | | | | | | 4 | | | | 6 | | | | | |
| | | | | | |
Sales Tax (%) | | | 5 | | | | 7 | | | | | | | | 6 | | | | 8 | | | | 8 | |
| | | | | | |
Fuel Tax | | | | | | | | | | | | | | | | | | | | | | | | |
| | | | | | |
Gasoline (¢/l) | | | 10 | | | | 14.5 | | | | 13 | | | | 15 | | | | 14 | | | | 14.7 | |
| | | | | | |
Diesel (¢/l) | | | 4 | | | | 15 | | | | 13 | | | | 15 | | | | 14 | | | | 14.3 | |
| | | | | | |
Carbon Tax | | | | | | | B | | | | | | | | | | | | | | | | C | |
| | | | | | |
Gasoline (¢/l) | | | 2.33 | | | | 6.67 | | | | 6.73 | | | | 0 | | | | 5.32 | | | | | |
| | | | | | |
Diesel (¢/l) | | | 2.74 | | | | 7.67 | | | | 8.03 | | | | 0 | | | | 6.71 | | | | | |
| | | | | | |
Tobacco Tax (¢/cigarette) | | | 11.927 | | | | 27.5 | | | | 25 | | | | 27 | | | | 29.5 | | | | 16.475 | D |
| A | Reflects MB Basic Personal Amount (BPA) effective January 1, 2019. |
| B | BC carbon tax will be increased annually to reflect a $5 per tonne of CO2 emissions until $50 per tonne is reached in April 2021. |
| C | ON, QC and NS indicated a cap and trade system. PE and NL unknown. |
| D | ON 2018 and 2019 tobacco taxes will be increased by an additional 2 cents per cigarette or gram of tobacco each year. |
| E | NB announced 2.33 cents per litre of existing gasoline taxes and 2.76 cents per litre of existing fuel taxes would be transferred to the Climate Change Fund. |
| | |
| | B U D G E T 2 0 1 8 T a x M e a s u r e s / C 11 |
| | | | | | | | | | | | | | | | | | | | |
| QC | | | NB | | NS | | PE | | NL | | |
| | | | | |
| | | | | | | | | | | | | | | | | | | | Personal Income Tax |
| | | | | |
| | $15,012 | | | | $10,043 | | | | $8,481 | | | | $8,160 | | | | $9,247 | | | Basic Personal AmountA |
| | | | | |
| | 25.75 | | | | 20.3 | | | | 21 | | | | 16.7 | | | | 18.3 | | | Top Rate (%) |
| | | | | |
| | | | | | | | | | | | | | | | | | | | Health Care Premiums ($) |
| | | | | |
| | 4.26 | | | | | | | | | | | | | | | | | | | Health and Education Tax (%) |
| | | | | |
| | | | | | | | | | | | | | | | | | | | Corporation Income Tax (%) |
| | | | | |
| | 8 | | | | 2.5 | | | | 3 | | | | 4.5 | | | | 3 | | | Small |
| | | | | |
| | 11.6 | | | | 14 | | | | 16 | | | | 16 | | | | 15 | | | Large |
| | | | | |
| | 11.6 | | | | 14 | | | | 16 | | | | 16 | | | | 15 | | | Manufacturing |
| | | | | |
| | 500 | | | | 500 | | | | 500 | | | | 500 | | | | 500 | | | Small business limit ($000) |
| | | | | |
| | | | | 5 | | | | 4 | | | | 5 | | | | 6 | | | Capital Tax on Banks (%) |
| | | | | |
| | 9.975 | | | | 10 | | | | 10 | | | | 10 | | | | 10 | | | Sales Tax (%) |
| | | | | |
| | | | | | | | | | | | | | | | | | | | Fuel Tax |
| | | | | |
| | 19.2 | | | | 15.5E | | | | 15.5 | | | | 13.1 | | | | 20.5 | | | Gasoline (¢/l) |
| | | | | |
| | 20.2 | | | | 21.5 | | | | 15.4 | | | | 20.2 | | | | 21.5 | | | Diesel (¢/l) |
| | | | | |
| | C | | | | | | | | C | | | | C | | | | C | | | Carbon Tax |
| | | | | |
| | | | | | | | | | | | | | | | | | | | Gasoline (¢/l) |
| | | | | |
| | | | | | | | | | | | | | | | | | | | Diesel (¢/l) |
| | | | | |
| | 14.9 | | | | 25.52 | | | | 27.52 | | | | 25 | | | | 24.5 | | | Tobacco Tax (¢/cigarette) |
| | |
C 12 / T a x M e a s u r e s B U D G E T 2 0 1 8 | | |
CONTACTS FOR FURTHER INFORMATION
| | | | | | |
| | | | | | |
A | | Finance Research Division | | Telephone | | 204-945-3757 |
| | Manitoba Finance | | Fax | | 204-945-5051 |
| | | | E-mail | | feedbackfin@gov.mb.ca |
| | | | | | |
| | | |
B | | Manitoba Tax Assistance Office | | Telephone | | 204-948-2115 in Winnipeg |
| | Manitoba Finance | | Toll-free | | 1-800-782-0771 |
| | | | Fax | | 204-948-2263 |
| | | | E-mail | | tao@gov.mb.ca |
| | | | | | |
| | | | | | |
C | | Enterprise, Innovation and Trade Division | | Telephone | | 204-945-2700 |
| | Manitoba Growth, Enterprise and Trade | | Fax | | 204-945-1193 |
| | | | E-mail | | EnterpriseBranchGeneral@gov.mb.ca |
| | | | | | |
| | | |
D | | Taxation Division | | Telephone | | 204-945-5603 in Winnipeg |
| | Manitoba Finance | | Toll-free | | 1-800-782-0318 |
| | | | Fax | | 204-945-0896 |
| | | | E-mail | | mbtax@gov.mb.ca |
| | | | | | |
| | | | | | |
E | | Early Learning and Child Care Program | | Telephone | | 204-945-0776 in Winnipeg |
| | Manitoba Families | | Toll-free | | 1-888-213-4754 |
| | | | E-mail | | cdcinfo@gov.mb.ca |
| | | | | | |
| | | |
F | | Manitoba Housing | | Telephone | | 204-945-5566 in Winnipeg |
| | Manitoba Families | | Toll-free | | 1-866-689-5566 |
| | | | E-mail | | housing@gov.mb.ca |
| | | | | | |
| | | | | | |
G | | Arts Branch | | Telephone | | 204-945-3847 |
| | Manitoba Sports, Culture and Heritage | | E-mail | | artsbranch@gov.mb.ca |
| | | | | | |
| | | |
H | | Climate Change and Air Quality Branch | | Telephone | | 204-945-7084 |
| | Manitoba Sustainable Development | | E-mail | | ccinfo@gov.mb.ca |
For information on government programs, individuals can contact Manitoba Government Inquiry by calling 204-945-3744 in Winnipeg or toll-free 1-866-626-4862.
Budget Paper D
FISCAL ARRANGEMENTS
FISCAL ARRANGEMENTS
CONTENTS
| | | | |
INTRODUCTION | | | D1 | |
| |
CANADA’S FISCAL FEDERALISM | | | D1 | |
| |
History of Fiscal Federalism | | | D2 | |
| |
INTERGOVERNMENTAL TRANSFERS | | | D2 | |
| |
Equalization | | | D5 | |
| |
How Equalization Entitlements are Determined | | | D6 | |
| |
Canada Social Transfer | | | D7 | |
| |
Canada Health Transfer | | | D7 | |
| |
OTHER TRANSFERS TO GOVERNMENT | | | D8 | |
| |
SUPPORT TO INDIVIDUALS | | | D9 | |
| |
Pooled Registered Pension Plans | | | D10 | |
| |
Modernizing the Canada Pension Plan | | | D12 | |
| |
The Retirement Income System and Lower Income Seniors | | | D13 | |
| |
CONCLUSION | | | D13 | |
| | |
| | B U D G E T 2 0 1 8 F i s c a l A r r a n g e m e n t s / D 1 |
INTRODUCTION
In Canada, the provinces and territories have primary program delivery and spending responsibilities for health care, education and social services, and social assistance. The federal government has a constitutionally defined role to collect revenues on behalf of all Canadians and provide ongoing funding to the provinces and territories to support their responsibilities in these and other areas. Most of this funding comes through the major federal transfers, including the Canada Health Transfer (CHT), Canada Social Transfer (CST), Equalization and Territorial Formula Financing (TFF).
Health care is the single most important priority of Canadians and the largest budget item for provinces and territories, typically accounting for about 40% of total program expenditures. As such, recent developments in the way the federal government supports health care are particularly concerning.
Manitoba is disappointed with the federal government’s current approach and commitment to supporting health care for Canadians. In the past, the provinces and federal government funded eligible health care costs on a 50-50 basis. Today, provinces fund almost 80% of the cost of health care. This deterioration in federal support is set to continue. Over the next 10 years, Manitoba will receive far less through existing funding arrangements than it would have under previous arrangements.
Cooperation and collaboration between the provinces, territories and the Government of Canada has been critical to the development and evolution of Canada’s system of fiscal federalism. Manitoba will continue to press the federal government to pursue sustainable, long-term fiscal arrangements that support the health and social programs that are important to Manitobans and Canadians.
CANADA’S FISCAL FEDERALISM
Fiscal federalism is about more than transfer payments between orders of government. It is about the types, quality and comparability of public services Canadians receive and the amount of tax they pay. It is about fairness and the collective notion of citizenship.
Fiscal federalism refers to the division of responsibilities among the different levels of government, and the system of transfer payments or grants through which the central government shares its revenues with other orders of government.
Since Confederation in 1867, Canada’s system of fiscal federalism has evolved and adapted in response to changing circumstances and needs brought on by industrialization, the Great Depression, World Wars, the growth of social programs, urbanization, technological change and globalization.
Today, and in coming years, the aging of the population will create new and growing challenges for fiscal federalism and the system of intergovernmental fiscal transfers.
Governments must continue to work effectively in partnership to develop new mechanisms and solutions to address the changing needs of Canadians.
| | |
D 2 / F i s c a l A r r a n g e m e n t s B U D G E T 2 0 1 8 | | |
History of Fiscal Federalism
The Constitution Act of 1867 gave provinces exclusive jurisdiction over health care, primary and secondary education, natural resources, municipal institutions, social assistance and social services. The federal government has exclusive jurisdiction over criminal law, border security, foreign affairs, railways, telecommunications, money and banking. Direct taxation, pensions, immigration, agriculture and post-secondary education and training are examples of areas of joint jurisdictional responsibility.
The distinct division of responsibilities between the provinces and federal government initially envisioned at the start of Confederation soon began to evolve as governments adapted to changing circumstances and needs. Health, education, social services and social assistance, initially thought to be small, local services, soon grew to be the largest and most costly of government responsibilities. This created a financial strain for provincial governments and led to increased federal transfers and fiscal interdependence in areas originally intended for exclusive provincial jurisdiction.
The Second World War resulted in fiscal rebalancing between the two orders of government by way of temporary “tax rental agreements” under which provinces agreed to relinquish access to a number of their tax fields in exchange for grants from the federal government.
The decades following the end of the Second World War were highlighted by the development and financing of Canada’s major social transfer programs. Following the war, Canadians demanded more and better health, education and other social services. In response, and in collaboration with provincial governments, the federal government used its greater fiscal capacity and federal spending power to establish a number of shared-cost or conditional grant programs, typically on a 50-50 basis.
Although the use of federal spending power in areas of provincial jurisdiction has been criticized for distorting provincial spending priorities and creating fiscal uncertainty, it has played a crucial role in the evolution of Canada’s fiscal federalism and in the establishment of national programs for public health care, post-secondary education and social security, including the Equalization program.
INTERGOVERNMENTAL TRANSFERS
Canada’s system of fiscal federalism has adapted and evolved to meet the changing needs of Canadians and the federation, moving from a distinct division of government responsibilities at the time of Confederation to a system of collaboration and fiscal partnership that continues today.
A key principle of our federation is that Canadians should have access to reasonably comparable levels of public services and they should pay for those services at reasonably comparable rates of taxation.
Canada is different from countries with a single level or “unitary” form of government. In these countries, there is a single system of taxation and the central government can more easily provide a consistent level of public services in all parts of the country.
| | |
| | B U D G E T 2 0 1 8 F i s c a l A r r a n g e m e n t s / D 3 |
In Canada, while all provinces have the same constitutional spending responsibilities, not all have the same revenue-raising capacity due to differences in factors such as demographics, geography and natural resource endowments. The federal government helps the provinces and territories overcome these differences by redistributing the tax revenue it collects using intergovernmental transfers.
| | | | | | |
In the absence of such transfer arrangements, Canadians living in less wealthy regions of the country would pay higher rates of tax and/or receive lower levels of public services than Canadians living in more wealthy regions. In 2016/17, federal transfers accounted for between 16% and 39% of total revenue in each province. In Manitoba, federal transfers accounted for 26% of total revenue, up from 25% in 2015/16, but below the 29% 10-year average over the period 2006/07 to 2015/16. The majority of federal support for health and social programs is provided through the “major transfers,” which include the CHT, the CST, Equalization and TFF. Funding to provinces and territories through the four | | | | In addition to promoting equitable access to public services, federal transfers have a vital role in maintaining fiscal balance within the federation by ensuring provinces and territories have sufficient revenues to meet their constitutional spending responsibilities, particularly in the areas of health, post-secondary education and social assistance. Adequate and stable federal transfers also help sustain economic growth. | | |
| | | | | | |
| | | | | | |
| | | | | | |
major transfers will amount to approximately $75 billion in 2018/19, or almost one-quarter of total federal program spending. | | |
The federal government also transfers funds to the provinces and territories through individual federal departments, often on a cost-shared basis, to support investments in specific program areas. In addition, the federal government provides direct funding to individuals and to entities under provincial jurisdiction, including municipalities and post-secondary institutions.
Total Major Federal Transfers to Manitoba, 2009/10 to 2018/19
| | | | | | | | | | | | | | | | | | | | | | | | | | | | | | | | | | | | | | | | |
| | | 09/10 | | 10/11 | | 11/12 | | 12/13 | | 13/14 | | 14/15 | | 15/16 | | 16/17 | | 17/18 | | 18/19 |
| | | (Millions of Dollars) |
| | | | | | | | | | |
CHT | | | 903 | | | | 943 | | | | 993 | | | | 1,057 | | | | 1,124 | | | | 1,156 | | | | 1,229 | | | | 1,310 | | | | 1,354 | | | | 1,410 | |
| | | | | | | | | | |
CST | | | 392 | | | | 404 | | | | 418 | | | | 426 | | | | 440 | | | | 453 | | | | 468 | | | | 485 | | | | 501 | | | | 518 | |
| | | | | | | | | | |
Equalization | | | 2,063 | | | | 1,826 | | | | 1,666 | | | | 1,671 | | | | 1,792 | | | | 1,750 | | | | 1,738 | | | | 1,736 | | | | 1,820 | | | | 2,037 | |
| | | | | | | | | | |
TTP | | | | | | | 175 | | | | 276 | | | | 201 | | | | 7 | | | | | | | | | | | | | | | | | | | | | |
| | | | | | | | | | |
Total | | | 3,359 | | | | 3,348 | | | | 3,352 | | | | 3,355 | | | | 3,363 | | | | 3,359 | | | | 3,436 | | | | 3,530 | | | | 3,675 | | | | 3,965 | |
| | | | | | | | | | |
Per Capita ($) | | | 2,783 | | | | 2,746 | | | | 2,721 | | | | 2,688 | | | | 2,660 | | | | 2,626 | | | | 2,655 | | | | 2,683 | | | | 2,751 | | | | 2,923 | |
Source: Finance Canada
Notes:
The CST, CHT and Equalization all grew in accordance with their legislated rates. The CHT escalator fell from 6% beginning in 2017/18 and Equalization grants started declining in 2011/12 before returning to prior year levels in 2017/18.
When Manitoba’s strong population growth is taken into account, per capita total major federal transfers have grown by only 5.0% since 2009/10.
Total Transfer Protection (TTP) was available to all provinces and territories between 2010/11 and 2013/14 to ensure total major transfers in one of those years was no lower than in the prior year.
| | |
D 4 / F i s c a l A r r a n g e m e n t s B U D G E T 2 0 1 8 | | |
Major Federal Transfer Growth, 2009/10 to 2018/19
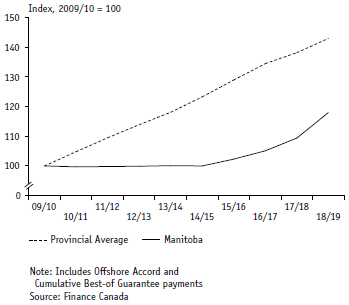
Per Capita Growth in Major Federal Transfers, 2009/10 to 2018/19
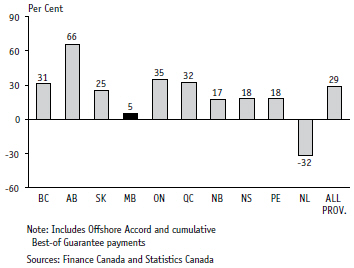
Federal taxpayers in all provinces and territories contribute to the costs of providing federal transfers. Manitobans contribute through personal and corporate income taxes, the GST, and other taxes and fees collected by the federal government. Manitoba also contributes when its businesses and citizens deal with companies based in other provinces and territories and these entities later pay tax.
Major federal transfers in support of Manitoba’s health and social programs have not grown as fast as they have in other provinces and territories. In Manitoba, total major transfer support was generally unchanged from 2009/10 to 2015/16, while other provinces and territories benefited from much larger major transfer increases.
Manitoba’s total major transfers have grown by only 18% since 2009/10, compared to average growth of 43% for the provinces and territories as a whole.
Strong population growth, and the resultant increase in demand for public services, has increased the financial challenge caused by lower than average growth in federal transfer support. In the past decade, Manitoba’s population increased by 1.2% annually, 50% higher than the long-term average rate of 0.8%. In the last three years, Manitoba showed the fastest population growth among provinces, averaging 1.5% annual growth, well above the national average of 1.1%.
From 2009/10 to 2018/19, Manitoba’s per capita major federal transfers have increased by only 5%, the second lowest rate of growth in the nation after Newfoundland and Labrador, and well below the 29% average increase for the provinces as a whole.
| | |
| | B U D G E T 2 0 1 8 F i s c a l A r r a n g e m e n t s / D 5 |
Equalization
Equalization is a federal transfer program established in 1957 and designed to address differences in revenue-raising capacity among the provinces (i.e. differences in fiscal capacity that result in fiscal imbalances). By supporting provinces with lower revenue-raising capacity, Equalization helps to ensure that Canadians in all provinces have access to relatively similar levels of public services. TFF serves a similar purpose for territorial governments.
The purpose of Equalization was entrenched in Subsection 36(2) of the Canadian Constitution in 1982:
“Parliament and the Government of Canada are committed to the principle of making equalization payments to ensure that provincial governments have sufficient revenues to provide reasonably comparable levels of public services at reasonably comparable levels of taxation.”
In the absence of Equalization, provinces with lower fiscal capacity would need to apply higher taxes, have greater debt and/or offer lower levels of public services than other provinces.
Equalization payments are not intended to “level the playing field” between the provinces. Equalization only raises provinces up to the average; it does not reduce the fiscal capacity of non-receiving provinces. Large differences in fiscal capacity among provinces remains even after the equalizing grants are paid.
A common misconception is that provincial governments pay for all or part of the Equalization program. In fact, Equalization is 100% financed from Government of Canada revenues collected from Canadians across the nation. To respect the different preferences within the federation, there are no common standards or conditions on how Equalization payments are used, allowing provinces to spend the funds according to their own priorities.
Per Capita Provincial Fiscal Capacity After Equalization, 2018/19
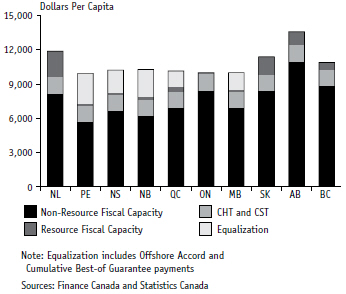
Federal Equalization Entitlements, 2018/19
| | | | | | | | |
| | | Payment | | Per Capita |
| | | ($ Millions) | | ($ Dollars) |
| | |
PEI | | | 419 | | | | 2,835 | |
| | |
Nova Scotia | | | 1,933 | | | | 2,046 | |
| | |
New Brunswick | | | 1,874 | | | | 2,480 | |
| | |
Quebec | | | 11,732 | | | | 1,419 | |
| | |
Ontario | | | 963 | | | | 70 | |
| | |
Manitoba | | | 2,037 | | | | 1,566 | |
| | | | | | | | |
| | |
Total | | | 18,958 | | | | 751 | |
Source: Finance Canada
| | |
D 6 / F i s c a l A r r a n g e m e n t s B U D G E T 2 0 1 8 | | |
How Equalization Entitlements are Determined
The design of the current Equalization program continues to largely reflect the recommendations of the 2006 federal Expert Panel on Equalization and Territorial Formula Financing. The program uses a formula that values accuracy and efficiency to determine which provinces are eligible for Equalization as well as the amount of each province’s payment.
Rather than using actual provincial revenues to determine fiscal capacity (with the exception being natural resource revenues), the program uses “measured” fiscal capacity defined as the per capita revenue a province could raise if it applied the national average tax rate to each of four bases: personal income taxes, business income taxes, consumption taxes and property taxes. Because of the wide variation in the types of natural resources, and the royalty and fee structures used by the provinces, natural resource fiscal capacity is determined using actual revenues received by provincial governments.
To calculate Equalization, each province’s measured per capita fiscal capacity in each of the tax bases is compared to the average per capita fiscal capacity of the 10 provinces. If a province’s fiscal capacity is below the 10-province national standard, it receives a per capita equalizing grant to make up the difference.
In November 2008, citing the need to ensure Equalization growth was stable and sustainable and growing no faster than the economy, the federal government announced the program would be put on a new growth track based on a three-year moving average of Canada’s nominal gross domestic product (GDP) growth.
Cumulative Losses for Receiving Provinces
Under the Federal Growth Track for Equalization
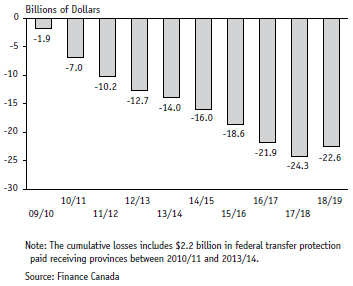
The impact of the nominal GDP growth track has been significant, reducing Equalization to receiving provinces by $26.5 billion from 2009/10 to 2017/18 (partially offset by $2.2 billion in federal total transfer protection payments paid to the provinces between 2010/11 and 2013/14). Manitoba’s cumulative loss under the growth path, after taking into account the federal protection payments, was $200 million over this period.
Although initially introduced to limit the cost of the Equalization program to the federal government, the nominal GDP growth provision also acts as a payment floor. In 2018/19, the nominal GDP growth track will, for the first time, act as a payment floor, providing $1.8 billion more in Equalization than that calculated based on measured disparities in provincial fiscal capacity. This will offset a small portion of the cumulative amount cut from the Equalization program and receiving provinces under the nominal GDP growth track.
| | |
| | B U D G E T 2 0 1 8 F i s c a l A r r a n g e m e n t s / D 7 |
The additional “adjustment payments” are primarily the result of a reduction in fiscal disparities among the provinces caused by the prolonged downturn in commodity prices and relatively strong fiscal capacity growth in Ontario that has resulted in the province no longer qualifying for Equalization. However, Ontario will still receive $963 million in Equalization payments in 2018/19, its per capita share of the $1.8 billion in adjustment payments. Manitoba also received an adjustment payment of $91 million.
The Equalization program is typically renewed on a five-year cycle. In consultation with the provinces, this extensive renewal process identifies and considers technical changes to the program’s design and structure to form recommendations for fair, evidence based improvements focused on accuracy and efficiency. The federal government may or may not implement the changes recommended by the analysis.
Canada Social Transfer
The CST is the main federal transfer to provincial and territorial governments in support of post-secondary education (e.g. funding for universities and colleges), social assistance and social services (e.g. income replacement and programs and services to reduce poverty), including early childhood development, and early learning and childcare.
The CST program has a fixed, legislated growth rate of 3.0% per year. The distribution of the CST is on an equal per capita basis and reflects each province and territory’s share of the national population. Manitoba’s share of the national population is 3.65%.
Manitoba will receive an estimated $517.5 million in CST funding in 2018/19, an increase of $16.6 million or 3.3% over 2017/18 levels. Manitoba’s 3.3% increase is higher than the 3.0% overall growth rate due to its above average population growth.
The CST generally accounts for a small share of total provincial government spending on education and social services. The federal government’s decision to maintain a fixed growth track of 3% rather than increasing it at the rate of nominal GDP will, over time, result in the CST representing an even smaller federal share of provincial and territorial spending on education and social programs. The federal government will review the CST again in 2023/24.
Canada Health Transfer
Health care is the single largest budget item for provinces and territories, typically accounting for about 40% of total program expenditures.
The CHT is the federal government’s main transfer supporting provincial and territorial government expenditures on health care.
Where in the past the provinces and federal government funded eligible health care costs on a 50-50 basis, today provinces fund almost 80% of the cost of health care, with federal funds only representing about 20%.
Like the CST, the CHT is distributed on an equal per capita basis and reflects each province and territory’s share of the national population.
From 2006/07 to 2013/14, the national CHT amount increased by 6% per year. This growth was a key feature of the 10-Year Plan to Strengthen Health Care, the $41 billion multilateral Health Accord signed by all First Ministers in 2004. The 6% annual escalator was extended for an additional three years to 2016/17.
| | |
D 8 / F i s c a l A r r a n g e m e n t s B U D G E T 2 0 1 8 | | |
However, starting in 2017/18, the federal government reduced its support for health care by reducing the rate of growth in the CHT from a fixed 6% to 3% minimum per year, or a three-year moving average of Canadian nominal GDP growth, whichever is higher.
A November 2016 report prepared for Canada’s Premiers through The Council of The Federation estimated the cut in the CHT’s annual growth rate would reduce federal health transfers to provinces and territories by $1.1 billion in 2017/18 and $61.7 billion over 10 years. The reduction in the CHT’s growth rate is occurring at a time when cost pressures on the health care system are increasing. The aging of the population, combined with longer life expectancies, are expected to result in billions of dollars in added health care costs as well as lost government revenues associated with a declining workforce and slowing economic growth.
Manitoba Finance estimates the reduction in annual increases in the CHT will cost the province about $2.25 billion over 10 years when compared to the 6% growth rate. In 2017/18, funding growth to Manitoba was about $39 million less when compared to the previous growth rate. Manitoba will receive an estimated $1.41 billion in CHT funding in 2018/19, up $56.5 million or 4.2% from 2017/18. However, the province’s share of the national CHT amount would have been $69 million higher in 2018/19 had the CHT growth rate remained at 6%.
Manitoba believes the new federal growth rate for the CHT is not sufficient to maintain, let alone improve, the health care system, particularly over the medium and long-term. Put simply, the current CHT is just not enough to cover the federal government’s share of the growing costs of health care, and the recent 10-year commitment from the federal government for targeted initiatives will not fill that gap.
Manitoba and the federal government reached an agreement on targeted health funding in August 2017. The province received $10.9 million in 2017/18 ($7.3 million for home and community care services and $3.6 million for mental health services and addictions) of about $400 million promised over the next 10 years. This amount represents Manitoba’s per capita share of $11 billion announced by the federal government in its 2017 Budget. On average, these annual amounts will cover less than 1% of the province’s expenditures on health care.
| | | | | | |
“Manitoba will continue to work with local Indigenous organizations and communities to identify collaborative health-care improvements and advocate for appropriate long-term federal action and investment.” – Kelvin Goertzen, Manitoba Minister of Health, Seniors, and Active Living | | | | | | Furthermore, the targeted funding will not come close to offsetting the $2.25 billion Manitoba estimates it will lose over the same period due to the reduction in the annual growth rate of the CHT, the core source of federal support for health care. While Manitoba welcomes the new federal funding for home care and mental health services, it accounts for a very small amount of what Manitoba plans to spend in these two areas. |
| | | | | |
| | | | | |
Manitoba will continue to press the federal government for a long-term funding partnership and a real Health Accord, ensuring each order of government has adequate resources to fulfill their constitutional responsibilities for the delivery of health care.
OTHER TRANSFERS TO GOVERNMENT
The federal government also provides funding through other transfers to support services and initiatives in a wide range of areas, including labour market and workforce development, minority language education, early learning and child care, infrastructure, winter roads, legal aid, youth justice services, flood protection and disaster assistance.
| | |
| | B U D G E T 2 0 1 8 F i s c a l A r r a n g e m e n t s / D 9 |
Such shared cost and other transfers from federal departments and agencies amounted to almost $600 million or 3.8% of the province’s total summary revenues in 2016/17. While not always as visible as the “major” transfers like the CHT, these transfers provide support for important programs and services in Manitoba.
SUPPORT TO INDIVIDUALS
In 2018/19, the federal government will transfer around $98 billion directly to individual Canadians through the major transfers to persons. These include $53.6 billion in elderly benefits through the Old Age Security (OAS) program, which includes the Guaranteed Income Supplement (GIS) and the Allowance, $20.7 billion in Employment Insurance benefits and $23.7 billion in children’s benefits. These major transfers to persons will represent almost one-third (31.4%) of total federal program expenses. Provincial and territorial governments also provide transfers to persons.
In addition to the federal major transfers to persons, Canadians will also receive around $47 billion in Canada Pension Plan (CPP) benefits (retirement, survivor and disability benefits) in 2018/19.
The design of government income programs matters to Canadians, especially to seniors. Including the CPP, government income programs account for around forty per cent of total income for individuals aged 65 and over, compared to less than ten percent for those under 65.
Canada’s retirement income system is comprised of several pillars, including public pensions (the OAS and the CPP), as well as workplace pensions and other voluntary, privately administered savings options. Most Canadians count on a combination of these programs to meet their retirement savings and income needs.
Share of Total Income from Government
Programs by Age Group, Canada, 2015
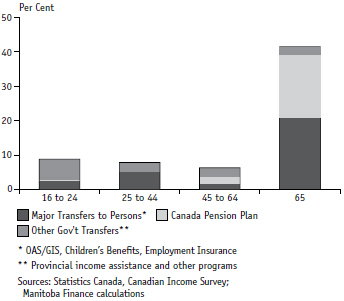
Distribution of Total Income by Source,
Persons Aged 65+, Canada, 2015
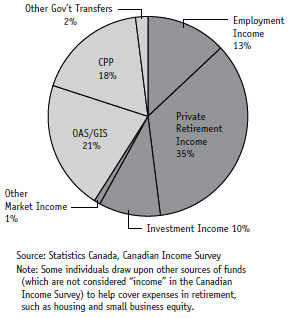
| | |
D 10 / F i s c a l A r r a n g e m e n t s B U D G E T 2 0 1 8 | | |
Overall, about three-quarters of the total income of Canadians aged 65+ comes from the retirement income system: including around forty per cent from the OAS and CPP combined, and another thirty-five per cent from privately administered pension and retirement savings plans.
Federal, provincial and territorial finance ministers, as co-stewards of the CPP, have worked collaboratively on a review of the retirement income system. The finance ministers’ research suggests that some Canadians, particularly middle-income earners and younger workers, are at risk of not maintaining their standard of living in retirement. Research shows that one-in-four families nearing retirement are at risk of under saving, and that share increases to one-in-three for families without registered pension plan assets.
Finance Ministers have taken a broad approach to address these risks and strengthen the retirement system, which includes enhancing and modernizing the CPP, and introducing pension innovations to encourage employers to maintain/offer workplace plans.
For example, the Government of Canada and the provinces and territories worked together to develop Pooled Registered Pension Plans (PRPPs) as a low cost savings option for those without access to workplace pensions.
Pooled Registered Pension Plans
Finance Minister Cameron Friesen is encouraging all licensed Pooled Registered Pension Plan (PRPP) providers to promote these new and innovative plans in the province.
Many employees and self-employed Manitobans do not have access to a workplace pension. These plans provide another option to help Manitobans save for retirement.
PRPPs are a new tool for small businesses in Manitoba to attract and retain employees. Offering a PRPP requires minimal administration on the part of the employer, making it much easier for small businesses to offer employees the opportunity to participate in a pension plan.
There has been widespread support for making these low-cost plans available to Manitoba employers and workers, including from organizations such as the Winnipeg Chamber of Commerce, the Manitoba Association of Seniors Centres, and the Manitoba Hotel Association.
The Manitoba government has completed all the steps necessary to allow PRPPs to be offered in Manitoba. Manitoba’s PRPP legislation and regulations came into force on August 1, 2017. Effective November 15, 2017, Manitoba is now a party to the PRPP Multilateral Agreement with the federal government and several other provinces, which allows the federal government to licence and regulate PRPP plans and providers in participating provinces across the country.
PRPPs, developed through extensive consultations with pension industry stakeholders, are defined contribution-style plans designed to help people defer their income and save for retirement. With PRPPs, contributions from many individuals are invested together, which helps lower administration costs.
Individual employees are automatically enrolled in a PRPP by the employer if an employer chooses to participate in a PRPP. Processes are also being developed to allow self-employed individuals, or employees whose employer does not offer a pension plan, to open a PRPP account directly.
| | |
| | B U D G E T 2 0 1 8 F i s c a l A r r a n g e m e n t s / D 11 |
In the summer of 2016, finance ministers agreed to an enhancement of the CPP that will see the proportion of eligible pre-retirement income replaced by the plan increase from one-quarter to one-third. Survivor and disability benefits will also increase as part of the enhancement, based on contributions to the plan.
Due to the legislated requirement for the CPP enhancement to be fully funded, full benefits under the enhancement will be available only after about 40 years of making contributions, meaning that each generation will pay for its own enhanced benefits. Partial benefits will be available sooner and will be based on years of contributions.
| | |
Manitoba is in the process of completing its five-year review of The Pension Benefits Act. The intent of the review is to reform and strengthen the province’s pension system and secure stable retirement income for Manitobans. | | |
The end goal of both the CPP enhancement and the introduction of PRPPs is to reduce the share of persons and families at risk of not maintaining their standard of living in retirement. However, these measures are primarily aimed at younger workers given the amount of time it will take for pensions to accrue.
The CPP enhancement makes the plan bigger, but primarily for future generations of retirees. Manitoba continues to believe that consideration should also be given to how to make the plan better now for all Canadians. As the plan gets bigger, Manitoba wants to ensure it responds to the situations of all Canadians who have paid into it throughout their working lives.
Manitoba’s support for the CPP enhancement was conditional on agreement from the federal government to add consideration of the following proposals to the finance minsters’ CPP agenda:
| ● | | Elimination of the claw back of Guaranteed Income Supplement payments for widowed seniors’ CPP survivor benefits; |
| ● | | Indexation of the CPP death benefit; |
| ● | | Comprehensive review of CPP survivor and disability benefits; and, |
| ● | | Keep child rearing and disability drop-out provisions in the enhancement. |
Federal, provincial and territorial finance ministers review the financial state of the CPP every three years, referred to as the Triennial Review of the CPP, and make recommendations as to whether there should be changes to benefits and/or contribution rates. Such changes require the approval of the federal government as well as the agreement of at least two-thirds of the provinces, representing at least two-thirds of the population of all the provinces.
Discussions with the federal government led to Manitoba’s proposals being addressed through the 2016-2018 Triennial Review process.
Maximum CPP Death Benefit
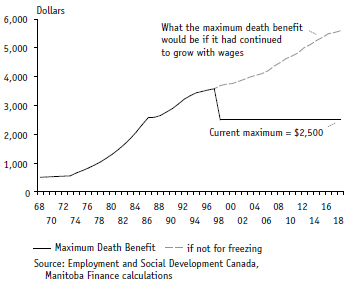
| | |
D 12 / F i s c a l A r r a n g e m e n t s B U D G E T 2 0 1 8 | | |
Modernizing the Canada Pension Plan
In December 2017, Ministers agreed-in-principle to the following changes to CPP benefits as part of the 2016–2018 Triennial Review:
| | ● | | Introduce child-rearing and disability drop-in provisions in the CPP Enhancement. This modification to the originally agreed to CPP enhancement will help to protect benefits for individuals with years of lost or low earnings due to child rearing or disability. | |
| | ● | | Remove the age-based restrictions on survivor benefits for individuals who become survivors before age 45. This improvement will make the program fairer, more responsive and less complex. | |
| | ● | | Provide a disability top-up benefit in the Base CPP to early retirees who become disabled and meet eligibility requirements. This improvement will bring the disability pension in line with earlier CPP reforms that make the program more flexible and encourage CPP beneficiaries to continue participating in the labour market. | |
| | ● | | Make the death benefit a flat $2,500 for all eligible contributors. This change will increase the value of the Death Benefit for many contributors, and will be particularly beneficial for the families of lower- income workers. | |
No changes to the legislated contribution rates will be required because of these changes.
| | | | | | |
In particular, the comprehensive review of CPP supplementary benefits requested by Manitoba, including consideration of the proposal to index the death benefit, was a big part of the work undertaken by finance ministers as part of the Triennial Review. Based on this work, and with a priority placed on avoiding upward impacts on contribution rates, ministers agreed to a package of modest CPP changes in December 2017. | | | | The Manitoba Financial Literacy Forum promotes lifelong financial education and skills to Manitobans and forum members have collated many resources on financial planning, retirement planning, and estate planning. Manitoba Finance will also work with the federal government to ensure Manitobans understand recent improvements to the retirement income system, including the enhancements to the CPP and the introduction of PRPPs. | | |
Manitoba feels the changes agreed to by finance ministers are positive steps in what should be an ongoing process to modernize the CPP. Finance | | | | | |
ministers agreed-in-principle to make the death benefit a flat $2,500 for all eligible contributors. This change | | | | | | |
will help the families of many lower income workers. However, the value of the death benefit will continue to erode for most contributors, while the cost of funerals and other expenses continue to rise. |
Furthermore, the death benefit is the only CPP benefit received by some contributors, making the ongoing deterioration in spending power of the death benefit particularly unfair to some Canadians. Manitoba has asked that, as part of the next triennial review, ministers carry on with their work on the death benefit, within the broader context of overall survivor benefits, with a view to finding cost effective ways to fairly address this issue.
Manitoba recognizes the value of having a comprehensive retirement system that meets the needs of workers and retirees. This is why Manitoba ultimately supported enhancements to make the CPP bigger, but also continues to advocate for ways to make it better. It is also why Manitoba recently made it possible for employers and employees to access PRPPs in the province.
| | |
| | B U D G E T 2 0 1 8 F i s c a l A r r a n g e m e n t s / D 13 |
| | | | | | |
The Retirement Income System and Lower Income Seniors | | |
Manitoba also raised the challenges faced by lower income seniors as an issue that should be considered by finance ministers as part of their efforts to strengthen the retirement income system. The percentage of unattached seniors with income below Statistics Canada’s after-tax Low Income Measure quadrupled between 1994 and 2015, increasing from 8% to 32%. | | |
Federal, provincial and territorial finance ministers are aware of the challenges faced by lower income single seniors. In 2016, the federal government increased the GIS by up to 10% for the lowest income single seniors. Manitoba proposed that, given the special circumstances facing single seniors in particular, the federal government may want to consider eliminating the claw back of guaranteed income supplement payments for widowed seniors’ CPP survivor benefits. Manitoba would also be open to discussing other ways this issue might be addressed. Although Manitoba’s GIS proposal was not discussed as part of the recently completed CPP Triennial Review, in December 2016 finance ministers did | | | | Percentage of Persons in Low Income, Canada* 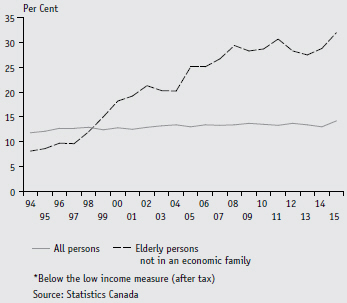
| | |
agree that Governments should continue to collaborate via Ministers responsible for Social Services and Ministers of Finance on issues related to income support for seniors that are of mutual concern. These issues include the coordination of federal, provincial and territorial financial support programs for low-income seniors, and how programs interact with one another. | | |
CONCLUSION
Canada’s system of fiscal federalism has adapted and evolved to meet the changing needs of the federation. Our system of major social programs is indicative of what governments can accomplish when they work together to develop a fiscal partnership for the good of all Canadians.
For example, federal, provincial and territorial governments worked cooperatively to enhance the CPP so that future generations of retirees are better able to maintain their standard of living in retirement. Manitoba supports that initiative, but continues to believe in, and champion for, more work to modernize the CPP so that it meets the needs of all Canadians, now and in the future.
| | |
D 14 / F i s c a l A r r a n g e m e n t s B U D G E T 2 0 1 8 | | |
Canada is also facing another common challenge in coming years. The aging of the population will create new and growing challenges for fiscal federalism and the system of intergovernmental fiscal transfers that play a vital role in maintaining and strengthening the federation.
Addressing the higher costs associated with an aging and growing population and improving access to high-quality health care and related social services will require cooperation and fiscal partnership among the orders of government. However, unilateral decisions by one order of government can erode the system of trust and collaboration necessary for the effective functioning of the federation.
Recent unilateral decisions by the federal government, such as the cut to the annual growth rate of the major transfer for healthcare (i.e. the CHT), will help the federal government’s fiscal position. However, changes such as these come at the expense of provinces and territories, who must address ongoing and growing cost pressures resulting from inflation, new technology, population growth and population aging.
While the recently announced targeted health care funding will help, it will not come close to filling the funding gap caused by the reduction in support through the CHT, the main source of federal support for health care. Manitoba believes the federal government must come to the table as a true fiscal partner with provinces and territories if we are to establish a shared agenda for the renewal of health care and other priorities for Canadians.