EDISON INTERNATIONAL® Leading the Way in Electricity SM May 2, 2012 0 First Quarter 2012 Financial Teleconference
EDISON INTERNATIONAL® Leading the Way in Electricity SM May 2, 2012 1 Statements contained in this presentation about future performance, including, without limitation, earnings, asset and rate base growth, load growth, capital expenditures, and other statements that are not purely historical, are forward-looking statements. These forward-looking statements reflect our current expectations; however, such statements involve risks and uncertainties. Actual results could differ materially from current expectations. These forward-looking statements represent our expectations only as of the date of this presentation, and Edison International assumes no duty to update them to reflect new information, events or circumstances. Important factors that could cause different results are discussed under the headings “Risk Factors,” and “Management’s Discussion and Analysis” in Edison International’s 2011 Form 10-K, most recent Form 10-Q and other reports filed with the Securities and Exchange Commission, which are available on our website: www.edisoninvestor.com. These filings also provide additional information on historical and other factual data contained in this presentation. Forward-Looking Statements
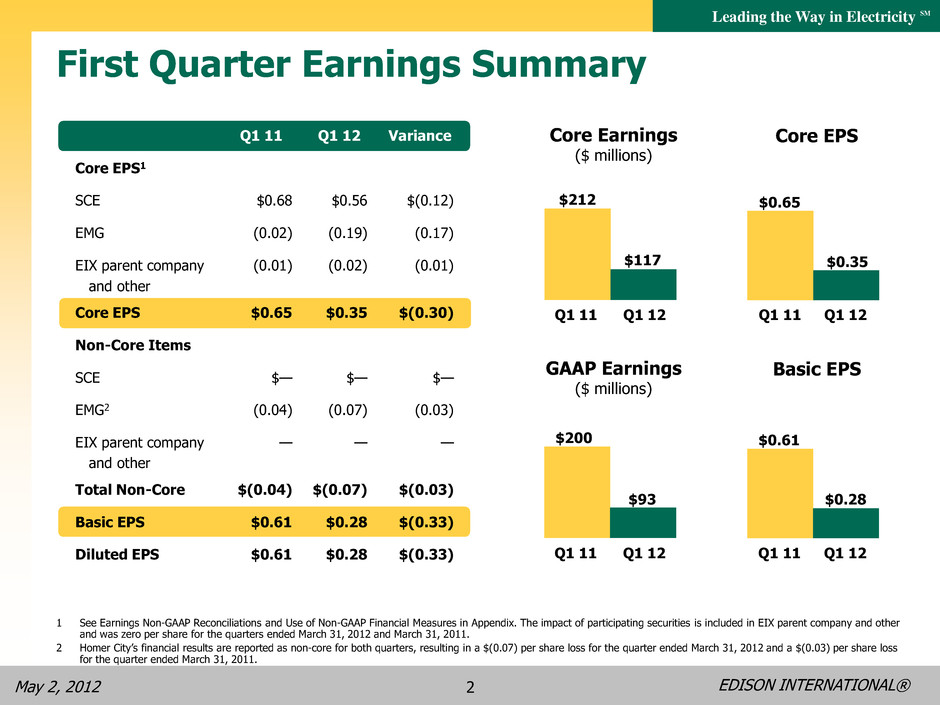
EDISON INTERNATIONAL® Leading the Way in Electricity SM May 2, 2012 2 First Quarter Earnings Summary 1 See Earnings Non-GAAP Reconciliations and Use of Non-GAAP Financial Measures in Appendix. The impact of participating securities is included in EIX parent company and other and was zero per share for the quarters ended March 31, 2012 and March 31, 2011. 2 Homer City’s financial results are reported as non-core for both quarters, resulting in a $(0.07) per share loss for the quarter ended March 31, 2012 and a $(0.03) per share loss for the quarter ended March 31, 2011. Q1 11 Q1 12 Variance Core EPS1 SCE $0.68 $0.56 $(0.12) EMG (0.02) (0.19) (0.17) EIX parent company and other (0.01) (0.02) (0.01) Core EPS $0.65 $0.35 $(0.30) Non-Core Items SCE $— $— $— EMG2 (0.04) (0.07) (0.03) EIX parent company and other — — — Total Non-Core $(0.04) $(0.07) $(0.03) Basic EPS $0.61 $0.28 $(0.33) Diluted EPS $0.61 $0.28 $(0.33) Basic EPS GAAP Earnings ($ millions) Core EPS Q1 11 Q1 12 $0.35 Core Earnings ($ millions) $212 $117 Q1 11 Q1 12 $0.65 Q1 11 Q1 12 $0.28 $200 $93 Q1 11 Q1 12 $0.61
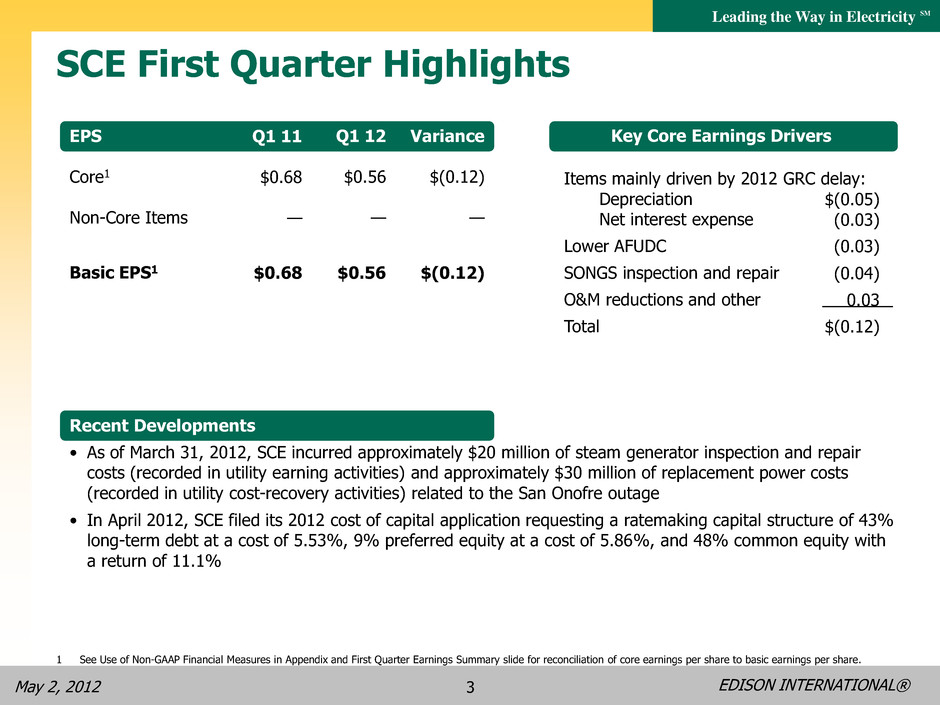
EDISON INTERNATIONAL® Leading the Way in Electricity SM May 2, 2012 3 SCE First Quarter Highlights Items mainly driven by 2012 GRC delay: Depreciation Net interest expense Lower AFUDC SONGS inspection and repair O&M reductions and other Total $(0.05) (0.03) (0.03) (0.04) 0.03 $(0.12) Recent Developments • As of March 31, 2012, SCE incurred approximately $20 million of steam generator inspection and repair costs (recorded in utility earning activities) and approximately $30 million of replacement power costs (recorded in utility cost-recovery activities) related to the San Onofre outage • In April 2012, SCE filed its 2012 cost of capital application requesting a ratemaking capital structure of 43% long-term debt at a cost of 5.53%, 9% preferred equity at a cost of 5.86%, and 48% common equity with a return of 11.1% EPS Core1 Non-Core Items Basic EPS1 Q1 12 $0.56 — $0.56 Variance $(0.12) — $(0.12) Q1 11 $0.68 — $0.68 Key Core Earnings Drivers 1 See Use of Non-GAAP Financial Measures in Appendix and First Quarter Earnings Summary slide for reconciliation of core earnings per share to basic earnings per share.
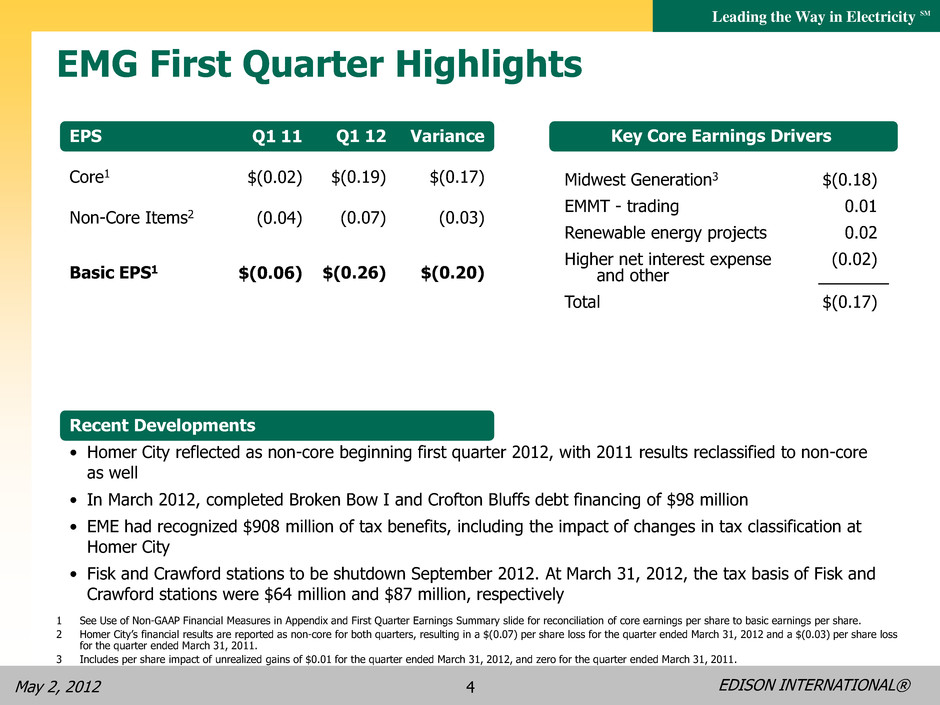
EDISON INTERNATIONAL® Leading the Way in Electricity SM May 2, 2012 4 EMG First Quarter Highlights Recent Developments • Homer City reflected as non-core beginning first quarter 2012, with 2011 results reclassified to non-core as well • In March 2012, completed Broken Bow I and Crofton Bluffs debt financing of $98 million • EME had recognized $908 million of tax benefits, including the impact of changes in tax classification at Homer City • Fisk and Crawford stations to be shutdown September 2012. At March 31, 2012, the tax basis of Fisk and Crawford stations were $64 million and $87 million, respectively 1 See Use of Non-GAAP Financial Measures in Appendix and First Quarter Earnings Summary slide for reconciliation of core earnings per share to basic earnings per share. 2 Homer City’s financial results are reported as non-core for both quarters, resulting in a $(0.07) per share loss for the quarter ended March 31, 2012 and a $(0.03) per share loss for the quarter ended March 31, 2011. 3 Includes per share impact of unrealized gains of $0.01 for the quarter ended March 31, 2012, and zero for the quarter ended March 31, 2011. EPS Core1 Non-Core Items2 Basic EPS1 Q1 12 $(0.19) (0.07) $(0.26) Variance $(0.17) (0.03) $(0.20) Q1 11 $(0.02) (0.04) $(0.06) Midwest Generation3 EMMT - trading Renewable energy projects Higher net interest expense and other Total $(0.18) 0.01 0.02 (0.02) $(0.17) Key Core Earnings Drivers
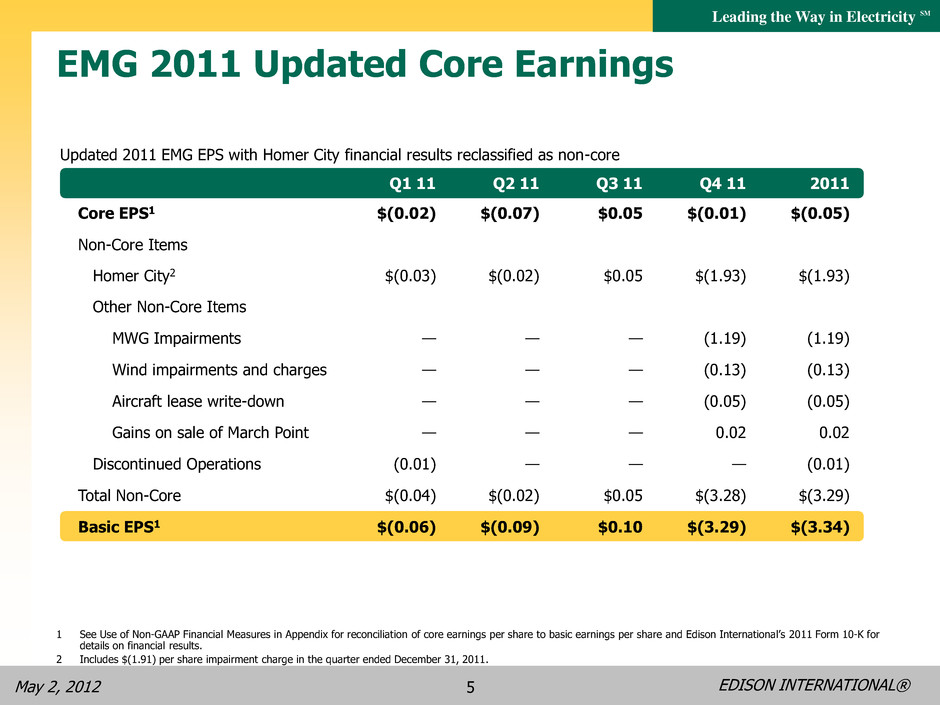
EDISON INTERNATIONAL® Leading the Way in Electricity SM May 2, 2012 5 EMG 2011 Updated Core Earnings Updated 2011 EMG EPS with Homer City financial results reclassified as non-core Q1 11 Q2 11 Q3 11 Q4 11 2011 Core EPS1 $(0.02) $(0.07) $0.05 $(0.01) $(0.05) Non-Core Items Homer City2 $(0.03) $(0.02) $0.05 $(1.93) $(1.93) Other Non-Core Items MWG Impairments — — — (1.19) (1.19) Wind impairments and charges — — — (0.13) (0.13) Aircraft lease write-down — — — (0.05) (0.05) Gains on sale of March Point — — — 0.02 0.02 Discontinued Operations (0.01) — — — (0.01) Total Non-Core $(0.04) $(0.02) $0.05 $(3.28) $(3.29) Basic EPS1 $(0.06) $(0.09) $0.10 $(3.29) $(3.34) 1 See Use of Non-GAAP Financial Measures in Appendix for reconciliation of core earnings per share to basic earnings per share and Edison International’s 2011 Form 10-K for details on financial results. 2 Includes $(1.91) per share impairment charge in the quarter ended December 31, 2011.
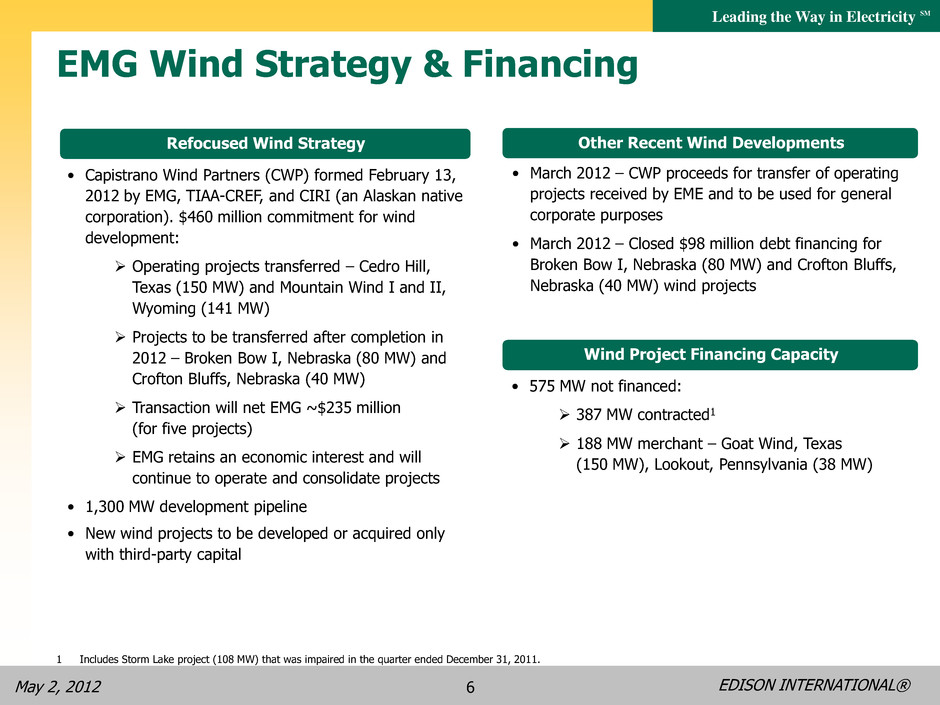
EDISON INTERNATIONAL® Leading the Way in Electricity SM May 2, 2012 6 • Capistrano Wind Partners (CWP) formed February 13, 2012 by EMG, TIAA-CREF, and CIRI (an Alaskan native corporation). $460 million commitment for wind development: Operating projects transferred – Cedro Hill, Texas (150 MW) and Mountain Wind I and II, Wyoming (141 MW) Projects to be transferred after completion in 2012 – Broken Bow I, Nebraska (80 MW) and Crofton Bluffs, Nebraska (40 MW) Transaction will net EMG ~$235 million (for five projects) EMG retains an economic interest and will continue to operate and consolidate projects • 1,300 MW development pipeline • New wind projects to be developed or acquired only with third-party capital EMG Wind Strategy & Financing Refocused Wind Strategy Project Debt Other Recent Wind Developments • March 2012 – CWP proceeds for transfer of operating projects received by EME and to be used for general corporate purposes • March 2012 – Closed $98 million debt financing for Broken Bow I, Nebraska (80 MW) and Crofton Bluffs, Nebraska (40 MW) wind projects Wind Project Financing Capacity • 575 MW not financed: 387 MW contracted1 188 MW merchant – Goat Wind, Texas (150 MW), Lookout, Pennsylvania (38 MW) 1 Includes Storm Lake project (108 MW) that was impaired in the quarter ended December 31, 2011.
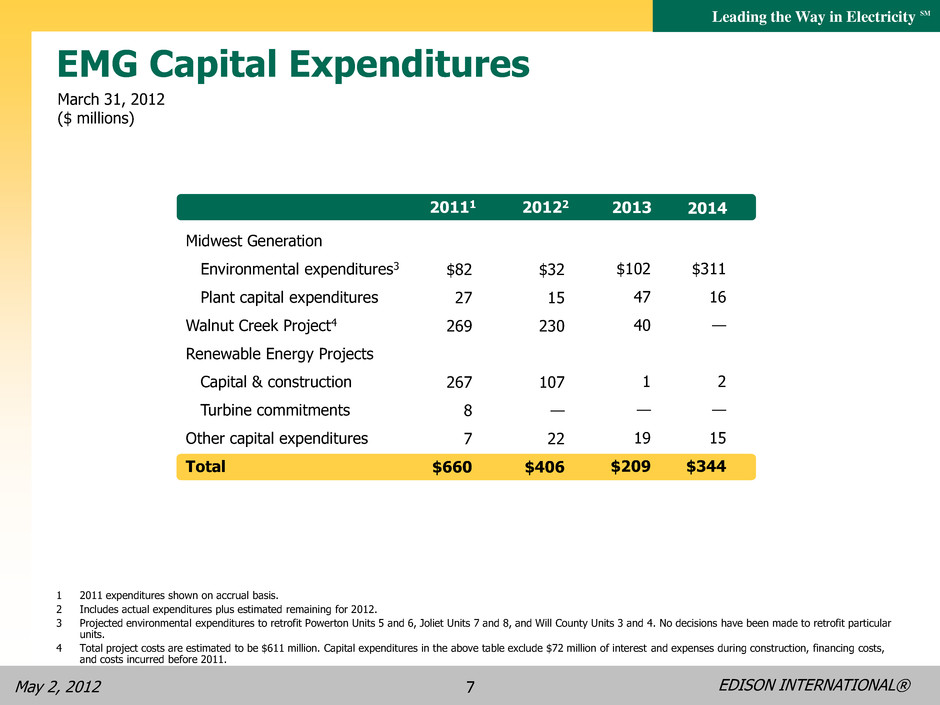
EDISON INTERNATIONAL® Leading the Way in Electricity SM May 2, 2012 7 EMG Capital Expenditures Midwest Generation Environmental expenditures3 Plant capital expenditures Walnut Creek Project4 Renewable Energy Projects Capital & construction Turbine commitments Other capital expenditures Total 2013 1 2011 expenditures shown on accrual basis. 2 Includes actual expenditures plus estimated remaining for 2012. 3 Projected environmental expenditures to retrofit Powerton Units 5 and 6, Joliet Units 7 and 8, and Will County Units 3 and 4. No decisions have been made to retrofit particular units. 4 Total project costs are estimated to be $611 million. Capital expenditures in the above table exclude $72 million of interest and expenses during construction, financing costs, and costs incurred before 2011. March 31, 2012 ($ millions) $82 27 269 267 8 7 $660 $102 47 40 1 — 19 $209 $32 15 230 107 — 22 $406 2013 20111 20122 $311 16 — 2 — 15 $344 2014
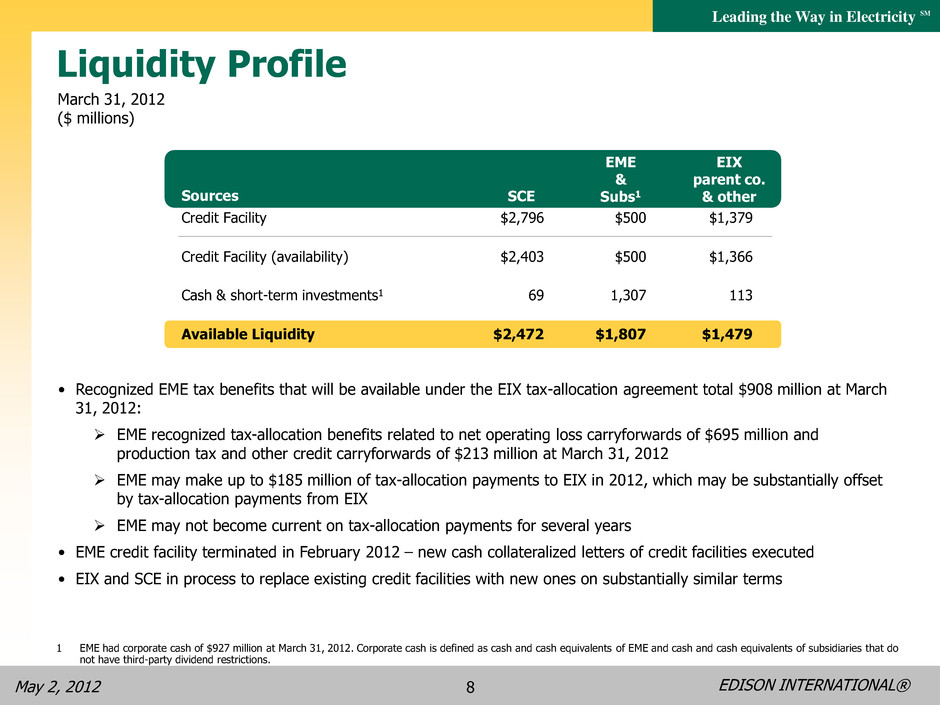
EDISON INTERNATIONAL® Leading the Way in Electricity SM May 2, 2012 8 Credit Facility Credit Facility (availability) Cash & short-term investments1 Available Liquidity Liquidity Profile 1 EME had corporate cash of $927 million at March 31, 2012. Corporate cash is defined as cash and cash equivalents of EME and cash and cash equivalents of subsidiaries that do not have third-party dividend restrictions. Sources $500 $500 1,307 $1,807 EME & Subs1 $2,796 $2,403 69 $2,472 SCE $1,379 $1,366 113 $1,479 EIX parent co. & other March 31, 2012 ($ millions) • Recognized EME tax benefits that will be available under the EIX tax-allocation agreement total $908 million at March 31, 2012: EME recognized tax-allocation benefits related to net operating loss carryforwards of $695 million and production tax and other credit carryforwards of $213 million at March 31, 2012 EME may make up to $185 million of tax-allocation payments to EIX in 2012, which may be substantially offset by tax-allocation payments from EIX EME may not become current on tax-allocation payments for several years • EME credit facility terminated in February 2012 – new cash collateralized letters of credit facilities executed • EIX and SCE in process to replace existing credit facilities with new ones on substantially similar terms
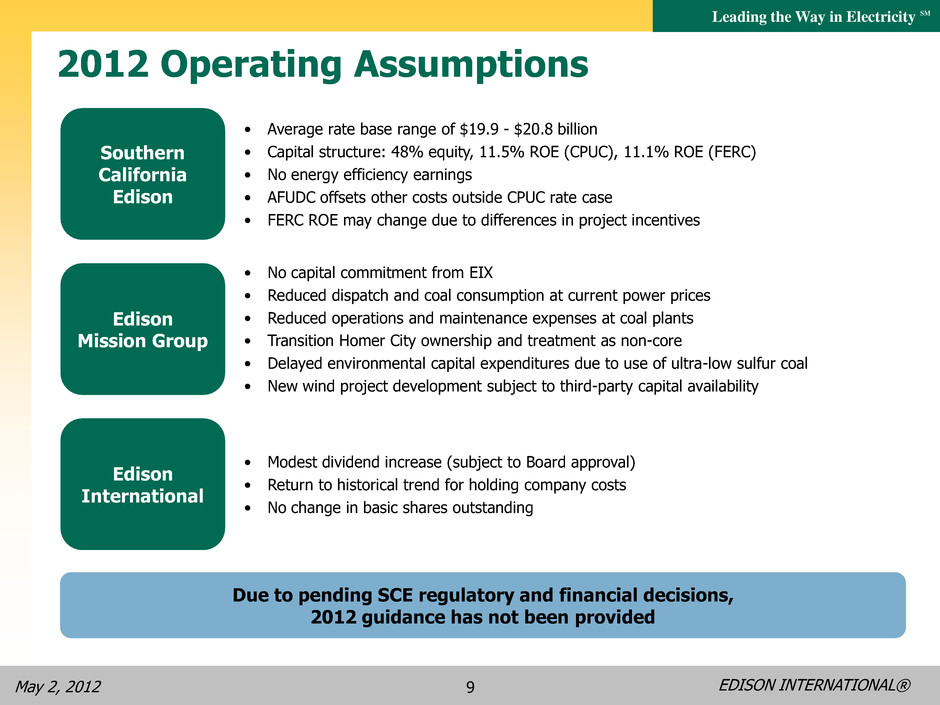
EDISON INTERNATIONAL® Leading the Way in Electricity SM May 2, 2012 9 Southern California Edison • Average rate base range of $19.9 - $20.8 billion • Capital structure: 48% equity, 11.5% ROE (CPUC), 11.1% ROE (FERC) • No energy efficiency earnings • AFUDC offsets other costs outside CPUC rate case • FERC ROE may change due to differences in project incentives Edison Mission Group • No capital commitment from EIX • Reduced dispatch and coal consumption at current power prices • Reduced operations and maintenance expenses at coal plants • Transition Homer City ownership and treatment as non-core • Delayed environmental capital expenditures due to use of ultra-low sulfur coal • New wind project development subject to third-party capital availability Edison International • Modest dividend increase (subject to Board approval) • Return to historical trend for holding company costs • No change in basic shares outstanding Due to pending SCE regulatory and financial decisions, 2012 guidance has not been provided 2012 Operating Assumptions
EDISON INTERNATIONAL® Leading the Way in Electricity SM May 2, 2012 10 Appendix
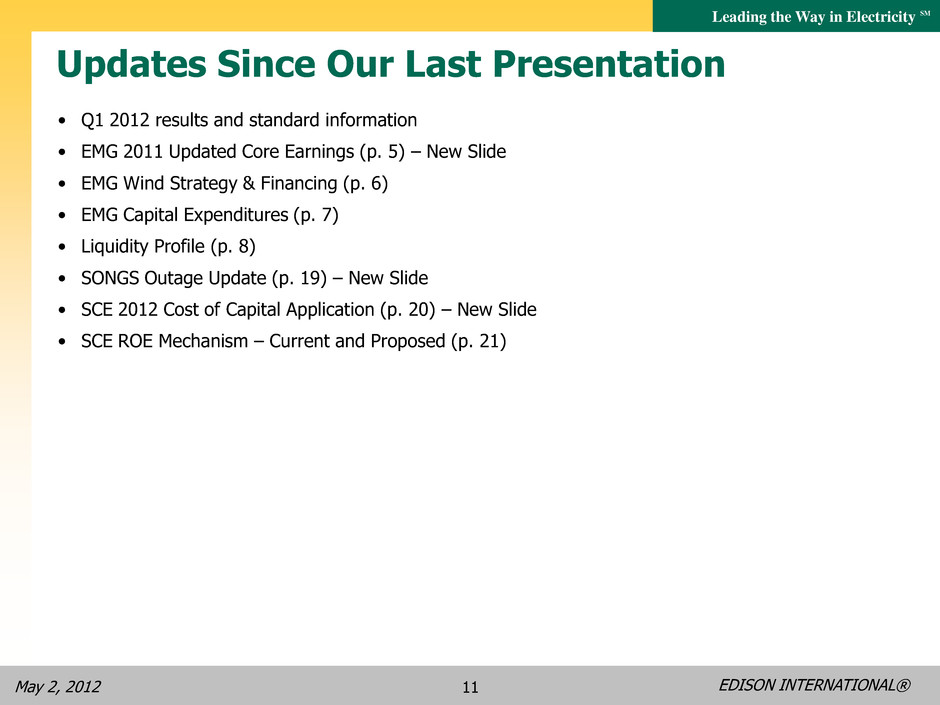
EDISON INTERNATIONAL® Leading the Way in Electricity SM May 2, 2012 11 Updates Since Our Last Presentation • Q1 2012 results and standard information • EMG 2011 Updated Core Earnings (p. 5) – New Slide • EMG Wind Strategy & Financing (p. 6) • EMG Capital Expenditures (p. 7) • Liquidity Profile (p. 8) • SONGS Outage Update (p. 19) – New Slide • SCE 2012 Cost of Capital Application (p. 20) – New Slide • SCE ROE Mechanism – Current and Proposed (p. 21)
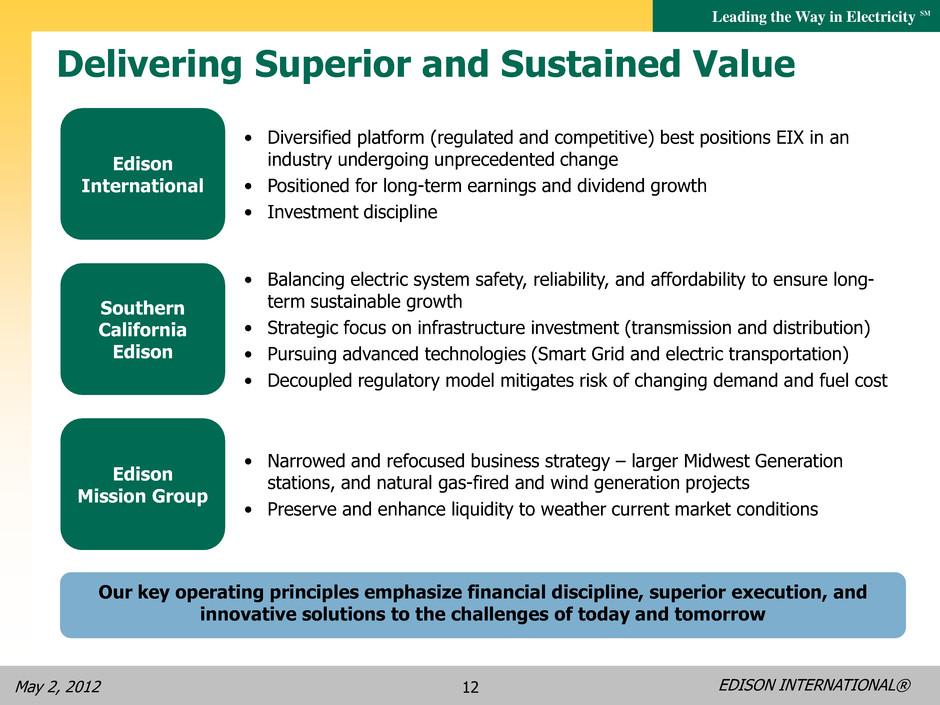
EDISON INTERNATIONAL® Leading the Way in Electricity SM May 2, 2012 12 Delivering Superior and Sustained Value Edison International • Diversified platform (regulated and competitive) best positions EIX in an industry undergoing unprecedented change • Positioned for long-term earnings and dividend growth • Investment discipline Southern California Edison • Balancing electric system safety, reliability, and affordability to ensure long- term sustainable growth • Strategic focus on infrastructure investment (transmission and distribution) • Pursuing advanced technologies (Smart Grid and electric transportation) • Decoupled regulatory model mitigates risk of changing demand and fuel cost Edison Mission Group • Narrowed and refocused business strategy – larger Midwest Generation stations, and natural gas-fired and wind generation projects • Preserve and enhance liquidity to weather current market conditions Our key operating principles emphasize financial discipline, superior execution, and innovative solutions to the challenges of today and tomorrow
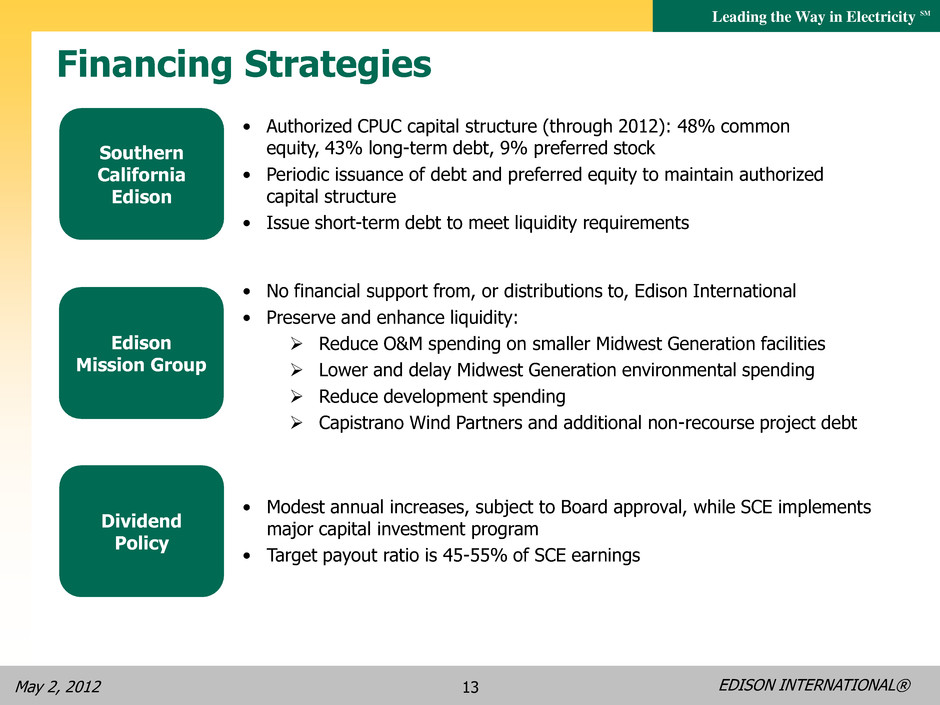
EDISON INTERNATIONAL® Leading the Way in Electricity SM May 2, 2012 13 Financing Strategies • No financial support from, or distributions to, Edison International • Preserve and enhance liquidity: Reduce O&M spending on smaller Midwest Generation facilities Lower and delay Midwest Generation environmental spending Reduce development spending Capistrano Wind Partners and additional non-recourse project debt • Authorized CPUC capital structure (through 2012): 48% common equity, 43% long-term debt, 9% preferred stock • Periodic issuance of debt and preferred equity to maintain authorized capital structure • Issue short-term debt to meet liquidity requirements • Modest annual increases, subject to Board approval, while SCE implements major capital investment program • Target payout ratio is 45-55% of SCE earnings Southern California Edison Edison Mission Group Dividend Policy
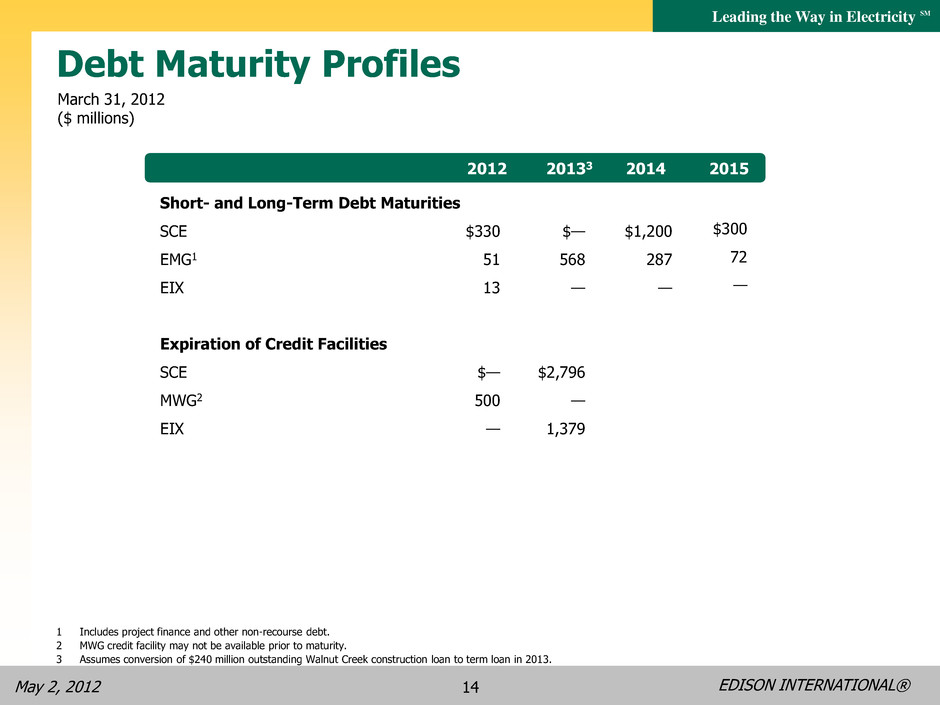
EDISON INTERNATIONAL® Leading the Way in Electricity SM May 2, 2012 14 Short- and Long-Term Debt Maturities SCE EMG1 EIX Expiration of Credit Facilities SCE MWG2 EIX Debt Maturity Profiles 20133 2012 2014 2015 $330 51 13 $— 500 — March 31, 2012 ($ millions) $— 568 — $2,796 — 1,379 $1,200 287 — $300 72 — 1 Includes project finance and other non-recourse debt. 2 MWG credit facility may not be available prior to maturity. 3 Assumes conversion of $240 million outstanding Walnut Creek construction loan to term loan in 2013.
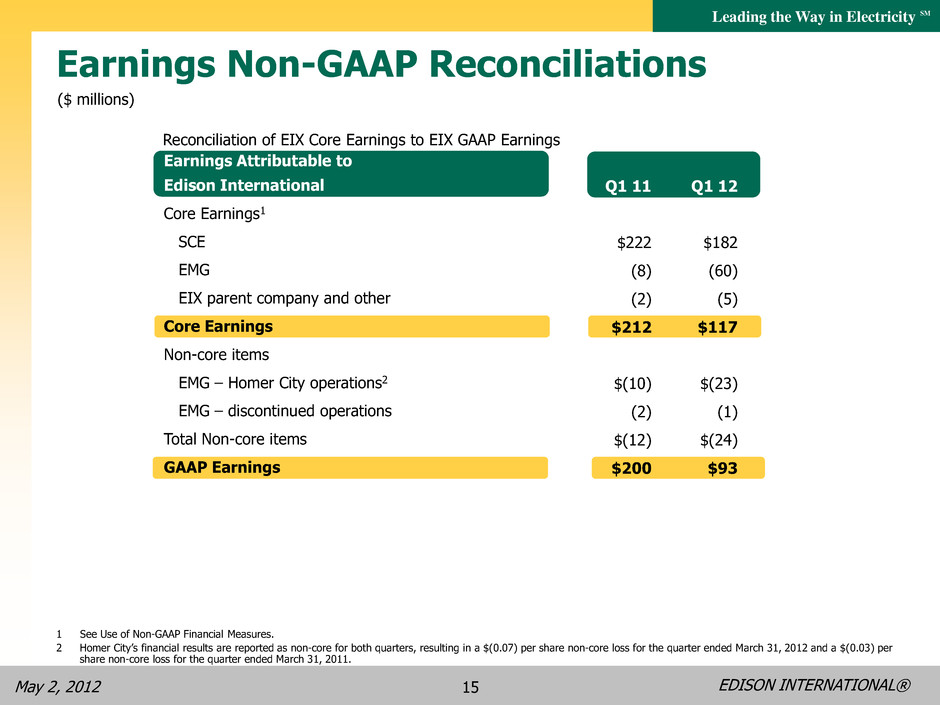
EDISON INTERNATIONAL® Leading the Way in Electricity SM May 2, 2012 15 Earnings Attributable to Edison International Core Earnings1 SCE EMG EIX parent company and other Core Earnings Non-core items EMG – Homer City operations2 EMG – discontinued operations Total Non-core items GAAP Earnings Earnings Non-GAAP Reconciliations ($ millions) 1 See Use of Non-GAAP Financial Measures. 2 Homer City’s financial results are reported as non-core for both quarters, resulting in a $(0.07) per share non-core loss for the quarter ended March 31, 2012 and a $(0.03) per share non-core loss for the quarter ended March 31, 2011. Q1 11 $222 (8) (2) $212 $(10) (2) $(12) $200 Q1 12 $182 (60) (5) $117 $(23) (1) $(24) $93 Reconciliation of EIX Core Earnings to EIX GAAP Earnings
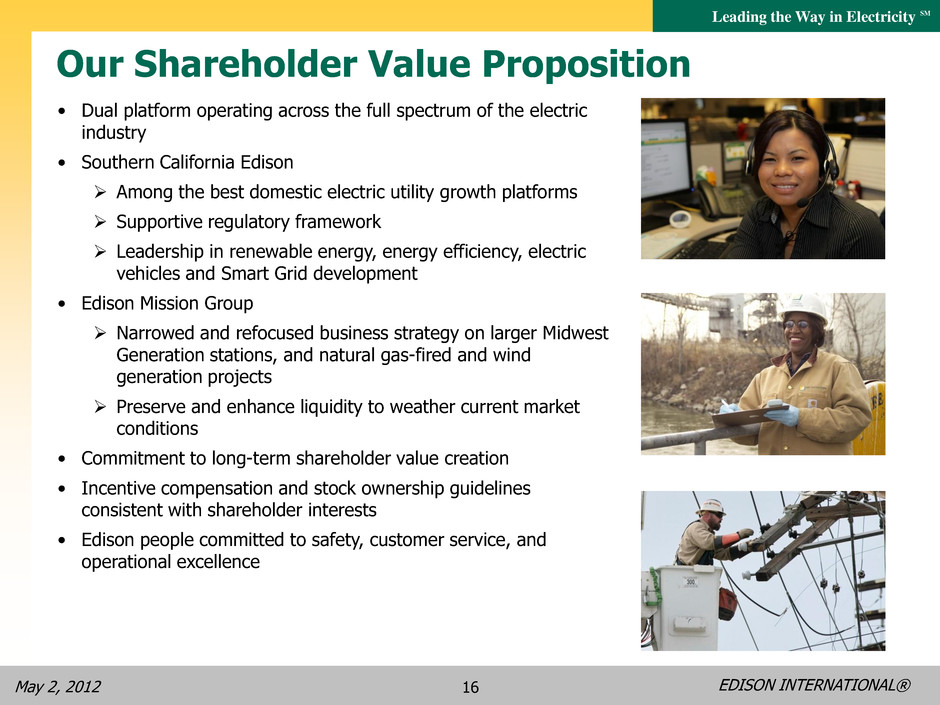
EDISON INTERNATIONAL® Leading the Way in Electricity SM May 2, 2012 16 Our Shareholder Value Proposition • Dual platform operating across the full spectrum of the electric industry • Southern California Edison Among the best domestic electric utility growth platforms Supportive regulatory framework Leadership in renewable energy, energy efficiency, electric vehicles and Smart Grid development • Edison Mission Group Narrowed and refocused business strategy on larger Midwest Generation stations, and natural gas-fired and wind generation projects Preserve and enhance liquidity to weather current market conditions • Commitment to long-term shareholder value creation • Incentive compensation and stock ownership guidelines consistent with shareholder interests • Edison people committed to safety, customer service, and operational excellence
EDISON INTERNATIONAL® Leading the Way in Electricity SM May 2, 2012 17 SCE Appendix
EDISON INTERNATIONAL® Leading the Way in Electricity SM May 2, 2012 18 SCE 2012 CPUC General Rate Case • Application filed November 23, 2010 to set base revenue requirement for 2012-2014 (A.10-11-015) Rate increase driven by system reliability, load growth, capital-related expense, and technology needs Excludes fuel and purchased power costs, and transmission projects under FERC jurisdiction Cost of capital determined in separate proceeding • SCE’s current request based on October 24 update testimony: Revenue Requirement increase of $809 million in 2012, $117 million in 2013, and $513 million in 2014, net of sales growth • Proposed decision anticipated second quarter of 2012 • Final decision is retroactive to January 1, 2012, through memorandum account
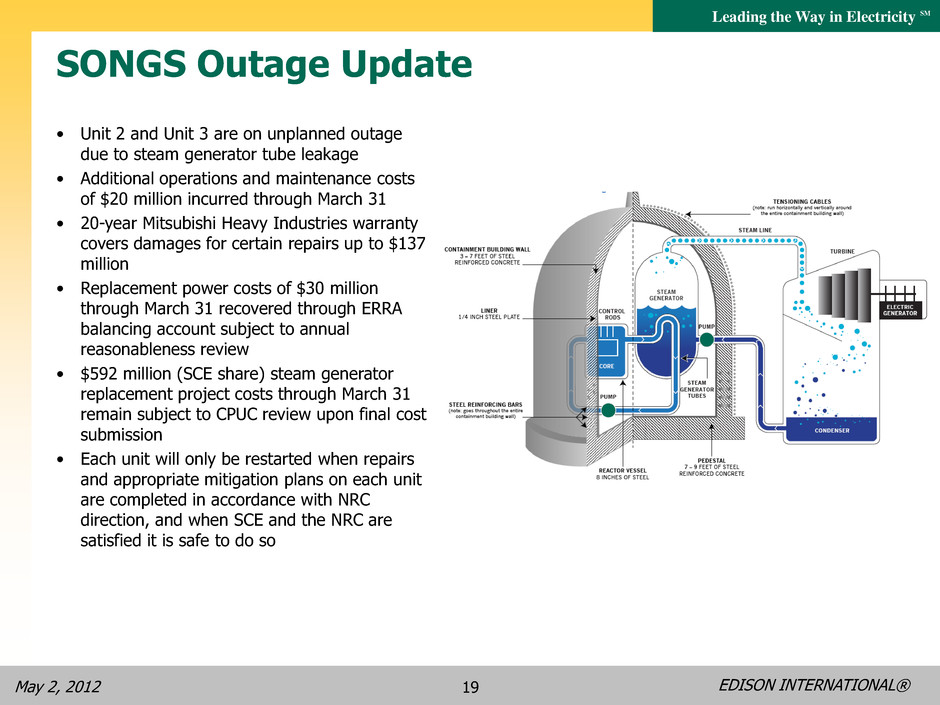
EDISON INTERNATIONAL® Leading the Way in Electricity SM May 2, 2012 19 SONGS Outage Update • Unit 2 and Unit 3 are on unplanned outage due to steam generator tube leakage • Additional operations and maintenance costs of $20 million incurred through March 31 • 20-year Mitsubishi Heavy Industries warranty covers damages for certain repairs up to $137 million • Replacement power costs of $30 million through March 31 recovered through ERRA balancing account subject to annual reasonableness review • $592 million (SCE share) steam generator replacement project costs through March 31 remain subject to CPUC review upon final cost submission • Each unit will only be restarted when repairs and appropriate mitigation plans on each unit are completed in accordance with NRC direction, and when SCE and the NRC are satisfied it is safe to do so
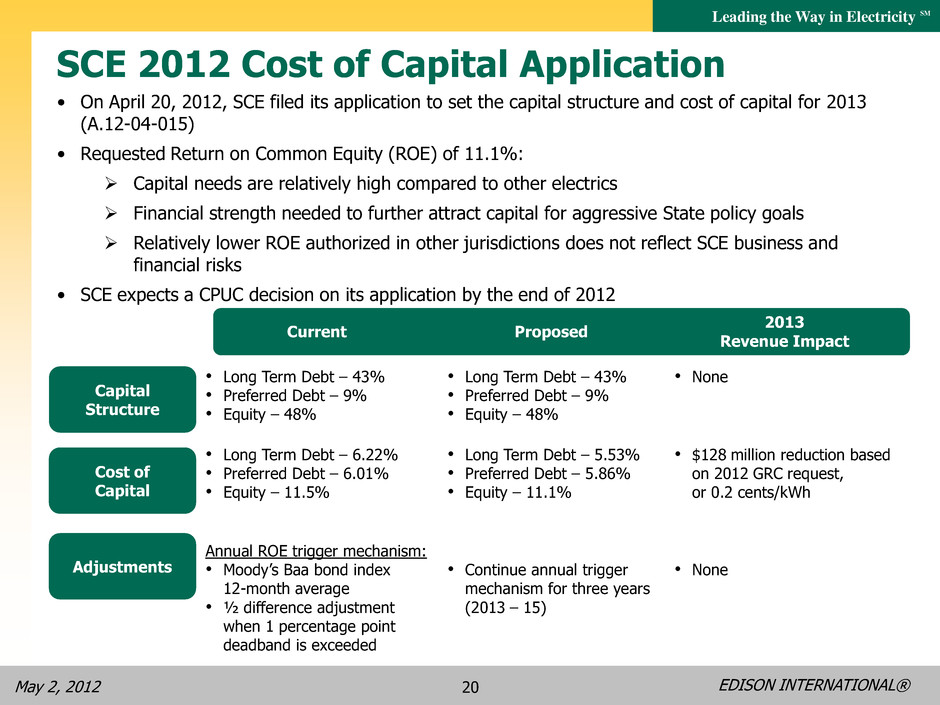
EDISON INTERNATIONAL® Leading the Way in Electricity SM May 2, 2012 20 SCE 2012 Cost of Capital Application Cost of Capital Capital Structure Adjustments Current Proposed 2013 Revenue Impact • Long Term Debt – 43% • Preferred Debt – 9% • Equity – 48% • Long Term Debt – 43% • Preferred Debt – 9% • Equity – 48% • None • Long Term Debt – 6.22% • Preferred Debt – 6.01% • Equity – 11.5% • Long Term Debt – 5.53% • Preferred Debt – 5.86% • Equity – 11.1% • $128 million reduction based on 2012 GRC request, or 0.2 cents/kWh Annual ROE trigger mechanism: • Moody’s Baa bond index 12-month average • ½ difference adjustment when 1 percentage point deadband is exceeded • Continue annual trigger mechanism for three years (2013 – 15) • None • On April 20, 2012, SCE filed its application to set the capital structure and cost of capital for 2013 (A.12-04-015) • Requested Return on Common Equity (ROE) of 11.1%: Capital needs are relatively high compared to other electrics Financial strength needed to further attract capital for aggressive State policy goals Relatively lower ROE authorized in other jurisdictions does not reflect SCE business and financial risks • SCE expects a CPUC decision on its application by the end of 2012
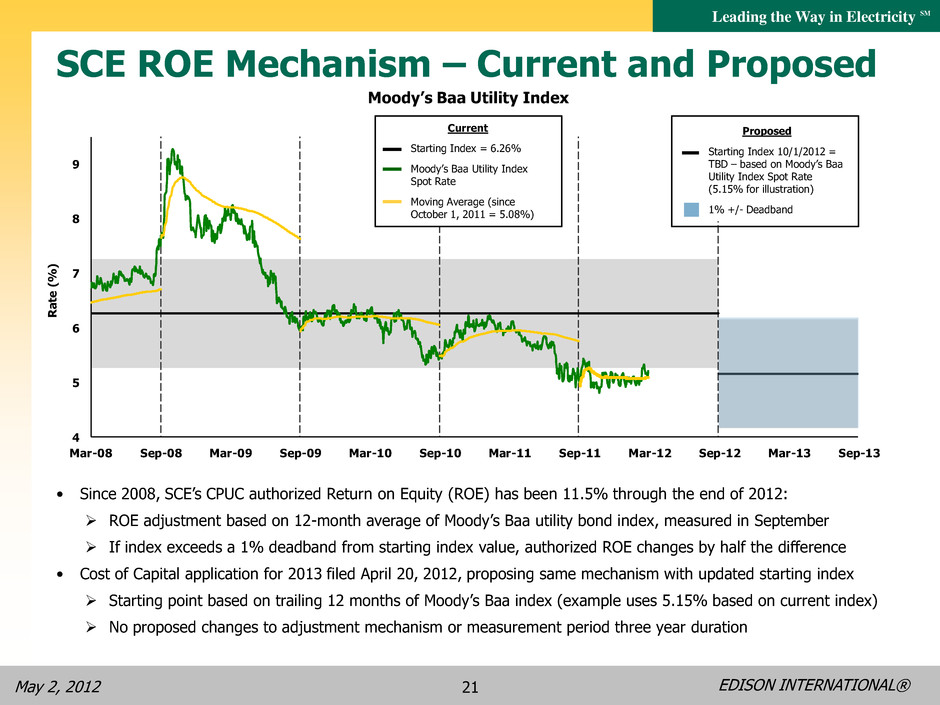
EDISON INTERNATIONAL® Leading the Way in Electricity SM May 2, 2012 21 4 5 6 7 8 9 Mar-08 Sep-08 Mar-09 Sep-09 Mar-10 Sep-10 Mar-11 Sep-11 Mar-12 Sep-12 Mar-13 Sep-13 Ra te (% ) Moody’s Baa Utility Index SCE ROE Mechanism – Current and Proposed Current Starting Index = 6.26% Moody’s Baa Utility Index Spot Rate Moving Average (since October 1, 2011 = 5.08%) • Since 2008, SCE’s CPUC authorized Return on Equity (ROE) has been 11.5% through the end of 2012: ROE adjustment based on 12-month average of Moody’s Baa utility bond index, measured in September If index exceeds a 1% deadband from starting index value, authorized ROE changes by half the difference • Cost of Capital application for 2013 filed April 20, 2012, proposing same mechanism with updated starting index Starting point based on trailing 12 months of Moody’s Baa index (example uses 5.15% based on current index) No proposed changes to adjustment mechanism or measurement period three year duration Proposed Starting Index 10/1/2012 = TBD – based on Moody’s Baa Utility Index Spot Rate (5.15% for illustration) 1% +/- Deadband
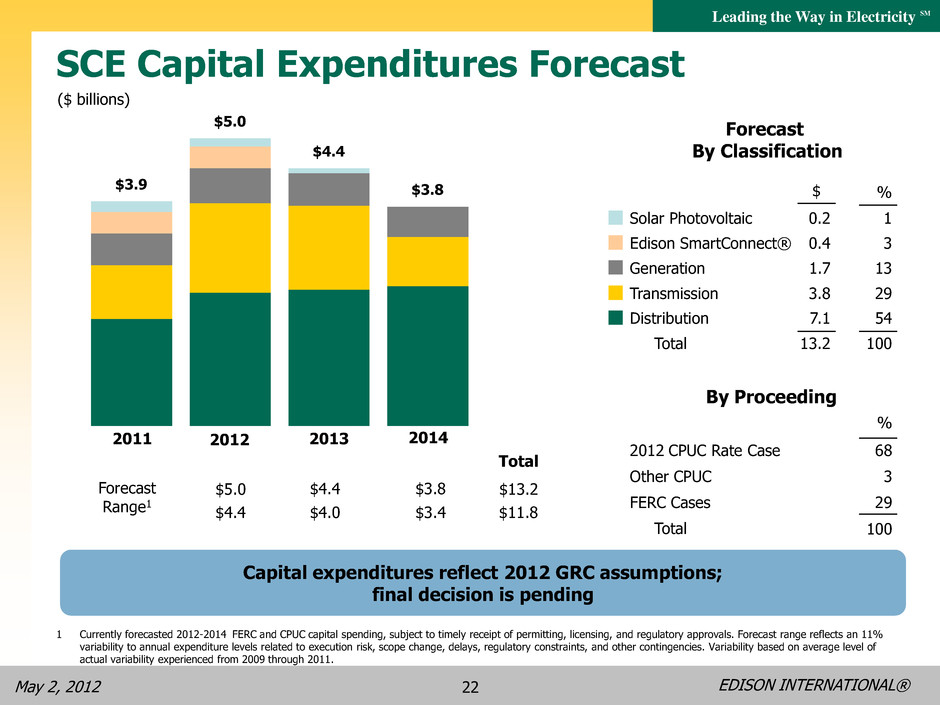
EDISON INTERNATIONAL® Leading the Way in Electricity SM May 2, 2012 22 1 Currently forecasted 2012-2014 FERC and CPUC capital spending, subject to timely receipt of permitting, licensing, and regulatory approvals. Forecast range reflects an 11% variability to annual expenditure levels related to execution risk, scope change, delays, regulatory constraints, and other contingencies. Variability based on average level of actual variability experienced from 2009 through 2011. SCE Capital Expenditures Forecast Total Forecast Range1 $5.0 $4.4 $3.8 $13.2 $4.4 $4.0 $3.4 $11.8 $3.9 $5.0 $4.4 $3.8 2011 2012 2013 2014 By Proceeding % 2012 CPUC Rate Case 68 FERC Cases 29 Total 100 Other CPUC 3 Forecast By Classification $ % Solar Photovoltaic 0.2 1 Edison SmartConnect® 0.4 3 Generation 1.7 13 Transmission 3.8 29 Distribution 7.1 54 Total 13.2 100 ($ billions) Capital expenditures reflect 2012 GRC assumptions; final decision is pending
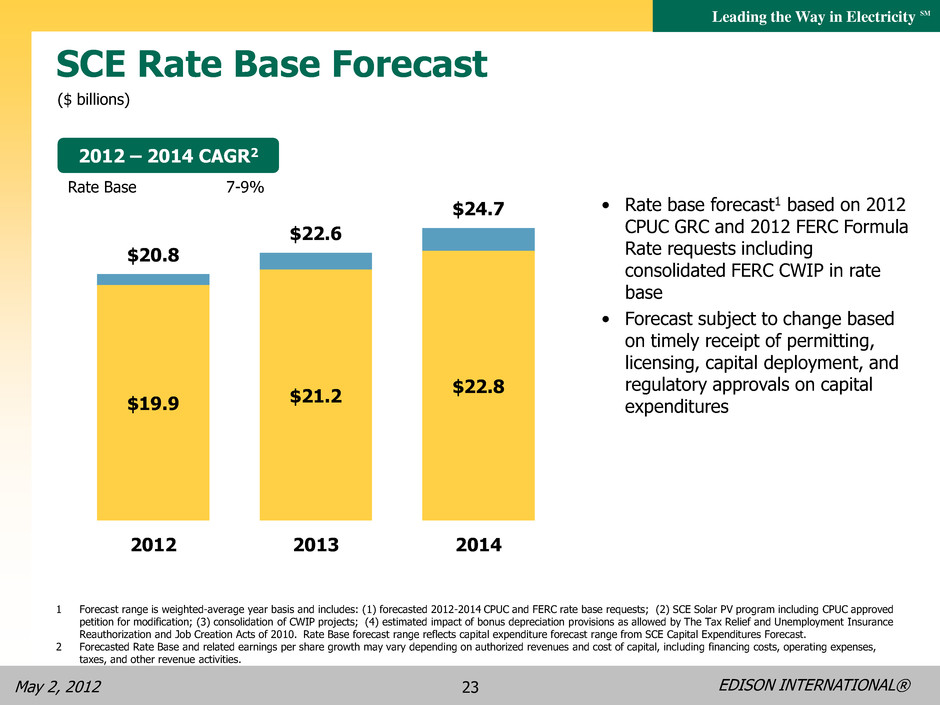
EDISON INTERNATIONAL® Leading the Way in Electricity SM May 2, 2012 23 Rate Base 7-9% 2012 – 2014 CAGR2 • Rate base forecast1 based on 2012 CPUC GRC and 2012 FERC Formula Rate requests including consolidated FERC CWIP in rate base • Forecast subject to change based on timely receipt of permitting, licensing, capital deployment, and regulatory approvals on capital expenditures ($ billions) SCE Rate Base Forecast $19.9 $21.2 $22.8 $20.8 $22.6 $24.7 2012 2013 2014 1 Forecast range is weighted-average year basis and includes: (1) forecasted 2012-2014 CPUC and FERC rate base requests; (2) SCE Solar PV program including CPUC approved petition for modification; (3) consolidation of CWIP projects; (4) estimated impact of bonus depreciation provisions as allowed by The Tax Relief and Unemployment Insurance Reauthorization and Job Creation Acts of 2010. Rate Base forecast range reflects capital expenditure forecast range from SCE Capital Expenditures Forecast. 2 Forecasted Rate Base and related earnings per share growth may vary depending on authorized revenues and cost of capital, including financing costs, operating expenses, taxes, and other revenue activities.
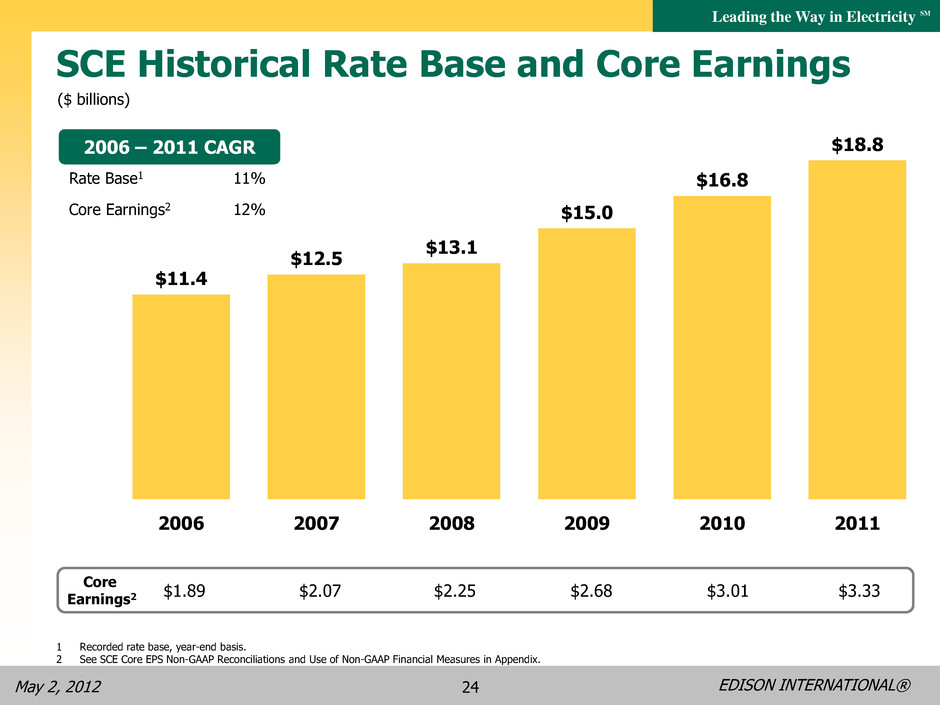
EDISON INTERNATIONAL® Leading the Way in Electricity SM May 2, 2012 24 $11.4 $12.5 $13.1 $15.0 $16.8 $18.8 2006 2007 2008 2009 2010 2011 Rate Base1 Core Earnings2 11% 12% 2006 – 2011 CAGR 1 Recorded rate base, year-end basis. 2 See SCE Core EPS Non-GAAP Reconciliations and Use of Non-GAAP Financial Measures in Appendix. Core Earnings2 $1.89 $2.07 $2.25 $2.68 $3.01 $3.33 SCE Historical Rate Base and Core Earnings ($ billions)
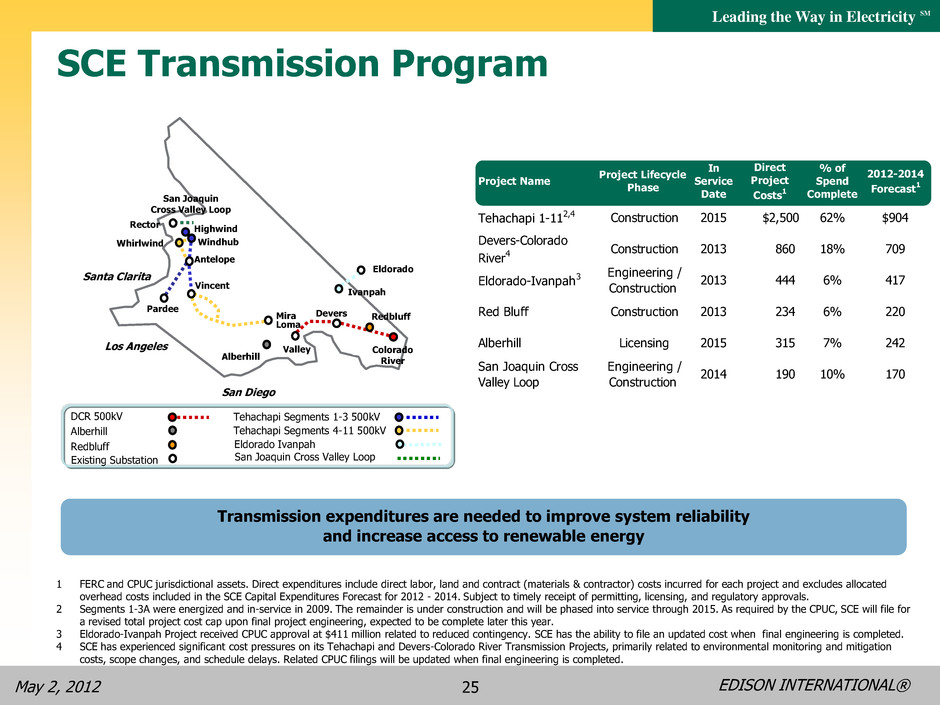
EDISON INTERNATIONAL® Leading the Way in Electricity SM May 2, 2012 25 SCE Transmission Program Transmission expenditures are needed to improve system reliability and increase access to renewable energy Eldorado Ivanpah San Joaquin Cross Valley Loop Los Angeles Vincent San Diego Pardee Antelope Palmdale Santa Ana SCE Service Territory Santa Clarita Valley Mira Loma Devers Palm Springs Windhub San Joaquin Cross Valley Loop Colorado River Rector Whirlwind Ivanpah Eldorado Highwind Alberhill Tehachapi Segments 1-3 500kV Tehachapi Segments 4-11 500kV DCR 500kV Alberhill Redbluff Redbluff Existing Substation 1 FERC and CPUC jurisdictional assets. Direct expenditures include direct labor, land and contract (materials & contractor) costs incurred for each project and excludes allocated overhead costs included in the SCE Capital Expenditures Forecast for 2012 - 2014. Subject to timely receipt of permitting, licensing, and regulatory approvals. 2 Segments 1-3A were energized and in-service in 2009. The remainder is under construction and will be phased into service through 2015. As required by the CPUC, SCE will file for a revised total project cost cap upon final project engineering, expected to be complete later this year. 3 Eldorado-Ivanpah Project received CPUC approval at $411 million related to reduced contingency. SCE has the ability to file an updated cost when final engineering is completed. 4 SCE has experienced significant cost pressures on its Tehachapi and Devers-Colorado River Transmission Projects, primarily related to environmental monitoring and mitigation costs, scope changes, and schedule delays. Related CPUC filings will be updated when final engineering is completed. Project Name Project Lifecycle Phase In Service Date Direct Project Costs1 % of Spend Complete 2012-2014 Forecast1 Tehachapi 1-112,4 Construction 2015 $2,500 62% $904 Devers-Colorado River4 Construction 2013 860 18% 709 Eldorado-Ivanpah3 Engineering / Construction 2013 444 6% 417 Red Bluff Construction 2013 234 6% 220 Alberhill Licensing 2015 315 7% 242 San Joaquin Cross Valley Loop Engineering / Construction 2014 190 10% 170
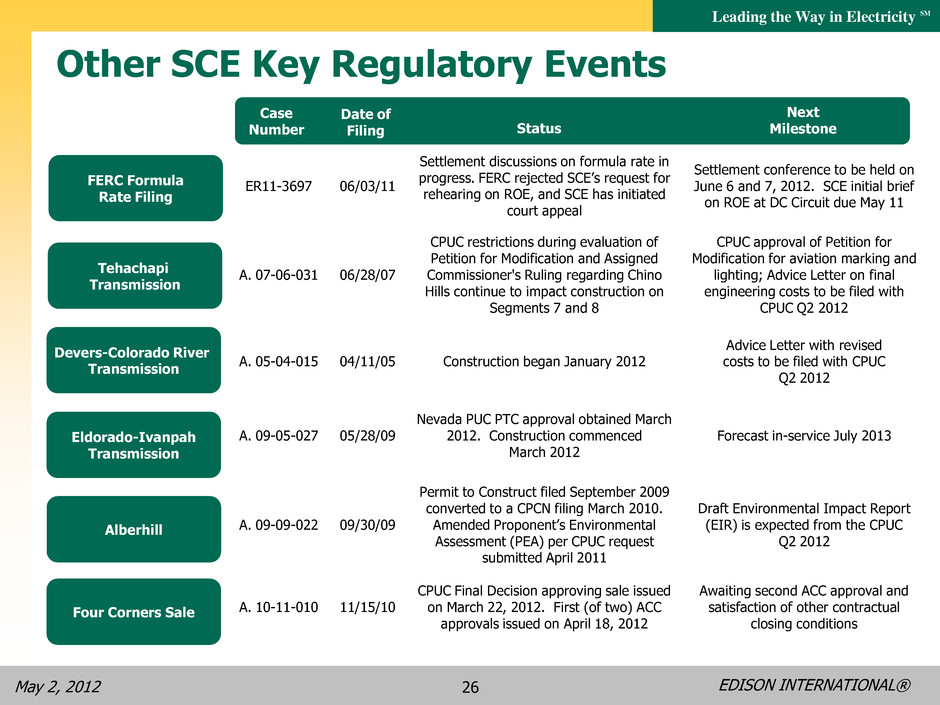
EDISON INTERNATIONAL® Leading the Way in Electricity SM May 2, 2012 26 Other SCE Key Regulatory Events Devers-Colorado River Transmission Tehachapi Transmission Eldorado-Ivanpah Transmission Alberhill Case Number Date of Filing Status Next Milestone FERC Formula Rate Filing ER11-3697 06/03/11 Settlement discussions on formula rate in progress. FERC rejected SCE’s request for rehearing on ROE, and SCE has initiated court appeal Settlement conference to be held on June 6 and 7, 2012. SCE initial brief on ROE at DC Circuit due May 11 A. 07-06-031 06/28/07 CPUC restrictions during evaluation of Petition for Modification and Assigned Commissioner's Ruling regarding Chino Hills continue to impact construction on Segments 7 and 8 CPUC approval of Petition for Modification for aviation marking and lighting; Advice Letter on final engineering costs to be filed with CPUC Q2 2012 A. 05-04-015 04/11/05 Construction began January 2012 Advice Letter with revised costs to be filed with CPUC Q2 2012 A. 09-05-027 05/28/09 Nevada PUC PTC approval obtained March 2012. Construction commenced March 2012 Forecast in-service July 2013 A. 09-09-022 09/30/09 Permit to Construct filed September 2009 converted to a CPCN filing March 2010. Amended Proponent’s Environmental Assessment (PEA) per CPUC request submitted April 2011 Draft Environmental Impact Report (EIR) is expected from the CPUC Q2 2012 A. 10-11-010 11/15/10 CPUC Final Decision approving sale issued on March 22, 2012. First (of two) ACC approvals issued on April 18, 2012 Awaiting second ACC approval and satisfaction of other contractual closing conditions Four Corners Sale
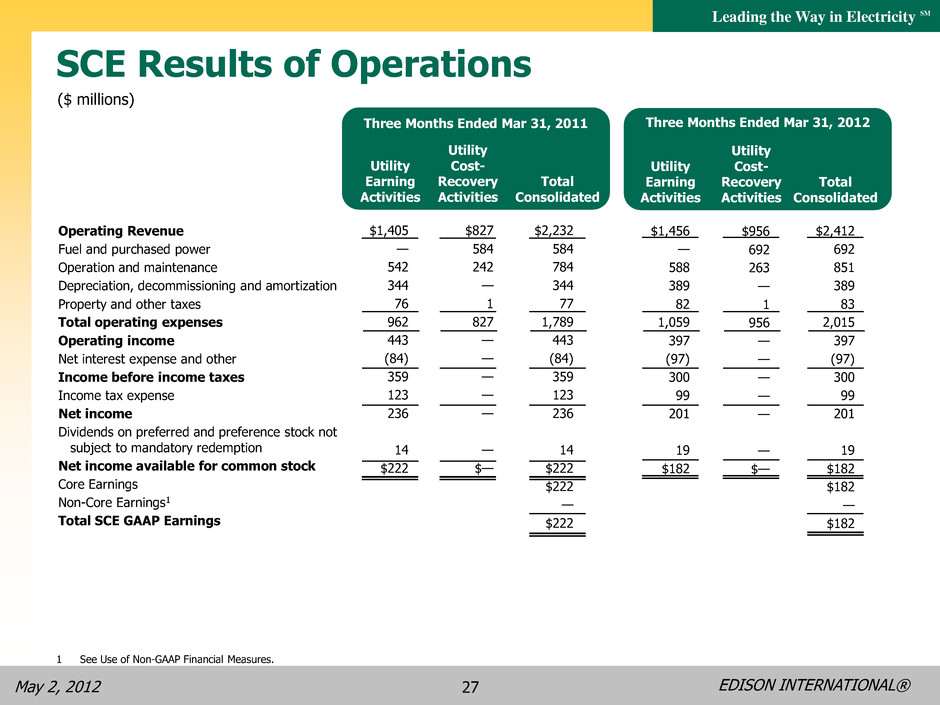
EDISON INTERNATIONAL® Leading the Way in Electricity SM May 2, 2012 27 $1,456 — 588 389 82 1,059 397 (97) 300 99 201 19 $182 $2,412 692 851 389 83 2,015 397 (97) 300 99 201 19 $182 $182 — $182 SCE Results of Operations ($ millions) Utility Earning Activities Utility Cost- Recovery Activities Total Consolidated Three Months Ended Mar 31, 2011 Utility Earning Activities Utility Cost- Recovery Activities Total Consolidated Three Months Ended Mar 31, 2012 Operating Revenue Fuel and purchased power Operation and maintenance Depreciation, decommissioning and amortization Property and other taxes Total operating expenses Operating income Net interest expense and other Income before income taxes Income tax expense Net income Dividends on preferred and preference stock not subject to mandatory redemption Net income available for common stock Core Earnings Non-Core Earnings1 Total SCE GAAP Earnings 1 See Use of Non-GAAP Financial Measures. $1,405 — 542 344 76 962 443 (84) 359 123 236 14 $222 $827 584 242 — 1 827 — — — — — — $— $2,232 584 784 344 77 1,789 443 (84) 359 123 236 14 $222 $222 — $222 $956 692 263 — 1 956 — — — — — — $—
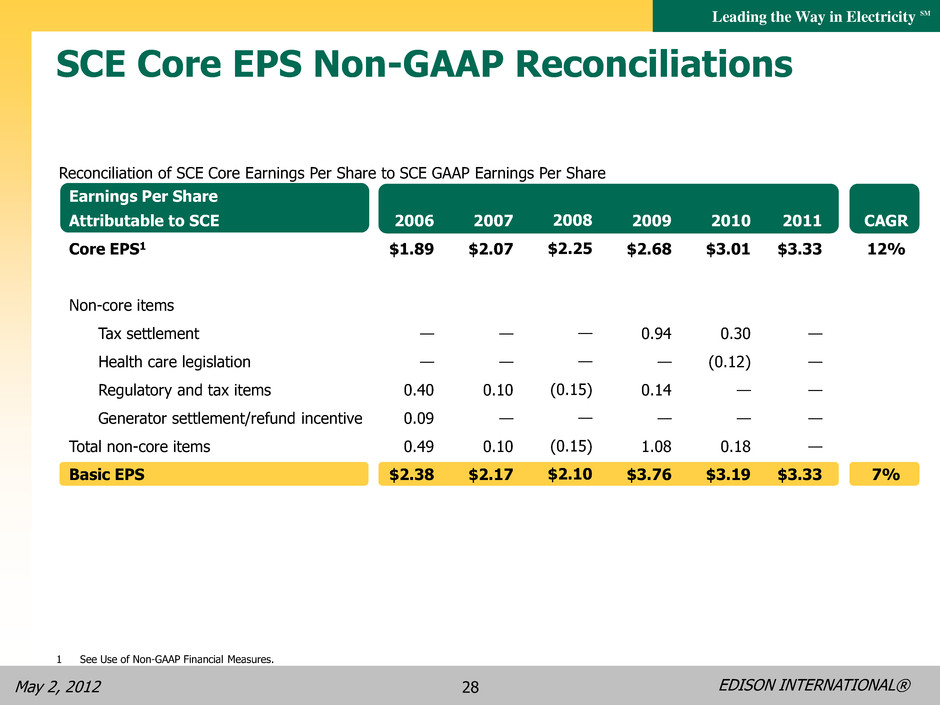
EDISON INTERNATIONAL® Leading the Way in Electricity SM May 2, 2012 28 Earnings Per Share Attributable to SCE Core EPS1 Non-core items Tax settlement Health care legislation Regulatory and tax items Generator settlement/refund incentive Total non-core items Basic EPS SCE Core EPS Non-GAAP Reconciliations 1 See Use of Non-GAAP Financial Measures. Reconciliation of SCE Core Earnings Per Share to SCE GAAP Earnings Per Share 2006 $1.89 — — 0.40 0.09 0.49 $2.38 2007 $2.07 — — 0.10 — 0.10 $2.17 2008 $2.25 — — (0.15) — (0.15) $2.10 2009 $2.68 0.94 — 0.14 — 1.08 $3.76 2010 $3.01 0.30 (0.12) — — 0.18 $3.19 CAGR 12% 7% 2011 $3.33 — — — — — $3.33
EDISON INTERNATIONAL® Leading the Way in Electricity SM May 2, 2012 29 EMG Appendix
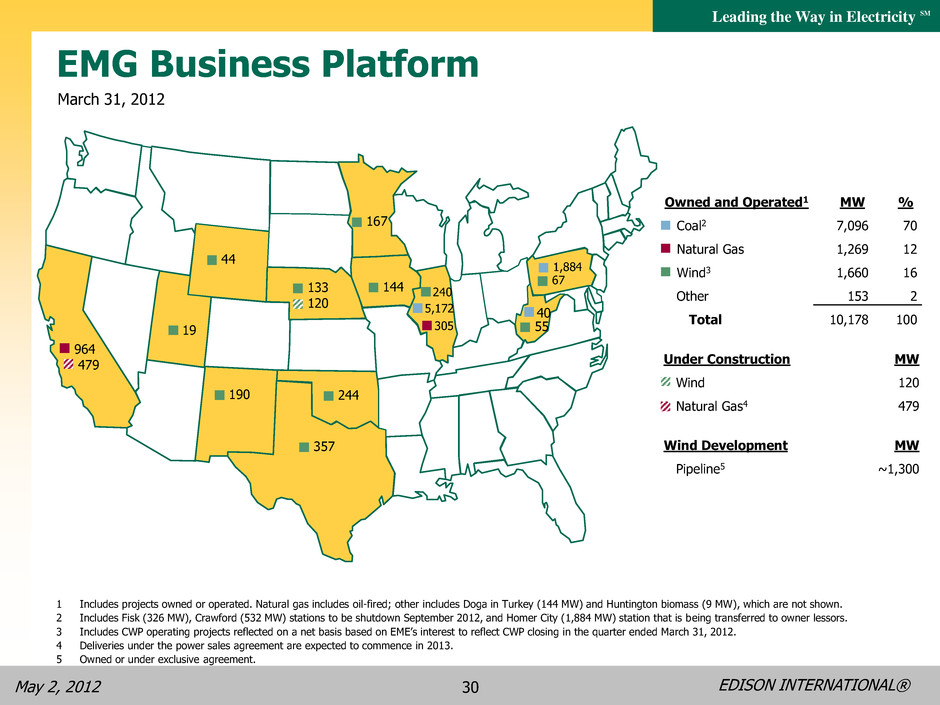
EDISON INTERNATIONAL® Leading the Way in Electricity SM May 2, 2012 30 Owned and Operated1 Coal2 Natural Gas Wind3 Other Total MW 7,096 1,269 1,660 153 10,178 % 70 12 16 2 100 Under Construction Wind Natural Gas4 Wind Development Pipeline5 MW 120 479 MW ~1,300 67 44 19 244 190 357 5,172 167 133 305 40 1,884 144 EMG Business Platform March 31, 2012 1 Includes projects owned or operated. Natural gas includes oil-fired; other includes Doga in Turkey (144 MW) and Huntington biomass (9 MW), which are not shown. 2 Includes Fisk (326 MW), Crawford (532 MW) stations to be shutdown September 2012, and Homer City (1,884 MW) station that is being transferred to owner lessors. 3 Includes CWP operating projects reflected on a net basis based on EME’s interest to reflect CWP closing in the quarter ended March 31, 2012. 4 Deliveries under the power sales agreement are expected to commence in 2013. 5 Owned or under exclusive agreement. 240 964 479 120 55

EDISON INTERNATIONAL® Leading the Way in Electricity SM May 2, 2012 31 March 31, 2012 MWG Hedge Program Status Midwest Generation Total GWh (NI, AEP/Dayton, and Indiana Hubs)3 Average price ($/MWh)2 Coal under contract (millions of tons) 1 Change from Q4 2011 in GWh for 2012 includes 93 GWh of new hedges at Midwest Generation. 2 The above hedge positions include forward contracts for the sale of power and futures contracts during different periods of the year and the day. Market prices tend to be higher during on-peak periods and during summer months, although there is significant variability of power prices during different periods of time. Accordingly, the above hedge positions are not directly comparable to the 24-hour Northern Illinois Hub prices set forth above. 3 Includes hedging transactions primarily at the Northern Illinois Hub and to a lesser extent the AEP/Dayton Hub, both in PJM, and the Indiana Hub in MISO. 2014 Remainder of 2012 2013 Net1 Change From Q4 Net1 Change From Q4 Net1 Change From Q4 4,719 $39.18 12.8 1,020 $40.43 10.1 — — 9.8 (2,466) $0.42 (3.2) — — 0.3 — — —
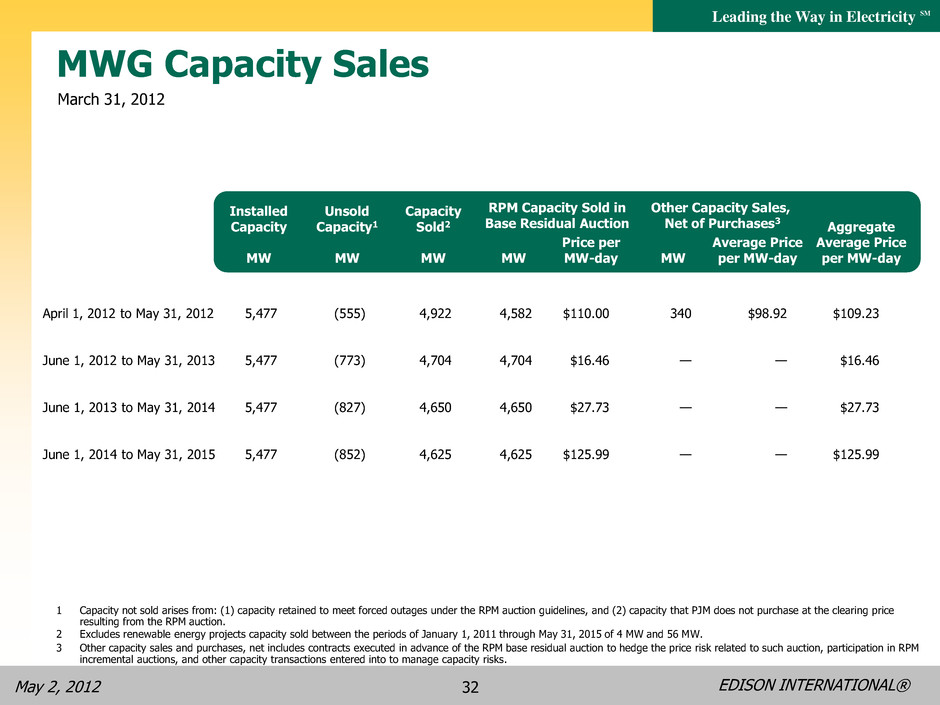
EDISON INTERNATIONAL® Leading the Way in Electricity SM May 2, 2012 32 March 31, 2012 MWG Capacity Sales 5,477 5,477 5,477 5,477 (555) (773) (827) (852) 4,922 4,704 4,650 4,625 4,582 4,704 4,650 4,625 $110.00 $16.46 $27.73 $125.99 MW Average Price per MW-day Aggregate Average Price per MW-day Installed Capacity MW Unsold Capacity1 MW Capacity Sold2 MW MW Price per MW-day 340 — — — $98.92 — — — $109.23 $16.46 $27.73 $125.99 April 1, 2012 to May 31, 2012 June 1, 2012 to May 31, 2013 June 1, 2013 to May 31, 2014 June 1, 2014 to May 31, 2015 RPM Capacity Sold in Base Residual Auction Other Capacity Sales, Net of Purchases3 1 Capacity not sold arises from: (1) capacity retained to meet forced outages under the RPM auction guidelines, and (2) capacity that PJM does not purchase at the clearing price resulting from the RPM auction. 2 Excludes renewable energy projects capacity sold between the periods of January 1, 2011 through May 31, 2015 of 4 MW and 56 MW. 3 Other capacity sales and purchases, net includes contracts executed in advance of the RPM base residual auction to hedge the price risk related to such auction, participation in RPM incremental auctions, and other capacity transactions entered into to manage capacity risks.
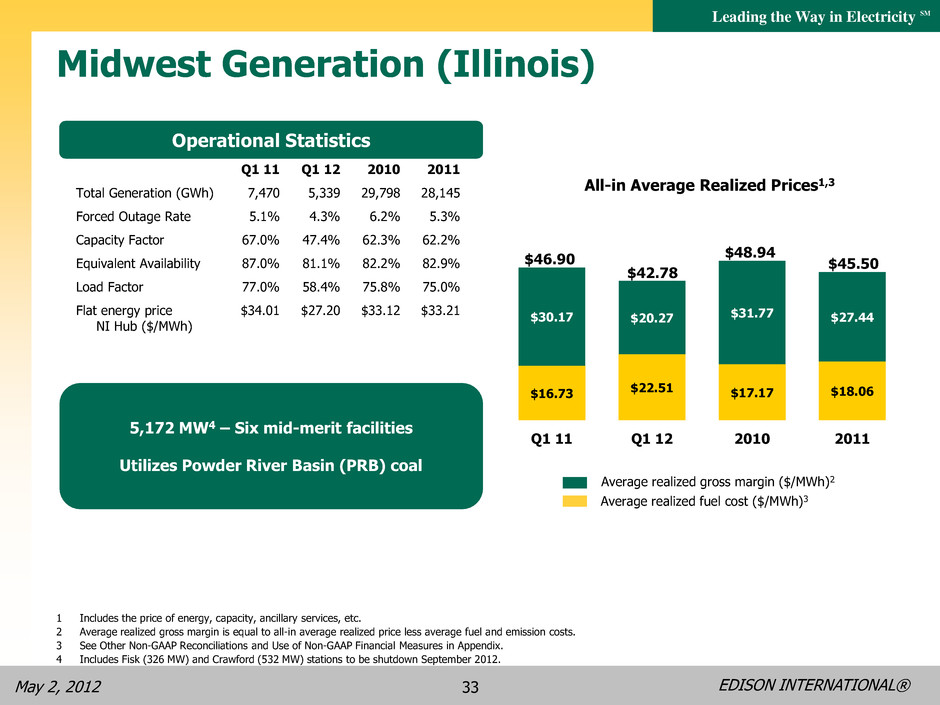
EDISON INTERNATIONAL® Leading the Way in Electricity SM May 2, 2012 33 1 Includes the price of energy, capacity, ancillary services, etc. 2 Average realized gross margin is equal to all-in average realized price less average fuel and emission costs. 3 See Other Non-GAAP Reconciliations and Use of Non-GAAP Financial Measures in Appendix. 4 Includes Fisk (326 MW) and Crawford (532 MW) stations to be shutdown September 2012. Average realized fuel cost ($/MWh)3 Average realized gross margin ($/MWh)2 $16.73 $22.51 $17.17 $18.06 $30.17 $20.27 $31.77 $27.44 Q1 11 Q1 12 2010 2011 All-in Average Realized Prices1,3 $46.90 $48.94 $42.78 $45.50 • Total Generation (GWh) • Forced Outage Rate • Capacity Factor • Equivalent Availability • Load Factor • Flat energy price • NI Hub ($/MWh) 2010 29,798 6.2% 62.3% 82.2% 75.8% $33.12 2011 28,145 5.3% 62.2% 82.9% 75.0% $33.21 Midwest Generation (Illinois) 5,172 MW4 – Six mid-merit facilities Utilizes Powder River Basin (PRB) coal Operational Statistics Q1 11 7,470 5.1% 67.0% 87.0% 77.0% $34.01 Q1 12 5,339 4.3% 47.4% 81.1% 58.4% $27.20
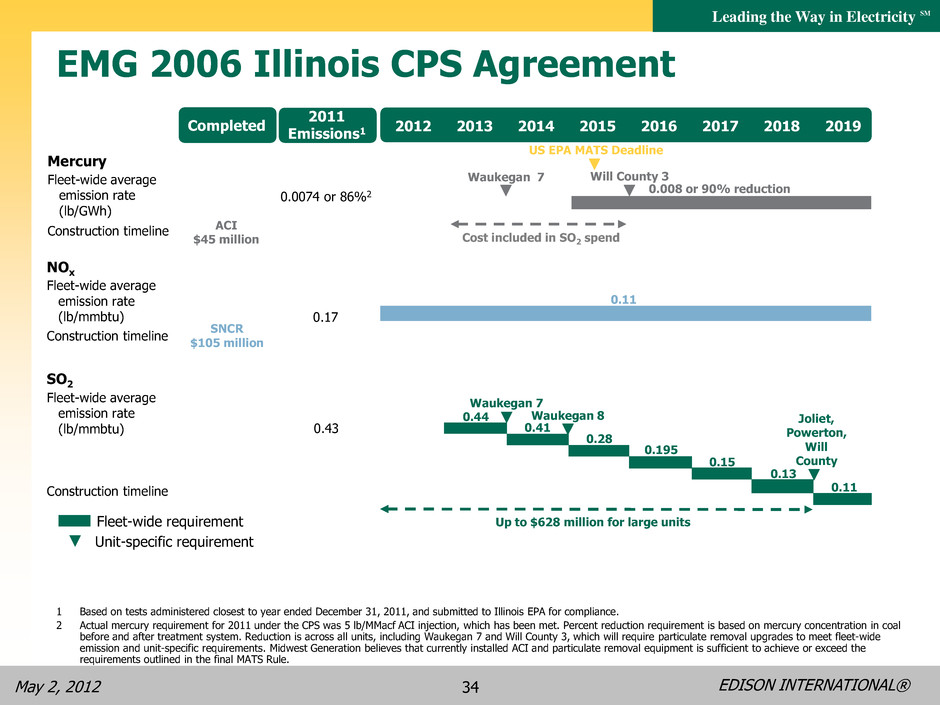
EDISON INTERNATIONAL® Leading the Way in Electricity SM May 2, 2012 34 EMG 2006 Illinois CPS Agreement NOx SO2 Construction timeline Fleet-wide average emission rate (lb/mmbtu) Construction timeline Fleet-wide average emission rate (lb/mmbtu) Mercury Construction timeline Fleet-wide average emission rate (lb/GWh) 2012 2013 2014 2015 2016 2017 2018 2019 0.11 Up to $628 million for large units Waukegan 7 Waukegan 8 Joliet, Powerton, Will County Waukegan 7 0.008 or 90% reduction Will County 3 Cost included in SO2 spend 2011 Emissions1 ACI $45 million Completed 0.0074 or 86%2 0.17 0.43 0.44 0.41 0.28 0.195 0.15 0.13 0.11 Fleet-wide requirement Unit-specific requirement SNCR $105 million US EPA MATS Deadline 1 Based on tests administered closest to year ended December 31, 2011, and submitted to Illinois EPA for compliance. 2 Actual mercury requirement for 2011 under the CPS was 5 lb/MMacf ACI injection, which has been met. Percent reduction requirement is based on mercury concentration in coal before and after treatment system. Reduction is across all units, including Waukegan 7 and Will County 3, which will require particulate removal upgrades to meet fleet-wide emission and unit-specific requirements. Midwest Generation believes that currently installed ACI and particulate removal equipment is sufficient to achieve or exceed the requirements outlined in the final MATS Rule.
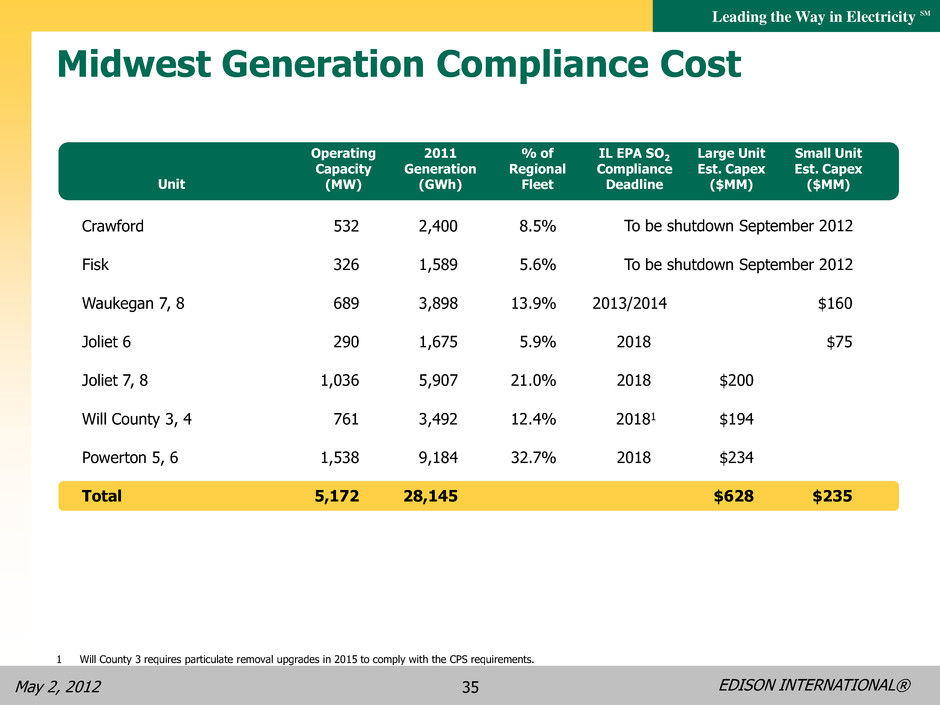
EDISON INTERNATIONAL® Leading the Way in Electricity SM May 2, 2012 35 Midwest Generation Compliance Cost Unit Crawford 532 2,400 8.5% To be shutdown September 2012 Fisk 326 1,589 5.6% To be shutdown September 2012 Waukegan 7, 8 689 3,898 13.9% 2013/2014 $160 Joliet 6 290 1,675 5.9% 2018 $75 Joliet 7, 8 1,036 5,907 21.0% 2018 $200 Will County 3, 4 761 3,492 12.4% 20181 $194 Powerton 5, 6 1,538 9,184 32.7% 2018 $234 Total 5,172 28,145 $628 $235 1 Will County 3 requires particulate removal upgrades in 2015 to comply with the CPS requirements. Operating Capacity (MW) 2011 Generation (GWh) % of Regional Fleet IL EPA SO2 Compliance Deadline Large Unit Est. Capex ($MM) Small Unit Est. Capex ($MM)
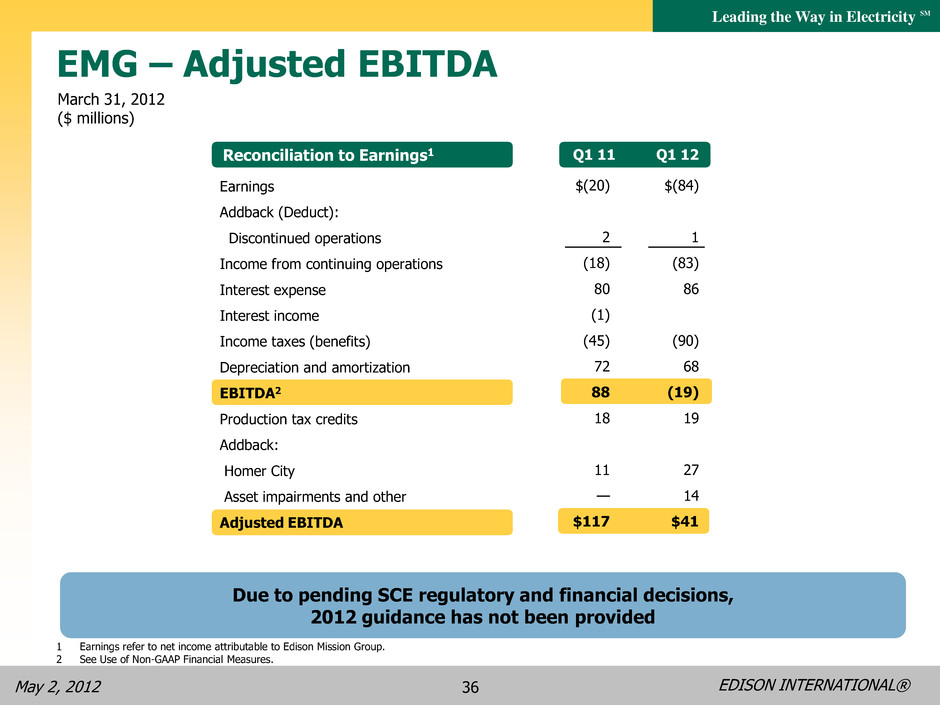
EDISON INTERNATIONAL® Leading the Way in Electricity SM May 2, 2012 36 Reconciliation to Earnings1 EMG – Adjusted EBITDA Q4 09 Q1 11 Earnings Addback (Deduct): Discontinued operations Income from continuing operations Interest expense Interest income Income taxes (benefits) Depreciation and amortization EBITDA2 Production tax credits Addback: Homer City Asset impairments and other Adjusted EBITDA March 31, 2012 ($ millions) 1 Earnings refer to net income attributable to Edison Mission Group. 2 See Use of Non-GAAP Financial Measures. 1 11 2 $(20) 2 (18) 80 (1) (45) 72 88 18 11 — $117 $(84) 1 (83) 86 (90) 68 (19) 19 27 14 $41 Due to pending SCE regulatory and financial decisions, 2012 guidance has not been provided
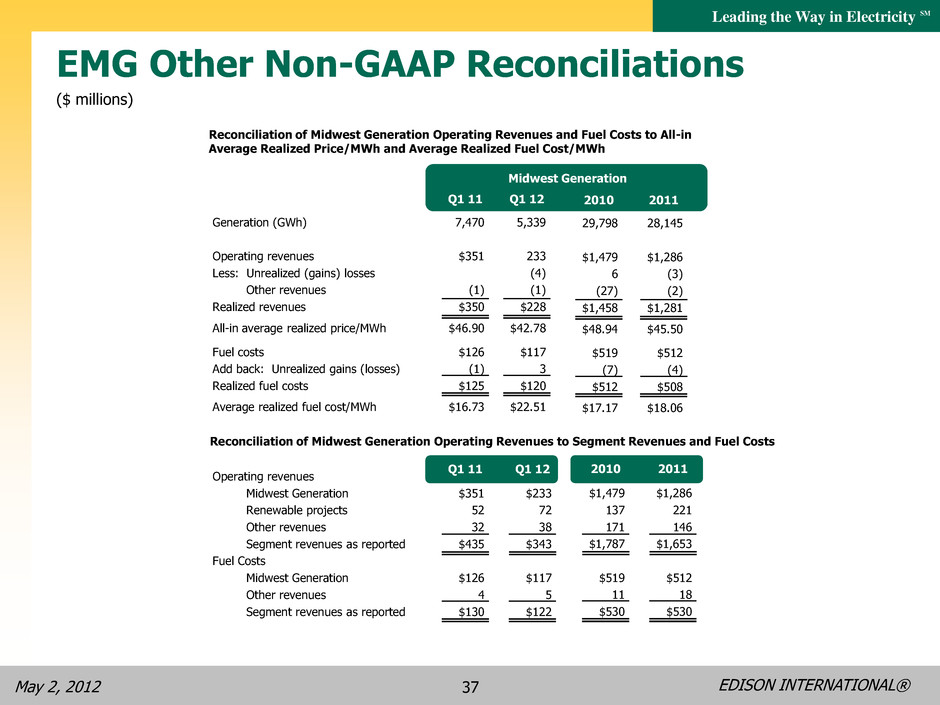
EDISON INTERNATIONAL® Leading the Way in Electricity SM May 2, 2012 37 EMG Other Non-GAAP Reconciliations Reconciliation of Midwest Generation Operating Revenues and Fuel Costs to All-in Average Realized Price/MWh and Average Realized Fuel Cost/MWh Generation (GWh) Operating revenues Less: Unrealized (gains) losses Other revenues Realized revenues All-in average realized price/MWh Fuel costs Add back: Unrealized gains (losses) Realized fuel costs Average realized fuel cost/MWh 7,470 $351 (1) $350 $46.90 $126 (1) $125 $16.73 Q1 11 Q1 12 Midwest Generation Operating revenues Midwest Generation Renewable projects Other revenues Segment revenues as reported Fuel Costs Midwest Generation Other revenues Segment revenues as reported Reconciliation of Midwest Generation Operating Revenues to Segment Revenues and Fuel Costs Q1 11 Q1 12 $351 52 32 $435 $126 4 $130 ($ millions) 29,798 $1,479 6 (27) $1,458 $48.94 $519 (7) $512 $17.17 28,145 $1,286 (3) (2) $1,281 $45.50 $512 (4) $508 $18.06 2010 2011 2010 2011 $1,479 137 171 $1,787 $519 11 $530 $1,286 221 146 $1,653 $512 18 $530 5,339 233 (4) (1) $228 $42.78 $117 3 $120 $22.51 $233 72 38 $343 $117 5 $122

EDISON INTERNATIONAL® Leading the Way in Electricity SM May 2, 2012 38 Edison International’s earnings are prepared in accordance with generally accepted accounting principles used in the United States and represent the company’s earnings as reported to the Securities and Exchange Commission. Our management uses core earnings and EPS by principal operating subsidiary internally for financial planning and for analysis of performance. We also use core earnings and EPS by principal operating subsidiary when communicating with analysts and investors regarding our earnings results and outlook, to facilitate the company’s performance from period to period. Core earnings is a Non-GAAP financial measure and may not be comparable to those of other companies. Core earnings and core earnings per share are defined as GAAP earnings and basic earnings per share excluding income or loss from discontinued operations and income or loss from significant discrete items that management does not consider representative of ongoing earnings. GAAP earnings refer to net income attributable to Edison International common shareholders or attributable to the common shareholders of each subsidiary. EPS by principal operating subsidiary is based on the principal operating subsidiaries’ net income attributable to the common shareholders of each subsidiary, respectively, and Edison International’s weighted average outstanding common shares. The impact of participating securities (vested stock options that earn dividend equivalents that may participate in undistributed earnings with common stock) for each principal operating subsidiary is not material to each principal operating subsidiary’s EPS and is therefore reflected in the results of the Edison International holding company, which we refer to as EIX parent company and other. EBITDA is defined as earnings before interest, income taxes, depreciation and amortization. Adjusted EBITDA includes production tax credits from EMG’s wind projects and excludes amounts from gain on the sale of assets, loss on early extinguishment of debt and leases, and impairment of assets and investments. Our management uses Adjusted EBITDA as an important financial measure for evaluating EMG. The average realized energy price and average realized fuel cost is a non-GAAP performance measure since such statistical measures exclude unrealized gains or losses recorded as operating revenues and unrealized gains or losses recorded as fuel expenses. Management believes that the average realized energy price and average realized fuel cost is more meaningful for investors as it reflects the impact of hedge contracts at the time of actual generation in period-over- period comparisons or as compared to real-time market prices. A reconciliation of Non-GAAP information to GAAP information, including the impact of participating securities, is included either on the slide where the information appears or on another slide referenced in this presentation. Use of Non-GAAP Financial Measures


