Exhibit 99.2 EDISON INTERNATIONAL® Leading the Way in Electricity SM April 30, 2013 0 First Quarter 2013 Financial Teleconference

Exhibit 99.2 EDISON INTERNATIONAL® Leading the Way in Electricity SM April 30, 2013 1 Statements contained in this presentation about future performance, including, without limitation, operating results, asset and rate base growth, capital expenditures, San Onofre Nuclear Generating Station (SONGS), EME bankruptcy, and other statements that are not purely historical, are forward- looking statements. These forward-looking statements reflect our current expectations; however, such statements involve risks and uncertainties. Actual results could differ materially from current expectations. These forward-looking statements represent our expectations only as of the date of this presentation, and Edison International assumes no duty to update them to reflect new information, events or circumstances. Important factors that could cause different results are discussed under the headings “Risk Factors,” and “Management’s Discussion and Analysis” in Edison International’s 2012 Form 10-K and other reports filed with the Securities and Exchange Commission, which are available on our website: www.edisoninvestor.com. These filings also provide additional information on historical and other factual data contained in this presentation. Forward-Looking Statements
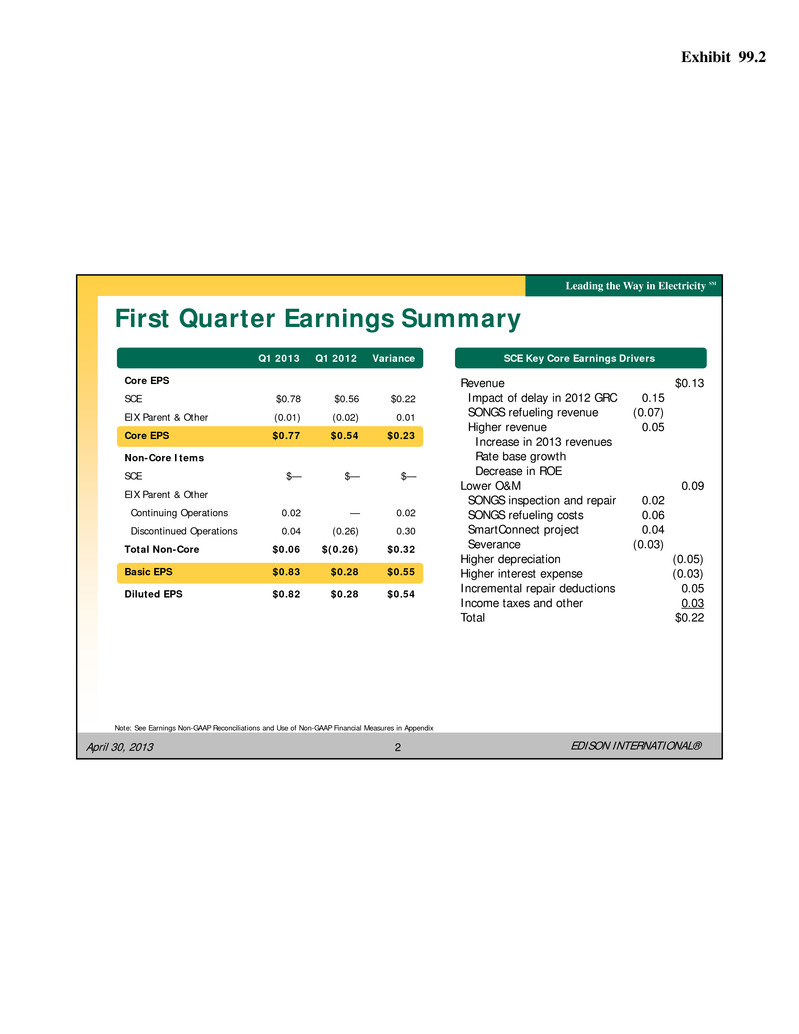
Exhibit 99.2 EDISON INTERNATIONAL® Leading the Way in Electricity SM April 30, 2013 2 First Quarter Earnings Summary Note: See Earnings Non-GAAP Reconciliations and Use of Non-GAAP Financial Measures in Appendix SCE Key Core Earnings Drivers Revenue $0.13 Impact of delay in 2012 GRC 0.15 SONGS refueling revenue (0.07) Higher revenue 0.05 Increase in 2013 revenues Rate base growth Decrease in ROE Lower O&M 0.09 SONGS inspection and repair 0.02 SONGS refueling costs 0.06 SmartConnect project 0.04 Severance (0.03) Higher depreciation (0.05) Higher interest expense (0.03) Incremental repair deductions 0.05 Income taxes and other 0.03 Total $0.22 Q1 2013 Q1 2012 Variance Core EPS SCE $0.78 $0.56 $0.22 EIX Parent & Other (0.01) (0.02) 0.01 Core EPS $0.77 $0.54 $0.23 Non-Core Items SCE $— $— $— EIX Parent & Other Continuing Operations 0.02 — 0.02 Discontinued Operations 0.04 (0.26) 0.30 Total Non-Core $0.06 $(0.26) $0.32 Basic EPS $0.83 $0.28 $0.55 Diluted EPS $0.82 $0.28 $0.54

Exhibit 99.2 EDISON INTERNATIONAL® Leading the Way in Electricity SM April 30, 2013 3 $3.9 $4.2 $4.0 2012 2013 2014 2015 2016 2017 Forecast pending GRC Notice of Intent filing Q3 2013 Note: 2013-14 forecasted capital spending subject to timely receipt of permitting, licensing, and regulatory approvals. Forecast range reflects an 10% variability based on average level of actual variability experienced from 2009 through 2012. Capital Expenditures Forecast ($ billions) Forecast Range 2013-14 Total Base $4.2 $4.0 $8.2 Low $3.8 $3.6 $7.4 By Jurisdiction % CPUC 73 FERC 27 Total 100 2013 – 14 Forecast by Classification $ % Generation 1.0 12 Transmission 2.2 27 Distribution 5.0 61 Total 8.2 100

Exhibit 99.2 EDISON INTERNATIONAL® Leading the Way in Electricity SM April 30, 2013 4 ($ billions) Rate Base Forecast $21.4 $22.8 $21.8 $23.6 2013 2014 2015 2016 2017 Note: Weighted-average year basis, including: (1) forecasted 2012-2014 FERC rate base requests; (2) SCE Solar PV program including CPUC-approved Petition for Modification; (3) consolidation of CWIP projects; (4) estimated impact of bonus depreciation provisions. Rate Base forecast range reflects capital expenditure forecast range. Smart Grid Forecast pending GRC Notice of Intent filing Q3 2013 • Driven by infrastructure replacement, reliability investments, and public policy requirements • FERC rate base includes CWIP and is approximately 20% of 2013 and 2014 rate base forecasts 7 – 8% Projected Rate Base Growth from 2013 – 14
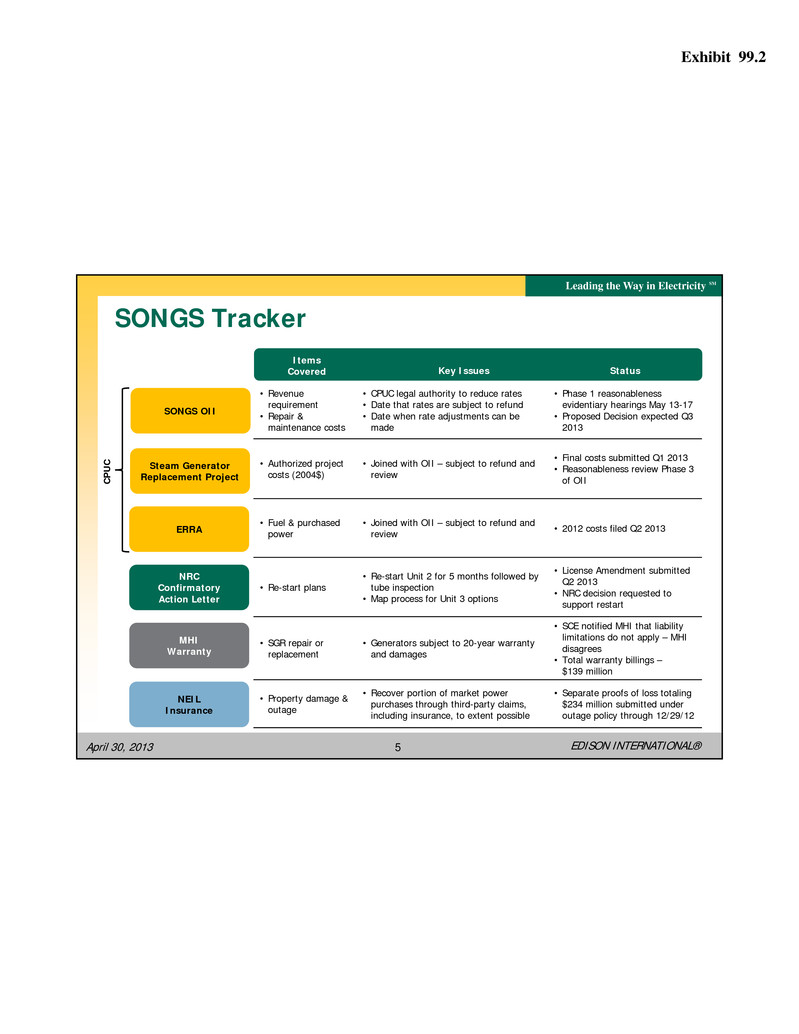
Exhibit 99.2 EDISON INTERNATIONAL® Leading the Way in Electricity SM April 30, 2013 5 SONGS Tracker ERRA Steam Generator Replacement Project NRC Confirmatory Action Letter MHI Warranty Items Covered Key Issues Status SONGS OII • Revenue requirement • Repair & maintenance costs • CPUC legal authority to reduce rates • Date that rates are subject to refund • Date when rate adjustments can be made • Phase 1 reasonableness evidentiary hearings May 13-17 • Proposed Decision expected Q3 2013 • Authorized project costs (2004$) • Joined with OII – subject to refund and review • Final costs submitted Q1 2013 • Reasonableness review Phase 3 of OII • Fuel & purchased power • Joined with OII – subject to refund and review • 2012 costs filed Q2 2013 • Re-start plans • Re-start Unit 2 for 5 months followed by tube inspection • Map process for Unit 3 options • License Amendment submitted Q2 2013 • NRC decision requested to support restart • SGR repair or replacement • Generators subject to 20-year warranty and damages • SCE notified MHI that liability limitations do not apply – MHI disagrees • Total warranty billings – $139 million • Property damage & outage • Recover portion of market power purchases through third-party claims, including insurance, to extent possible • Separate proofs of loss totaling $234 million submitted under outage policy through 12/29/12 NEIL Insurance CP UC

Exhibit 99.2 EDISON INTERNATIONAL® Leading the Way in Electricity SM April 30, 2013 6 SONGS – Supplemental Data 1 Calculated in accordance with SONGS OII and differs from SCE’s prior estimates as it includes the planned outage periods and estimated foregone energy sales. Includes approximately $50 million incurred during planned outage periods. 2 In 2005 the CPUC authorized expenditures of approximately $525 million ($665 million based on SCE's estimate after adjustment for inflation using the Handy-Whitman Index) for SCE's 78.21% share of SONGS. Subject to CPUC reasonableness review 3 Includes direct operations and maintenance costs, depreciation, and return on investment 4 Net of accumulated depreciation ($ millions) Outage Impacts (SCE share) Total Inspection & Repair Costs – Incurred $109 Net Market Costs – CPUC Basis1 $444 Regulatory (SCE share) Steam Generator Replacement (SGRP) – Approved2 $665 SGRP – Incurred $602 2012 Annual Revenue Requirement3 $613 Physical (Total) SCE Ownership 78.21% Capacity (MW) 2,150 2011 Generation (million kWh) 18,097 Unit 2 Unit 3 Common Plant Total Rate Base Net Plant in Service3 $619 $453 $240 $1,312 Materials and Supplies — — 100 100 Accumulated Deferred Income Taxes (118) (74) (46) (238) Total Rate Base $501 $379 $294 $1,174 Add: Acc. Deferred Income Taxes 118 74 46 238 Add: Construction Work in Progress 23 95 100 218 Add: Nuclear Fuel 153 216 102 471 Total Net Investment $795 $764 $542 $2,101

Exhibit 99.2 EDISON INTERNATIONAL® Leading the Way in Electricity SM April 30, 2013 7 FERC Return on Equity FERC Formula Rates • August 2011 – FERC accepted SCE’s formula rates effective January 1, 2012 • Rates remain subject to refund and settlement • Next settlement conference May 2013 • September 2012 – Formula Rate update filed for 2013; $178 million increase in transmission rates implemented on October 1, 2012, subject to pending FERC order FERC ROE • 2013 11.1% ROE guidance: 9.93% base ROE – using median of SCE proxy group +50 bps CAISO participation +65 bps weighted average for project incentives 2008 CWIP ROE Appeal • FERC policy on median vs. midpoint of proxy group: Median – utilities filing individually Midpoint – ISO members filing as a group • December 2011 – SCE appealed 2008 ROE in CWIP proceeding based on median vs. midpoint issue to D.C. Circuit of the U.S. Court of Appeals • Oral arguments held on March 25, 2013, with decision expected by Q4 2013

Exhibit 99.2 EDISON INTERNATIONAL® Leading the Way in Electricity SM April 30, 2013 8 3 4 5 6 7 8 9 Sep-08 Sep-12 Ra te (% ) Cost of Capital Mechanism • Phase 1 decision approved capital structure and cost of capital for 2013 Approved capital structure – 48% equity, 43% long-term debt, 9% preferred equity Approved cost of capital – 10.45% equity, 5.49% long-term debt, 5.79% preferred equity • Phase 2 decision approved continuation of existing adjustment mechanism through 2015 ROE adjustment based on 12-month average of Moody’s Baa utility bond rates, measured from Oct. 1 to Sept. 30 If index exceeds 100 basis point deadband from starting index value, authorized ROE changes by half the difference Starting index value based on trailing 12 months of Moody’s Baa index as of September 30, 2012 – 5.00% 7.63% 6.05% 5.75% 5.00% Prior Starting Index = 6.26% Sep-15 Proposed Moody’s Baa Utility Index Spot Rate Moving Average (10/1/2012 – 3/31/2013 = 4.60%) 100 basis point +/- Deadband Current Starting Index = 5.00%

Exhibit 99.2 EDISON INTERNATIONAL® Leading the Way in Electricity SM April 30, 2013 9 2013 Core and Basic Earnings Guidance Note: See Use of Non-GAAP Financial Measures in Appendix 2013 EPS from Rate Base Forecast: • Average rate base $21.8 billion – 80/20% CPUC/FERC • Approved capital structure – 48% equity, 10.45% CPUC ROE, 11.1% FERC ROE • 325.8 million common shares outstanding (no change) Other Assumptions: • SCE positive variances from rate base forecast include: income tax repair deduction, O&M cost savings/other, energy efficiency earnings • EME results not consolidated • No changes in tax policy • O&M cost savings flow through to ratepayers in 2015 GRC • No SONGS disallowances or warranty recoveries • No non-core items except $0.06/ share reported in Q1 2013 Earnings Guidance as of 2/26/13 2013 Earnings Guidance as of 4/30/13 Low Mid High Low Mid High SCE $3.70 $3.70 EIX Parent & Other (0.15) (0.15) EIX Core EPS $3.45 $3.55 $3.65 $3.45 $3.55 $3.65 Non-core Items - 0.06 EIX Basic EPS $3.45 $3.55 $3.65 $3.51 $3.61 $3.71

Exhibit 99.2 EDISON INTERNATIONAL® Leading the Way in Electricity SM April 30, 2013 10 Creating Shareholder Value Resolve Uncertainties Create Sustainable Earnings and Dividend Growth Position for Transformative Sector Change • EME bankruptcy filing • SCE 2012 GRC • SCE 2013 cost of capital • 5-year rate base CAGR of 11% (2007 – 2012) • 15% Core EPS growth (2007 – 2012) • 9 consecutive dividend increases • Leadership and development • Advanced technologies • New business development / strategic planning • Resolve SONGS uncertainty • Execute wires-focused investment program: Infrastructure investments Meet 33% renewables mandate by 2020 • Finalize FERC rate case • Optimize cost structure through operational excellence • Growth through investments • Balance dividend increases with SCE capex needs • Return to target dividend range over time • Legislative and regulatory advocacy • Listen to customer needs • Evaluate new power sector business opportunities Note: See Non-GAAP Reconciliations and Use of Non-GAAP Financial Measures in Appendix. W ha t W e’v e D on e W ha t R em ain s
Exhibit 99.2 EDISON INTERNATIONAL® Leading the Way in Electricity SM April 30, 2013 11 Appendix

Exhibit 99.2 EDISON INTERNATIONAL® Leading the Way in Electricity SM April 30, 2013 12 What’s New Since Our Last Presentation • SONGS Tracker (p. 5) • SONGS – Supplemental Data (p. 6) • FERC Return on Equity (p. 7) • Cost of Capital Mechanism (p. 8) • 2013 Core and Basic Earnings Guidance (p. 9) • SONGS – Warranty and Insurance (p. 13) • SCE Electric Power System Assets (p. 14) • SCE Key Regulatory Events Calendar (p. 16) • SCE Customer Demand Trends (p. 17)

Exhibit 99.2 EDISON INTERNATIONAL® Leading the Way in Electricity SM April 30, 2013 13 SONGS – Warranty and Insurance MHI Warranty • 20-year warranty with Mitsubishi Heavy Industries Repair or replace defective items Specified damages for certain repairs $138 million liability limit and excludes consequential damages (e.g., replacement power) Limits subject to applicable exceptions in the contract and under law • December 2012, SCE received $45 million MHI warranty payment ($36 million SCE share), subject to audit, reservation of rights regarding documentation; SCE and MHI disagree on applicability of limitations on liability NEIL Insurance • Property damage and outage insurance through Nuclear Electric Insurance Limited (“NEIL”) Property Damage Policy – $2.5 million deductible; $2.75 billion liability limit Outage Policy – up to $3.5 million per week for each unit after 12-week deductible period ($2.8 million per unit per week if both are out due to same “accident”); $490 million limit per unit ($392 million each if both units are out due to the same “accident”) Exclusions and limitations may reduce or eliminate coverage Proof of loss must be submitted within 12 months of damage or outage • Separate proofs of loss have been filed for Unit 2 and Unit 3 under NEIL outage policy totaling $234 million ($183 million SCE share) for amounts through December 29, 2012

Exhibit 99.2 EDISON INTERNATIONAL® Leading the Way in Electricity SM April 30, 2013 14 SCE Electric Power System Assets 1 Indicates data current as of December 31, 2012. All other data current as of year-end 2011. 2 Includes street lights. Generation Transmission500kV 230kV Transmission Substation Sub - transmission 115kV 66kV Distribution Substation Distribution 16kV 12kV 4kV Customers Transmission 60 Substations 1,193 Circuits 12,218 Circuit Miles1 4,671 Circuit Breakers Distribution 810 Substations 4,587 Circuits1 103,529 Circuit Miles2 61,778 Switches1 729,714 Transformers1

Exhibit 99.2 EDISON INTERNATIONAL® Leading the Way in Electricity SM April 30, 2013 15 SCE Large Transmission Projects Project Name Total Project Costs In Service Date FERC Incentives 2013 – 2014 Forecast Status Tehachapi 1-11 $2,500 2015 125 bpsROE adder $455 • Cost estimates for potential Chino Hills undergrounding filed Q1 2013 • Proposed Decision on undergrounding expected Q3 2013 Devers- Colorado River $860 Q3 2013 100 bps ROE adder $337 • Revised cost forecast submitted to CPUC Q4 2012 Eldorado- Ivanpah $385 Q3 2013 N/A $227 • Expected in service date Q3 2013 Transmission expenditures are needed to maintain system reliability and increase access to renewable energy Note :Total Project Costs are as of December 31, 2012, and are nominal direct expenditures, subject to CPUC and FERC cost recovery approval ($ millions)
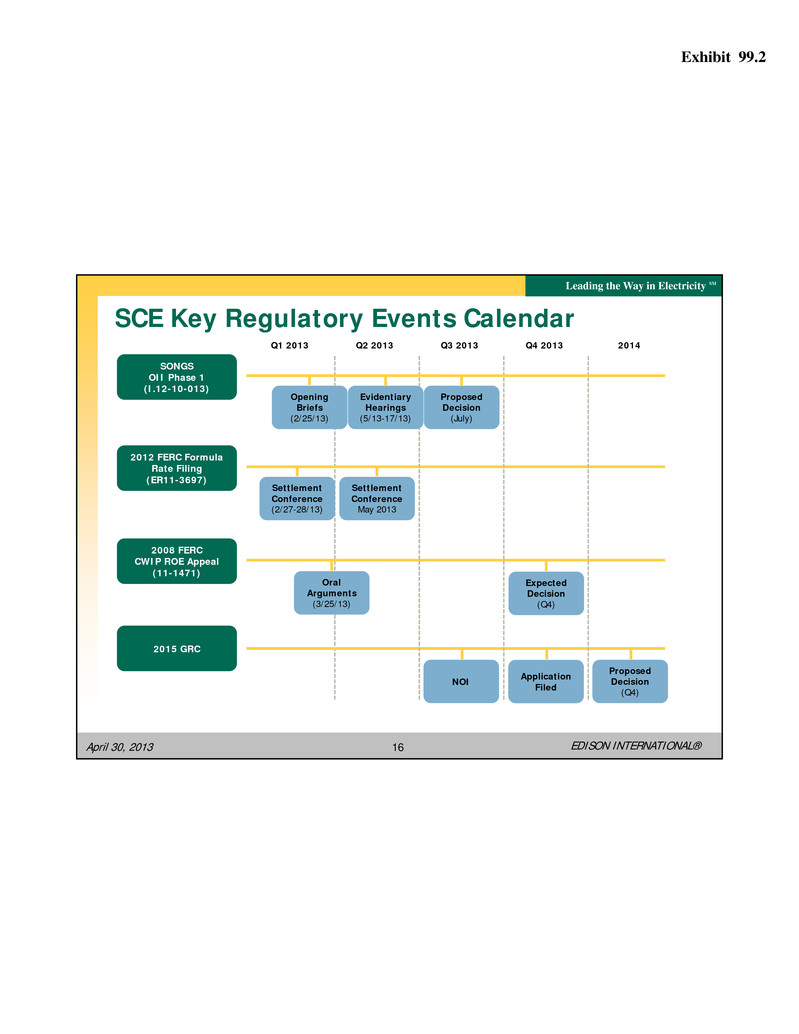
Exhibit 99.2 EDISON INTERNATIONAL® Leading the Way in Electricity SM April 30, 2013 16 SCE Key Regulatory Events Calendar 2008 FERC CWIP ROE Appeal (11-1471) 2012 FERC Formula Rate Filing (ER11-3697) 2015 GRC Q1 2013 Q2 2013 Q3 2013 Q4 2013 2014 Settlement Conference (2/27-28/13) NOI Application Filed Proposed Decision (Q4) Oral Arguments (3/25/13) SONGS OII Phase 1 (I.12-10-013) Opening Briefs (2/25/13) Proposed Decision (July) Evidentiary Hearings (5/13-17/13) Settlement Conference May 2013 Expected Decision (Q4)
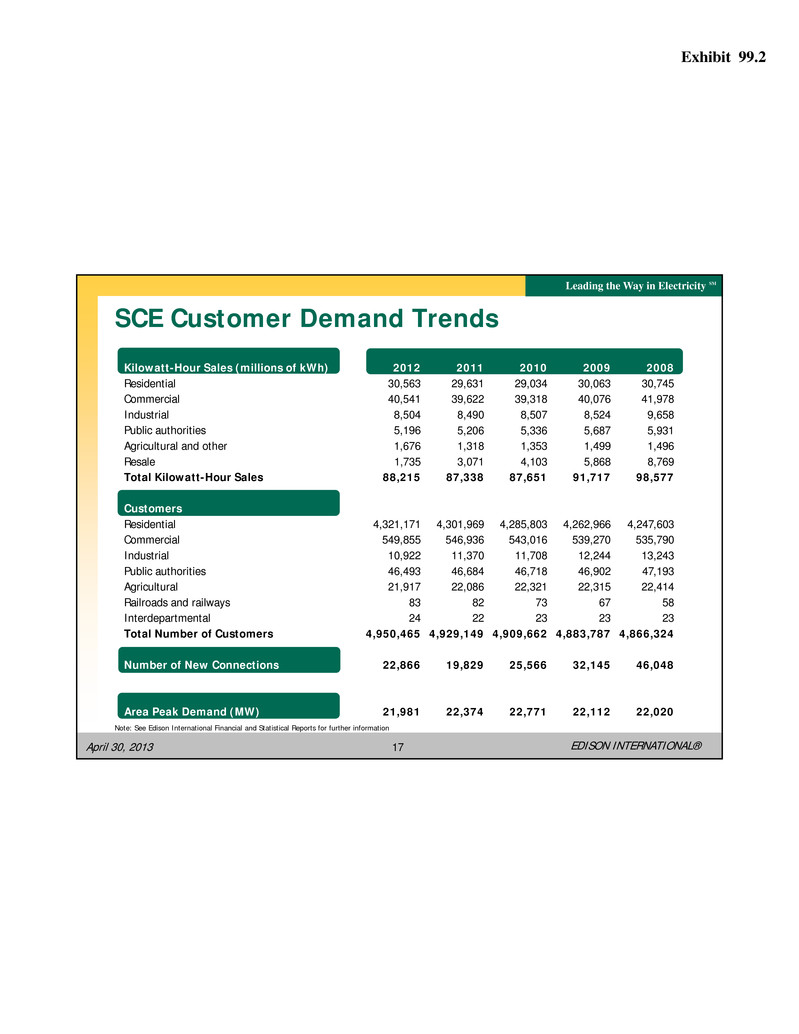
Exhibit 99.2 EDISON INTERNATIONAL® Leading the Way in Electricity SM April 30, 2013 17 Kilowatt-Hour Sales (millions of kWh) Residential Commercial Industrial Public authorities Agricultural and other Resale Total Kilowatt-Hour Sales Customers Residential Commercial Industrial Public authorities Agricultural Railroads and railways Interdepartmental Total Number of Customers Number of New Connections Area Peak Demand (MW) SCE Customer Demand Trends Note: See Edison International Financial and Statistical Reports for further information 2012 30,563 40,541 8,504 5,196 1,676 1,735 88,215 4,321,171 549,855 10,922 46,493 21,917 83 24 4,950,465 22,866 21,981 2011 29,631 39,622 8,490 5,206 1,318 3,071 87,338 4,301,969 546,936 11,370 46,684 22,086 82 22 4,929,149 19,829 22,374 2010 29,034 39,318 8,507 5,336 1,353 4,103 87,651 4,285,803 543,016 11,708 46,718 22,321 73 23 4,909,662 25,566 22,771 2009 30,063 40,076 8,524 5,687 1,499 5,868 91,717 4,262,966 539,270 12,244 46,902 22,315 67 23 4,883,787 32,145 22,112 2008 30,745 41,978 9,658 5,931 1,496 8,769 98,577 4,247,603 535,790 13,243 47,193 22,414 58 23 4,866,324 46,048 22,020
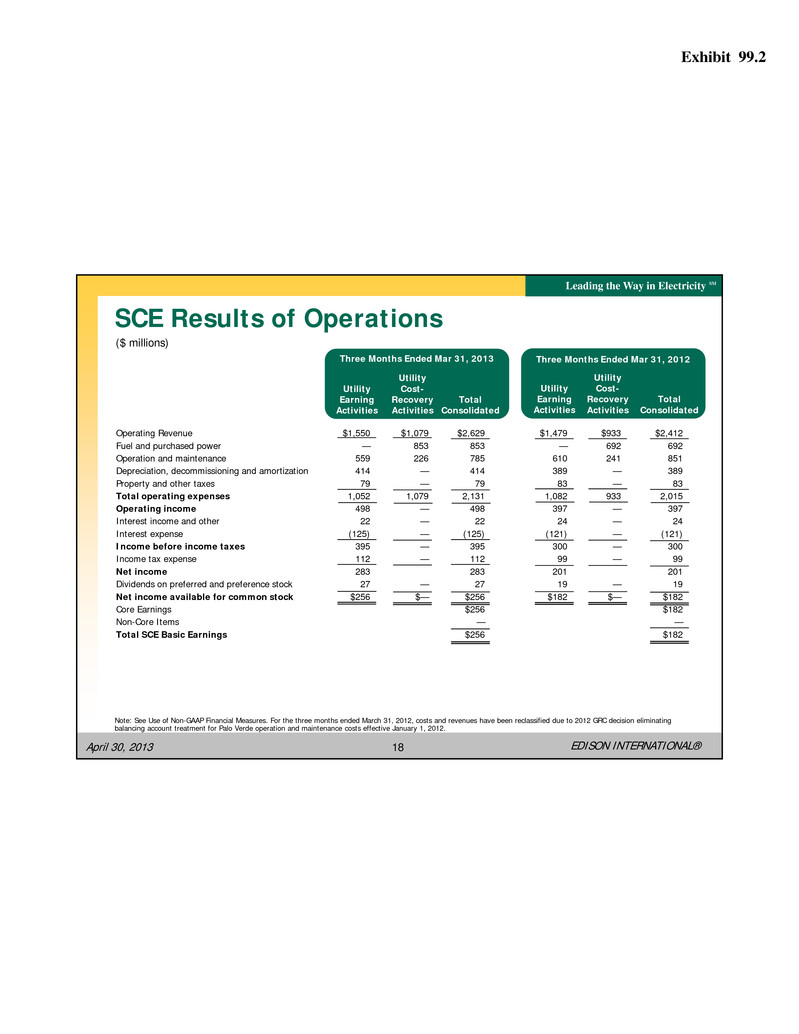
Exhibit 99.2 EDISON INTERNATIONAL® Leading the Way in Electricity SM April 30, 2013 18 $1,550 — 559 414 79 1,052 498 22 (125) 395 112 283 27 $256 $1,079 853 226 — — 1,079 — — — — — — $— $1,479 — 610 389 83 1,082 397 24 (121) 300 99 201 19 $182 $933 692 241 — — 933 — — — — — — $— $2,412 692 851 389 83 2,015 397 24 (121) 300 99 201 19 $182 $182 — $182 SCE Results of Operations ($ millions) Note: See Use of Non-GAAP Financial Measures. For the three months ended March 31, 2012, costs and revenues have been reclassified due to 2012 GRC decision eliminating balancing account treatment for Palo Verde operation and maintenance costs effective January 1, 2012. Utility Earning Activities Utility Cost- Recovery Activities Total Consolidated Three Months Ended Mar 31, 2012 Utility Earning Activities Utility Cost- Recovery Activities Total Consolidated Three Months Ended Mar 31, 2013 Operating Revenue Fuel and purchased power Operation and maintenance Depreciation, decommissioning and amortization Property and other taxes Total operating expenses Operating income Interest income and other Interest expense Income before income taxes Income tax expense Net income Dividends on preferred and preference stock Net income available for common stock Core Earnings Non-Core Items Total SCE Basic Earnings $2,629 853 785 414 79 2,131 498 22 (125) 395 112 283 27 $256 $256 — $256
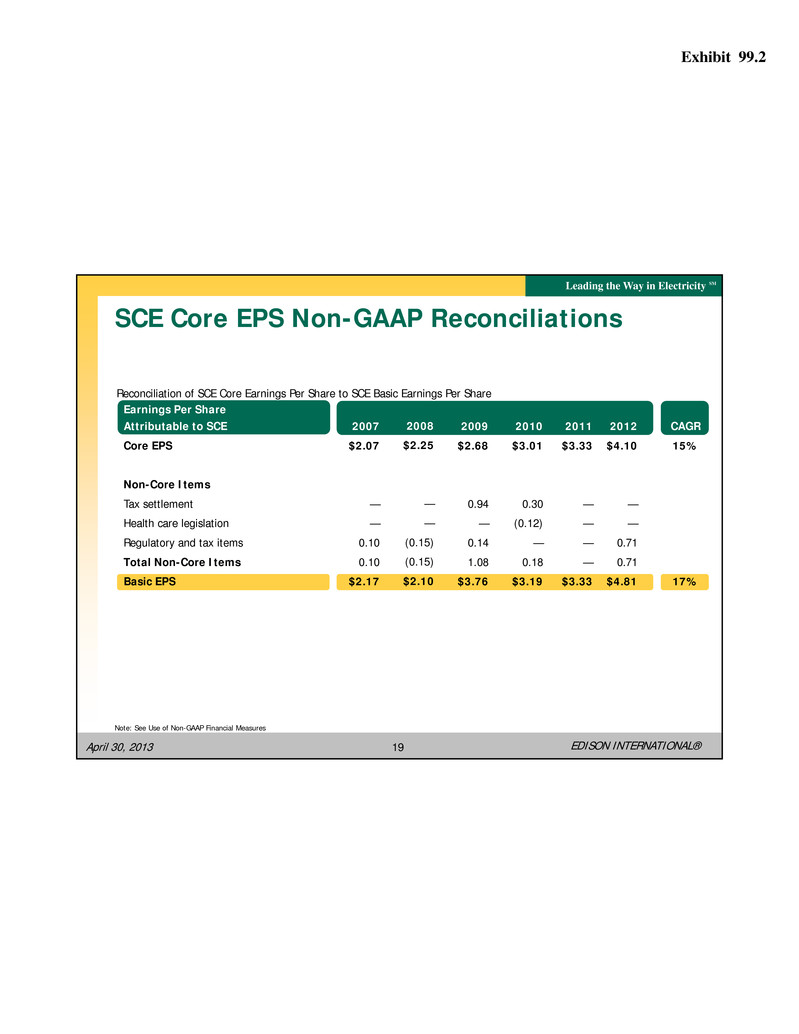
Exhibit 99.2 EDISON INTERNATIONAL® Leading the Way in Electricity SM April 30, 2013 19 Earnings Per Share Attributable to SCE Core EPS Non-Core Items Tax settlement Health care legislation Regulatory and tax items Total Non-Core Items Basic EPS SCE Core EPS Non-GAAP Reconciliations Note: See Use of Non-GAAP Financial Measures Reconciliation of SCE Core Earnings Per Share to SCE Basic Earnings Per Share 2007 $2.07 — — 0.10 0.10 $2.17 2008 $2.25 — — (0.15) (0.15) $2.10 2009 $2.68 0.94 — 0.14 1.08 $3.76 2010 $3.01 0.30 (0.12) — 0.18 $3.19 CAGR 15% 17% 2011 $3.33 — — — — $3.33 2012 $4.10 — — 0.71 0.71 $4.81

Exhibit 99.2 EDISON INTERNATIONAL® Leading the Way in Electricity SM April 30, 2013 20 $1.16 $1.22 $1.24 $1.26 $1.28 $1.30 $1.35 $2.07 $2.25 $2.68 $3.01 $3.33 $4.10 $0.00 $1.00 $2.00 $3.00 $4.00 $5.00 2007 2008 2009 2010 2011 2012 2013 SCE Core EPS EIX Dividend Paid EIX Dividend Rate EIX Dividend Growth EIX increased its dividend for the 9th consecutive year to an annual rate of $1.35 per share for 2013 • EIX targets paying out 45 – 55% of SCE earnings • Dividend not growing at same rate as SCE core earnings and is below target payout ratio due to large utility capital program • EIX plans to return to target dividend range over time as SCE capital spending program declines from its 2013 peak SCE Core EPS EIX Dividend 15% 2% 2007 – 2012 CAGR (38%) (42%) (46%) (54%) (56%) Note: See Use of Non-GAAP Financial Measures in Appendix for reconciliation of core earnings per share to basic earnings per share (32%)

Exhibit 99.2 EDISON INTERNATIONAL® Leading the Way in Electricity SM April 30, 2013 21 Non-GAAP Reconciliations ($ millions) Note: See Use of Non-GAAP Financial Measures. EME’s financial results are reported as non-core for all periods Q1 2012 $182 (5) $177 $– (84) (84) $93 Q1 2013 $256 (4) $252 $7 12 19 $271 Reconciliation of EIX Core Earnings to EIX GAAP Earnings Earnings Attributable to Edison International Core Earnings SCE EIX Parent & Other Core Earnings Non-Core Items EIX Parent & Other Continuing Operations Discontinued operations Total Non-Core Basic Earnings
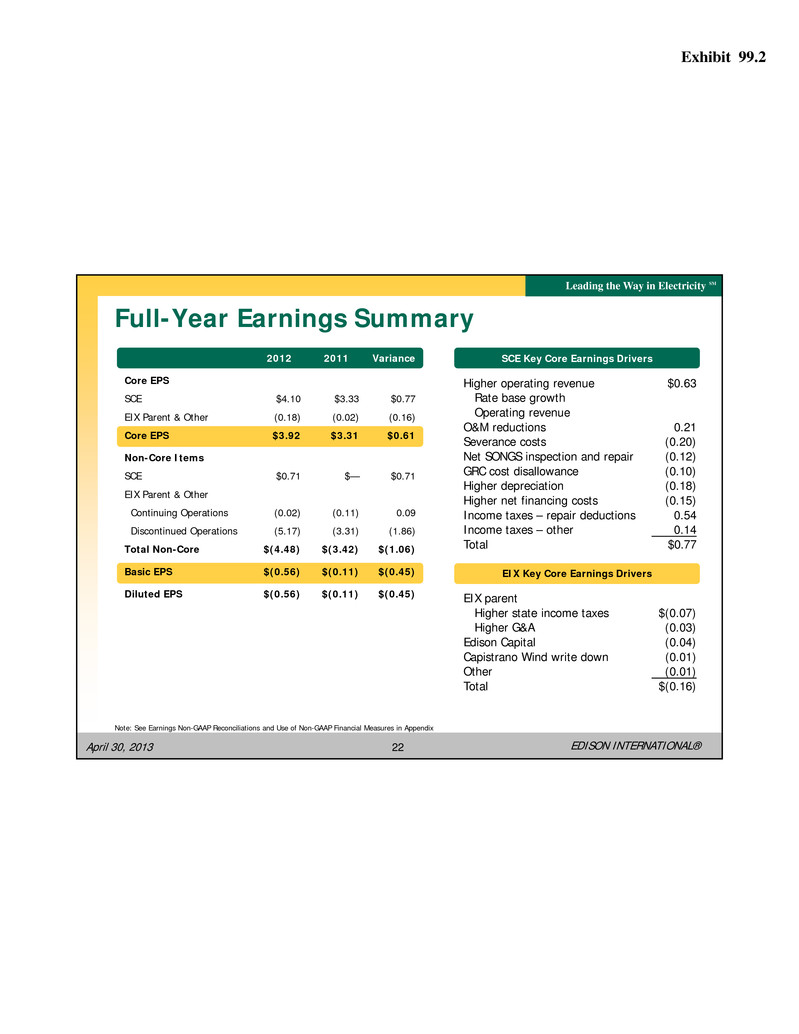
Exhibit 99.2 EDISON INTERNATIONAL® Leading the Way in Electricity SM April 30, 2013 22 Full-Year Earnings Summary Note: See Earnings Non-GAAP Reconciliations and Use of Non-GAAP Financial Measures in Appendix 2012 2011 Variance Core EPS SCE $4.10 $3.33 $0.77 EIX Parent & Other (0.18) (0.02) (0.16) Core EPS $3.92 $3.31 $0.61 Non-Core Items SCE $0.71 $— $0.71 EIX Parent & Other Continuing Operations (0.02) (0.11) 0.09 Discontinued Operations (5.17) (3.31) (1.86) Total Non-Core $(4.48) $(3.42) $(1.06) Basic EPS $(0.56) $(0.11) $(0.45) Diluted EPS $(0.56) $(0.11) $(0.45) SCE Key Core Earnings Drivers Higher operating revenue $0.63 Rate base growth Operating revenue O&M reductions 0.21 Severance costs (0.20) Net SONGS inspection and repair (0.12) GRC cost disallowance (0.10) Higher depreciation (0.18) Higher net financing costs (0.15) Income taxes – repair deductions 0.54 Income taxes – other 0.14 Total $0.77 EIX Key Core Earnings Drivers EIX parent Higher state income taxes $(0.07) Higher G&A (0.03) Edison Capital (0.04) Capistrano Wind write down (0.01) Other (0.01) Total $(0.16)

Exhibit 99.2 EDISON INTERNATIONAL® Leading the Way in Electricity SM April 30, 2013 23 Quarterly Earnings Per Share Highlights Q1 Q2 Q3 Q4 2011 SCE $0.68 $0.65 $1.25 $0.76 $3.33 EIX – Parent and Other (0.03) (0.02) (0.01) 0.03 (0.02) Core EPS $0.65 $0.63 $1.24 $0.79 $3.31 Non-core items 0.02 0.01 (0.03) (0.11) (0.11) EIX Parent and Other – Discontinued Operations (0.06) (0.10) 0.10 (3.25) (3.31) Basic EPS $0.61 $0.54 $1.31 $(2.57) $(0.11) Note: See Earnings Non-GAAP Reconciliations and Use of Non-GAAP Financial Measures in Appendix Q1 Q2 Q3 Q4 2012 SCE $0.56 $0.59 $1.11 $1.85 $4.10 EIX – Parent and Other (0.03) (0.02) (0.07) (0.06) (0.18) Core EPS $0.53 $0.57 $1.04 $1.79 $3.92 Non-core items 0.01 — 0.05 0.63 0.69 EIX Parent and Other – Discontinued Operations (0.26) (0.34) (0.51) (4.07) (5.17) Basic EPS $0.28 $0.23 $0.58 $(1.65) $(0.56) 2011 2012
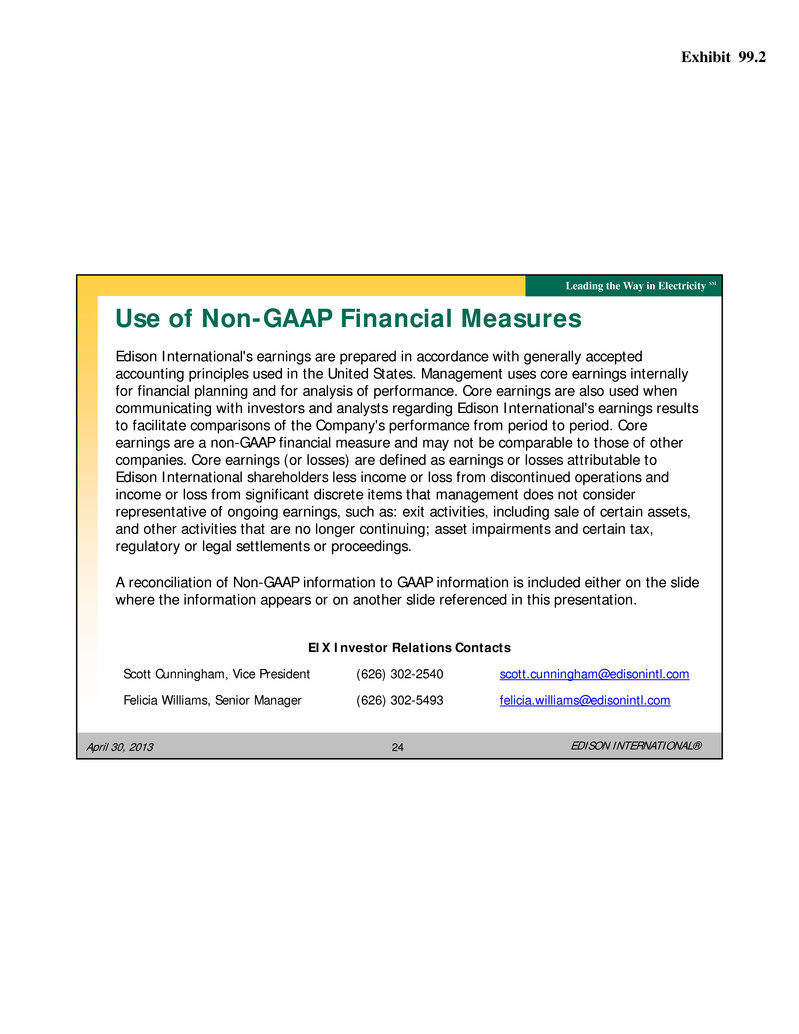
Exhibit 99.2 EDISON INTERNATIONAL® Leading the Way in Electricity SM April 30, 2013 24 Edison International's earnings are prepared in accordance with generally accepted accounting principles used in the United States. Management uses core earnings internally for financial planning and for analysis of performance. Core earnings are also used when communicating with investors and analysts regarding Edison International's earnings results to facilitate comparisons of the Company's performance from period to period. Core earnings are a non-GAAP financial measure and may not be comparable to those of other companies. Core earnings (or losses) are defined as earnings or losses attributable to Edison International shareholders less income or loss from discontinued operations and income or loss from significant discrete items that management does not consider representative of ongoing earnings, such as: exit activities, including sale of certain assets, and other activities that are no longer continuing; asset impairments and certain tax, regulatory or legal settlements or proceedings. A reconciliation of Non-GAAP information to GAAP information is included either on the slide where the information appears or on another slide referenced in this presentation. Use of Non-GAAP Financial Measures EIX Investor Relations Contacts Scott Cunningham, Vice President (626) 302-2540 scott.cunningham@edisonintl.com Felicia Williams, Senior Manager (626) 302-5493 felicia.williams@edisonintl.com


