
Exhibit 99.2 EDISON INTERNATIONAL® Leading the Way in Electricity SM February 25, 2014 0 Fourth Quarter and 2013 Financial Results

Exhibit 99.2 EDISON INTERNATIONAL® Leading the Way in Electricity SM February 25, 2014 1 Statements contained in this presentation about future performance, including, without limitation, operating results, asset and rate base growth, capital expenditures, San Onofre Nuclear Generating Station (SONGS), EME bankruptcy, and other statements that are not purely historical, are forward- looking statements. These forward-looking statements reflect our current expectations; however, such statements involve risks and uncertainties. Actual results could differ materially from current expectations. These forward-looking statements represent our expectations only as of the date of this presentation, and Edison International assumes no duty to update them to reflect new information, events or circumstances. Important factors that could cause different results are discussed under the headings “Risk Factors” and “Management’s Discussion and Analysis” in Edison International’s Form 10-K and other reports filed with the Securities and Exchange Commission, which are available on our website: www.edisoninvestor.com. These filings also provide additional information on historical and other factual data contained in this presentation. Forward-Looking Statements

Exhibit 99.2 EDISON INTERNATIONAL® Leading the Way in Electricity SM February 25, 2014 2 Fourth Quarter Earnings Summary Q4 2013 Q4 2012 Variance Core EPS1 SCE $0.79 $1.85 $(1.06) EIX Parent & Other 0.02 (0.06) 0.08 Core EPS1 $0.81 $1.79 $(0.98) Non-Core Items SCE $— $0.71 $(0.71) EIX Parent & Other — (0.08) 0.08 Discontinued Operations 0.11 (4.07) 4.18 Total Non-Core $0.11 $(3.44) $3.55 Basic EPS $0.92 $(1.65) $2.57 Diluted EPS $0.92 $(1.64) $2.56 1 See Earnings Non-GAAP Reconciliations and Use of Non-GAAP Financial Measures in Appendix 2 Includes $0.35 lower revenue, $0.10 lower O&M, $0.06 lower depreciation, and $0.01 lower AFUDC SCE Key Core Earnings Drivers Lower revenue $(0.42) SONGS impact2 (0.20) Lower O&M 0.15 Higher depreciation (0.10) Higher net financing costs (0.02) Income taxes (0.47) Total $(1.06) EIX Key Core Earnings Drivers Higher Edison Capital earnings $0.06 Lower costs 0.02 Total $0.08
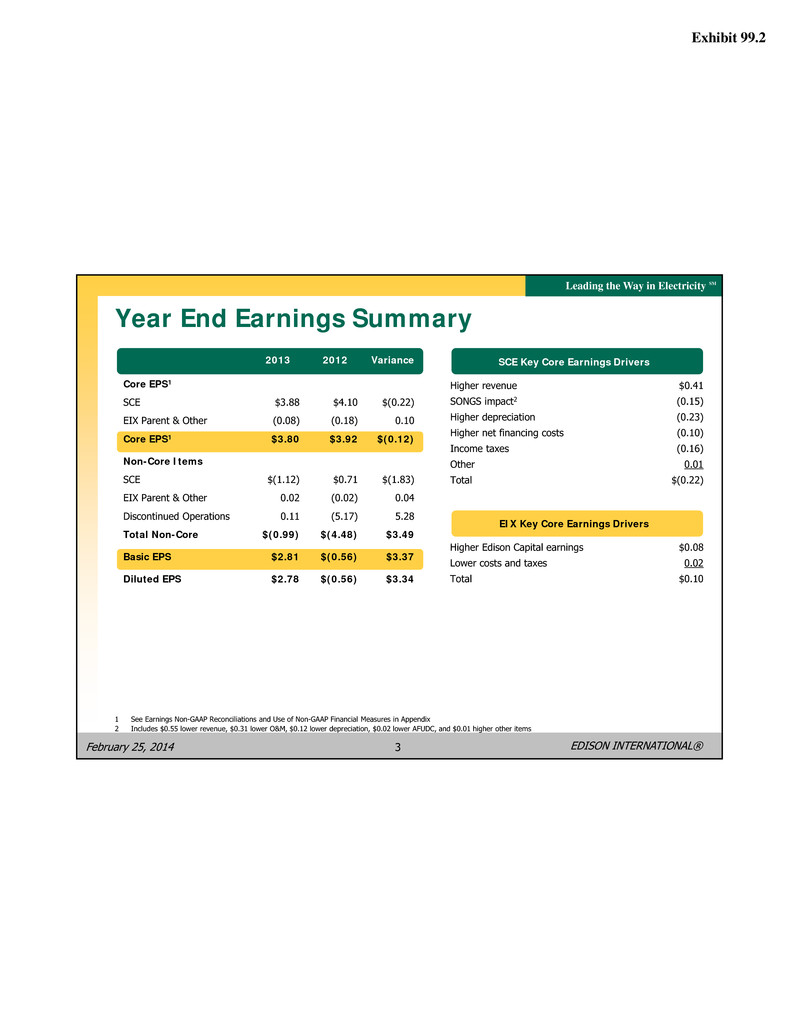
Exhibit 99.2 EDISON INTERNATIONAL® Leading the Way in Electricity SM February 25, 2014 3 Year End Earnings Summary 2013 2012 Variance Core EPS1 SCE $3.88 $4.10 $(0.22) EIX Parent & Other (0.08) (0.18) 0.10 Core EPS1 $3.80 $3.92 $(0.12) Non-Core Items SCE $(1.12) $0.71 $(1.83) EIX Parent & Other 0.02 (0.02) 0.04 Discontinued Operations 0.11 (5.17) 5.28 Total Non-Core $(0.99) $(4.48) $3.49 Basic EPS $2.81 $(0.56) $3.37 Diluted EPS $2.78 $(0.56) $3.34 SCE Key Core Earnings Drivers Higher revenue $0.41 SONGS impact2 (0.15) Higher depreciation (0.23) Higher net financing costs (0.10) Income taxes (0.16) Other 0.01 Total $(0.22) 1 See Earnings Non-GAAP Reconciliations and Use of Non-GAAP Financial Measures in Appendix 2 Includes $0.55 lower revenue, $0.31 lower O&M, $0.12 lower depreciation, $0.02 lower AFUDC, and $0.01 higher other items EIX Key Core Earnings Drivers Higher Edison Capital earnings $0.08 Lower costs and taxes 0.02 Total $0.10
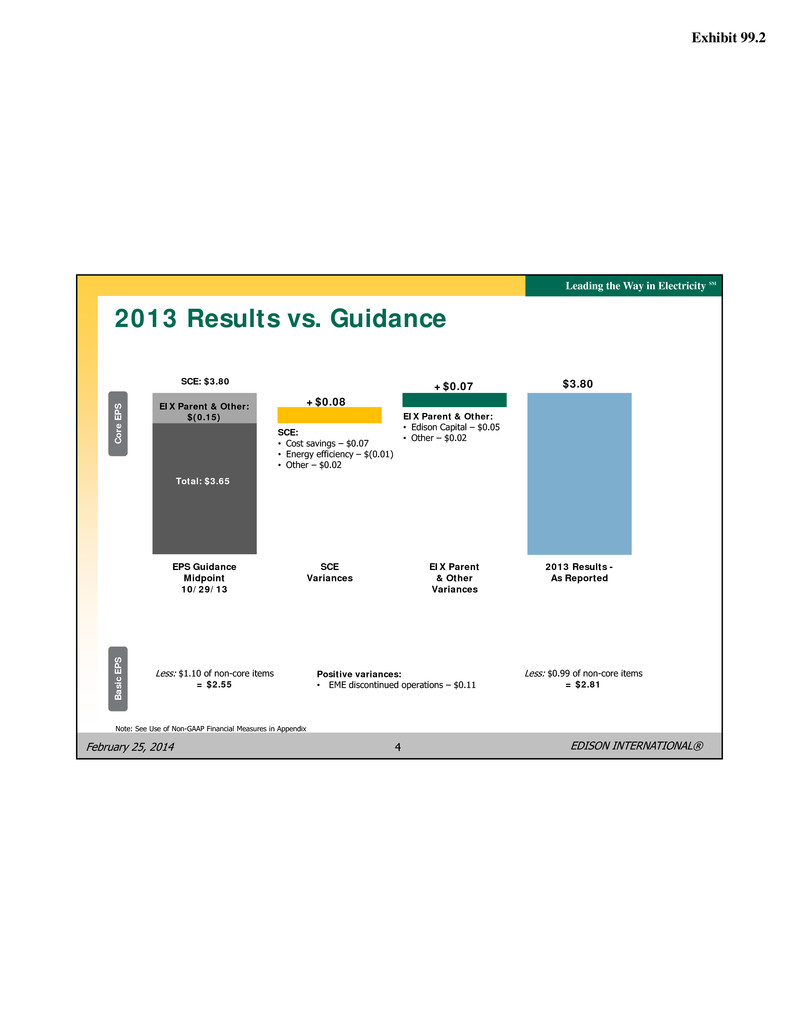
Exhibit 99.2 EDISON INTERNATIONAL® Leading the Way in Electricity SM February 25, 2014 4 2013 Results vs. Guidance Note: See Use of Non-GAAP Financial Measures in Appendix Co re EP S Ba sic EP S Less: $1.10 of non-core items = $2.55 Positive variances: • EME discontinued operations – $0.11 Less: $0.99 of non-core items = $2.81 +$0.08 +$0.07 $3.80 EPS Guidance Midpoint 10/29/13 SCE Variances EIX Parent & Other Variances 2013 Results - As Reported SCE: $3.80 EIX Parent & Other: $(0.15) Total: $3.65 SCE: • Cost savings – $0.07 • Energy efficiency – $(0.01) • Other – $0.02 EIX Parent & Other: • Edison Capital – $0.05 • Other – $0.02

Exhibit 99.2 EDISON INTERNATIONAL® Leading the Way in Electricity SM February 25, 2014 5 $13.1 $15.0 $16.8 $18.8 $21.0 $21.12 2008 2009 2010 2011 2012 2013 Rate Base2 Core Earnings 10% 12% 2008 – 2013 CAGR 1 Recorded rate base, year-end basis. See Non-GAAP Reconciliations and Use of Non-GAAP Financial Measures in Appendix 2 2013 rate base excludes San Onofre Generating Station. Core Earnings $2.25 $2.68 $3.01 $3.33 $4.10 SCE Historical Rate Base and Core Earnings ($ billions) $3.88
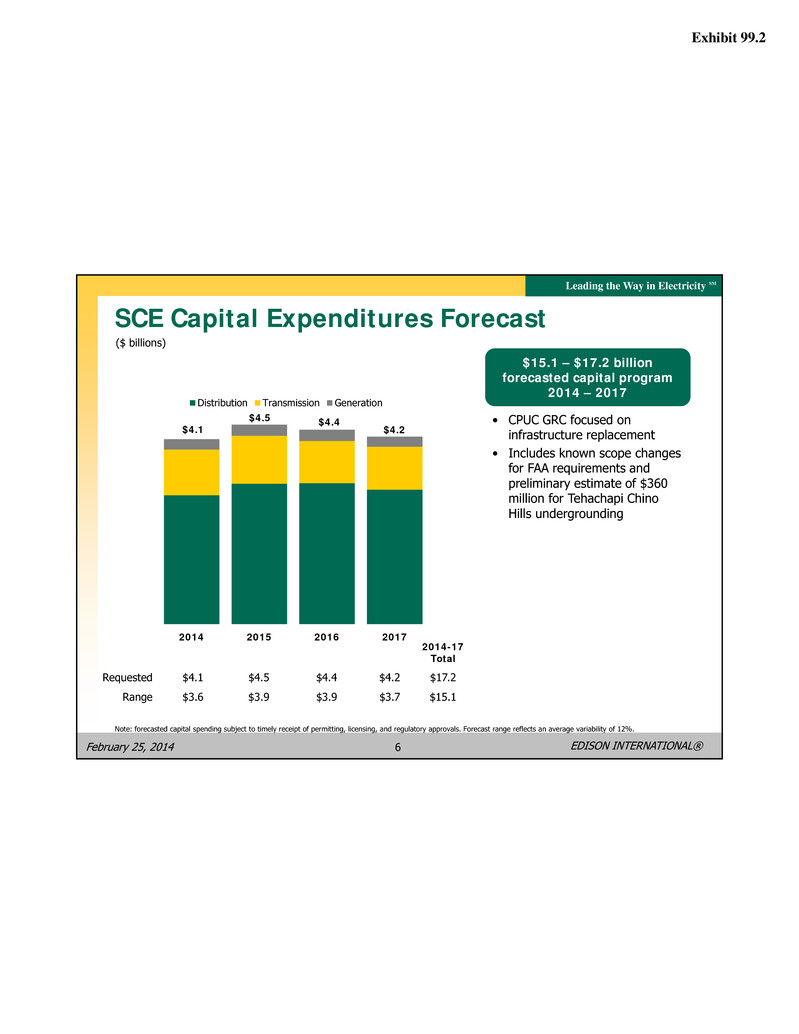
Exhibit 99.2 EDISON INTERNATIONAL® Leading the Way in Electricity SM February 25, 2014 6 Note: forecasted capital spending subject to timely receipt of permitting, licensing, and regulatory approvals. Forecast range reflects an average variability of 12%. SCE Capital Expenditures Forecast ($ billions) 2014-17 Total Requested $4.1 $4.5 $4.4 $4.2 $17.2 Range $3.6 $3.9 $3.9 $3.7 $15.1 • CPUC GRC focused on infrastructure replacement • Includes known scope changes for FAA requirements and preliminary estimate of $360 million for Tehachapi Chino Hills undergrounding $15.1 – $17.2 billion forecasted capital program 2014 – 2017 $4.1 $4.5 $4.4 $4.2 2014 2015 2016 2017 Distribution Transmission Generation

Exhibit 99.2 EDISON INTERNATIONAL® Leading the Way in Electricity SM February 25, 2014 7 ($ billions) SCE Rate Base Forecast • Driven by infrastructure replacement, reliability investments, and public policy requirements • FERC rate base includes CWIP and is approximately 22% of 2014 rate base forecast, increasing to 24% in 2017 • Excludes SONGS rate base 7 – 9% CAGR projected rate base 2014 – 2017 Requested Range $21.9 $23.4 $25.5 $27.1 $22.4 $24.4 $27.0 $29.2 2014 2015 2016 2017 Note: Weighted-average year basis, including forecasted 2014 FERC and 2015-2017 CPUC rate base requests and consolidation of CWIP projects. Rate Base forecast range reflects capital expenditure forecast range.
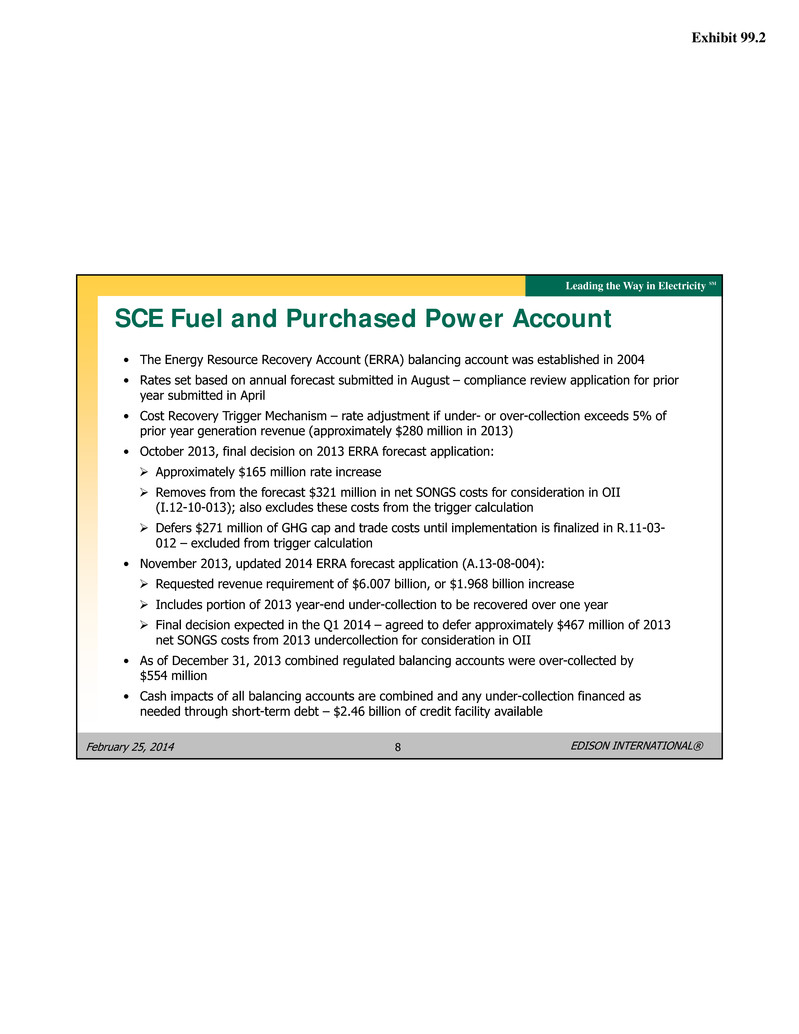
Exhibit 99.2 EDISON INTERNATIONAL® Leading the Way in Electricity SM February 25, 2014 8 SCE Fuel and Purchased Power Account • The Energy Resource Recovery Account (ERRA) balancing account was established in 2004 • Rates set based on annual forecast submitted in August – compliance review application for prior year submitted in April • Cost Recovery Trigger Mechanism – rate adjustment if under- or over-collection exceeds 5% of prior year generation revenue (approximately $280 million in 2013) • October 2013, final decision on 2013 ERRA forecast application: Approximately $165 million rate increase Removes from the forecast $321 million in net SONGS costs for consideration in OII (I.12-10-013); also excludes these costs from the trigger calculation Defers $271 million of GHG cap and trade costs until implementation is finalized in R.11-03- 012 – excluded from trigger calculation • November 2013, updated 2014 ERRA forecast application (A.13-08-004): Requested revenue requirement of $6.007 billion, or $1.968 billion increase Includes portion of 2013 year-end under-collection to be recovered over one year Final decision expected in the Q1 2014 – agreed to defer approximately $467 million of 2013 net SONGS costs from 2013 undercollection for consideration in OII • As of December 31, 2013 combined regulated balancing accounts were over-collected by $554 million • Cash impacts of all balancing accounts are combined and any under-collection financed as needed through short-term debt – $2.46 billion of credit facility available

Exhibit 99.2 EDISON INTERNATIONAL® Leading the Way in Electricity SM February 25, 2014 9 SCE 2015 CPUC General Rate Case • November 2013, 2015 GRC Application A.13-11-003 submitted to Office of Ratepayer Advocate (ORA) Prehearing conference held on February 11 Proposed schedule anticipates final decision by the end of 2014 • Request sets base revenue requirement for 2015 – 2017 Includes operating costs and CPUC jurisdictional capital Excludes fuel and purchased power (and other utility cost-recovery activities), cost of capital, and FERC jurisdictional transmission • 2015 revenue requirement request of $6.383 billion $127 million increase over presently authorized base rates Post test year requested increase of $313 million in 2016 and additional increase of $319 million in 2017 Assumes full recovery of SONGS rate base and net investment – O&M, capex tied to early retirement • Request consistent with SCE strategy to ramp up infrastructure investment consistent with capital plan while mitigating customer rate impacts through productivity and lower operating costs July 15 Notice of Intent Nov 12 GRC Application Evidentiary Hearings Opening and Reply Briefs Final Decision Proposed Decision 2013 2014 Q1 Q2 Q3 Q4 Q1 Q2 Q3 Q4 Estimated Prehearing Conference Note: Original request of $6.462 billion was reduced to remove Four Corners costs from the proposed revenue requirement due to the completion of the sale of SCE's interest

Exhibit 99.2 EDISON INTERNATIONAL® Leading the Way in Electricity SM February 25, 2014 10 $3.40 $(0.07) $0.52 $(0.15) $3.70 SCE 2014 EPS from Rate Base Forecast SONGS Shutdown SCE 2014 Positive Variances EIX Parent & Other 2014 Midpoint Guidance 2014 Core and Basic Earnings Guidance Note: See Use of Non-GAAP Financial Measures in Appendix Key Assumptions: • Midpoint rate base of $22.1 billion • Approved capital structure – 48% equity, 10.45% CPUC & FERC ROE • 325.8 million common shares outstanding (no change) • No significant transmission project delays Other Assumptions: • EME results not consolidated • No changes in tax policy • O&M cost savings flow through to ratepayers in 2015 GRC • Updates to be provided on SONGS and EME bankruptcy as they develop 2014 Earnings Guidance as of 2/25/14 Low $3.60 Mid $3.70 High $3.80 • Cost savings / other - $0.35 • Income taxes - $0.14 • Energy efficiency earnings - $0.03 • SONGS LT Debt & Pf dividends

Exhibit 99.2 EDISON INTERNATIONAL® Leading the Way in Electricity SM February 25, 2014 11 Creating Shareholder Value Resolve Uncertainties Create Sustainable Earnings and Dividend Growth Position for Transformative Sector Change • SCE 2012 GRC • SCE 2013 cost of capital • SCE 2012 FERC formula rate settlement • EME bankruptcy settlement • 10% 5-year SCE rate base CAGR (2008 – 2013) • 12% Core SCE EPS growth (2008 – 2013) • 10 consecutive years of EIX dividend increases • Acquired SoCore Energy (commercial solar) • Minority investments (energy efficiency, residential solar markets, electrification of transportation) • Execute wires-focused investment program • SCE 2015 GRC • SONGS cost recovery • Approval of EME’s Plan of Reorganization, including Settlement Agreement • 7 – 9% projected rate base growth (2014 – 2017) • Optimize cost structure through operational excellence • Return to target dividend range over time • Legislative and regulatory advocacy • Rate design reform – AB 327 implementation • Evaluate new power sector business opportunities Note: See Non-GAAP Reconciliations and Use of Non-GAAP Financial Measures in Appendix W ha t W e’v e D on e W ha t R em ain s

Exhibit 99.2 EDISON INTERNATIONAL® Leading the Way in Electricity SM February 25, 2014 12 Appendix

Exhibit 99.2 EDISON INTERNATIONAL® Leading the Way in Electricity SM February 25, 2014 13 Changes Since Our Last Presentation • Quarterly and year-end updates • SCE Capital Expenditures Forecast (p. 6) • SCE Rate Base Forecast (p. 7) • SCE Fuel and Purchased Power Account (p. 8) • SCE 2015 CPUC General Rate Case (p. 9) • 2014 Core and Basic Earnings Guidance (p. 10) – new slide • EIX Dividend Growth (p. 14) • EME Bankruptcy Settlement Summary (p. 15) – new slide • EME Bankruptcy Settlement Implications (p. 16) – new slide • EIX – Positioned for Industry Change (p. 17) – new slide • SONGS Regulatory – CPUC OII Phases (p. 20) • SONGS Third-Party Recovery – MHI (p. 22) • CPUC and FERC Cost of Capital (p. 26) • SCE Large Transmission Projects (p. 27) • SCE 2013 Bundled Revenue Requirement (p. 31) – new slide • Energy Storage (p. 46) – new slide

Exhibit 99.2 EDISON INTERNATIONAL® Leading the Way in Electricity SM February 25, 2014 14 $1.22 $1.24 $1.26 $1.28 $1.30 $1.35 $1.42 $2.25 $2.68 $3.01 $3.33 $4.10 $3.88 $3.85 $0.00 $1.00 $2.00 $3.00 $4.00 $5.00 2008 2009 2010 2011 2012 2013 2014 SCE Core EPS EIX Dividend Paid (37%) EIX Dividend Growth In December, EIX increased its dividend for the 10th consecutive year to an annual rate of $1.42 per share for 2014 • EIX targets paying out 45 – 55% of SCE earnings • Dividend growth rate slowed to help fund large utility capital program, which is plateauing • EIX plans to return to target dividend range over time SCE Core EPS EIX Dividend 12% 2% 2008 – 2013 CAGR (32%) (38%) (42%) (46%) (54%) Note: See Use of Non-GAAP Financial Measures in Appendix for reconciliation of core earnings per share to basic earnings per share (35%) Guidance Midpoint

Exhibit 99.2 EDISON INTERNATIONAL® Leading the Way in Electricity SM February 25, 2014 15 EME Bankruptcy Settlement Summary • On February 18, settlement reached among EIX, EME, and certain of EME’s creditors holding a majority of its outstanding senior unsecured notes • Settlement will extinguish all existing claims between EME and EIX • Allows EME to emerge from bankruptcy free of liabilities, but it will remain owned by EIX and will continue to be consolidated for tax purposes • A Reorganization Trust, controlled by EME’s existing creditors, to be formed to hold all assets and liabilities of EME not discharged in bankruptcy or transferred to NRG • EIX will pay the Reorganization Trust 50% of EME’s estimated Federal and California income tax benefits – three scheduled payments including interest • Current estimate of EME tax benefits is approximately $1.2 billion • EIX will assume certain EME income tax and pension related liabilities – approximately $350 million EIX currently has joint and several responsibility for substantially all of these liabilities • It is anticipated that the Settlement will be cash flow and earnings positive (recorded as non-core) • EME Plan of Reorganization, which will now include the Settlement Agreement, will be considered for US Bankruptcy Court approval on March 11

Exhibit 99.2 EDISON INTERNATIONAL® Leading the Way in Electricity SM February 25, 2014 16 EME Bankruptcy Settlement Implications Cash Impact • Based on current estimates: EIX expects net benefits of approximately $200 million over time EIX expects to utilize approximately $1.2 billion of EME tax benefits EIX would make $634 million in total payments through 2016 (including interest): o $225 million upon closing o $199 million on September 30, 2015 o $210 million on September 30, 2016 • Deferred payment amounts to be finalized after closing based on updated estimates Accounting Treatment • Accounting impact will be non-core Approximately $70 million of net benefits have been recorded as non-core income through 2013 Based on current estimates, balance of net benefits of up to $130 million will be recorded as non-core income in first quarter of 2014 Resolves Uncertainties • Assuming approval, settlement would resolve one of EIX’s outstanding uncertainties

Exhibit 99.2 EDISON INTERNATIONAL® Leading the Way in Electricity SM February 25, 2014 17 EIX – Positioned for Industry Change EIX will respond and adapt to industry trends by advancing flexible use of the grid and investing in new business opportunities while continuing to provide safe, reliable, affordable electric service Long-Term Industry Trends • Public policy prioritizing environmental sustainability • Technology and financing innovations facilitating conservation and self- generation • Regulation supporting new forms of competition • Flattening domestic demand for electricity EIX Strategy • Invest in, build, and operate the next generation electric grid • Pursue growth opportunities consistent with core business • Operational and service excellence Responding to change

Exhibit 99.2 EDISON INTERNATIONAL® Leading the Way in Electricity SM February 25, 2014 18 SONGS – Supplemental Data 1 Includes direct operations and maintenance costs, depreciation, taxes, and return on investment 2 In 2005 the CPUC authorized expenditures of approximately $525 million ($665 million based on SCE's estimate after adjustment for inflation using the Handy-Whitman Index) for SCE's 78.21% share of SONGS. Subject to CPUC reasonableness review 3 SCE submitted an Advice Letter to the CPUC on November 18, 2013, requesting interim access to the decommissioning trust retroactive to June 2013 to cover decommissioning costs, including severance 4 Net of accumulated depreciation ($ millions) (SCE Share as of December 31, 2013) Since 1/1/2012 Revenue Requirement Collected1 $1,248 Steam Generator Replacement (SGRP) – Approved2 $665 SGRP Total – Incurred $602 Incremental Inspection & Repair Costs $115 Shut Down Costs3 $39 Physical (Total) SCE Ownership 78.21% Capacity (MW) 2,150 2011 Generation (million kWh) 18,097 (As of May 31, 2013) Unit 2 Unit 3 Common Plant Total Rate Base Net Plant in Service4 $606 $430 $259 $1,295 Materials and Supplies — — 100 100 Accumulated Deferred Income Taxes (119) (74) (46) (238) Total Rate Base $487 $356 $313 $1,156 Add: Acc. Deferred Income Taxes 119 74 46 238 Add: Construction Work in Progress 25 99 106 230 Add: Nuclear Fuel 153 216 102 471 Total Net Investment $784 $745 $567 $2,096
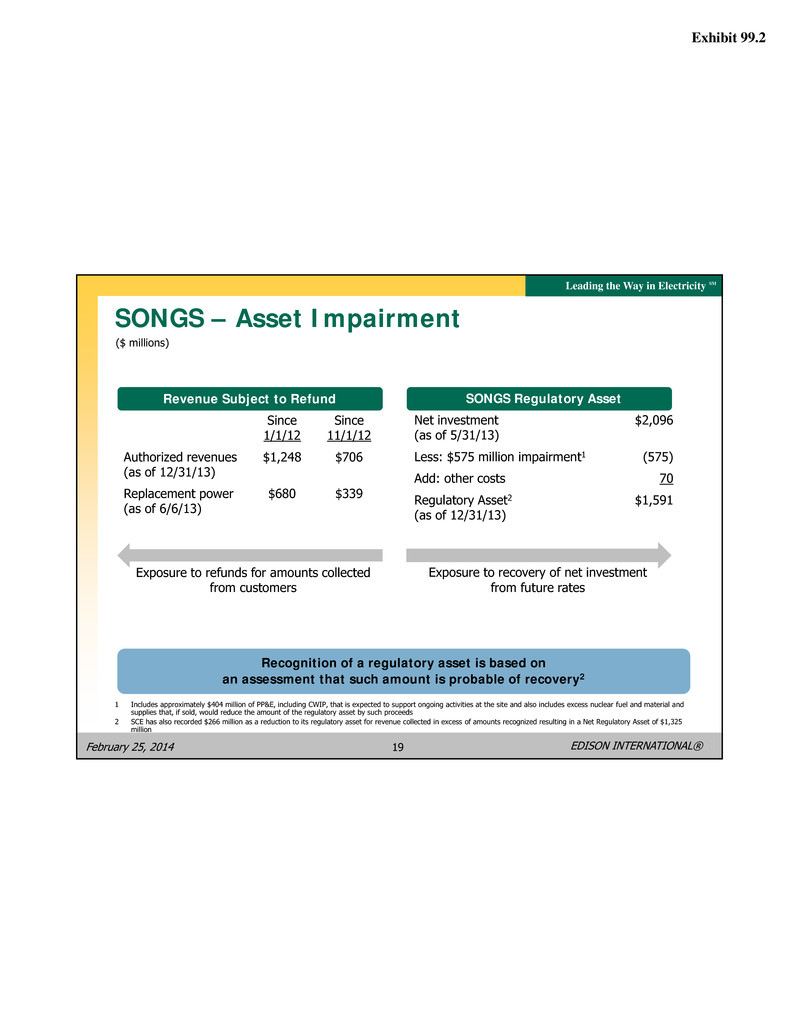
Exhibit 99.2 EDISON INTERNATIONAL® Leading the Way in Electricity SM February 25, 2014 19 SONGS – Asset Impairment Exposure to refunds for amounts collected from customers Exposure to recovery of net investment from future rates Revenue Subject to Refund Since 1/1/12 Since 11/1/12 Authorized revenues (as of 12/31/13) $1,248 $706 Replacement power (as of 6/6/13) $680 $339 SONGS Regulatory Asset Net investment (as of 5/31/13) $2,096 Less: $575 million impairment1 (575) Add: other costs 70 Regulatory Asset2 (as of 12/31/13) $1,591 1 Includes approximately $404 million of PP&E, including CWIP, that is expected to support ongoing activities at the site and also includes excess nuclear fuel and material and supplies that, if sold, would reduce the amount of the regulatory asset by such proceeds 2 SCE has also recorded $266 million as a reduction to its regulatory asset for revenue collected in excess of amounts recognized resulting in a Net Regulatory Asset of $1,325 million Recognition of a regulatory asset is based on an assessment that such amount is probable of recovery2 ($ millions)

Exhibit 99.2 EDISON INTERNATIONAL® Leading the Way in Electricity SM February 25, 2014 20 SONGS Regulatory – CPUC OII Phases Next Steps Phase 1 – Determine whether expenses and capital expenditures recorded for 2012 were reasonable; establish methodology to determine market-related costs attributable to the SONGS outages (reasonableness in Phase 3) Final decision pending Phase 2 – Potential asset adjustments to rate base and interim ratemaking Proposed decision pending Phase 3 – Reasonableness of steam generator replacement project costs; causes of the steam generator damage and allocation of responsibility Scoping Memo and schedule expected Q1 2014 Phase 4 – Potential adjustments to 2013 revenue requirement TBD • October 2012, CPUC issued Order Instituting Investigation for SONGS outages (I.12-10-013) Consolidates all SONGS proceedings to determine appropriate cost recovery – steam generator project, market power, capital expenditures, operations and maintenance, seismic studies All SONGS costs since January 1, 2012, tracked in memorandum account (SONGSMA); revenue since January 1, 2012, subject to refund • November 2013, Phase 1 proposed decision issued with comments submitted and all party meeting in January 2014. Final decision expected in Q1 2014.

Exhibit 99.2 EDISON INTERNATIONAL® Leading the Way in Electricity SM February 25, 2014 21 SONGS – Recovery Examples Docket# Owner & Project Return of Investment Partial Return on Investment D.92-08-036 SCE – SONGS 1 generating plant D.12-10-051 SCE – GRC Legacy Meters D.11-05-018 PG&E – GRC Legacy Meters D.11-09-017 Golden State Water – Hill Street Treatment Facility D.83-08-031 Pacific Bell – Telecommunications equipment D.92-12-057 PG&E – Geysers 15 generating plant D.85-08-046 PG&E – Humboldt Bay 3 generating plant D.12-10-051 SCE – GRC Mohave generating plant D.85-12-108 SDG&E – Generating plants Precedents are subject to interpretation and considerable uncertainty regarding their applicability, and may not be binding on a future commission. No decisions have been rendered in the OII proceeding regarding recovery of costs from future rates or refunds of revenues collected from customers.

Exhibit 99.2 EDISON INTERNATIONAL® Leading the Way in Electricity SM February 25, 2014 22 SONGS Third-Party Recovery – MHI Warranty Warranty Summary Request for Arbitration • 20-year warranty: Repair or replace defective items Specified damages for certain repairs $138 million liability limit, excluding consequential damages (e.g. replacement power) Limits subject to applicable exceptions in the contract and under law • 7 invoices submitted totaling $149 million for repair costs through April 30, 2013 First invoice of $45 million ($36 million SCE share) paid, subject to audit, reservation of rights regarding documentation • October 2013, Request for Arbitration filed with the International Chamber of Commerce per MHI contract • Claims for damages consistent with July 2013 Notice of Dispute that was unsuccessfully resolved with MHI • Exceptions to damage limitations are argued to apply: Direct Damages – $138 million warranty cap does not apply due to, among other things, gross negligence Consequential Damages – contract waiver does not apply due to, among other things, “failure of essential purpose” • MHI responded in December 2013 countering SCE’s claims and asserting $41 million in counterclaims SCE’s position is that the steam generator tube leak and resulting damages represent a total and fundamental failure of performance by MHI

Exhibit 99.2 EDISON INTERNATIONAL® Leading the Way in Electricity SM February 25, 2014 23 SONGS Third-Party Recovery – NEIL Insurance • Accidental property damage and accidental outage insurance through Nuclear Electric Insurance Limited (“NEIL”) Accidental Property Damage Policies – $2.5 million deductible; $2.75 billion liability limit Accidental Outage Policy – weekly indemnity up to $3.5 million per unit after 12-week deductible period ($2.8 million per unit per week if both are out due to same “accident”); $490 million limit per unit ($392 million each if both units are out due to the same “accident”) Exclusions and limitations may reduce or eliminate coverage Proof of loss must be submitted within 12 months of damage or outage • Accidental outage policy benefits are reduced to: 80% of weekly indemnity after 52 weeks; and 10% of weekly indemnity after early retirement announcement • Separate proofs of loss have been filed for Unit 2 and Unit 3 under NEIL accidental outage policy totaling $397 million ($311 million SCE share) for amounts through August 31, 2013 SCE is continuing to make weekly indemnity claims post-shutdown decision at 10% value per the terms of the policy SCE has not submitted a proof of loss under the accidental property damage policies – SCE has received an extension to file such a claim to June 30, 2014 • SCE expects NEIL to make a coverage determination by the end of Q2 2014
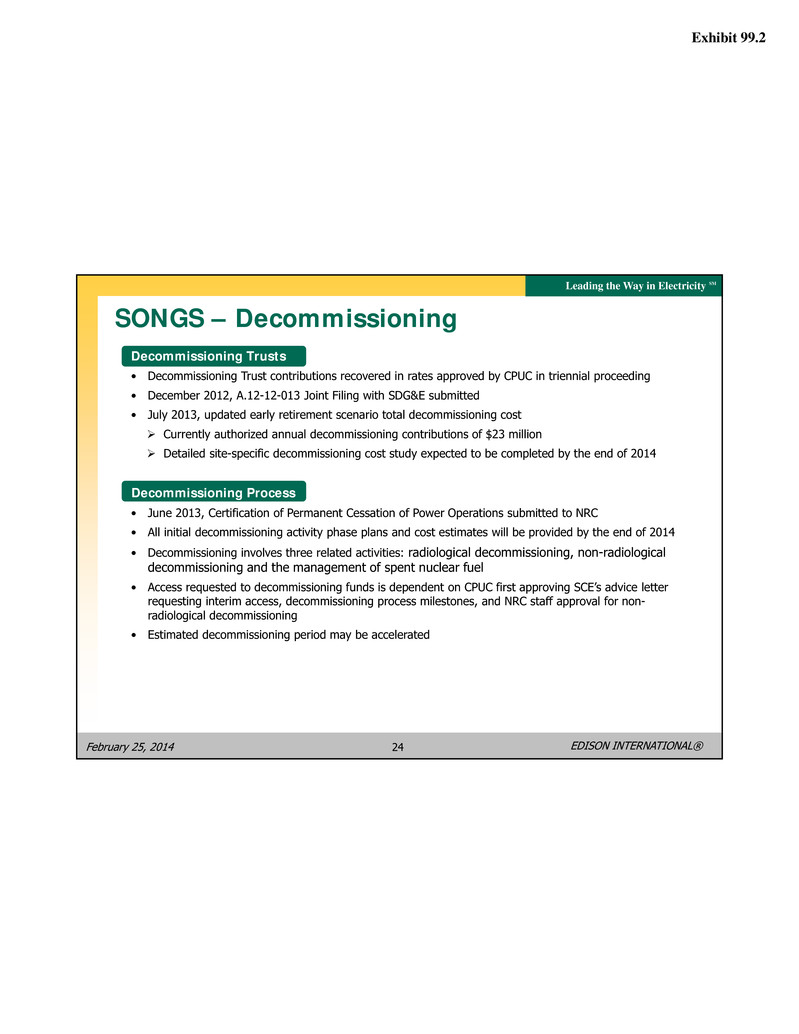
Exhibit 99.2 EDISON INTERNATIONAL® Leading the Way in Electricity SM February 25, 2014 24 SONGS – Decommissioning Decommissioning Trusts • Decommissioning Trust contributions recovered in rates approved by CPUC in triennial proceeding • December 2012, A.12-12-013 Joint Filing with SDG&E submitted • July 2013, updated early retirement scenario total decommissioning cost Currently authorized annual decommissioning contributions of $23 million Detailed site-specific decommissioning cost study expected to be completed by the end of 2014 Decommissioning Process • June 2013, Certification of Permanent Cessation of Power Operations submitted to NRC • All initial decommissioning activity phase plans and cost estimates will be provided by the end of 2014 • Decommissioning involves three related activities: radiological decommissioning, non-radiological decommissioning and the management of spent nuclear fuel • Access requested to decommissioning funds is dependent on CPUC first approving SCE’s advice letter requesting interim access, decommissioning process milestones, and NRC staff approval for non- radiological decommissioning • Estimated decommissioning period may be accelerated

Exhibit 99.2 EDISON INTERNATIONAL® Leading the Way in Electricity SM February 25, 2014 25 SONGS – NRC Notice of Nonconformance • Nuclear Regulatory Commission (NRC) issued Inspection Report and Notice of Nonconformance to MHI for its flawed computer modeling in the design of San Onofre’s steam generators – key findings presented in September 20, 2013 NRC letter to SCE and in the final NRC Inspection Report. Excerpt: “The Mitsubishi FIT-III thermal-hydraulic computer model (FIT-III) output gap velocities were not appropriately modified for triangular pitch designed steam generators. There were opportunities to identify this error during the design of the replacement steam generators. Mitsubishi was the vendor selected by Southern California Edison to design and manufacture the replacement steam generators. On numerous occasions during the design process, Southern California Edison personnel questioned the results from and appropriateness of using FIT-III, but ultimately accepted the design as proposed by Mitsubishi. Mitsubishi hired consultants with expertise in designing large steam generators, but did not rigorously evaluate all concerns raised by the consultants about use of FIT- III and specific results obtained from that thermal-hydraulic model. As a result, replacement steam generators were installed at San Onofre with a significant design deficiency, resulting in rapid tube wear of a type never before seen in recirculating steam generators.” Note: The full NRC Inspection Report and other documents related to the design of the SONGS steam generators are available at www.songscommunity.com

Exhibit 99.2 EDISON INTERNATIONAL® Leading the Way in Electricity SM February 25, 2014 26 3 4 5 6 7 10/1/12 10/1/13 10/1/14 10/1/15 Ra te (% ) CPUC and FERC Cost of Capital • CPUC – 10.45% Return on Equity (ROE) and adjustment mechanism approved through 2015 ROE adjustment based on 12-month average of Moody’s Baa utility bond rates, measured from Oct. 1 to Sept. 30 If index exceeds 100 bps deadband from starting index value, authorized ROE changes by half the difference Starting index value based on trailing 12 months of Moody’s Baa index as of September 30, 2012 – 5.00% Moving average at 9/30/2013 did not trigger ROE change for 2014 SCE will submit new application in April 2015 for Cost of Capital in 2016 • FERC – November 2013 settlement 10.45% ROE comprised of: 9.30% base + 50 bps CAISO participation + 65 bps weighted average for project incentives Moratorium on ROE changes through June 30, 2015 FERC Formula recovery mechanism in effect through 2017 CPUC Adjustment Mechanism Moody’s Baa Utility Index Spot Rate Moving Average (10/1/13 – 1/31/14) = 5.19% 100 basis point +/- Deadband Starting Value – 5.00%

Exhibit 99.2 EDISON INTERNATIONAL® Leading the Way in Electricity SM February 25, 2014 27 Project Name Total Project Costs1 In Service Date ROE Incentives2 2014–2017 Forecast Status Tehachapi $3,174 2016 – 2017 125 bpsROE adder $966 Costs and schedule remain uncertain. Cost estimate includes known scope changes for FAA requirements. Final engineering and contracts for Chino Hills underground may change future estimate. Coolwater-Lugo $813 2018 N/A $531 Filed CPCN application in Q3 2013 West of Devers $1,034 2019 – 2020 N/A $609 Filed CPCN application in Q4 2013 ($ millions) 1 Total Project Costs are nominal direct expenditures, subject to CPUC and FERC cost recovery approval 2 These projects have been granted CWIP in rate base and 100% abandoned plant FERC incentives SCE Large Transmission Projects
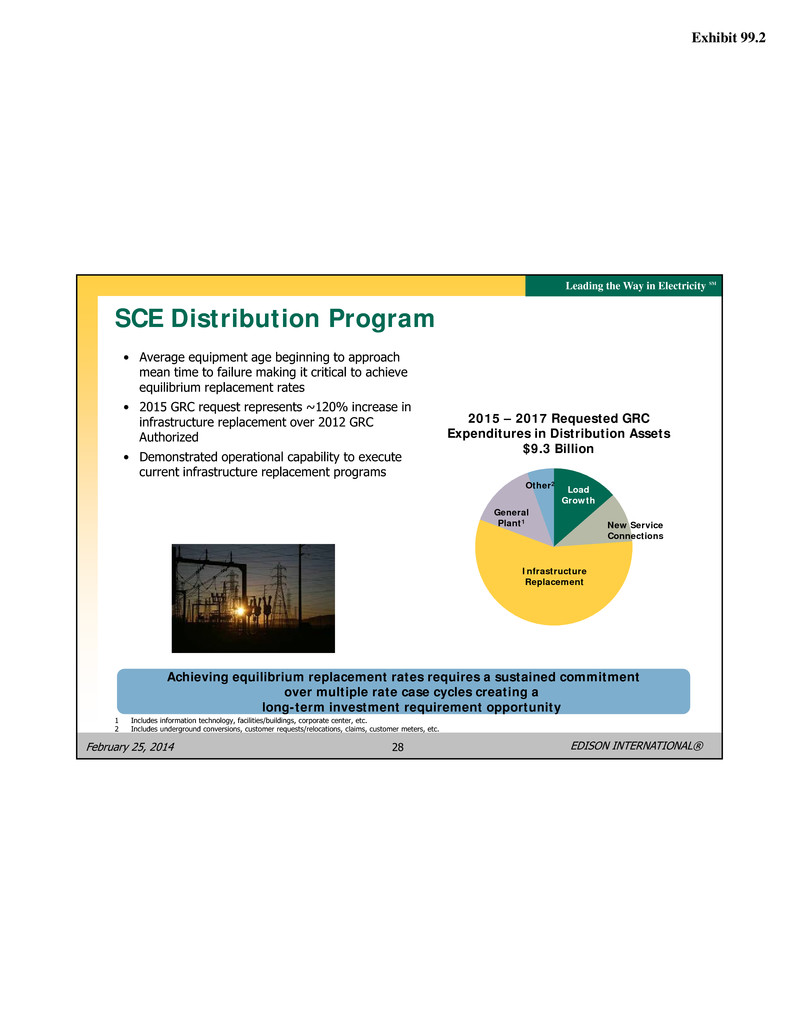
Exhibit 99.2 EDISON INTERNATIONAL® Leading the Way in Electricity SM February 25, 2014 28 SCE Distribution Program • Average equipment age beginning to approach mean time to failure making it critical to achieve equilibrium replacement rates • 2015 GRC request represents ~120% increase in infrastructure replacement over 2012 GRC Authorized • Demonstrated operational capability to execute current infrastructure replacement programs 2015 – 2017 Requested GRC Expenditures in Distribution Assets $9.3 Billion 1 Includes information technology, facilities/buildings, corporate center, etc. 2 Includes underground conversions, customer requests/relocations, claims, customer meters, etc. Load Growth New Service Connections Infrastructure Replacement General Plant1 Other2 Achieving equilibrium replacement rates requires a sustained commitment over multiple rate case cycles creating a long-term investment requirement opportunity

Exhibit 99.2 EDISON INTERNATIONAL® Leading the Way in Electricity SM February 25, 2014 29 • One of the nation’s largest electric utilities Nearly 14 million residents in service territory Approximately 5 million customer accounts 50,000 square-mile service area • Significant infrastructure investments: 1.4 million power poles 700,000 transformers 103,000 miles of distribution and transmission lines • 7 – 9% projected average annual rate base growth 2014 – 2017 driven by: System reliability and infrastructure replacement California Renewables Portfolio Standard Technology improvements SCE Highlights

Exhibit 99.2 EDISON INTERNATIONAL® Leading the Way in Electricity SM February 25, 2014 30 SCE Decoupled Regulatory Model Decoupling of Regulated Revenues from Sales Major Balancing Accounts • Fuel • Purchased power • Energy efficiency • Pension-related contributions Advanced Long-Term Procurement Planning • SCE earnings are not affected by changes in retail electricity sales • Differences between amounts collected and authorized levels are either billed or refunded to customers • Promotes energy conservation • Stabilizes revenues during economic cycles • Trigger mechanism for fuel and purchased power adjustments at 5% variance level • Utility cost-recovery via balancing accounts represented over 50% of 2013 costs • Sets prudent upfront standards allowing greater certainty of cost recovery (subject to reasonableness review) Regulatory Model Elements Key Benefits

Exhibit 99.2 EDISON INTERNATIONAL® Leading the Way in Electricity SM February 25, 2014 31 SCE 2013 Bundled Revenue Requirement 2013 Bundled Revenue Requirement $millions ¢/kWh Fuel & Purchased Power – includes CDWR Bond Charge 4,285 5.8 Distribution – poles, wires, substations, service centers; Edison SmartConnect® 3,820 5.2 Generation – utility owned generation investment and O&M 2,012 2.7 Transmission – greater than 220kV 713 1.0 Other – CPUC and legislative public purpose programs, system reliability investments, nuclear decommissioning 539 0.7 Total Bundled Revenue Requirement ($millions) $11,369 Bundled kWh (millions) 73,536 = Bundled Systemwide Average Rate (¢/kWh) 15.5¢ Approximately 60% of SCE’s revenue requirement consists of utility earnings activities: generation, distribution, and transmission Fuel & Purchased Power (38%) Distribution (34%) Generation (18%) Transmission (6%)Other (5%) Note: Rates in effect as of October 1, 2013, based on forecast. Represents bundled service which excludes Direct Access customers that do not receive generation services.

Exhibit 99.2 EDISON INTERNATIONAL® Leading the Way in Electricity SM February 25, 2014 32 Kilowatt-Hour Sales (millions of kWh) Residential Commercial Industrial Public authorities Agricultural and other Resale Total Kilowatt-Hour Sales Customers Residential Commercial Industrial Public authorities Agricultural Railroads and railways Interdepartmental Total Number of Customers Number of New Connections Area Peak Demand (MW) SCE Customer Demand Trends Note: See Edison International Financial and Statistical Reports for further information 2012 30,563 40,541 8,504 5,196 1,676 1,735 88,215 4,321,171 549,855 10,922 46,493 21,917 83 24 4,950,465 22,866 21,981 2011 29,631 39,622 8,490 5,206 1,318 3,071 87,338 4,301,969 546,936 11,370 46,684 22,086 82 22 4,929,149 19,829 22,374 2010 29,034 39,318 8,507 5,336 1,353 4,103 87,651 4,285,803 543,016 11,708 46,718 22,321 73 23 4,909,662 25,566 22,771 2009 30,078 40,076 8,522 5,686 1,499 5,869 91,730 4,262,966 539,270 12,244 46,902 22,315 67 23 4,883,787 32,145 22,112 2013 30,007 40,808 8,505 5,031 1,893 1,496 87,740 4,344,429 554,592 10,584 46,323 21,679 99 23 4,977,729 N/A 22,534

Exhibit 99.2 EDISON INTERNATIONAL® Leading the Way in Electricity SM February 25, 2014 33 $2.4 $2.9 $3.8 $3.9 $3.9 $3.5 2008 2009 2010 2011 2012 2013 SCE Historical Capital Expenditures ($ billions) Note: 2013 distribution reliability spend up $300 million, offset by completion of SmartConnect in 2012 ($300 million); lower FERC ($300 million) and lower SONGS ($100 million)

Exhibit 99.2 EDISON INTERNATIONAL® Leading the Way in Electricity SM February 25, 2014 34 Coastal Power Plants Local Reliability Areas (generalized) California Transmission System (partial, generalized) CA Once Through Cooling Policy – Legend • Short-term SONGS closure solutions Transmission – 220 kV Barre-Ellis reconfiguration Voltage support – Huntington Beach 3 and 4 synchronous condensers Substations – Santiago, Viejo, Johanna capacitor bank upgrades Generation – El Segundo repower (550 MW), Sentinel (728 MW), Walnut Creek (480 MW) Conservation – EE, demand response, Flex Alerts • Long-term issues Once-through cooling – approximately 6,000 MW affected in SCE territory Air quality and emissions – limitations on permits, cap and trade market Distributed generation and renewables – integration, flexibility and net load SCE System Reliability

Exhibit 99.2 EDISON INTERNATIONAL® Leading the Way in Electricity SM February 25, 2014 35 Distributed Generation • Distributed generation (DG) will be a key part of the future generation mix due to: Rapidly declining cost of solar photovoltaic panels Challenges to building new generation and transmission facilities Public policy support Rate Design Investment EIX is focused on properly integrating DG into the grid through rate design and NEM reform, and making investments in emerging technologies • AB 327 • CPUC Order Instituting Ratemaking • Monthly fixed charge • Net energy metering (NEM) tariff structure • Small, targeted investments SoCore Energy (acquisition) – commercial / industrial DG developer Optimum Energy (investment) – energy optimization Clean Power Finance (investment) – solar industry financial services and software provider

Exhibit 99.2 EDISON INTERNATIONAL® Leading the Way in Electricity SM February 25, 2014 36 Solar PV Cost Trends $4.00 $5.00 $6.00 $7.00 $8.00 $9.00 $10.00 $11.00 $12.00 1998 2000 2002 2004 2006 2008 2010 2012 Me dia n V alu e p er W at t ( 20 12 $ ) ≤ 10 kW 10-100 kW > 100 kW Over the past decade, real installed solar system prices have fallen by nearly 50% Note: Dollar values are in real 2012 dollars before state/local incentives. Median installed prices are shown only if 15 or more observations are available for the individual size range. Source: Lawrence Berkeley National Laboratory, “Tracking the Sun VI: An Historical Summary of the Installed Price of Photovoltaics in the United States from 1998 to 2012,” Figure 7

Exhibit 99.2 EDISON INTERNATIONAL® Leading the Way in Electricity SM February 25, 2014 37 All Generation Cost Trends, Unsubsidized $0.149 $0.109 $0.065 $0.061 $0.086 $0.089 $0.045 $0.123 $0.067 $0.108 $0.144 $0.086 $0.000 $0.050 $0.100 $0.150 $0.200 $0.250 Solar PV (Distributed) Fuel Cell Coal Gas (CCGT) Nuclear Solar PV (Utility Scale) Wind (Utility Scale) Lazard 2012 Levelized Cost of Energy (range) EIA 2012 Levelized Cost of Energy $0.087 $0.122 $0.095 $0.204 $0.206 $0.145 $0.104$/ kW h Distributed Generation Central Station / Utility Scale Generation Sources: Lazard Levelized Cost of Energy Version 7.0 August 2013; EIA Levelized Cost of Energy Analysis 2013 The levelized cost of energy for distributed generation resources continues to move toward equilibrium with other generation sources

Exhibit 99.2 EDISON INTERNATIONAL® Leading the Way in Electricity SM February 25, 2014 38 Legislative Rate Reform – AB 327 September 2013, Assembly Bill 327 (Perea) provides the following changes to rate structure (subject to further CPUC rulemaking) • Rate Reform Removes tier restrictions on residential rates Allows fixed charge up to $10/month ($5 for low income) in 2015 and CPI indexing in 2016 Establishes 30 – 35% discounts for low income customers Delays residential time-of-use pricing from 2013 to 2018 • Renewables and Net Energy Metering (NEM) Allows CPUC to require IOUs to procure more than 33% RPS within existing program rules Codifies full retail NEM cap for current program – 2,240 MW for SCE Requires NEM tariff program in 2017 without a program cap but that considers impacts to all customers and the grid Requires grandfathering period for existing NEM customers 12.8¢ 16.0¢ 26.8¢ 30.8¢ 0 5 10 15 20 25 30 35 0 200 400 600 800 1,000 1,200 1,400 ¢/ kW h kWh/month Tier 1 Tier 2 Tier 3 Tier 4 2013 SCE Residential Rate Structure1,2,3 1 Tier structure based on rates as of October 1, 2013 2 Based on a daily baseline of 342 kWh/month, which is a customer weighted average of baseline allocations of each region SCE serves. Tier 4 does not have a kWh limit. 3 Tier 1 and 2 rates are subject to rate caps established in 2001, as modified by SB695 in 2009 Estimated 2013 % customer usage per tier: Tier 1 – 54% Tier 2 – 11% Tier 3 – 16% Tier 4 – 19%
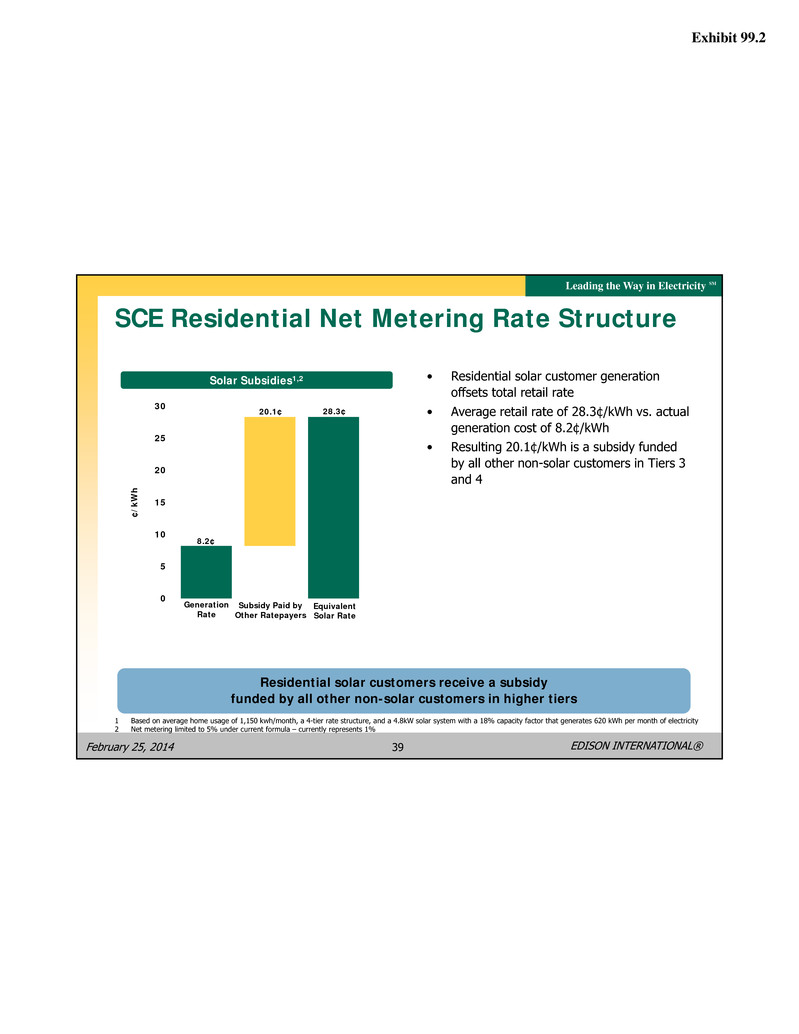
Exhibit 99.2 EDISON INTERNATIONAL® Leading the Way in Electricity SM February 25, 2014 39 SCE Residential Net Metering Rate Structure 8.2¢ 28.3¢20.1¢ 0 5 10 15 20 25 30 ¢/ kW h Solar Subsidies1,2 Generation Rate Subsidy Paid by Other Ratepayers Equivalent Solar Rate 1 Based on average home usage of 1,150 kwh/month, a 4-tier rate structure, and a 4.8kW solar system with a 18% capacity factor that generates 620 kWh per month of electricity 2 Net metering limited to 5% under current formula – currently represents 1% Residential solar customers receive a subsidy funded by all other non-solar customers in higher tiers • Residential solar customer generation offsets total retail rate • Average retail rate of 28.3¢/kWh vs. actual generation cost of 8.2¢/kWh • Resulting 20.1¢/kWh is a subsidy funded by all other non-solar customers in Tiers 3 and 4

Exhibit 99.2 EDISON INTERNATIONAL® Leading the Way in Electricity SM February 25, 2014 40 12.4 16.5 US Average SCE 33% Higher SCE Rates and Bills Comparison • SCE’s residential rates are above national average due, in part, to a cleaner fuel mix – cost for renewables are higher than high carbon sources • Average monthly residential bills are lower than national average – higher rate levels offset by lower usage 45% lower SCE residential customer usage than national average, from mild climate and higher energy efficiency building standards • Public policy mandates (33% RPS, AB32 GHG, Once-through Cooling) and electric system requirements will drive rates and bills higher Source: EIA's Form 826 Data Monthly Electric Utility Sales and Revenue Data for the Data 12 Months Ending April 2013 2013 Average Residential Rates (¢/kWh) 2013 Average Residential Bills ($ per Month) Key Factors ¢ ¢ SCE’s average residential rates are above national average, but residential bills are below national average due to lower energy usage $122 $88 US Average SCE 28% Lower

Exhibit 99.2 EDISON INTERNATIONAL® Leading the Way in Electricity SM February 25, 2014 41 California Climate Change Policy • Assembly Bill 32 (2006) – reduces State greenhouse gas (GHG) emissions to 1990 levels by 2020 (~16% reduction) • Cap and trade program basics: State-wide cap in 2013 – decreases over time Compliance met through allowances, offsets, or emissions reductions Excess allowances sold, or “banked” for future use January 2014 – merger with Quebec cap and trade program • SCE received 32.3 million 2013 allowances vs. 10.4 million metric tons 2012 GHG emissions • Allowances sold into quarterly auction and bought back for compliance SB 1018 (2012) – auction revenues used for rate relief for residential (~93%), small business, and large industrial customers AB32 Emissions Reduction Programs Cap & Trade 22% Other 23% Low Carbon Fuel Standard 19% RPS 14% Energy Efficiency 15% High GWP Gases 7% Quarterly Auction Results (Current Vintage) 11/2012 2/2013 5/2013 8/2013 $10.09/ton $13.62/ton $14.00/ton $12.22/ton 11/2013 $11.48

Exhibit 99.2 EDISON INTERNATIONAL® Leading the Way in Electricity SM February 25, 2014 42 California Renewables Policy • On April 12, 2011, Governor Brown signed SB X 1 2, which codifies a 33% Renewables Portfolio Standard (RPS) for California by 2020 Allows use of Renewable Energy Credits (RECs) for up to 25% of target with decreasing percentages over time Applies similar RPS rules to all electricity providers (investor- and publicly-owned utilities, as well as Electric Service Providers) • In order to meet the 33% RPS requirement by 2020, SCE will increase its renewable purchases by 10 billion kWh, or 67% While SCE is on target to meet the 33% renewables mandate by 2020, the requirement will put upward pressure on customer rates Solar 6% Small Hydro 4% Geothermal 43% Biomass 6% Wind 41% Actual 2012 Renewable Resources: 20% of SCE’s portfolio

Exhibit 99.2 EDISON INTERNATIONAL® Leading the Way in Electricity SM February 25, 2014 43 2012 SCE Energy Portfolio1 1 CEC Power Source Disclosure Program 2 Accounts for non-technology specific energy procured from market More than half of SCE’s energy portfolio consists of low-carbon resources including renewables, hydro, and natural gas Market Source Coal Natural Gas Nuclear Large Hydro Wind Solar Small Hydro Geothermal Biomass & Waste 30.8 5.4 15.8 5.3 3.1 6.2 1.0 0.6 6.5 0.9 21% 1% 1% 9% 1% Renewables 20% Carbon Neutral 31% 8% 4% 7% 2 Low Carbon 52% 41% 7% 75.6 (Billion kWh – Retail Sales)

Exhibit 99.2 EDISON INTERNATIONAL® Leading the Way in Electricity SM February 25, 2014 44 CAISO Net Load Renewables • Current 33% RPS by 2020 set as floor for CPUC per AB327 • More variable and less predictable output • Output does not fully match demand • Need for flexible, dispatchable capacity Resource Adequacy • 1-year forward • 10-year forward long-term procurement process for new resources • Need intermediate (3 – 5 years) forward capacity market with right mix of operational attributes Increasing renewable generation creates need for substantial amount of flexible, dispatchable capacity Source: CA Independent System Operator, “2013 Special Reliability Assessment”, September 18, 2013 and represents a single day in March of each year CAISO ‘Peaking’ Duck Chart 10,000 12,000 14,000 16,000 18,000 20,000 22,000 24,000 26,000 28,000 0 1 2 3 4 5 6 7 8 9 10 11 12 13 14 15 16 17 18 19 20 21 22 23 MW CAISO Net Load --- 2012 through 2020 2012 (Actual) 2013 (Actual) 2014 2015 2016 2017 2018 2019 2020 Hour Ending Net Load = Load - Wind - Solar

Exhibit 99.2 EDISON INTERNATIONAL® Leading the Way in Electricity SM February 25, 2014 45 SCE Energy Efficiency Programs 1.7 1.6 0.9 0.9 2011 2012 2013 2014 Energy efficiency programs updated for 2013 – 2014 • SCE is a national leader 2012 energy savings = 1.8% of retail sales1 • 2013 budget of $347 million2 • Target 0.9 billion kWh average annual savings for 2013-14 cycle3 – Reduced goals reflect CPUC-identified market potential for energy efficiency Energy efficiency earnings incentive mechanism modified • December 2013, $13.5 million awarded for 2011 program year – additional $5 million pending results of 2014 energy efficiency programs audit • New earnings mechanism for 2011, 2012 (payable in 2013, 2014) – 5% management fee + up to 1% performance bonus • SCE to file earnings claim for 2012 and part of 2013 program activity this year – actual payment, if any, subject to CPUC approval • CPUC approved new incentive mechanism for 2013 and 2014 activities (payable in 2014 and beyond) comprised of performance rewards and management fees 1 Does not include resale sales. Energy savings subject to ex-post CPUC review. 2 Excludes income qualified energy efficiency and integrated demand-side management program funding authorizations for 2013 3 Based on CPUC goals established for SCE. Market potential changes in response to program funding levels, customer participation assumptions, market influences and the implementation of new building codes and minimum appliance efficiency standards Annual kWh Savings (billions)

Exhibit 99.2 EDISON INTERNATIONAL® Leading the Way in Electricity SM February 25, 2014 46 Energy Storage • September 2010, AB2514 (Skinner) directs CPUC to establish procurement targets and policies for energy storage • October 2013, CPUC final decision in Energy Storage OIR (R.10-12-007) 1,325 MW target for IOUs by 2024 (580 MW SCE share) Three types: transmission (53%), distribution (32%), customer-sited (15%) Utility ownership limited to 50% of total target (290 MW SCE share) First procurement cycle in December 2014 Broad range of technologies as defined in AB2514, excluding large hydro (>50 MW) Energy Storage Procurement Guiding Principles: • Optimization of the grid, including peak reduction, contribution to reliability needs, or deferment of transmission and distribution upgrade investments • Integration of renewable energy • Reduction of GHG emissions to 80% below 1990 levels by 2050, per California’s goals SCE’s rate base investment opportunity in energy storage to be integrated into future capital expenditure requests

Exhibit 99.2 EDISON INTERNATIONAL® Leading the Way in Electricity SM February 25, 2014 47 Non-GAAP Reconciliations ($ millions) Note: See Use of Non-GAAP Financial Measures. EME’s financial results are reported as non-core for all periods Q42012 $602 (20) $582 $231 (26) (1,326) (1,121) $(539) Q42013 $258 6 $264 $– – 37 37 $301 Reconciliation of EIX Core Earnings to EIX GAAP Earnings Earnings Attributable to Edison International Core Earnings SCE EIX Parent & Other Core Earnings Non-Core Items SCE EIX Parent & Other Discontinued operations Total Non-Core Basic Earnings 2012 $1,338 (60) $1,278 $231 (6) (1,686) (1,461) $(183) 2013 $1,265 (28) $1,237 $(365) 7 36 (322) $915

Exhibit 99.2 EDISON INTERNATIONAL® Leading the Way in Electricity SM February 25, 2014 48 $6,682 — 2,518 1,562 296 32 4,408 2,274 94 (494) 1,874 214 1,660 91 $1,569 $5,169 4,139 1,026 — (1) — 5,164 5 — (5) — — — — $— $6,602 — 2,348 1,622 307 575 4,852 1,750 48 (519) 1,279 279 1,000 100 $900 $5,960 4,891 1,068 — — — 5,959 1 — (1) — — — — $— $12,562 4,891 3,416 1,622 307 575 10,811 1,751 48 (520) 1,279 279 1,000 100 $900 $1,265 (365) $900 SCE Results of Operations ($ millions) Note: See Use of Non-GAAP Financial Measures Utility Earning Activities Utility Cost- Recovery Activities Total Consolidated 2013 Utility Earning Activities Utility Cost- Recovery Activities Total Consolidated 2012 Operating revenue Fuel and purchased power Operation and maintenance Depreciation, decommissioning and amortization Property and other taxes Asset impairment and disallowances Total operating expenses Operating income Interest income and other Interest expense Income before income taxes Income tax expense Net income Dividends on preferred and preference stock Net income available for common stock Core earnings Non-core earnings Total SCE GAAP earnings $11,851 4,139 3,544 1,562 295 32 9,572 2,279 94 (499) 1,874 214 1,660 91 $1,569 $1,338 231 $1,569 • Utility earning activities – revenue authorized by CPUC and FERC to provide reasonable cost recovery and return on investment • Utility cost-recovery activities – CPUC- and FERC-authorized balancing accounts to recover specific project or program costs, subject to reasonableness review or compliance with upfront standards

Exhibit 99.2 EDISON INTERNATIONAL® Leading the Way in Electricity SM February 25, 2014 49 Earnings Per Share Attributable to SCE Core EPS Non-Core Items Tax settlement Health care legislation Regulatory and tax items Asset impairment Total Non-Core Items Basic EPS SCE Core EPS Non-GAAP Reconciliations Note: See Use of Non-GAAP Financial Measures Reconciliation of SCE Core Earnings Per Share to SCE Basic Earnings Per Share 2008 $2.25 — — (0.15) — (0.15) $2.10 2009 $2.68 0.94 — 0.14 — 1.08 $3.76 2010 $3.01 0.30 (0.12) — — 0.18 $3.19 CAGR 12% 6% 2011 $3.33 — — — — — $3.33 2012 $4.10 — — 0.71 — 0.71 $4.81 2013 $3.88 — — — (1.12) (1.12) $2.76

Exhibit 99.2 EDISON INTERNATIONAL® Leading the Way in Electricity SM February 25, 2014 50 Edison International's earnings are prepared in accordance with generally accepted accounting principles used in the United States. Management uses core earnings internally for financial planning and for analysis of performance. Core earnings are also used when communicating with investors and analysts regarding Edison International's earnings results to facilitate comparisons of the Company's performance from period to period. Core earnings are a non-GAAP financial measure and may not be comparable to those of other companies. Core earnings (or losses) are defined as earnings or losses attributable to Edison International shareholders less income or loss from discontinued operations and income or loss from significant discrete items that management does not consider representative of ongoing earnings, such as: exit activities, including sale of certain assets, and other activities that are no longer continuing; asset impairments and certain tax, regulatory or legal settlements or proceedings. A reconciliation of Non-GAAP information to GAAP information is included either on the slide where the information appears or on another slide referenced in this presentation. Use of Non-GAAP Financial Measures EIX Investor Relations Contacts Scott Cunningham, Vice President (626) 302-2540 scott.cunningham@edisonintl.com Felicia Williams, Senior Manager (626) 302-5493 felicia.williams@edisonintl.com


