
February 24, 2016 Business Update February 2016 Exhibit 99.1
February 24, 2016 1 Forward-Looking Statements Statements contained in this presentation about future performance, including, without limitation, operating results, capital expenditures, rate base growth, dividend policy, financial outlook, and other statements that are not purely historical, are forward-looking statements. These forward-looking statements reflect our current expectations; however, such statements involve risks and uncertainties. Actual results could differ materially from current expectations. These forward-looking statements represent our expectations only as of the date of this presentation, and Edison International assumes no duty to update them to reflect new information, events or circumstances. Important factors that could cause different results are discussed under the headings “Risk Factors” and “Management’s Discussion and Analysis” in Edison International’s Form 10- K, and other reports filed with the Securities and Exchange Commission, which are available on our website: www.edisoninvestor.com. These filings also provide additional information on historical and other factual data contained in this presentation. Exhibit 99.1
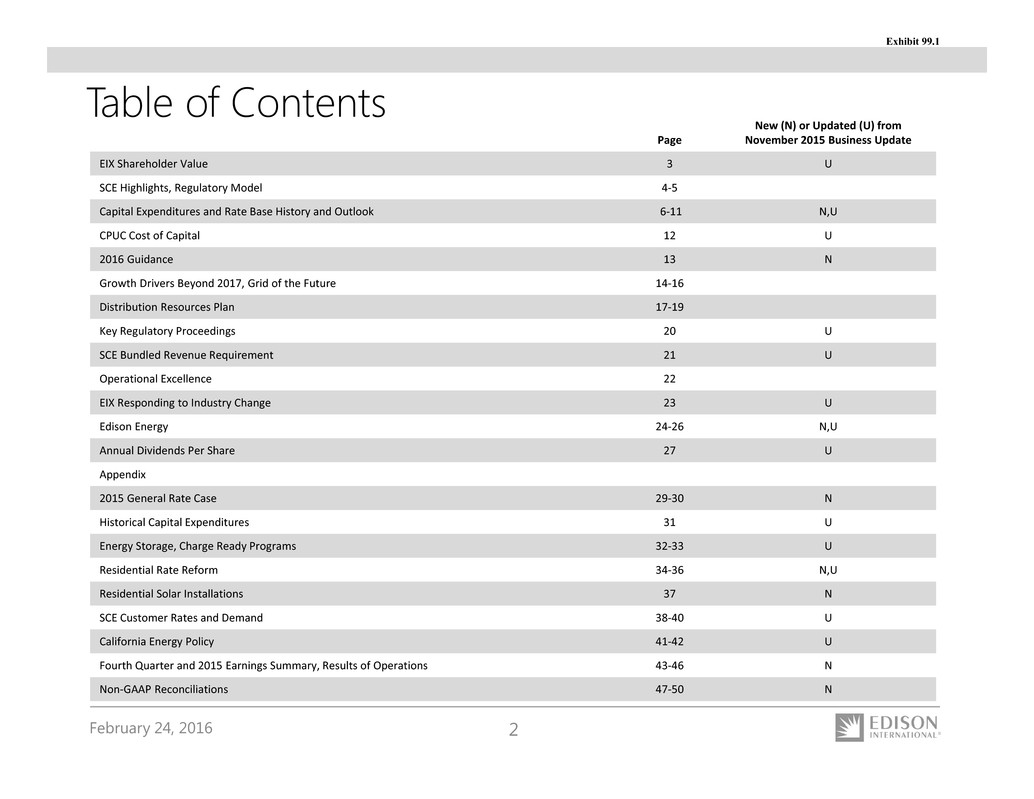
February 24, 2016 2 Page New (N) or Updated (U) from November 2015 Business Update EIX Shareholder Value 3 U SCE Highlights, Regulatory Model 4‐5 Capital Expenditures and Rate Base History and Outlook 6‐11 N,U CPUC Cost of Capital 12 U 2016 Guidance 13 N Growth Drivers Beyond 2017, Grid of the Future 14‐16 Distribution Resources Plan 17‐19 Key Regulatory Proceedings 20 U SCE Bundled Revenue Requirement 21 U Operational Excellence 22 EIX Responding to Industry Change 23 U Edison Energy 24‐26 N,U Annual Dividends Per Share 27 U Appendix 2015 General Rate Case 29‐30 N Historical Capital Expenditures 31 U Energy Storage, Charge Ready Programs 32‐33 U Residential Rate Reform 34‐36 N,U Residential Solar Installations 37 N SCE Customer Rates and Demand 38‐40 U California Energy Policy 41‐42 U Fourth Quarter and 2015 Earnings Summary, Results of Operations 43‐46 N Non‐GAAP Reconciliations 47‐50 N Table of Contents Exhibit 99.1
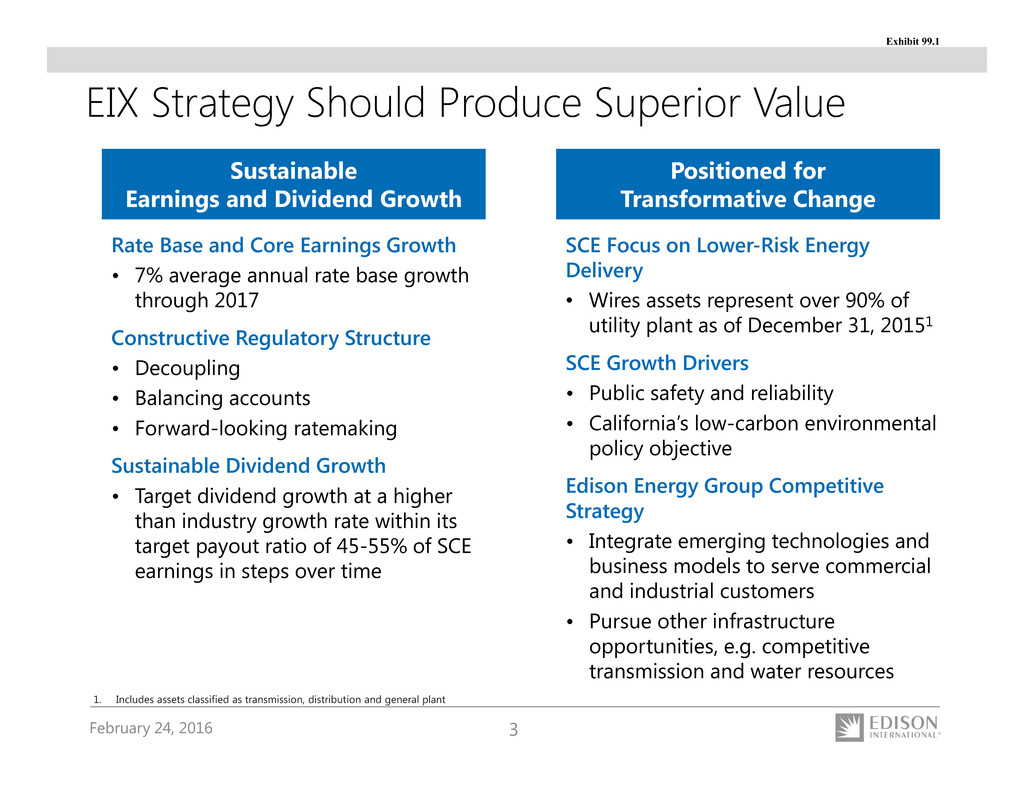
February 24, 2016 3 EIX Strategy Should Produce Superior Value Sustainable Earnings and Dividend Growth Positioned for Transformative Change Rate Base and Core Earnings Growth • 7% average annual rate base growth through 2017 Constructive Regulatory Structure • Decoupling • Balancing accounts • Forward-looking ratemaking Sustainable Dividend Growth • Target dividend growth at a higher than industry growth rate within its target payout ratio of 45-55% of SCE earnings in steps over time SCE Focus on Lower-Risk Energy Delivery • Wires assets represent over 90% of utility plant as of December 31, 20151 SCE Growth Drivers • Public safety and reliability • California’s low-carbon environmental policy objective Edison Energy Group Competitive Strategy • Integrate emerging technologies and business models to serve commercial and industrial customers • Pursue other infrastructure opportunities, e.g. competitive transmission and water resources 1. Includes assets classified as transmission, distribution and general plant Exhibit 99.1
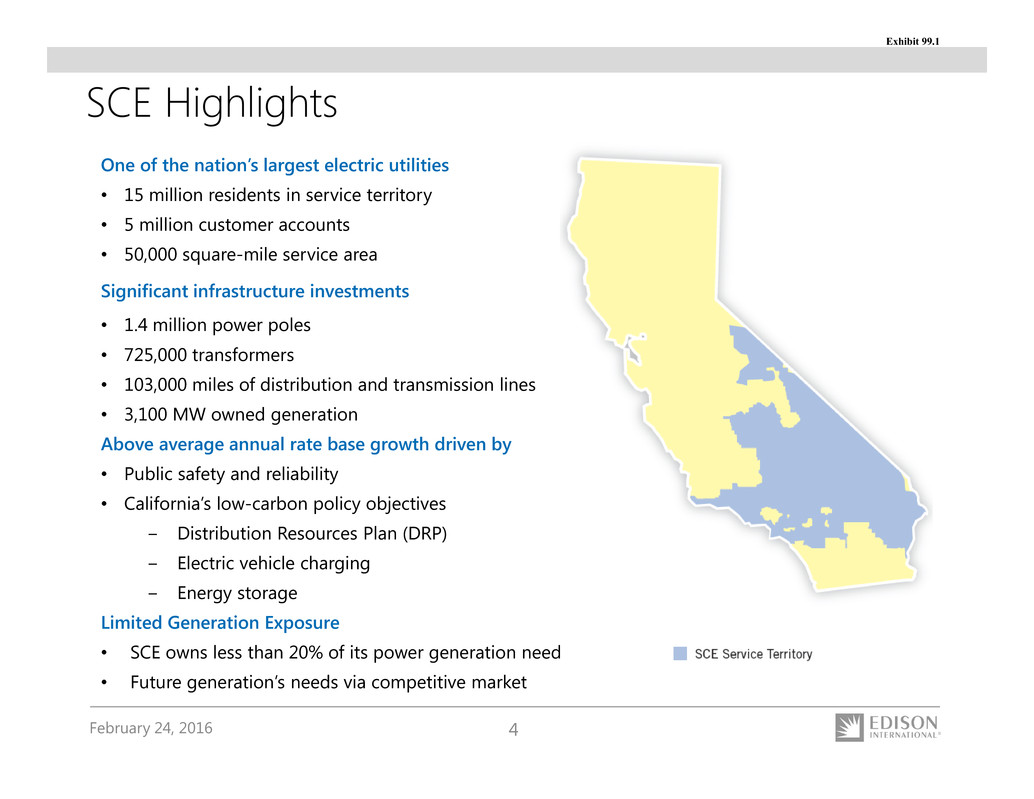
February 24, 2016 4 One of the nation’s largest electric utilities • 15 million residents in service territory • 5 million customer accounts • 50,000 square-mile service area Significant infrastructure investments • 1.4 million power poles • 725,000 transformers • 103,000 miles of distribution and transmission lines • 3,100 MW owned generation Above average annual rate base growth driven by • Public safety and reliability • California’s low-carbon policy objectives ‒ Distribution Resources Plan (DRP) ‒ Electric vehicle charging ‒ Energy storage Limited Generation Exposure • SCE owns less than 20% of its power generation needs • Future generation’s needs via competitive market SCE Highlights Exhibit 99.1

February 24, 2016 5 SCE Decoupled Regulatory Model Decoupling of Regulated Revenues from Sales Major Balancing Accounts • Fuel • Purchased power • Energy efficiency • Pension-related contributions Advanced Long-Term Procurement Planning Forward-looking Ratemaking • SCE earnings are not affected by changes in retail electricity sales • Differences between amounts collected and authorized levels are either billed or refunded to customers • Promotes energy conservation • Stabilizes revenues during economic cycles • Trigger mechanism for fuel and purchased power adjustments at 5% variance level • Utility cost-recovery via balancing accounts represented more than 55% of 2015 costs • Sets prudent upfront standards allowing greater certainty of cost recovery (subject to reasonableness review) • Three-year rate case cycle • Separate multi-year cost of capital proceeding Regulatory Model Key Benefits Exhibit 99.1
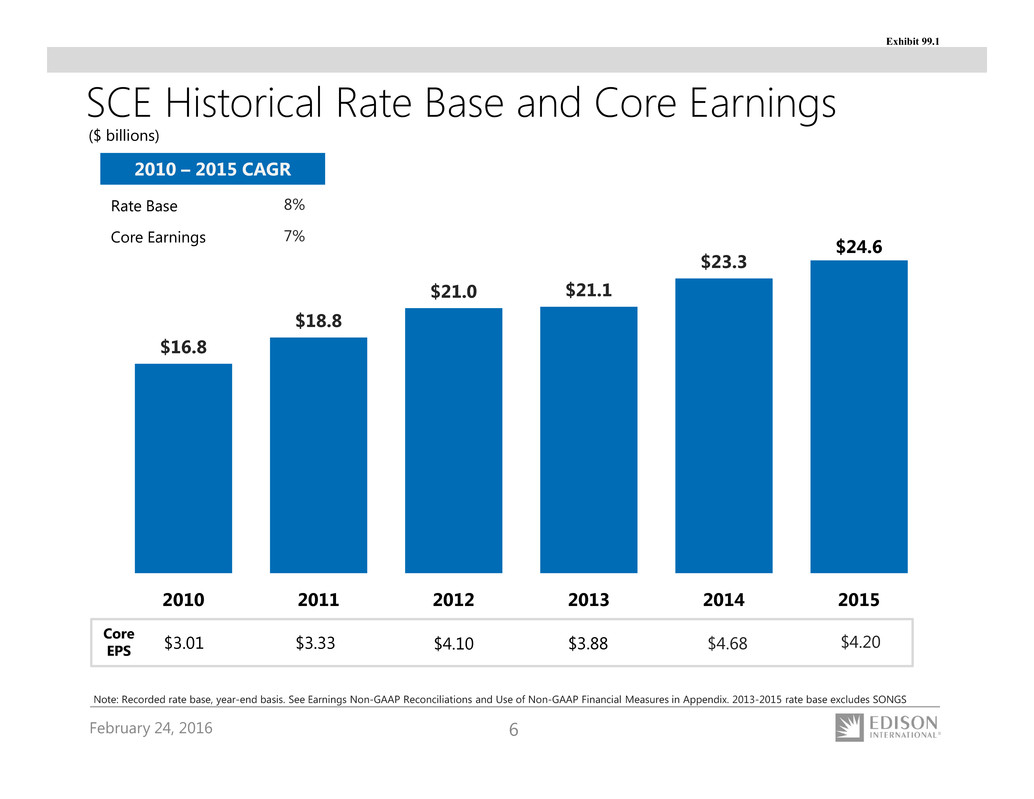
February 24, 2016 6 SCE Historical Rate Base and Core Earnings Rate Base Core Earnings 8% 7% 2010 – 2015 CAGR ($ billions) Note: Recorded rate base, year-end basis. See Earnings Non-GAAP Reconciliations and Use of Non-GAAP Financial Measures in Appendix. 2013-2015 rate base excludes SONGS $16.8 $18.8 $21.0 $21.1 $23.3 $24.6 2010 2011 2012 2013 2014 2015 Core EPS $4.68$3.01 $3.33 $4.10 $3.88 $4.20 Exhibit 99.1
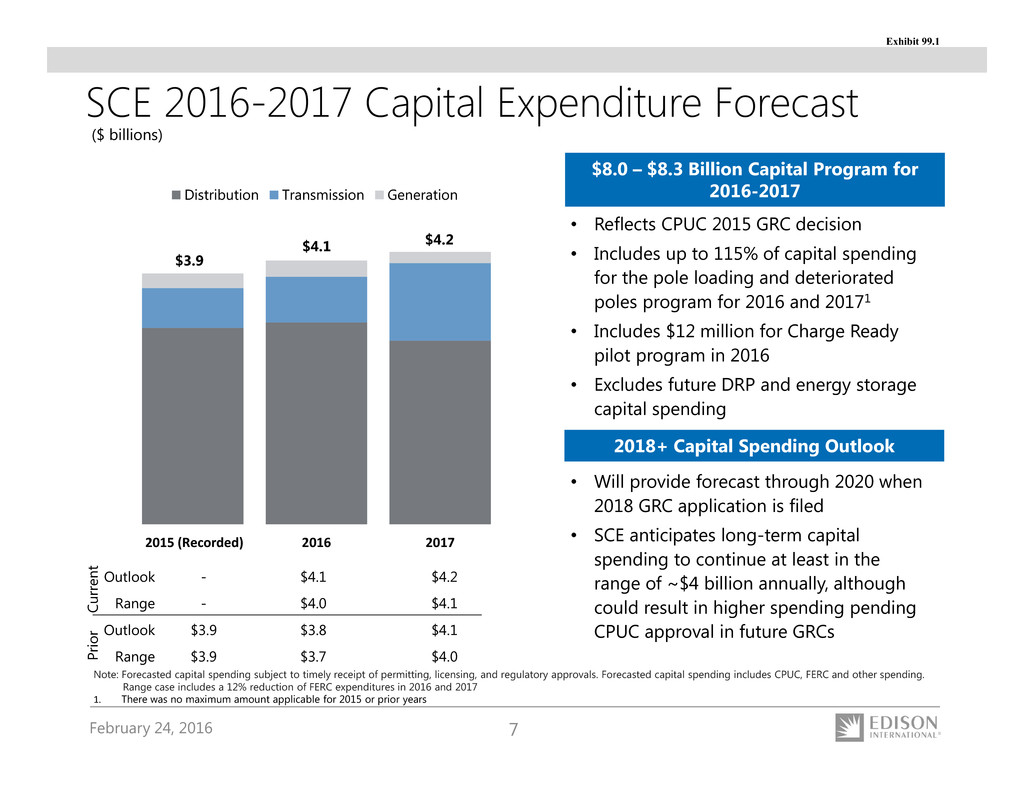
February 24, 2016 7 • Reflects CPUC 2015 GRC decision • Includes up to 115% of capital spending for the pole loading and deteriorated poles program for 2016 and 20171 • Includes $12 million for Charge Ready pilot program in 2016 • Excludes future DRP and energy storage capital spending SCE 2016-2017 Capital Expenditure Forecast Note: Forecasted capital spending subject to timely receipt of permitting, licensing, and regulatory approvals. Forecasted capital spending includes CPUC, FERC and other spending. Range case includes a 12% reduction of FERC expenditures in 2016 and 2017 1. There was no maximum amount applicable for 2015 or prior years ($ billions) Outlook - $4.1 $4.2 Range - $4.0 $4.1 Outlook $3.9 $3.8 $4.1 Range $3.9 $3.7 $4.0 $8.0 – $8.3 Billion Capital Program for 2016-2017 2018+ Capital Spending Outlook • Will provide forecast through 2020 when 2018 GRC application is filed • SCE anticipates long-term capital spending to continue at least in the range of ~$4 billion annually, although could result in higher spending pending CPUC approval in future GRCs C u r r e n t P r i o r $4.1 $4.2 2015 (Recorded) 2016 2017 Distribution Transmission Generation $3.9 Exhibit 99.1
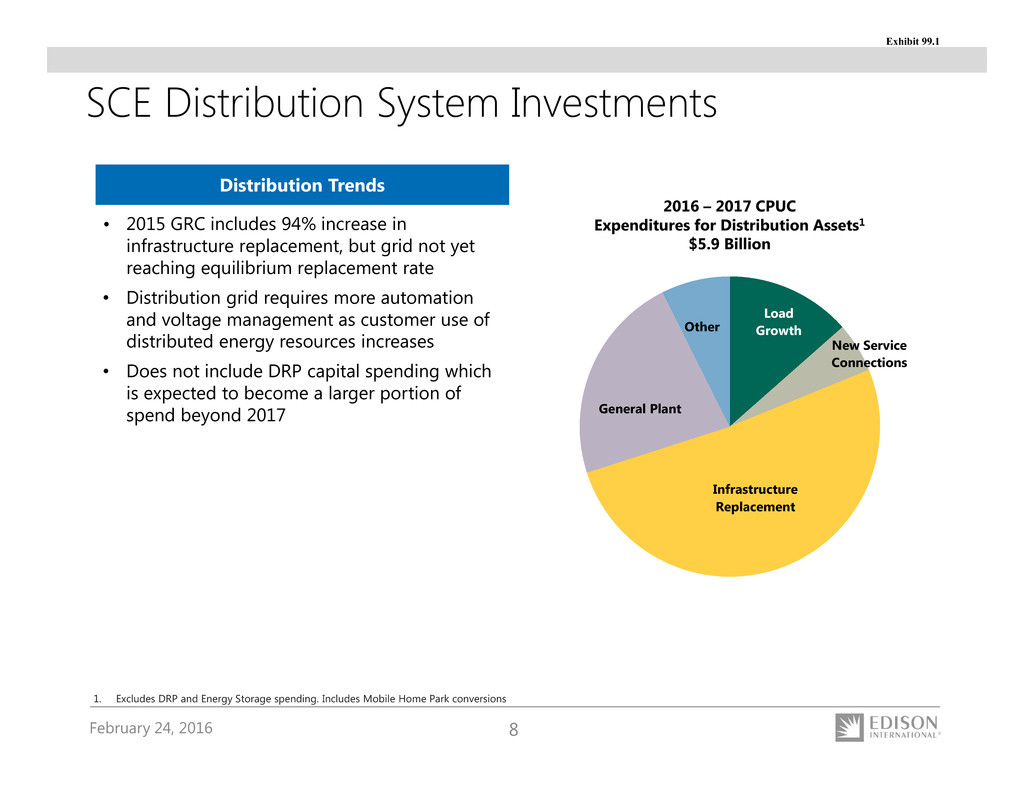
February 24, 2016 8 SCE Distribution System Investments Distribution Trends • 2015 GRC includes 94% increase in infrastructure replacement, but grid not yet reaching equilibrium replacement rate • Distribution grid requires more automation and voltage management as customer use of distributed energy resources increases • Does not include DRP capital spending which is expected to become a larger portion of spend beyond 2017 2016 – 2017 CPUC Expenditures for Distribution Assets1 $5.9 Billion 1. Excludes DRP and Energy Storage spending. Includes Mobile Home Park conversions Load Growth New Service Connections Infrastructure Replacement General Plant Other Exhibit 99.1
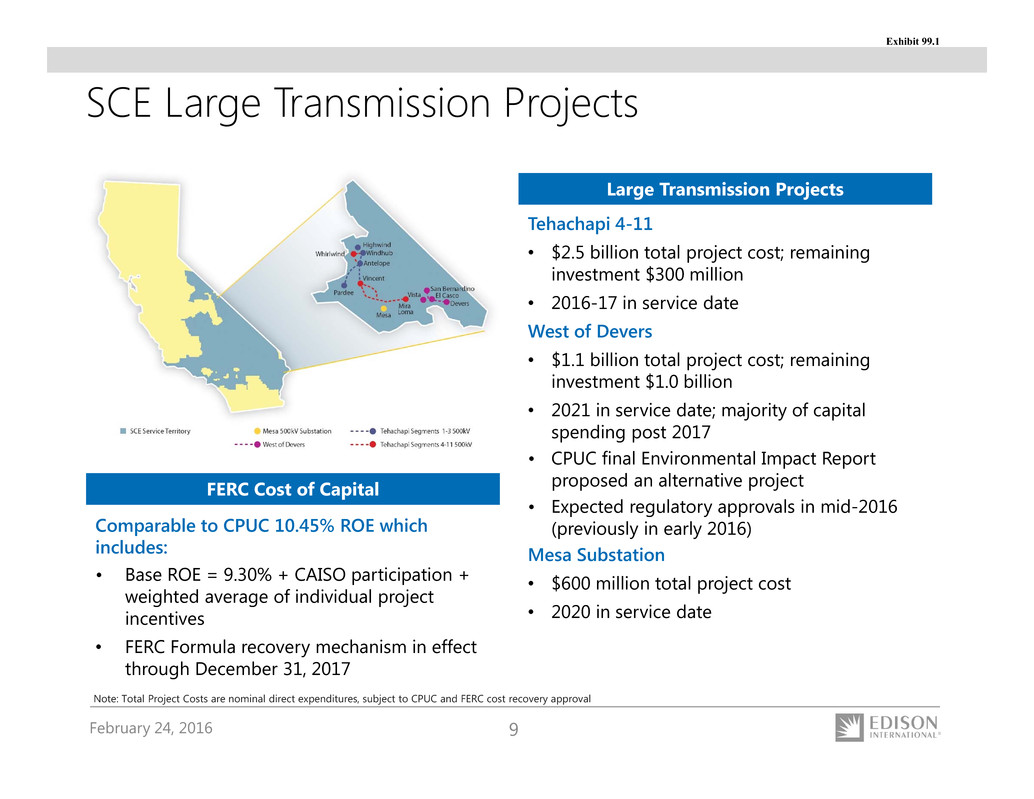
February 24, 2016 9 SCE Large Transmission Projects Large Transmission Projects Tehachapi 4-11 • $2.5 billion total project cost; remaining investment $300 million • 2016-17 in service date West of Devers • $1.1 billion total project cost; remaining investment $1.0 billion • 2021 in service date; majority of capital spending post 2017 • CPUC final Environmental Impact Report proposed an alternative project • Expected regulatory approvals in mid-2016 (previously in early 2016) Mesa Substation • $600 million total project cost • 2020 in service date Note: Total Project Costs are nominal direct expenditures, subject to CPUC and FERC cost recovery approval FERC Cost of Capital Comparable to CPUC 10.45% ROE which includes: • Base ROE = 9.30% + CAISO participation + weighted average of individual project incentives • FERC Formula recovery mechanism in effect through December 31, 2017 Exhibit 99.1
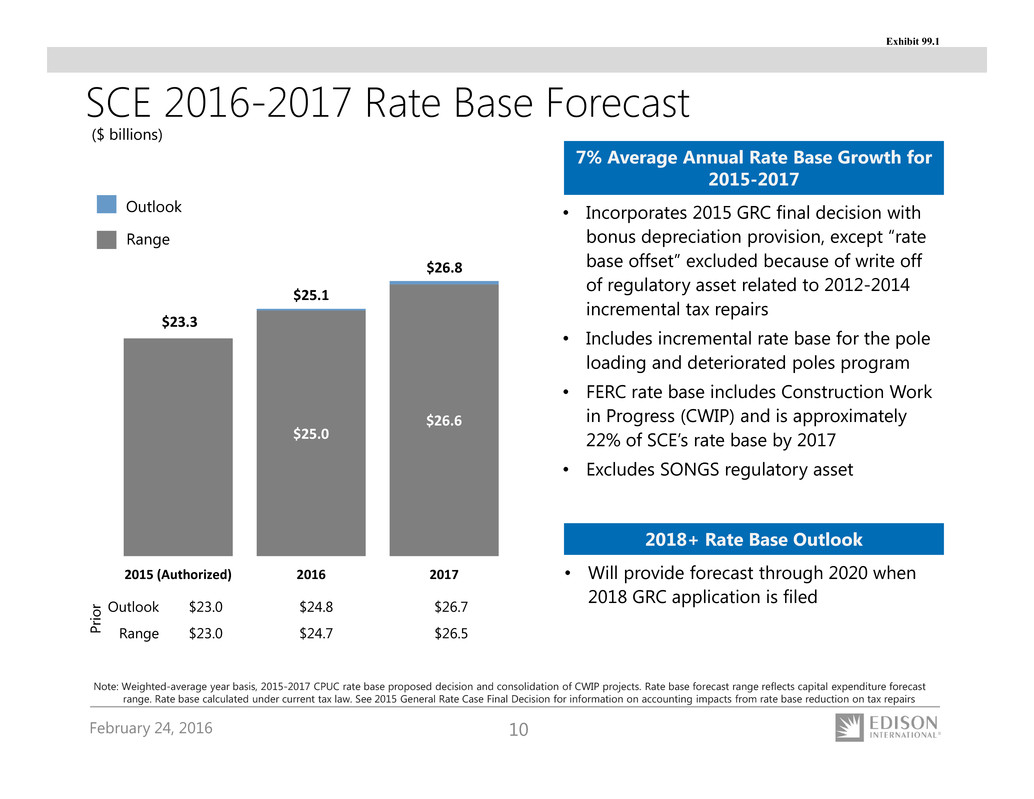
February 24, 2016 10 SCE 2016-2017 Rate Base Forecast • Incorporates 2015 GRC final decision with bonus depreciation provision, except “rate base offset” excluded because of write off of regulatory asset related to 2012-2014 incremental tax repairs • Includes incremental rate base for the pole loading and deteriorated poles program • FERC rate base includes Construction Work in Progress (CWIP) and is approximately 22% of SCE’s rate base by 2017 • Excludes SONGS regulatory asset ($ billions) Outlook Range Note: Weighted-average year basis, 2015-2017 CPUC rate base proposed decision and consolidation of CWIP projects. Rate base forecast range reflects capital expenditure forecast range. Rate base calculated under current tax law. See 2015 General Rate Case Final Decision for information on accounting impacts from rate base reduction on tax repairs 7% Average Annual Rate Base Growth for 2015-2017 2018+ Rate Base Outlook • Will provide forecast through 2020 when 2018 GRC application is filed $25.0 $26.6 $23.3 $25.1 $26.8 2015 (Authorized) 2016 2017 Outlook $23.0 $24.8 $26.7 Range $23.0 $24.7 $26.5 P r i o r Exhibit 99.1
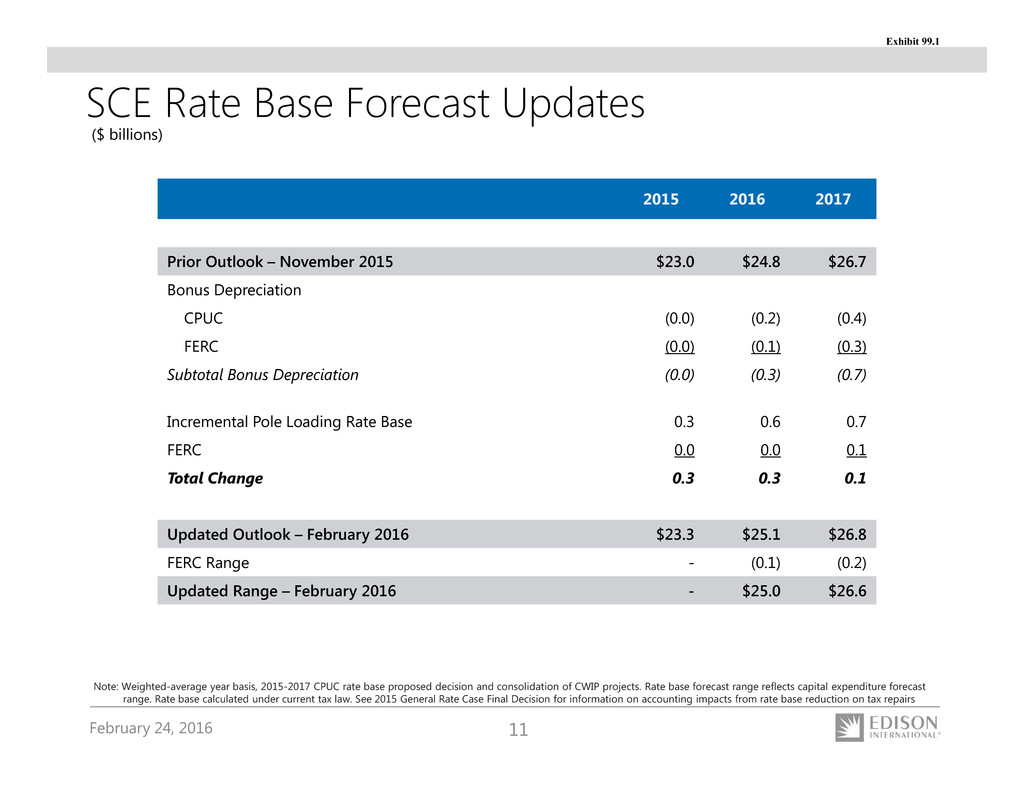
February 24, 2016 11 2015 2016 2017 Prior Outlook – November 2015 $23.0 $24.8 $26.7 Bonus Depreciation CPUC (0.0) (0.2) (0.4) FERC (0.0) (0.1) (0.3) Subtotal Bonus Depreciation (0.0) (0.3) (0.7) Incremental Pole Loading Rate Base 0.3 0.6 0.7 FERC 0.0 0.0 0.1 Total Change 0.3 0.3 0.1 Updated Outlook – February 2016 $23.3 $25.1 $26.8 FERC Range - (0.1) (0.2) Updated Range – February 2016 - $25.0 $26.6 SCE Rate Base Forecast Updates Note: Weighted-average year basis, 2015-2017 CPUC rate base proposed decision and consolidation of CWIP projects. Rate base forecast range reflects capital expenditure forecast range. Rate base calculated under current tax law. See 2015 General Rate Case Final Decision for information on accounting impacts from rate base reduction on tax repairs ($ billions) Exhibit 99.1
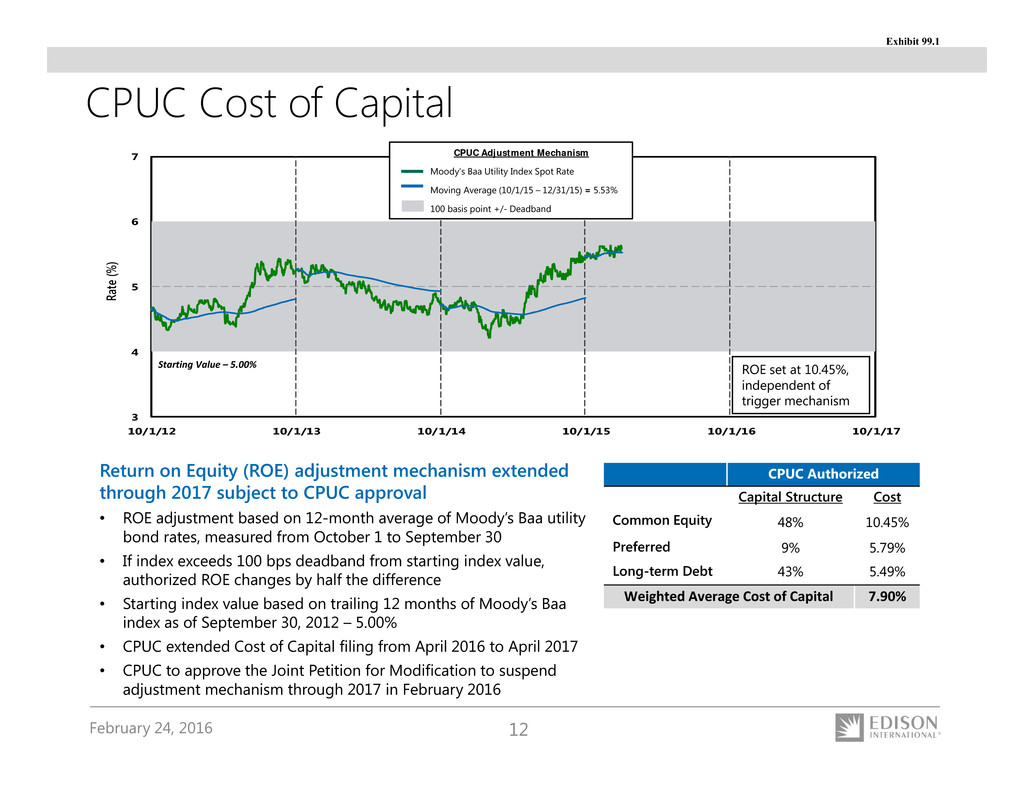
February 24, 2016 12 CPUC Cost of Capital 3 4 5 6 7 10/1/12 10/1/13 10/1/14 10/1/15 10/1/16 10/1/17 R a t e ( % ) CPUC Adjustment Mechanism Moody’s Baa Utility Index Spot Rate Moving Average (10/1/15 – 12/31/15) = 5.53% 100 basis point +/- Deadband Starting Value – 5.00% Return on Equity (ROE) adjustment mechanism extended through 2017 subject to CPUC approval • ROE adjustment based on 12-month average of Moody’s Baa utility bond rates, measured from October 1 to September 30 • If index exceeds 100 bps deadband from starting index value, authorized ROE changes by half the difference • Starting index value based on trailing 12 months of Moody’s Baa index as of September 30, 2012 – 5.00% • CPUC extended Cost of Capital filing from April 2016 to April 2017 • CPUC to approve the Joint Petition for Modification to suspend adjustment mechanism through 2017 in February 2016 CPUC Authorized Capital Structure Cost Common Equity 48% 10.45% Preferred 9% 5.79% Long-term Debt 43% 5.49% Weighted Average Cost of Capital 7.90% ROE set at 10.45%, independent of trigger mechanism Exhibit 99.1
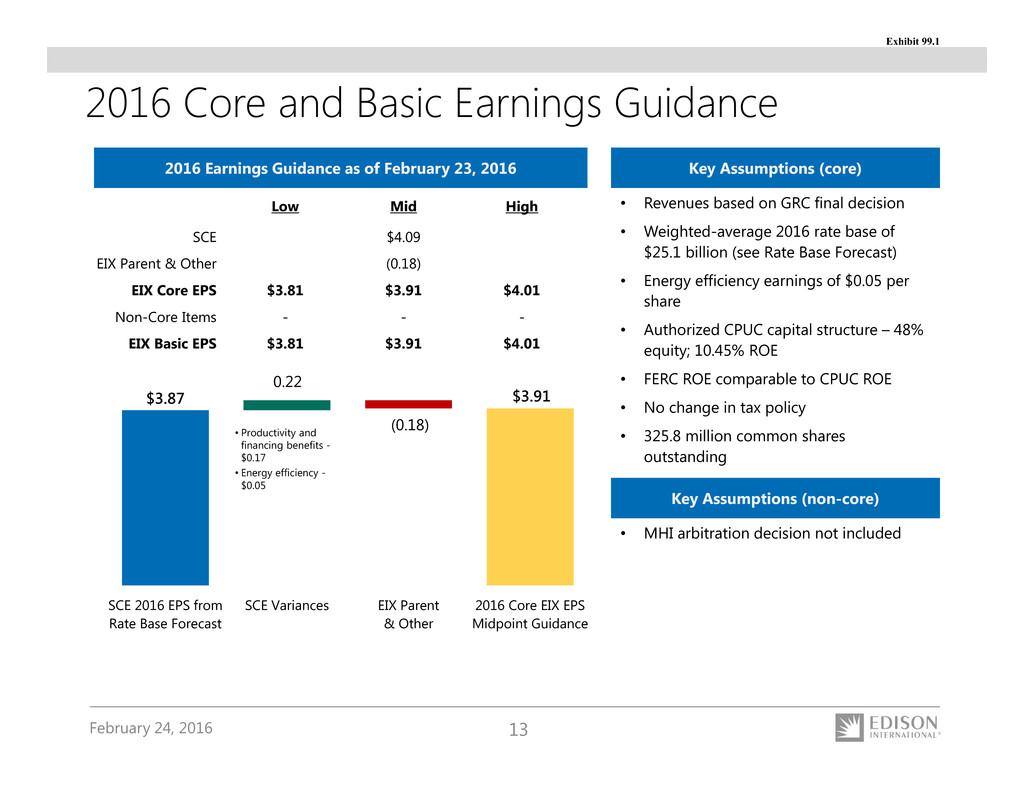
February 24, 2016 13 • Revenues based on GRC final decision • Weighted-average 2016 rate base of $25.1 billion (see Rate Base Forecast) • Energy efficiency earnings of $0.05 per share • Authorized CPUC capital structure – 48% equity; 10.45% ROE • FERC ROE comparable to CPUC ROE • No change in tax policy • 325.8 million common shares outstanding Key Assumptions (core) $3.87 $3.91 (0.18) 0.22 SCE 2016 EPS from Rate Base Forecast SCE Variances EIX Parent & Other 2016 Core EIX EPS Midpoint Guidance Low Mid High SCE $4.09 EIX Parent & Other (0.18) EIX Core EPS $3.81 $3.91 $4.01 Non-Core Items - - - EIX Basic EPS $3.81 $3.91 $4.01 • Productivity and financing benefits - $0.17 • Energy efficiency - $0.05 2016 Earnings Guidance as of February 23, 2016 Key Assumptions (non-core) • MHI arbitration decision not included 2016 Core and Basic Earnings Guidance Exhibit 99.1
February 24, 2016 14 SCE Growth Drivers Beyond 2017 Infrastructure Reliability Investment • Sustained level of infrastructure investment required until equilibrium replacement rates are achieved and then maintained - includes underground cable, poles, switches, and transformers1 Distribution Resources Plan • Accelerate automation and control technology at optimal locations to manage two-way power flows with more dynamic voltage control • DRP required under AB 327 to identify optimal locations, additional spending, and barriers to deploying distributed energy resources – filed July 1, 2015 Transmission • California ISO 2013-2014 Transmission Plan2 - approved Mesa Substation Project (system reliability post- SONGS and renewables integration) with target in-service date of December 31, 2020 • West of Devers (2019-2021) incorporated from prior Transmission Plans in service beyond 2017 • Future transmission needs to meet 50% renewables mandate in 2030 Energy Storage • 290 MW utility owned investment opportunity through 2024 SCE Charge Ready Program • If approved by CPUC, planned Phase 2 will deploy approximately 1/3 of charging infrastructure needed by 2020 to serve EVs at long-dwell time locations (other than single family residences) Transportation Electrification • Personal, mass transit, goods movement 1. Source: A.13-11-0032015 GRC – SCE-01 Policy testimony; equilibrium replacement rate defined as equipment population divided by mean time to failure for type of equipment 2. Approved by the California ISO Board of Governors March 20, 2014 Exhibit 99.1
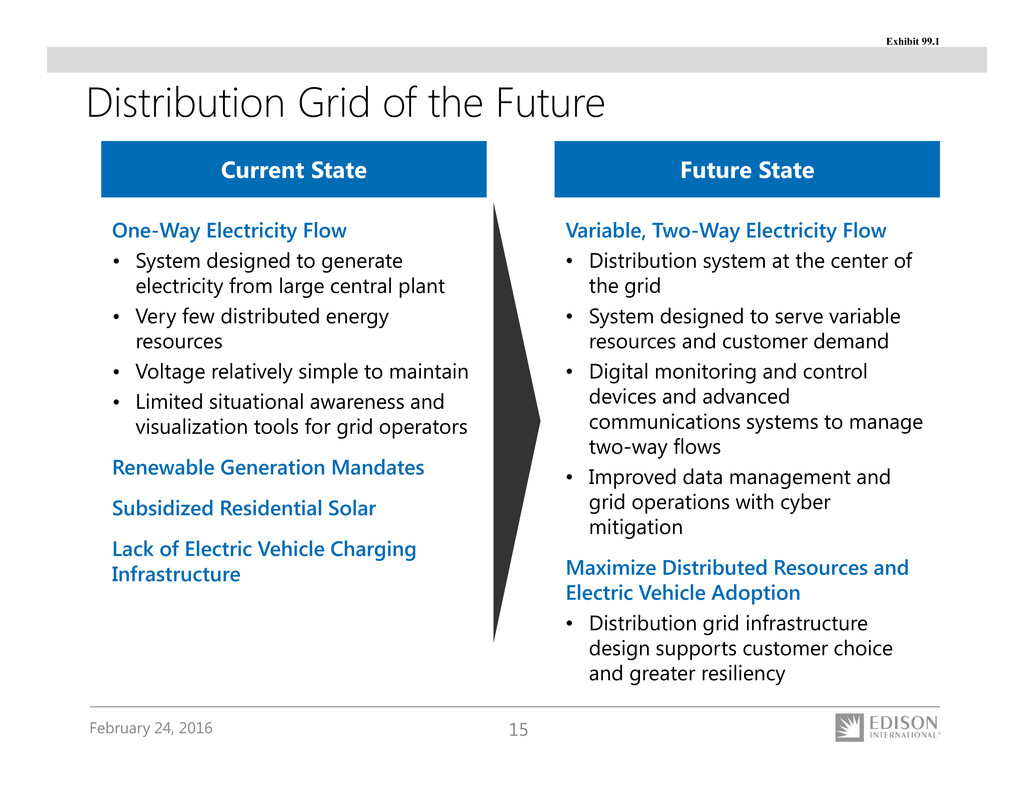
February 24, 2016 15 Distribution Grid of the Future One-Way Electricity Flow • System designed to generate electricity from large central plant • Very few distributed energy resources • Voltage relatively simple to maintain • Limited situational awareness and visualization tools for grid operators Renewable Generation Mandates Subsidized Residential Solar Lack of Electric Vehicle Charging Infrastructure Variable, Two-Way Electricity Flow • Distribution system at the center of the grid • System designed to serve variable resources and customer demand • Digital monitoring and control devices and advanced communications systems to manage two-way flows • Improved data management and grid operations with cyber mitigation Maximize Distributed Resources and Electric Vehicle Adoption • Distribution grid infrastructure design supports customer choice and greater resiliency Current State Future State Exhibit 99.1
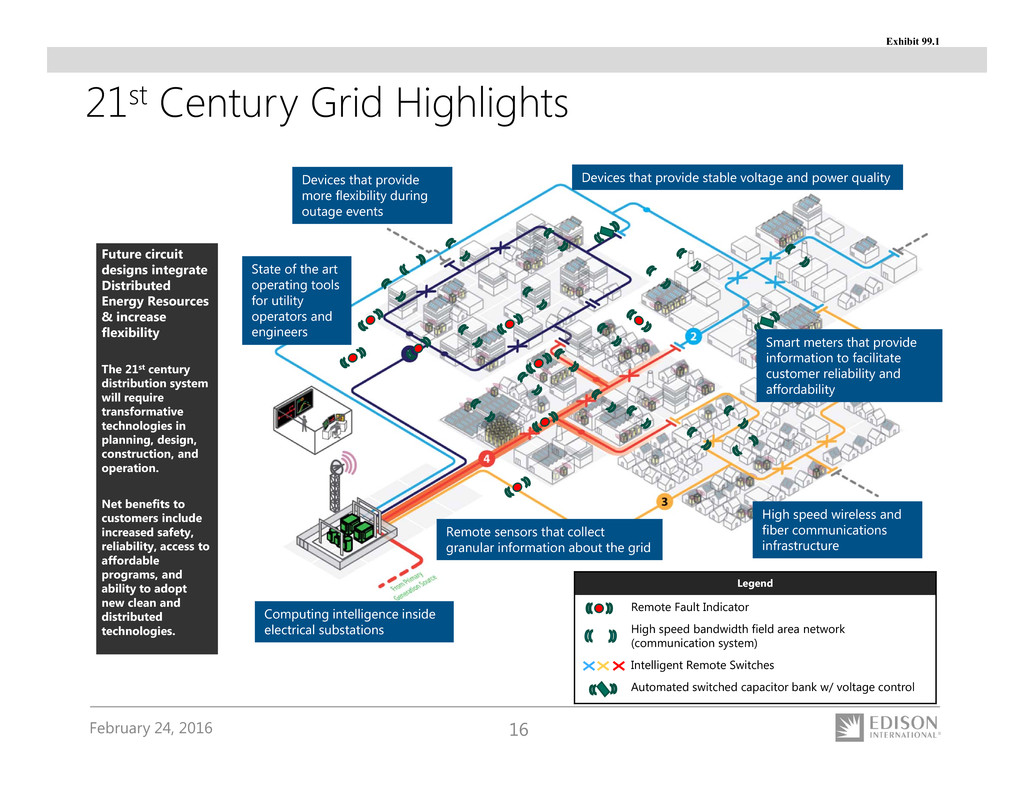
February 24, 2016 16 Computing intelligence inside electrical substations Future circuit designs integrate Distributed Energy Resources & increase flexibility The 21st century distribution system will require transformative technologies in planning, design, construction, and operation. Net benefits to customers include increased safety, reliability, access to affordable programs, and ability to adopt new clean and distributed technologies. State of the art operating tools for utility operators and engineers Remote sensors that collect granular information about the grid Devices that provide more flexibility during outage events Devices that provide stable voltage and power quality High speed wireless and fiber communications infrastructure Smart meters that provide information to facilitate customer reliability and affordability 21st Century Grid Highlights Legend Remote Fault Indicator High speed bandwidth field area network (communication system) Intelligent Remote Switches Automated switched capacitor bank w/ voltage control Exhibit 99.1
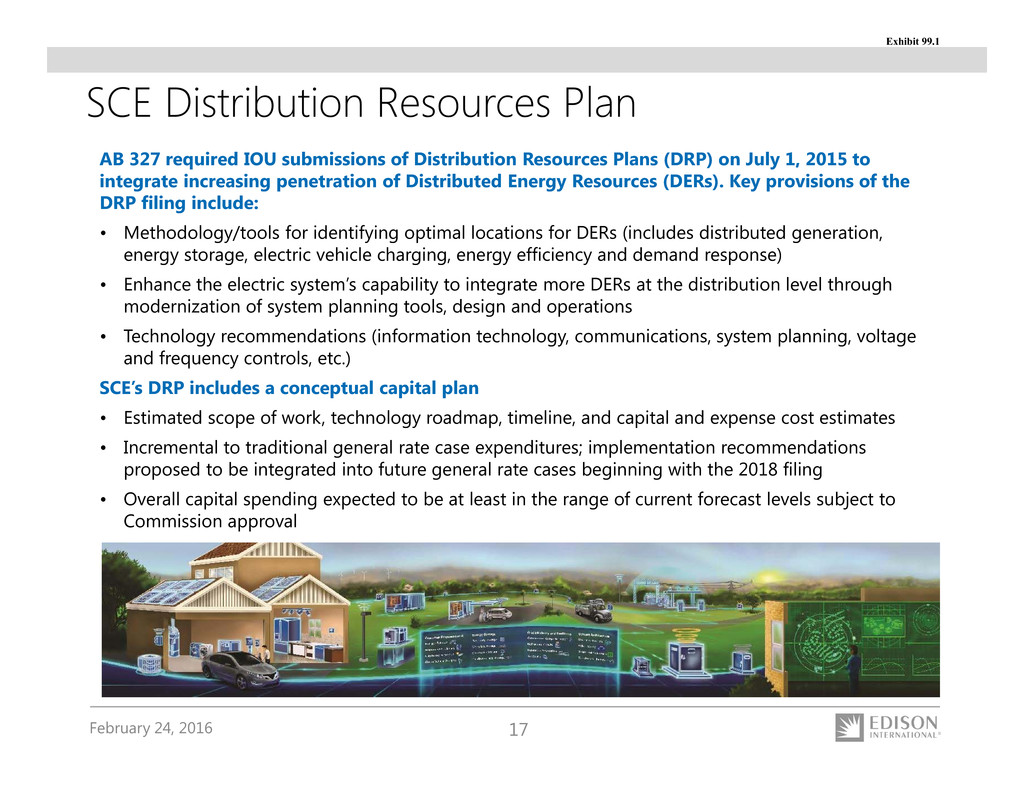
February 24, 2016 17 AB 327 required IOU submissions of Distribution Resources Plans (DRP) on July 1, 2015 to integrate increasing penetration of Distributed Energy Resources (DERs). Key provisions of the DRP filing include: • Methodology/tools for identifying optimal locations for DERs (includes distributed generation, energy storage, electric vehicle charging, energy efficiency and demand response) • Enhance the electric system’s capability to integrate more DERs at the distribution level through modernization of system planning tools, design and operations • Technology recommendations (information technology, communications, system planning, voltage and frequency controls, etc.) SCE’s DRP includes a conceptual capital plan • Estimated scope of work, technology roadmap, timeline, and capital and expense cost estimates • Incremental to traditional general rate case expenditures; implementation recommendations proposed to be integrated into future general rate cases beginning with the 2018 filing • Overall capital spending expected to be at least in the range of current forecast levels subject to Commission approval SCE Distribution Resources Plan Exhibit 99.1
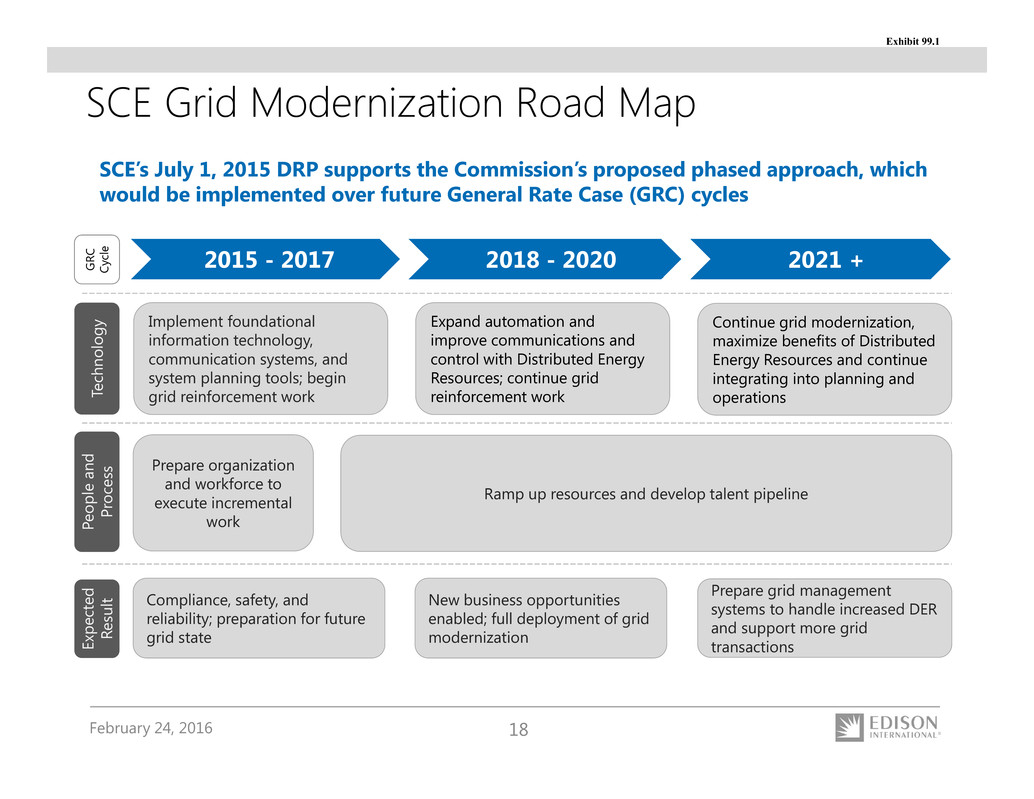
February 24, 2016 18 2015 - 2017 2018 - 2020 2021 + Implement foundational information technology, communication systems, and system planning tools; begin grid reinforcement work Expand automation and improve communications and control with Distributed Energy Resources; continue grid reinforcement work Continue grid modernization, maximize benefits of Distributed Energy Resources and continue integrating into planning and operationsT e c h n o l o g y E x p e c t e d R e s u l t G R C C y c l e Prepare organization and workforce to execute incremental work Ramp up resources and develop talent pipeline Compliance, safety, and reliability; preparation for future grid state New business opportunities enabled; full deployment of grid modernization Prepare grid management systems to handle increased DER and support more grid transactions P e o p l e a n d P r oces s SCE’s July 1, 2015 DRP supports the Commission’s proposed phased approach, which would be implemented over future General Rate Case (GRC) cycles SCE Grid Modernization Road Map Exhibit 99.1
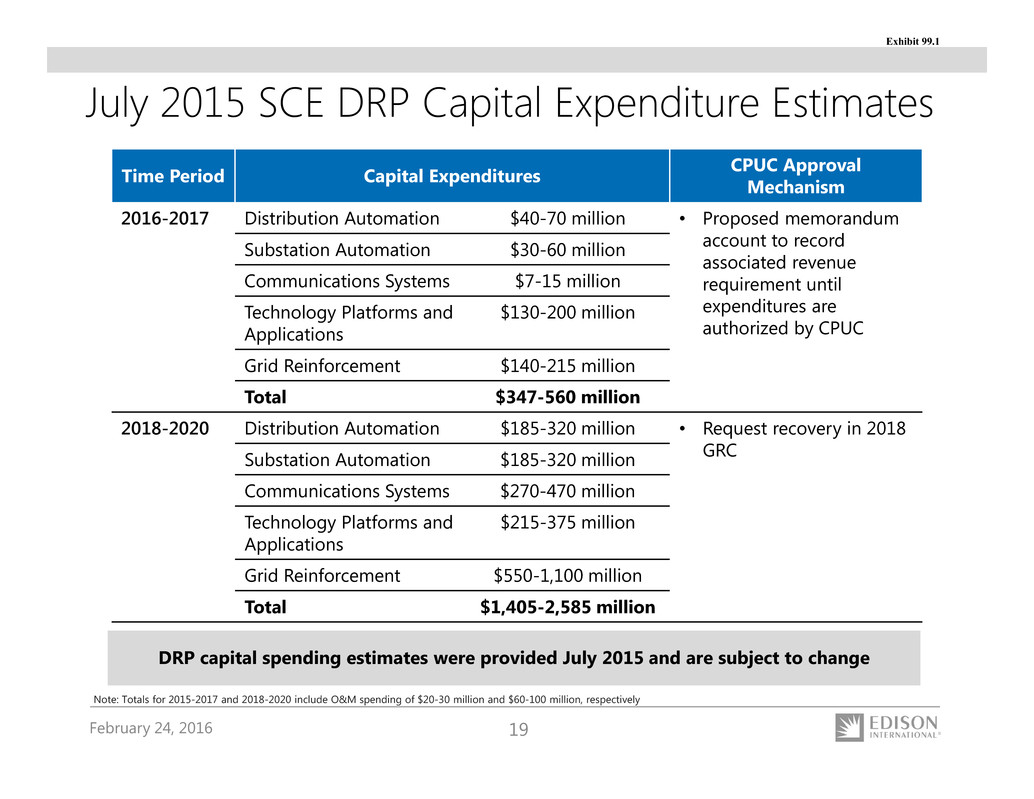
February 24, 2016 19 July 2015 SCE DRP Capital Expenditure Estimates Time Period Capital Expenditures CPUC Approval Mechanism 2016-2017 Distribution Automation $40-70 million • Proposed memorandum account to record associated revenue requirement until expenditures are authorized by CPUC Substation Automation $30-60 million Communications Systems $7-15 million Technology Platforms and Applications $130-200 million Grid Reinforcement $140-215 million Total $347-560 million 2018-2020 Distribution Automation $185-320 million • Request recovery in 2018 GRCSubstation Automation $185-320 million Communications Systems $270-470 million Technology Platforms and Applications $215-375 million Grid Reinforcement $550-1,100 million Total $1,405-2,585 million DRP capital spending estimates were provided July 2015 and are subject to change Note: Totals for 2015-2017 and 2018-2020 include O&M spending of $20-30 million and $60-100 million, respectively Exhibit 99.1
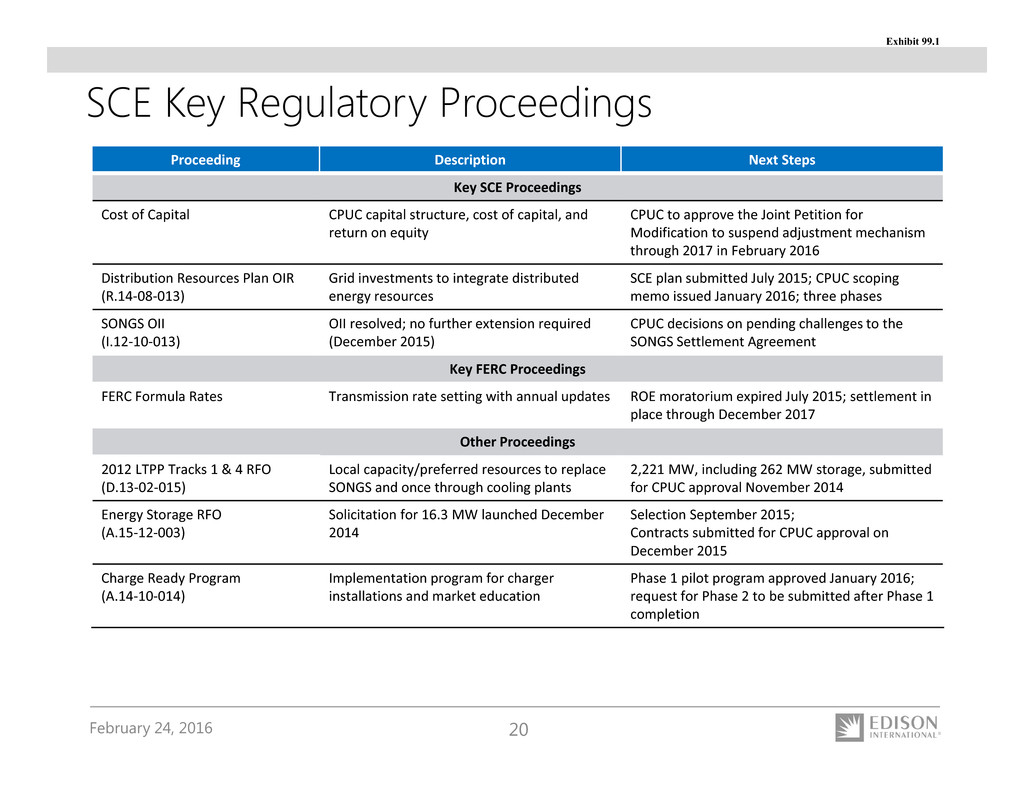
February 24, 2016 20 SCE Key Regulatory Proceedings Proceeding Description Next Steps Key SCE Proceedings Cost of Capital CPUC capital structure, cost of capital, and return on equity CPUC to approve the Joint Petition for Modification to suspend adjustment mechanism through 2017 in February 2016 Distribution Resources Plan OIR (R.14‐08‐013) Grid investments to integrate distributed energy resources SCE plan submitted July 2015; CPUC scoping memo issued January 2016; three phases SONGS OII (I.12‐10‐013) OII resolved; no further extension required (December 2015) CPUC decisions on pending challenges to the SONGS Settlement Agreement Key FERC Proceedings FERC Formula Rates Transmission rate setting with annual updates ROE moratorium expired July 2015; settlement in place through December 2017 Other Proceedings 2012 LTPP Tracks 1 & 4 RFO (D.13‐02‐015) Local capacity/preferred resources to replace SONGS and once through cooling plants 2,221 MW, including 262 MW storage, submitted for CPUC approval November 2014 Energy Storage RFO (A.15‐12‐003) Solicitation for 16.3 MW launched December 2014 Selection September 2015; Contracts submitted for CPUC approval on December 2015 Charge Ready Program (A.14‐10‐014) Implementation program for charger installations and market education Phase 1 pilot program approved January 2016; request for Phase 2 to be submitted after Phase 1 completion Exhibit 99.1
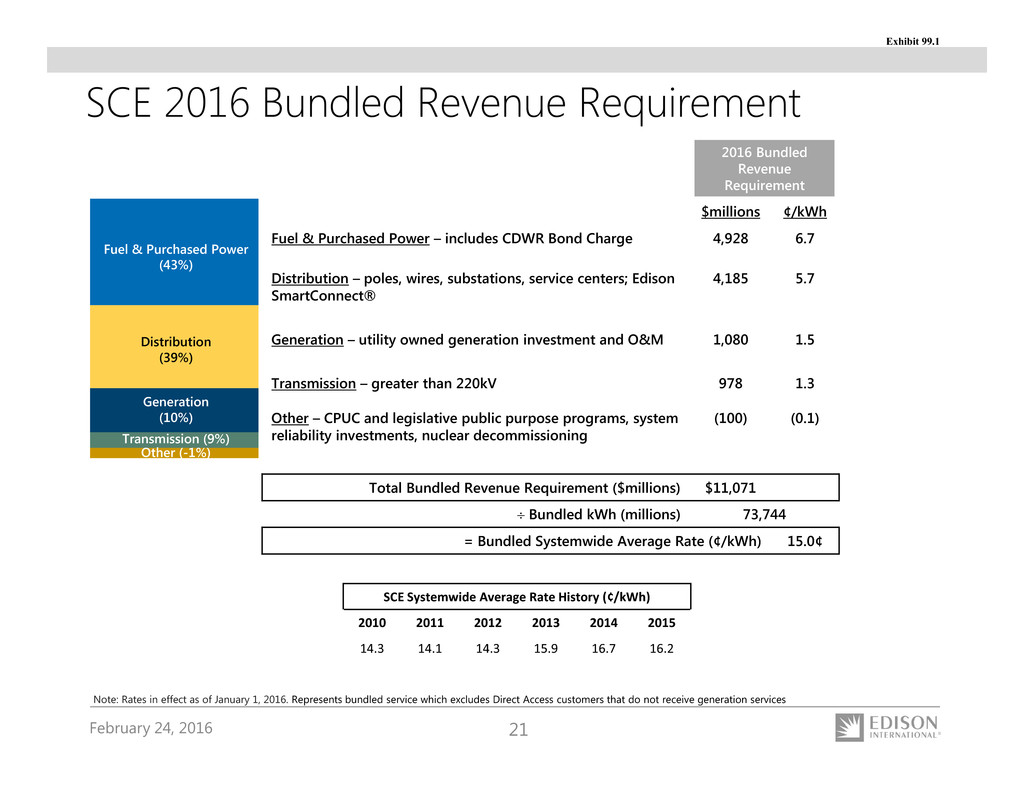
February 24, 2016 21 SCE 2016 Bundled Revenue Requirement Note: Rates in effect as of January 1, 2016. Represents bundled service which excludes Direct Access customers that do not receive generation services SCE Systemwide Average Rate History (¢/kWh) 2010 2011 2012 2013 2014 2015 14.3 14.1 14.3 15.9 16.7 16.2 Fuel & Purchased Power (43%) Distribution (39%) Transmission (9%) Generation (10%) Other (-1%) 2016 Bundled Revenue Requirement $millions ¢/kWh Fuel & Purchased Power – includes CDWR Bond Charge 4,928 6.7 Distribution – poles, wires, substations, service centers; Edison SmartConnect® 4,185 5.7 Generation – utility owned generation investment and O&M 1,080 1.5 Transmission – greater than 220kV 978 1.3 Other – CPUC and legislative public purpose programs, system reliability investments, nuclear decommissioning (100) (0.1) Total Bundled Revenue Requirement ($millions) $11,071 Bundled kWh (millions) 73,744 = Bundled Systemwide Average Rate (¢/kWh) 15.0¢ Exhibit 99.1
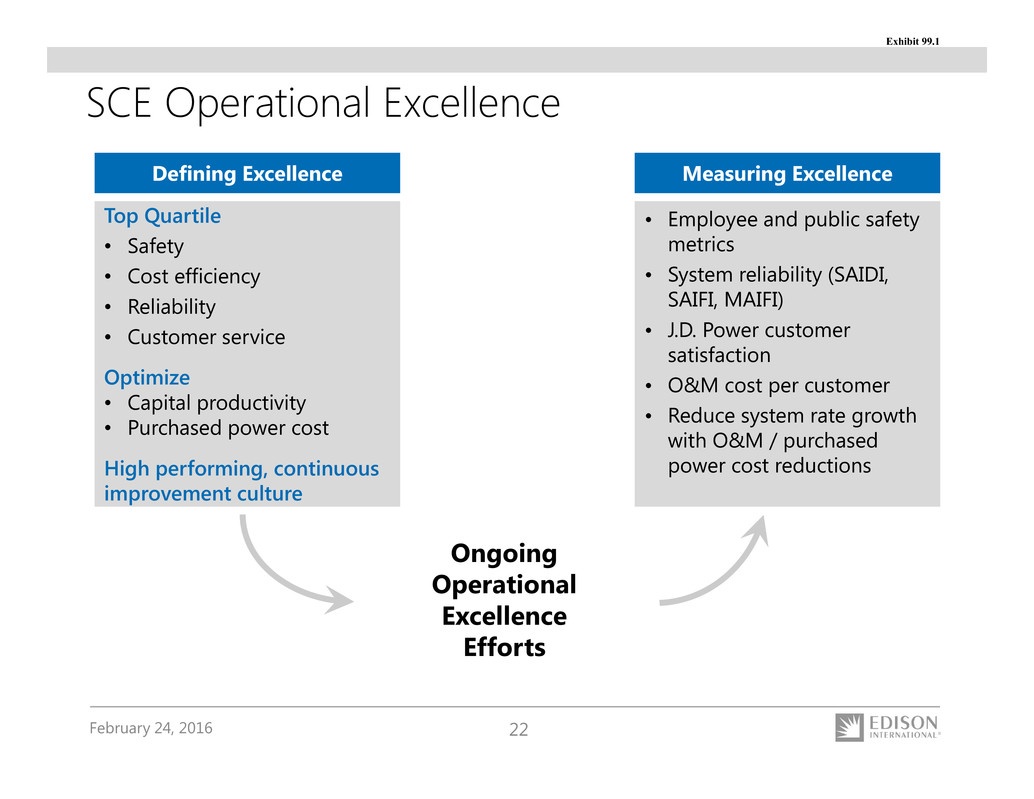
February 24, 2016 22 SCE Operational Excellence Top Quartile • Safety • Cost efficiency • Reliability • Customer service Optimize • Capital productivity • Purchased power cost High performing, continuous improvement culture Defining Excellence Measuring Excellence • Employee and public safety metrics • System reliability (SAIDI, SAIFI, MAIFI) • J.D. Power customer satisfaction • O&M cost per customer • Reduce system rate growth with O&M / purchased power cost reductions Ongoing Operational Excellence Efforts Exhibit 99.1
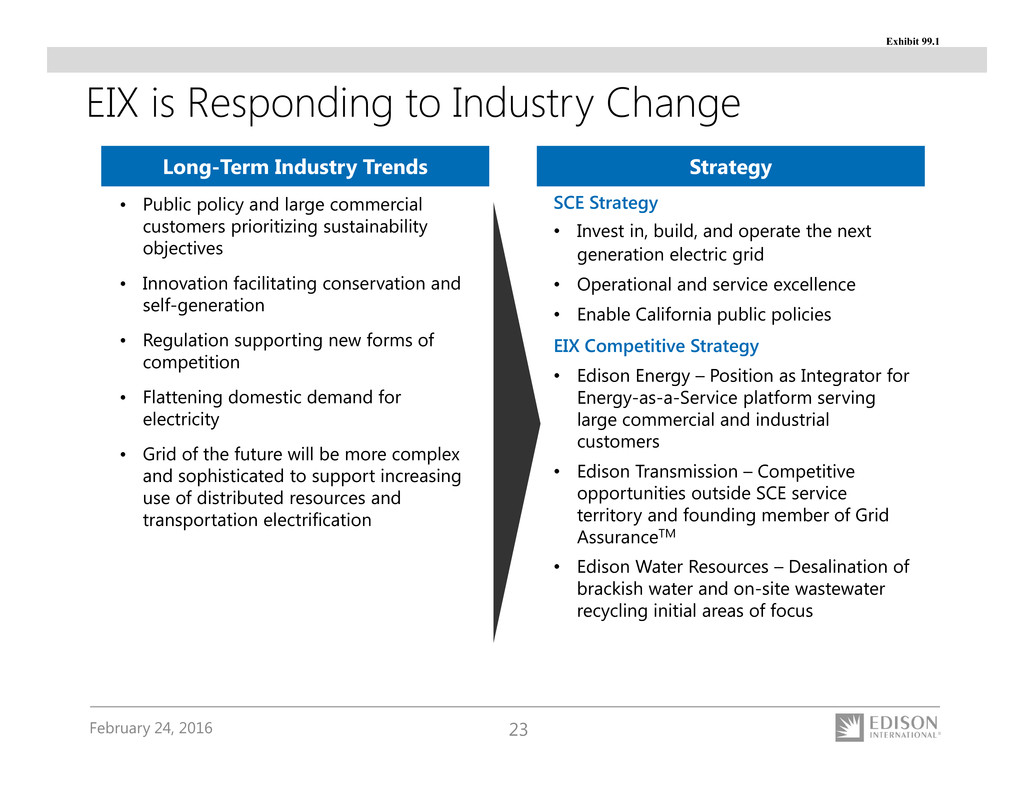
February 24, 2016 23 EIX is Responding to Industry Change • Public policy and large commercial customers prioritizing sustainability objectives • Innovation facilitating conservation and self-generation • Regulation supporting new forms of competition • Flattening domestic demand for electricity • Grid of the future will be more complex and sophisticated to support increasing use of distributed resources and transportation electrification SCE Strategy • Invest in, build, and operate the next generation electric grid • Operational and service excellence • Enable California public policies EIX Competitive Strategy • Edison Energy – Position as Integrator for Energy-as-a-Service platform serving large commercial and industrial customers • Edison Transmission – Competitive opportunities outside SCE service territory and founding member of Grid AssuranceTM • Edison Water Resources – Desalination of brackish water and on-site wastewater recycling initial areas of focus Long-Term Industry Trends Strategy Exhibit 99.1
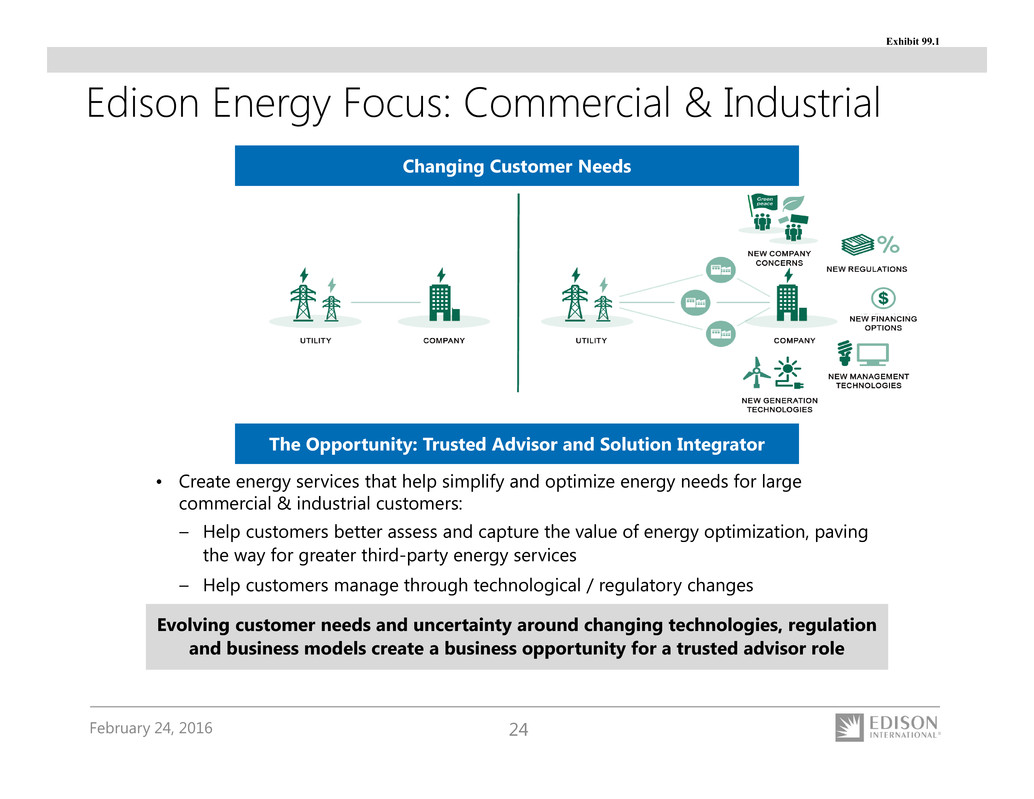
February 24, 2016 24 • Create energy services that help simplify and optimize energy needs for large commercial & industrial customers: – Help customers better assess and capture the value of energy optimization, paving the way for greater third-party energy services – Help customers manage through technological / regulatory changes Evolving customer needs and uncertainty around changing technologies, regulation and business models create a business opportunity for a trusted advisor role Changing Customer Needs The Opportunity: Trusted Advisor and Solution Integrator Edison Energy Focus: Commercial & Industrial Exhibit 99.1
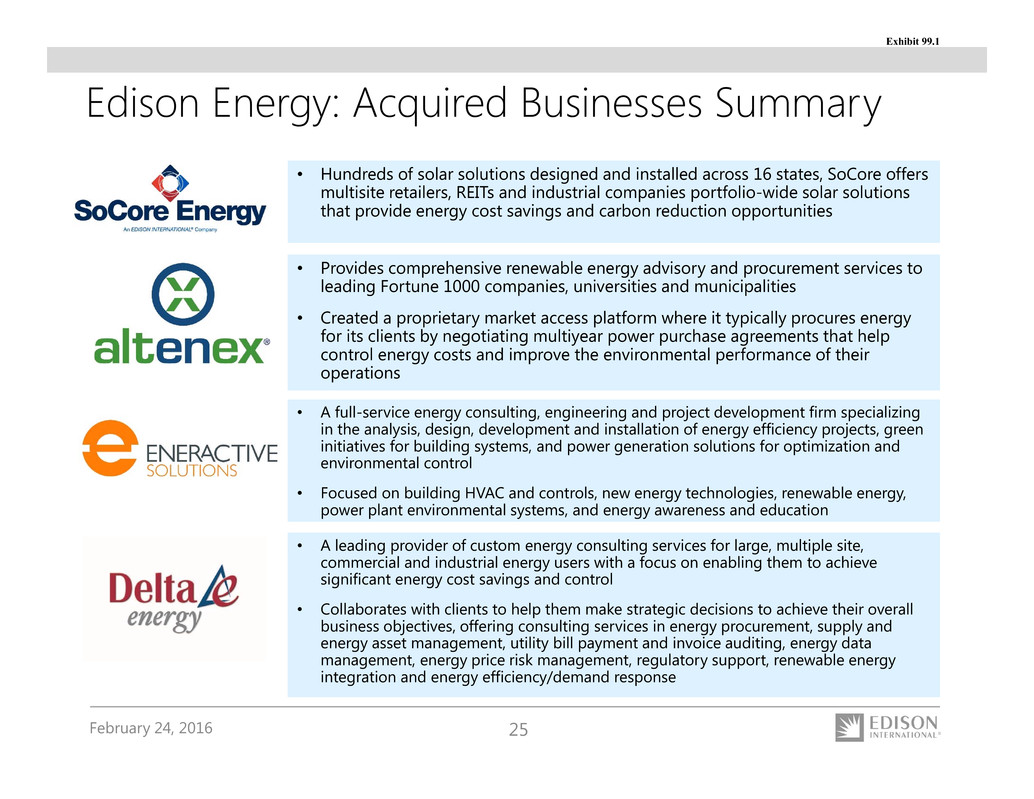
February 24, 2016 25 Edison Energy: Acquired Businesses Summary • Provides comprehensive renewable energy advisory and procurement services to leading Fortune 1000 companies, universities and municipalities • Created a proprietary market access platform where it typically procures energy for its clients by negotiating multiyear power purchase agreements that help control energy costs and improve the environmental performance of their operations • A leading provider of custom energy consulting services for large, multiple site, commercial and industrial energy users with a focus on enabling them to achieve significant energy cost savings and control • Collaborates with clients to help them make strategic decisions to achieve their overall business objectives, offering consulting services in energy procurement, supply and energy asset management, utility bill payment and invoice auditing, energy data management, energy price risk management, regulatory support, renewable energy integration and energy efficiency/demand response • A full-service energy consulting, engineering and project development firm specializing in the analysis, design, development and installation of energy efficiency projects, green initiatives for building systems, and power generation solutions for optimization and environmental control • Focused on building HVAC and controls, new energy technologies, renewable energy, power plant environmental systems, and energy awareness and education • Hundreds of solar solutions designed and installed across 16 states, SoCore offers multisite retailers, REITs and industrial companies portfolio-wide solar solutions that provide energy cost savings and carbon reduction opportunities Exhibit 99.1
February 24, 2016 26 On June 10th, eight electric utilities and energy companies announced a MOU to pursue the development of Grid Assurance, a limited liability company that plans to offer subscribers cost- effective solutions for enhancing grid resiliency and protecting customers from prolonged transmission outages • Grid Assurance is intended to address potential high impact events on the bulk transmission systems: - Entity will own critical equipment with long manufacturing lead times to account for risk beyond what is covered by “operational spares” (e.g., BES transformers, breakers, etc.) - Entity will provide secure, off-site storage in strategic locations, and support the delivery of equipment transportation and logistics services - Subscribers will pay a cost-of-service based subscription fee for access to inventory and will have rights to call upon inventory following a “Qualifying Event” such as physical attacks, electromagnetic pulses, solar storms, cyberattacks, earthquakes and severe weather events - Regulatory construct will provide cost certainty and cost recovery similar to FERC formula rates for transmission assets - Subscription to the sparing service will be available to all transmission owning entities • Contingent on regulatory approvals, Grid Assurance is expected to begin accepting subscribers and identifying inventory in 2016 Edison Transmission is one of the eight companies pursuing Grid Assurance Grid AssuranceTM Overview Exhibit 99.1
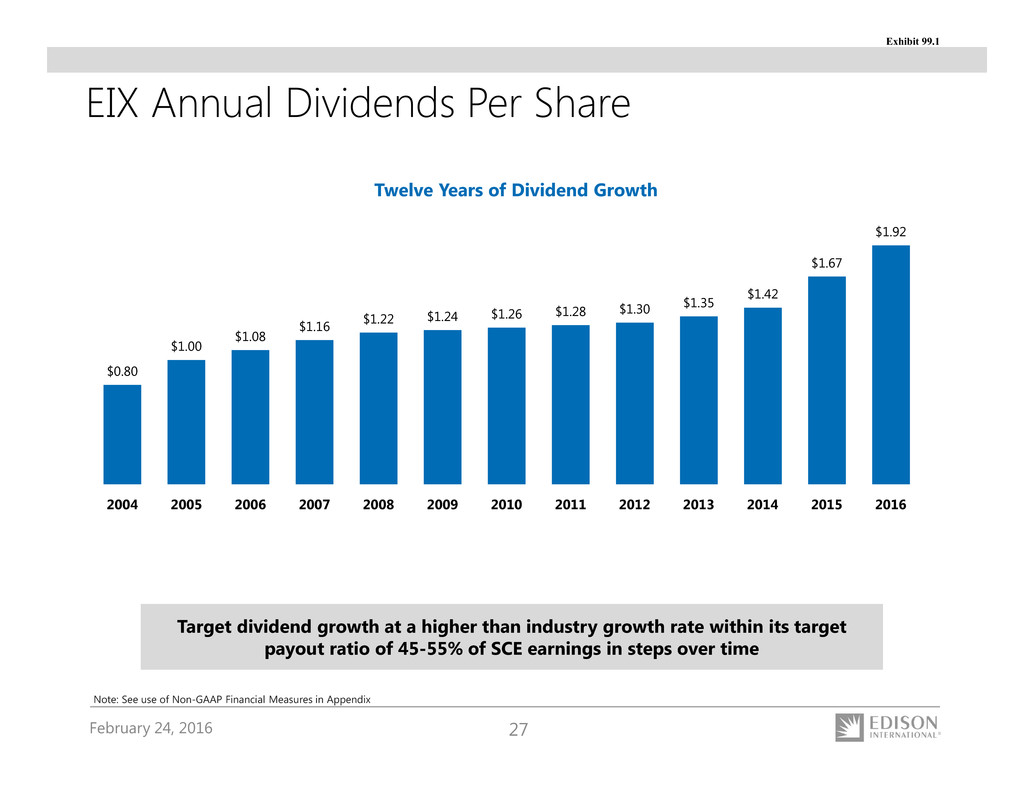
February 24, 2016 27 EIX Annual Dividends Per Share $0.80 $1.00 $1.08 $1.16 $1.22 $1.24 $1.26 $1.28 $1.30 $1.35 $1.42 $1.67 $1.92 2004 2005 2006 2007 2008 2009 2010 2011 2012 2013 2014 2015 2016 Note: See use of Non-GAAP Financial Measures in Appendix Twelve Years of Dividend Growth Target dividend growth at a higher than industry growth rate within its target payout ratio of 45-55% of SCE earnings in steps over time Exhibit 99.1
February 24, 2016 28 Appendix Exhibit 99.1
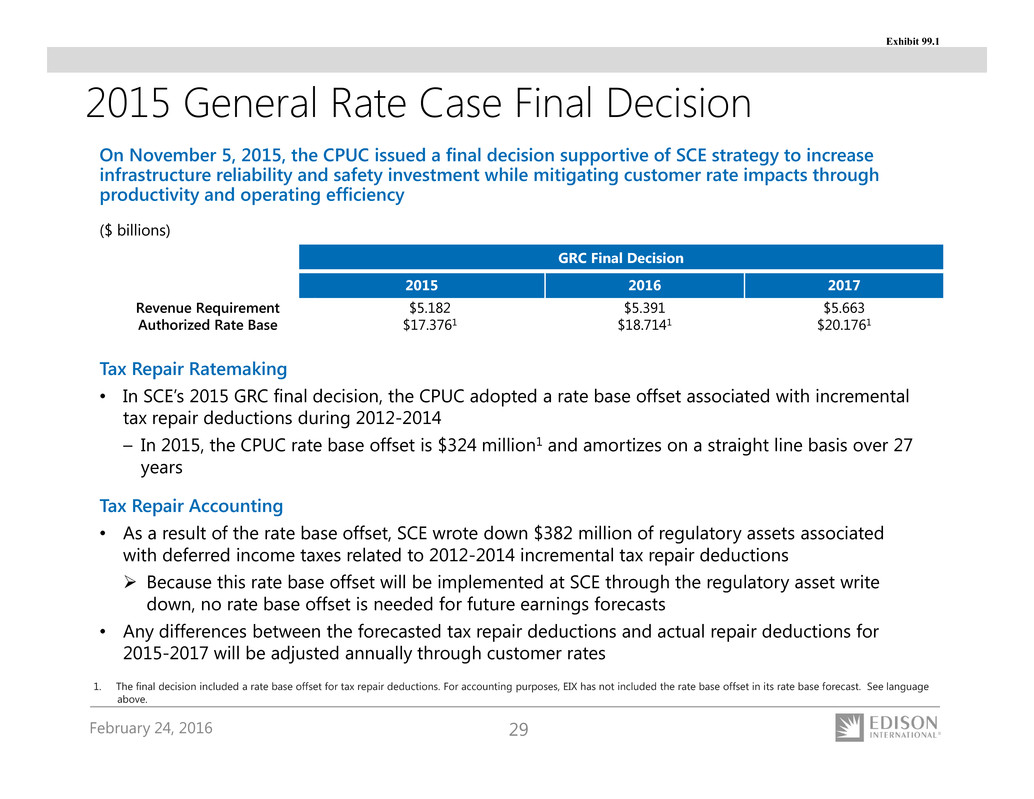
February 24, 2016 29 Tax Repair Accounting • As a result of the rate base offset, SCE wrote down $382 million of regulatory assets associated with deferred income taxes related to 2012-2014 incremental tax repair deductions Because this rate base offset will be implemented at SCE through the regulatory asset write down, no rate base offset is needed for future earnings forecasts • Any differences between the forecasted tax repair deductions and actual repair deductions for 2015-2017 will be adjusted annually through customer rates On November 5, 2015, the CPUC issued a final decision supportive of SCE strategy to increase infrastructure reliability and safety investment while mitigating customer rate impacts through productivity and operating efficiency GRC Final Decision 2015 2016 2017 Revenue Requirement $5.182 $5.391 $5.663 Authorized Rate Base $17.3761 $18.7141 $20.1761 ($ billions) 2015 General Rate Case Final Decision 1. The final decision included a rate base offset for tax repair deductions. For accounting purposes, EIX has not included the rate base offset in its rate base forecast. See language above. Tax Repair Ratemaking • In SCE’s 2015 GRC final decision, the CPUC adopted a rate base offset associated with incremental tax repair deductions during 2012-2014 – In 2015, the CPUC rate base offset is $324 million1 and amortizes on a straight line basis over 27 years Exhibit 99.1
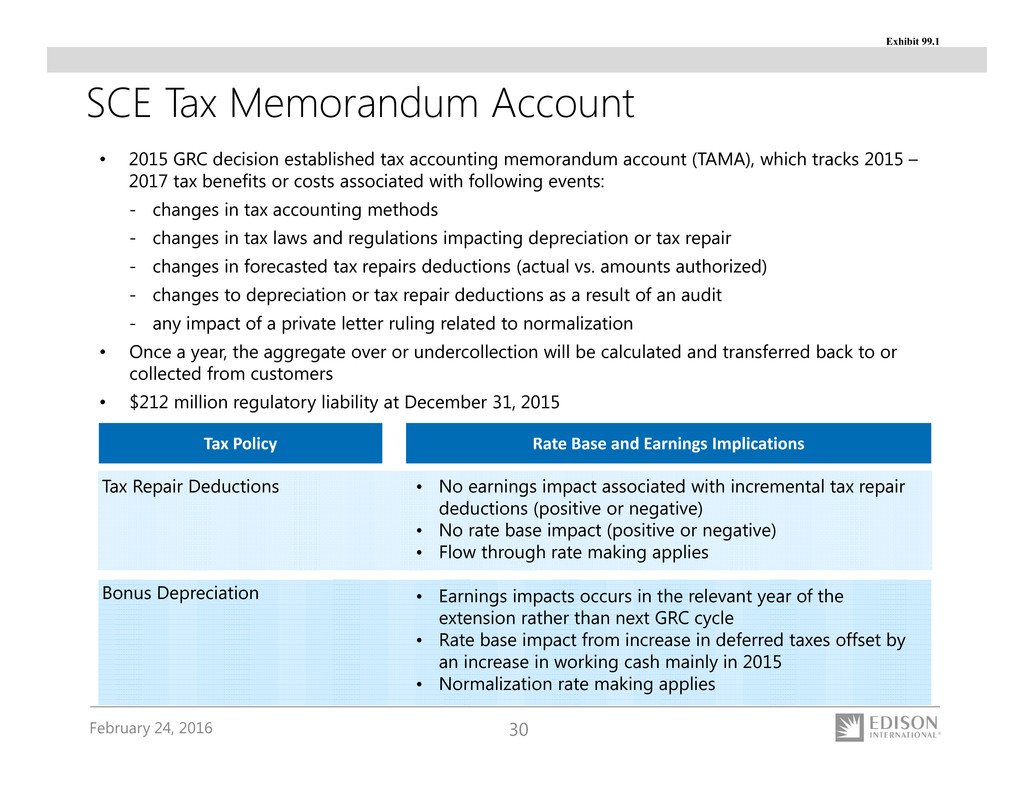
February 24, 2016 30 SCE Tax Memorandum Account • 2015 GRC decision established tax accounting memorandum account (TAMA), which tracks 2015 – 2017 tax benefits or costs associated with following events: - changes in tax accounting methods - changes in tax laws and regulations impacting depreciation or tax repair - changes in forecasted tax repairs deductions (actual vs. amounts authorized) - changes to depreciation or tax repair deductions as a result of an audit - any impact of a private letter ruling related to normalization • Once a year, the aggregate over or undercollection will be calculated and transferred back to or collected from customers • $212 million regulatory liability at December 31, 2015 Tax Repair Deductions Bonus Depreciation • No earnings impact associated with incremental tax repair deductions (positive or negative) • No rate base impact (positive or negative) • Flow through rate making applies • Earnings impacts occurs in the relevant year of the extension rather than next GRC cycle • Rate base impact from increase in deferred taxes offset by an increase in working cash mainly in 2015 • Normalization rate making applies Tax Policy Rate Base and Earnings Implications Exhibit 99.1
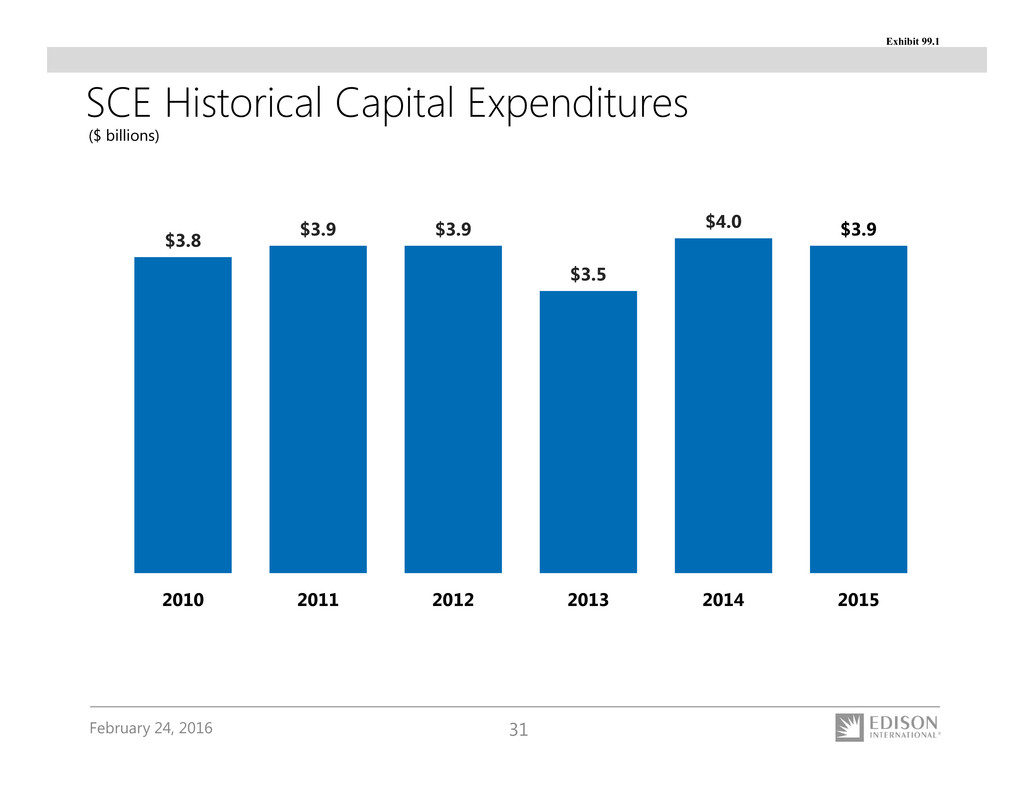
February 24, 2016 31 SCE Historical Capital Expenditures ($ billions) $3.8 $3.9 $3.9 $3.5 $4.0 $3.9 2010 2011 2012 2013 2014 2015 Exhibit 99.1
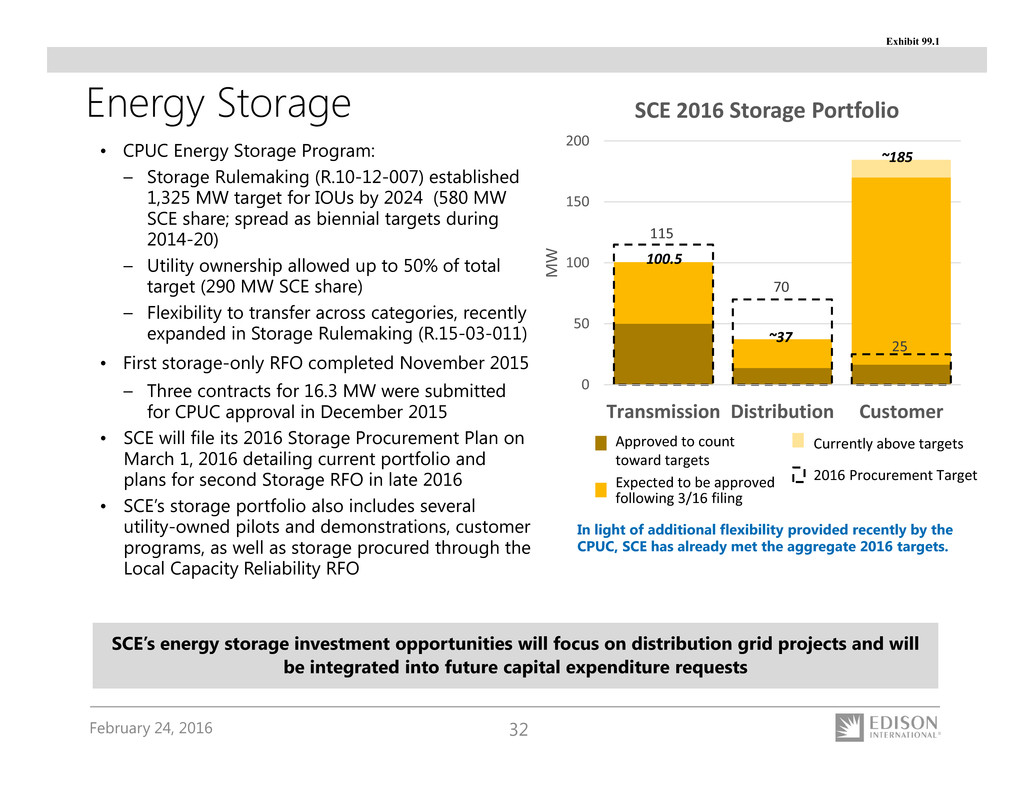
February 24, 2016 32 Energy Storage • CPUC Energy Storage Program: – Storage Rulemaking (R.10-12-007) established 1,325 MW target for IOUs by 2024 (580 MW SCE share; spread as biennial targets during 2014-20) – Utility ownership allowed up to 50% of total target (290 MW SCE share) – Flexibility to transfer across categories, recently expanded in Storage Rulemaking (R.15-03-011) • First storage-only RFO completed November 2015 – Three contracts for 16.3 MW were submitted for CPUC approval in December 2015 • SCE will file its 2016 Storage Procurement Plan on March 1, 2016 detailing current portfolio and plans for second Storage RFO in late 2016 • SCE’s storage portfolio also includes several utility-owned pilots and demonstrations, customer programs, as well as storage procured through the Local Capacity Reliability RFO SCE’s energy storage investment opportunities will focus on distribution grid projects and will be integrated into future capital expenditure requests 115 70 25 0 50 100 150 200 Transmission Distribution Customer M W SCE 2016 Storage Portfolio Approved to count toward targets Expected to be approved following 3/16 filing Currently above targets 2016 Procurement Target In light of additional flexibility provided recently by the CPUC, SCE has already met the aggregate 2016 targets. 100.5 ~37 ~185 Exhibit 99.1
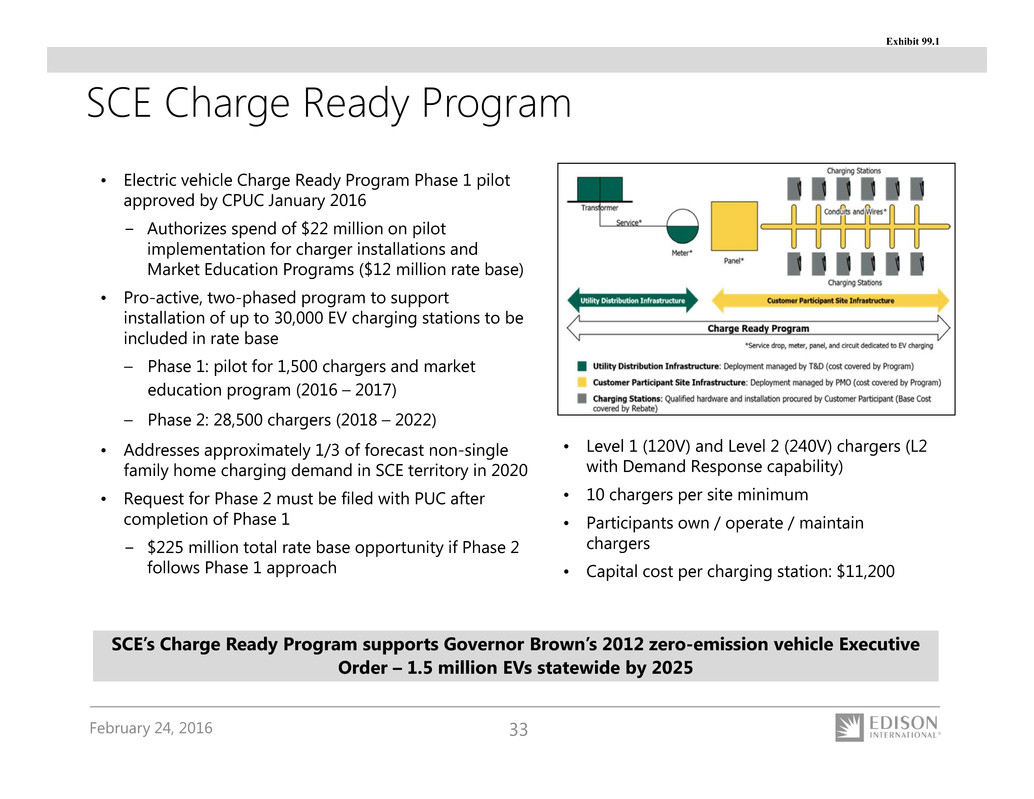
February 24, 2016 33 SCE Charge Ready Program • Electric vehicle Charge Ready Program Phase 1 pilot approved by CPUC January 2016 − Authorizes spend of $22 million on pilot implementation for charger installations and Market Education Programs ($12 million rate base) • Pro-active, two-phased program to support installation of up to 30,000 EV charging stations to be included in rate base – Phase 1: pilot for 1,500 chargers and market education program (2016 – 2017) – Phase 2: 28,500 chargers (2018 – 2022) • Addresses approximately 1/3 of forecast non-single family home charging demand in SCE territory in 2020 • Request for Phase 2 must be filed with PUC after completion of Phase 1 − $225 million total rate base opportunity if Phase 2 follows Phase 1 approach SCE’s Charge Ready Program supports Governor Brown’s 2012 zero-emission vehicle Executive Order – 1.5 million EVs statewide by 2025 • Level 1 (120V) and Level 2 (240V) chargers (L2 with Demand Response capability) • 10 chargers per site minimum • Participants own / operate / maintain chargers • Capital cost per charging station: $11,200 Exhibit 99.1
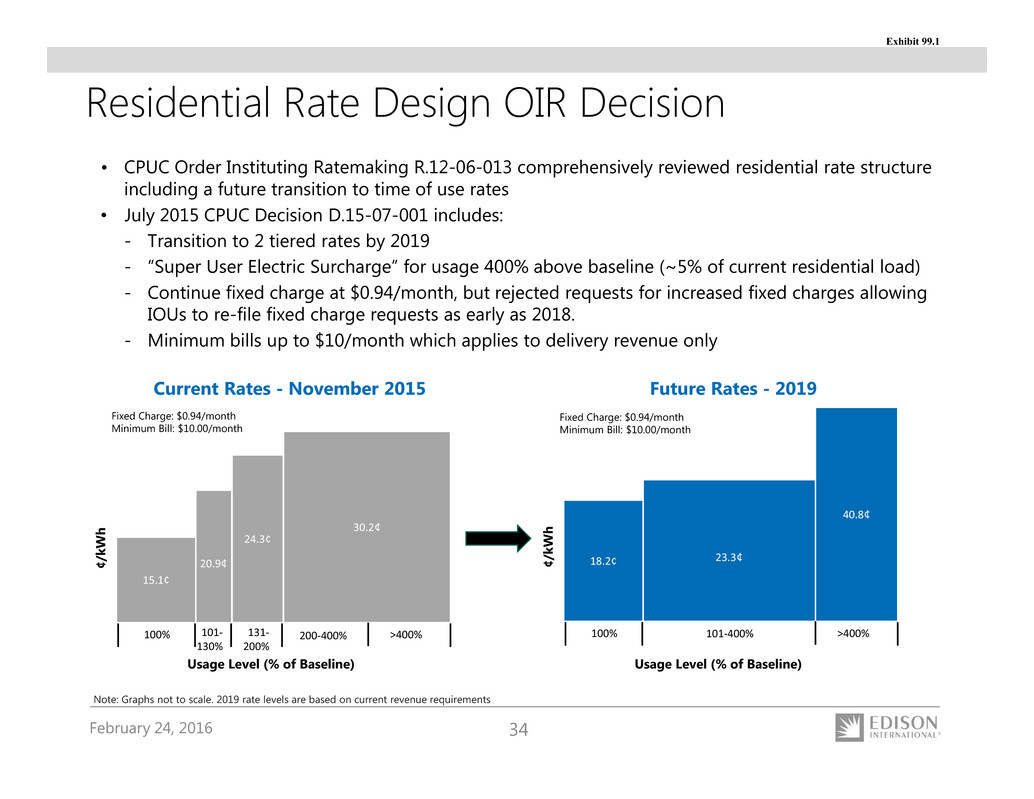
February 24, 2016 34 Residential Rate Design OIR Decision • CPUC Order Instituting Ratemaking R.12-06-013 comprehensively reviewed residential rate structure including a future transition to time of use rates • July 2015 CPUC Decision D.15-07-001 includes: - Transition to 2 tiered rates by 2019 - “Super User Electric Surcharge” for usage 400% above baseline (~5% of current residential load) - Continue fixed charge at $0.94/month, but rejected requests for increased fixed charges allowing IOUs to re-file fixed charge requests as early as 2018. - Minimum bills up to $10/month which applies to delivery revenue only Current Rates - November 2015 18.2¢ 40.8¢ 100% 101‐400% >400% 23.3¢ Usage Level (% of Baseline) ¢ / k W h Future Rates - 2019 Usage Level (% of Baseline) 15.1¢ 24.3¢ 30.2¢ 100% 101‐ 130% 131‐ 200% 200‐400% >400% 20.9¢ ¢ / k W h Fixed Charge: $0.94/month Minimum Bill: $10.00/month Fixed Charge: $0.94/month Minimum Bill: $10.00/month Note: Graphs not to scale. 2019 rate levels are based on current revenue requirements Exhibit 99.1
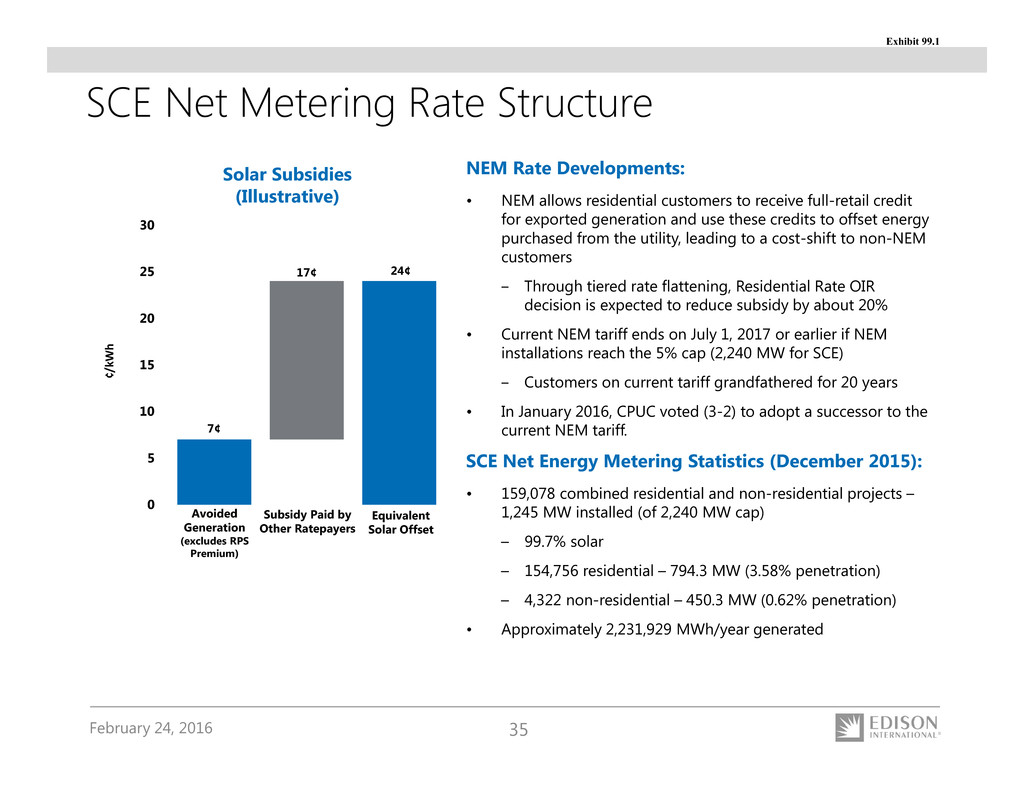
February 24, 2016 35 SCE Net Metering Rate Structure 7¢ 24¢17¢ 0 5 10 15 20 25 30 ¢ / k W h Solar Subsidies (Illustrative) Avoided Generation (excludes RPS Premium) Subsidy Paid by Other Ratepayers Equivalent Solar Offset NEM Rate Developments: • NEM allows residential customers to receive full-retail credit for exported generation and use these credits to offset energy purchased from the utility, leading to a cost-shift to non-NEM customers ‒ Through tiered rate flattening, Residential Rate OIR decision is expected to reduce subsidy by about 20% • Current NEM tariff ends on July 1, 2017 or earlier if NEM installations reach the 5% cap (2,240 MW for SCE) ‒ Customers on current tariff grandfathered for 20 years • In January 2016, CPUC voted (3-2) to adopt a successor to the current NEM tariff. SCE Net Energy Metering Statistics (December 2015): • 159,078 combined residential and non-residential projects – 1,245 MW installed (of 2,240 MW cap) – 99.7% solar – 154,756 residential – 794.3 MW (3.58% penetration) – 4,322 non-residential – 450.3 MW (0.62% penetration) • Approximately 2,231,929 MWh/year generated Exhibit 99.1
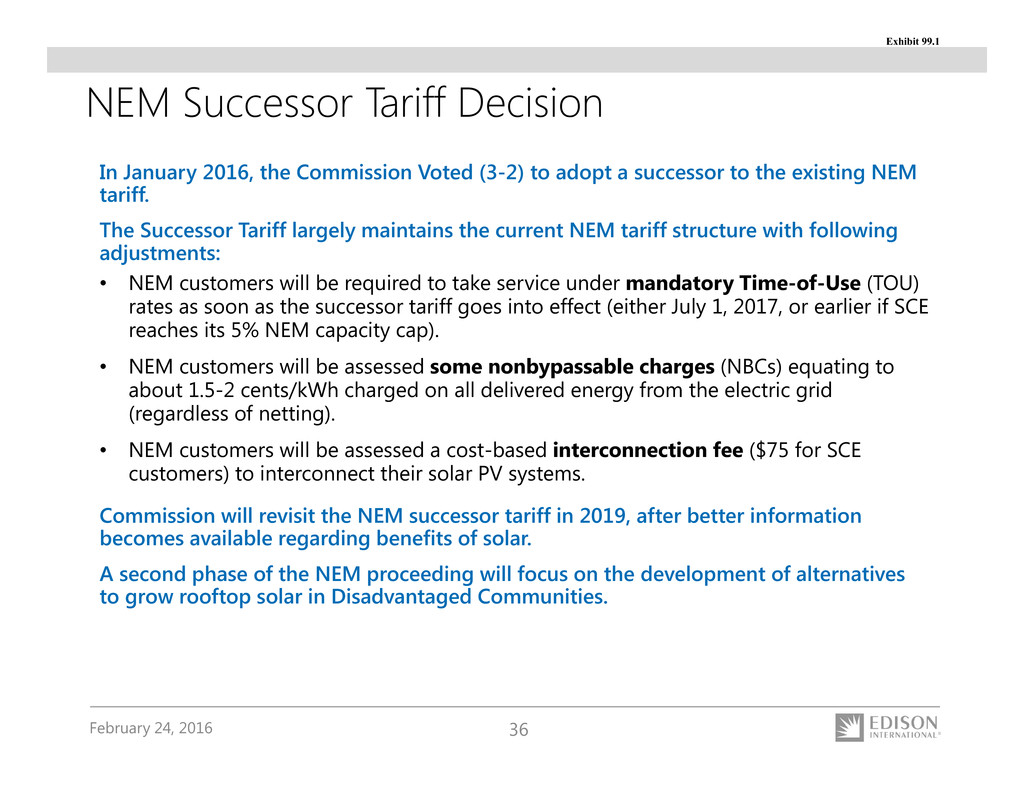
February 24, 2016 36 In January 2016, the Commission Voted (3-2) to adopt a successor to the existing NEM tariff. The Successor Tariff largely maintains the current NEM tariff structure with following adjustments: • NEM customers will be required to take service under mandatory Time-of-Use (TOU) rates as soon as the successor tariff goes into effect (either July 1, 2017, or earlier if SCE reaches its 5% NEM capacity cap). • NEM customers will be assessed some nonbypassable charges (NBCs) equating to about 1.5-2 cents/kWh charged on all delivered energy from the electric grid (regardless of netting). • NEM customers will be assessed a cost-based interconnection fee ($75 for SCE customers) to interconnect their solar PV systems. Commission will revisit the NEM successor tariff in 2019, after better information becomes available regarding benefits of solar. A second phase of the NEM proceeding will focus on the development of alternatives to grow rooftop solar in Disadvantaged Communities. NEM Successor Tariff Decision Exhibit 99.1
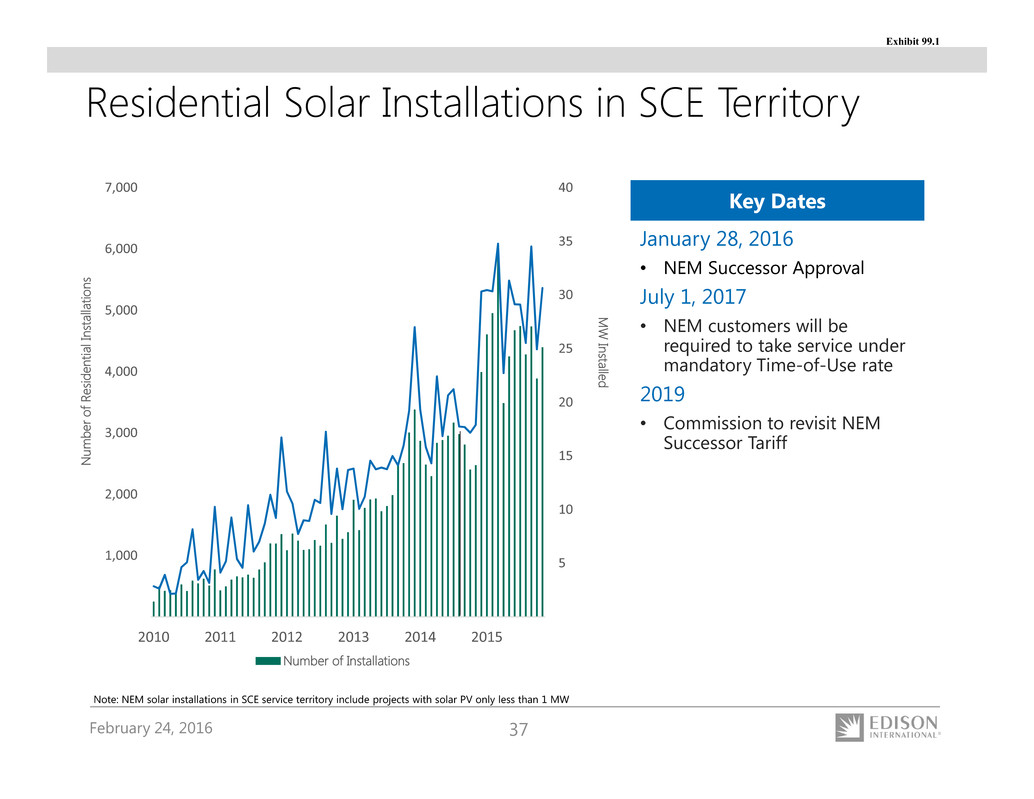
February 24, 2016 37 Note: NEM solar installations in SCE service territory include projects with solar PV only less than 1 MW Residential Solar Installations in SCE Territory 5 10 15 20 25 30 35 40 1,000 2,000 3,000 4,000 5,000 6,000 7,000 2010 2011 2012 2013 2014 2015 M W Installed N u m b e r o f R e s i d e n t i a l I n s t a l l a t i o n s Number of Installations January 28, 2016 • NEM Successor Approval July 1, 2017 • NEM customers will be required to take service under mandatory Time-of-Use rate 2019 • Commission to revisit NEM Successor Tariff Key Dates Exhibit 99.1
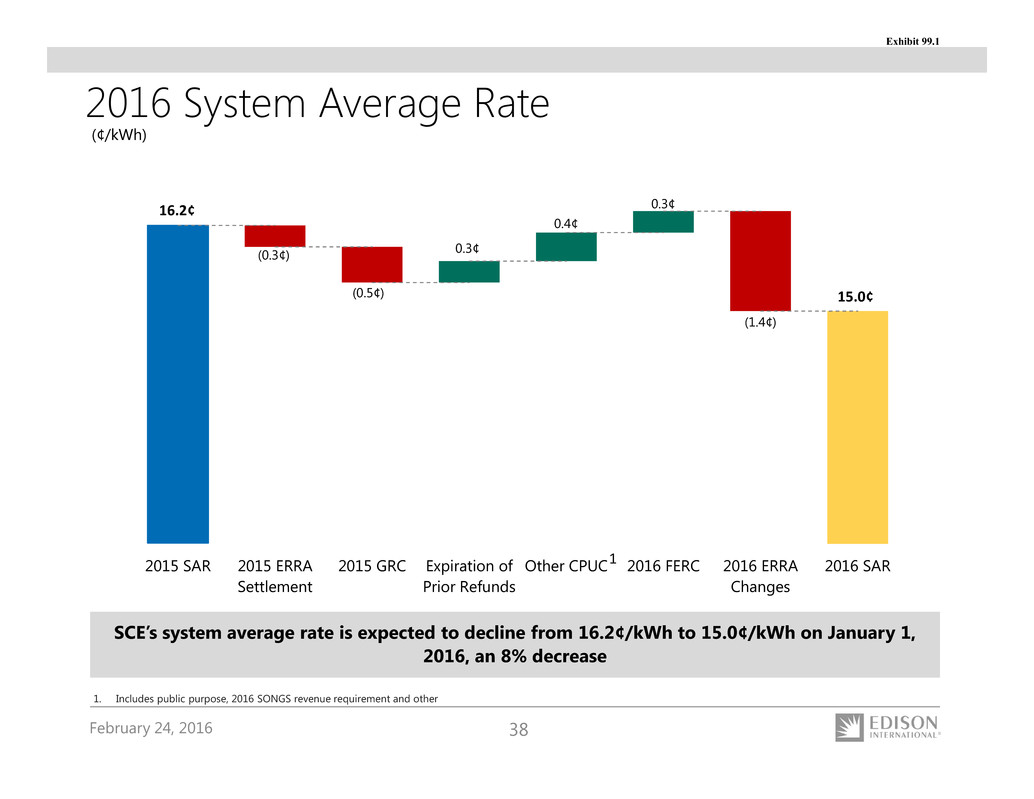
February 24, 2016 38 (0.3¢) (0.5¢) (1.4¢) 0.3¢ 0.4¢ 0.3¢ 4.00 2015 SAR 2015 ERRA Settlement 2015 GRC Expiration of Prior Refunds Other CPUC 2016 FERC 2016 ERRA Changes 2016 SAR 2016 System Average Rate SCE’s system average rate is expected to decline from 16.2¢/kWh to 15.0¢/kWh on January 1, 2016, an 8% decrease (¢/kWh) 1. Includes public purpose, 2016 SONGS revenue requirement and other 1 15.0¢ 16.2¢ Exhibit 99.1
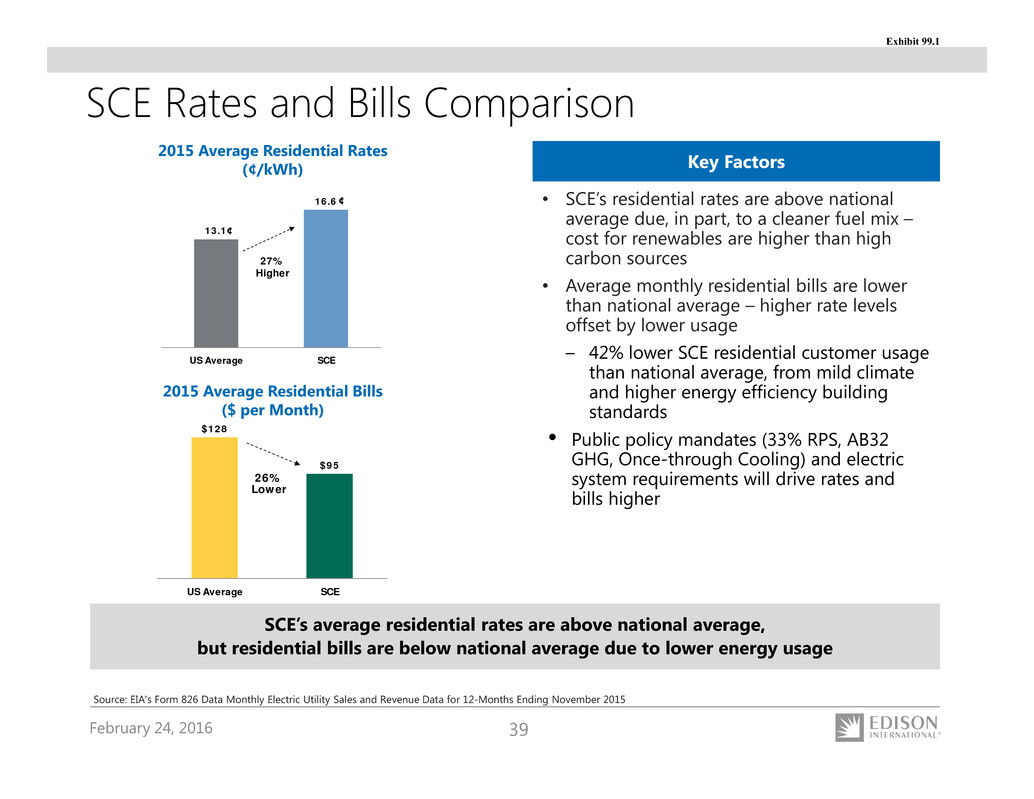
February 24, 2016 39 SCE Rates and Bills Comparison 13.1 16.6 US Average SCE 27% Higher 2015 Average Residential Rates (¢/kWh) 2015 Average Residential Bills ($ per Month) ¢ ¢ SCE’s average residential rates are above national average, but residential bills are below national average due to lower energy usage • SCE’s residential rates are above national average due, in part, to a cleaner fuel mix – cost for renewables are higher than high carbon sources • Average monthly residential bills are lower than national average – higher rate levels offset by lower usage – 42% lower SCE residential customer usage than national average, from mild climate and higher energy efficiency building standards • Public policy mandates (33% RPS, AB32 GHG, Once-through Cooling) and electric system requirements will drive rates and bills higher Key FactorsKey Factors Source: EIA's Form 826 Data Monthly Electric Utility Sales and Revenue Data for 12-Months Ending November 2015 $128 $95 US Average SCE 26% Lower Exhibit 99.1
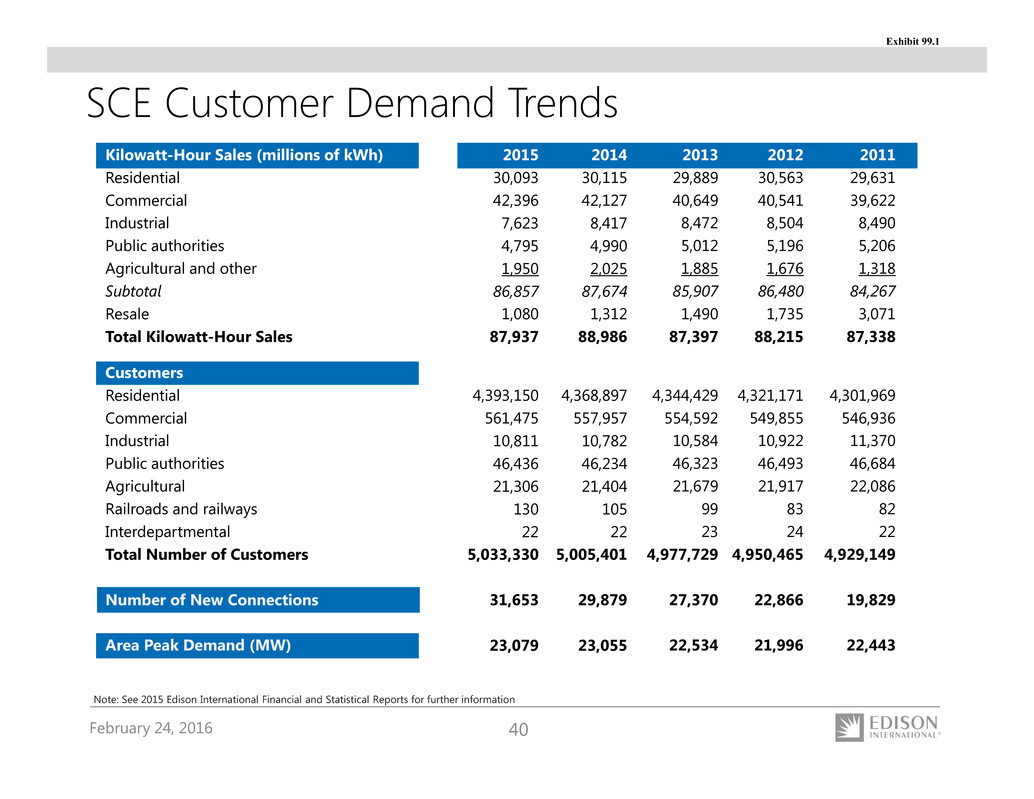
February 24, 2016 40 SCE Customer Demand Trends Kilowatt-Hour Sales (millions of kWh) Residential Commercial Industrial Public authorities Agricultural and other Subtotal Resale Total Kilowatt-Hour Sales Customers Residential Commercial Industrial Public authorities Agricultural Railroads and railways Interdepartmental Total Number of Customers Number of New Connections Area Peak Demand (MW) 2012 30,563 40,541 8,504 5,196 1,676 86,480 1,735 88,215 4,321,171 549,855 10,922 46,493 21,917 83 24 4,950,465 22,866 21,996 2011 29,631 39,622 8,490 5,206 1,318 84,267 3,071 87,338 4,301,969 546,936 11,370 46,684 22,086 82 22 4,929,149 19,829 22,443 2013 29,889 40,649 8,472 5,012 1,885 85,907 1,490 87,397 4,344,429 554,592 10,584 46,323 21,679 99 23 4,977,729 27,370 22,534 Note: See 2015 Edison International Financial and Statistical Reports for further information 2014 30,115 42,127 8,417 4,990 2,025 87,674 1,312 88,986 4,368,897 557,957 10,782 46,234 21,404 105 22 5,005,401 29,879 23,055 2015 30,093 42,396 7,623 4,795 1,950 86,857 1,080 87,937 4,393,150 561,475 10,811 46,436 21,306 130 22 5,033,330 31,653 23,079 Exhibit 99.1
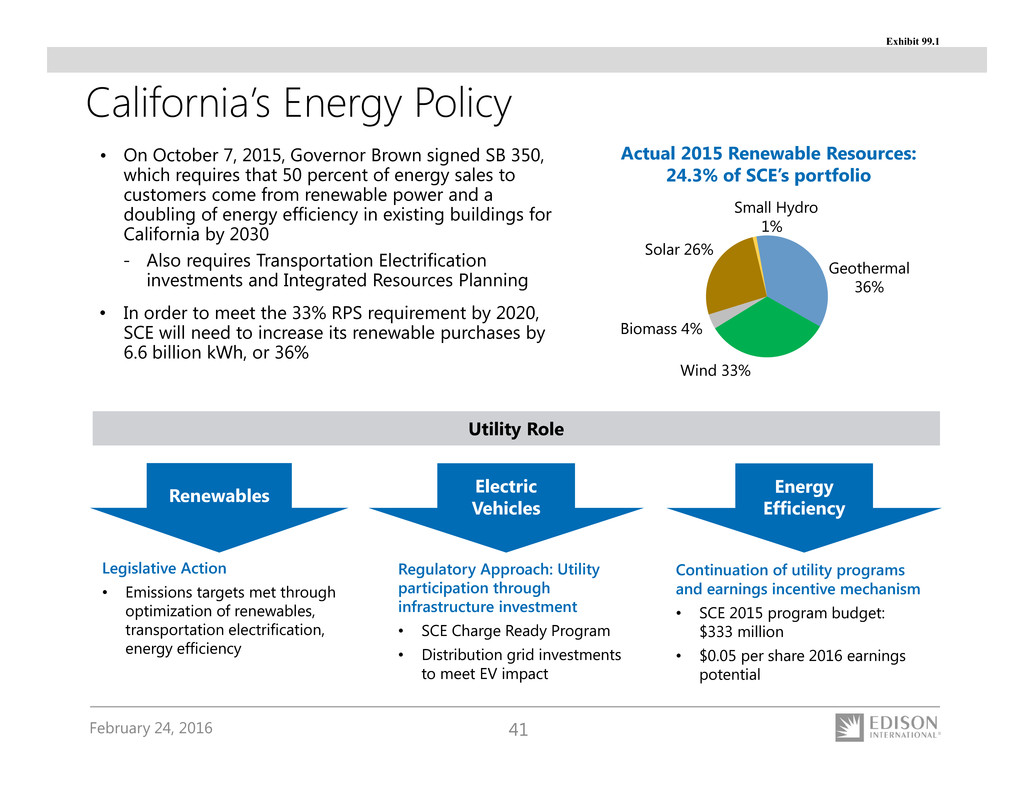
February 24, 2016 41 California’s Energy Policy • On October 7, 2015, Governor Brown signed SB 350, which requires that 50 percent of energy sales to customers come from renewable power and a doubling of energy efficiency in existing buildings for California by 2030 - Also requires Transportation Electrification investments and Integrated Resources Planning • In order to meet the 33% RPS requirement by 2020, SCE will need to increase its renewable purchases by 6.6 billion kWh, or 36% Renewables Electric Vehicles Energy Efficiency Legislative Action • Emissions targets met through optimization of renewables, transportation electrification, energy efficiency Regulatory Approach: Utility participation through infrastructure investment • SCE Charge Ready Program • Distribution grid investments to meet EV impact Continuation of utility programs and earnings incentive mechanism • SCE 2015 program budget: $333 million • $0.05 per share 2016 earnings potential Utility Role Solar 26% Small Hydro 1% Geothermal 36% Wind 33% Actual 2015 Renewable Resources: 24.3% of SCE’s portfolio Biomass 4% Exhibit 99.1
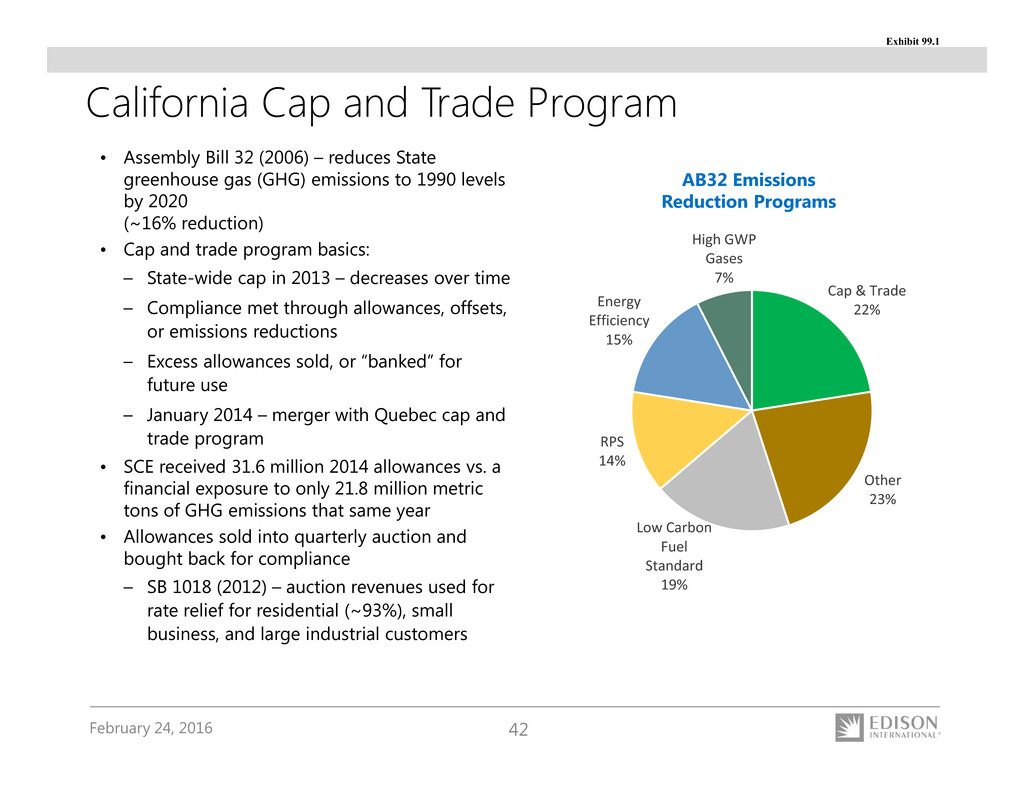
February 24, 2016 42 • Assembly Bill 32 (2006) – reduces State greenhouse gas (GHG) emissions to 1990 levels by 2020 (~16% reduction) • Cap and trade program basics: – State-wide cap in 2013 – decreases over time – Compliance met through allowances, offsets, or emissions reductions – Excess allowances sold, or “banked” for future use – January 2014 – merger with Quebec cap and trade program • SCE received 31.6 million 2014 allowances vs. a financial exposure to only 21.8 million metric tons of GHG emissions that same year • Allowances sold into quarterly auction and bought back for compliance – SB 1018 (2012) – auction revenues used for rate relief for residential (~93%), small business, and large industrial customers AB32 Emissions Reduction Programs Cap & Trade 22% Other 23% Low Carbon Fuel Standard 19% RPS 14% Energy Efficiency 15% High GWP Gases 7% California Cap and Trade Program Exhibit 99.1
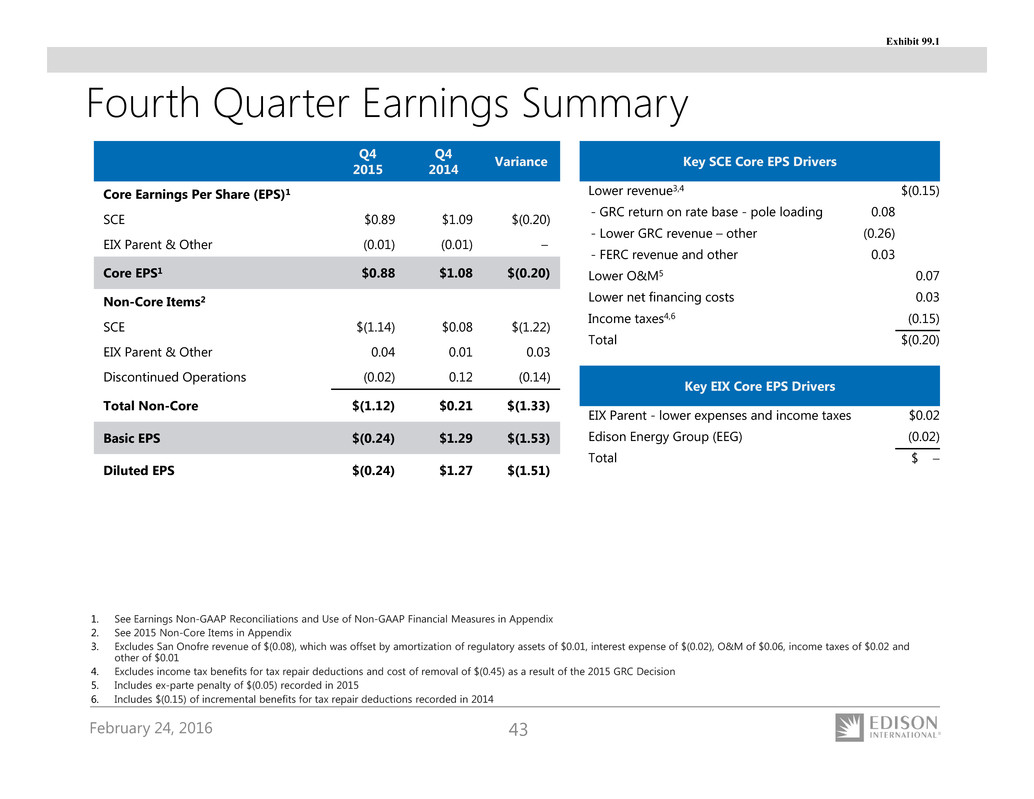
February 24, 2016 43 Q4 2015 Q4 2014 Variance Core Earnings Per Share (EPS)1 SCE $0.89 $1.09 $(0.20) EIX Parent & Other (0.01) (0.01) – Core EPS1 $0.88 $1.08 $(0.20) Non-Core Items2 SCE $(1.14) $0.08 $(1.22) EIX Parent & Other 0.04 0.01 0.03 Discontinued Operations (0.02) 0.12 (0.14) Total Non-Core $(1.12) $0.21 $(1.33) Basic EPS $(0.24) $1.29 $(1.53) Diluted EPS $(0.24) $1.27 $(1.51) Key SCE Core EPS Drivers Lower revenue3,4 $(0.15) - GRC return on rate base - pole loading 0.08 - Lower GRC revenue – other (0.26) - FERC revenue and other 0.03 Lower O&M5 0.07 Lower net financing costs 0.03 Income taxes4,6 (0.15) Total $(0.20) Fourth Quarter Earnings Summary Key EIX Core EPS Drivers EIX Parent - lower expenses and income taxes $0.02 Edison Energy Group (EEG) (0.02) Total $ 1. See Earnings Non-GAAP Reconciliations and Use of Non-GAAP Financial Measures in Appendix 2. See 2015 Non-Core Items in Appendix 3. Excludes San Onofre revenue of $(0.08), which was offset by amortization of regulatory assets of $0.01, interest expense of $(0.02), O&M of $0.06, income taxes of $0.02 and other of $0.01 4. Excludes income tax benefits for tax repair deductions and cost of removal of $(0.45) as a result of the 2015 GRC Decision 5. Includes ex-parte penalty of $(0.05) recorded in 2015 6. Includes $(0.15) of incremental benefits for tax repair deductions recorded in 2014 Exhibit 99.1
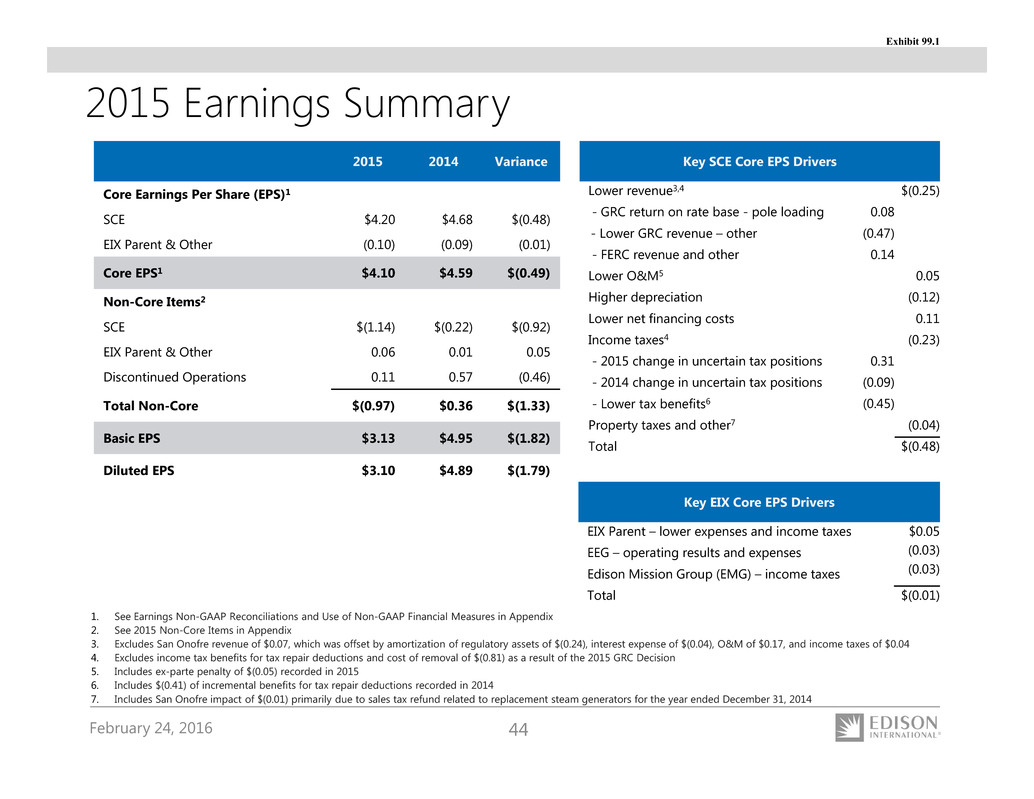
February 24, 2016 44 2015 2014 Variance Core Earnings Per Share (EPS)1 SCE $4.20 $4.68 $(0.48) EIX Parent & Other (0.10) (0.09) (0.01) Core EPS1 $4.10 $4.59 $(0.49) Non-Core Items2 SCE $(1.14) $(0.22) $(0.92) EIX Parent & Other 0.06 0.01 0.05 Discontinued Operations 0.11 0.57 (0.46) Total Non-Core $(0.97) $0.36 $(1.33) Basic EPS $3.13 $4.95 $(1.82) Diluted EPS $3.10 $4.89 $(1.79) 2015 Earnings Summary 1. See Earnings Non-GAAP Reconciliations and Use of Non-GAAP Financial Measures in Appendix 2. See 2015 Non-Core Items in Appendix 3. Excludes San Onofre revenue of $0.07, which was offset by amortization of regulatory assets of $(0.24), interest expense of $(0.04), O&M of $0.17, and income taxes of $0.04 4. Excludes income tax benefits for tax repair deductions and cost of removal of $(0.81) as a result of the 2015 GRC Decision 5. Includes ex-parte penalty of $(0.05) recorded in 2015 6. Includes $(0.41) of incremental benefits for tax repair deductions recorded in 2014 7. Includes San Onofre impact of $(0.01) primarily due to sales tax refund related to replacement steam generators for the year ended December 31, 2014 Key SCE Core EPS Drivers Lower revenue3,4 $(0.25) - GRC return on rate base - pole loading 0.08 - Lower GRC revenue – other (0.47) - FERC revenue and other 0.14 Lower O&M5 0.05 Higher depreciation (0.12) Lower net financing costs 0.11 Income taxes4 (0.23) - 2015 change in uncertain tax positions 0.31 - 2014 change in uncertain tax positions (0.09) - Lower tax benefits6 (0.45) Property taxes and other7 (0.04) Total $(0.48) Key EIX Core EPS Drivers EIX Parent – lower expenses and income taxes $0.05 (0.03) (0.03) EEG – operating results and expenses Edison Mission Group (EMG) – income taxes Total $(0.01) Exhibit 99.1
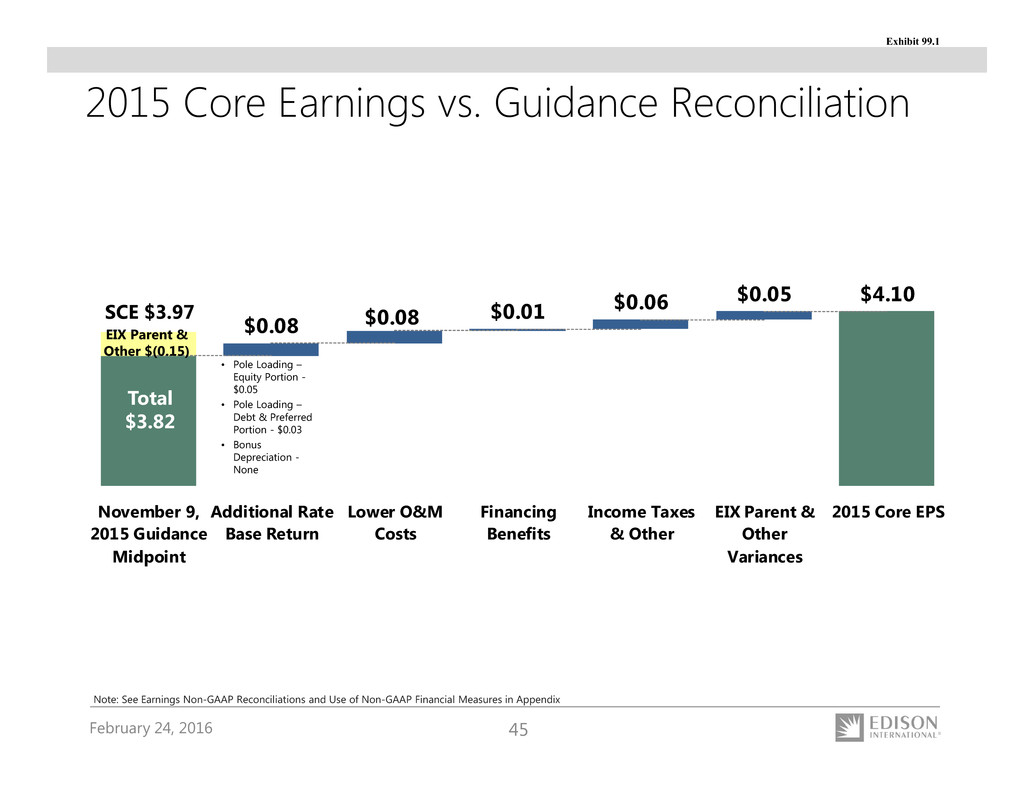
February 24, 2016 45 2015 Core Earnings vs. Guidance Reconciliation $0.08 $0.08 $0.01 $0.06 $0.05 $4.10 November 9, 2015 Guidance Midpoint Additional Rate Base Return Lower O&M Costs Financing Benefits Income Taxes & Other EIX Parent & Other Variances 2015 Core EPS • Pole Loading – Equity Portion - $0.05 • Pole Loading – Debt & Preferred Portion - $0.03 • Bonus Depreciation - None Note: See Earnings Non-GAAP Reconciliations and Use of Non-GAAP Financial Measures in Appendix Total $3.82 SCE $3.97 EIX Parent & Other $(0.15) Exhibit 99.1

February 24, 2016 46 $6,305 — 1,977 1,915 334 — 4,226 2,079 (525) 64 1,618 507 1,111 113 $998 $5,180 4,266 913 — — — 5,179 1 (1) — — — — — $— $11,485 4,266 2,890 1,915 334 — 9,405 2,080 (526) 64 1,618 507 1,111 113 $998 $1,368 (370) $998 SCE Results of Operations • Utility earning activities – revenue authorized by CPUC and FERC to provide reasonable cost recovery and return on investment • Utility cost-recovery activities – CPUC- and FERC-authorized balancing accounts to recover specific project or program costs, subject to reasonableness review or compliance with upfront standards Utility Earning Activities Utility Cost- Recovery Activities Total Consolidated 2015 Utility Earning Activities Utility Cost- Recovery Activities Total Consolidated 2014 Operating revenue Purchased power and fuel Operation and maintenance Depreciation, decommissioning and amortization Property and other taxes Impairment and other charges Total operating expenses Operating income Interest expense Other income and expenses Income before income taxes Income tax expense Net income Preferred and preference stock dividend requirements Net income available for common stock Core earnings Non-core earnings Total SCE GAAP earnings Note: See Use of Non-GAAP Financial Measures in Appendix ($ millions) $6,831 — 2,106 1,720 318 163 4,307 2,524 (528) 43 2,039 474 1,565 112 $1,453 $6,549 5,593 951 — — — 6,544 5 (5) — — — — — $— $13,380 5,593 3,057 1,720 318 163 10,851 2,529 (533) 43 2,039 474 1,565 112 $1,453 $1,525 (72) $1,453 Exhibit 99.1
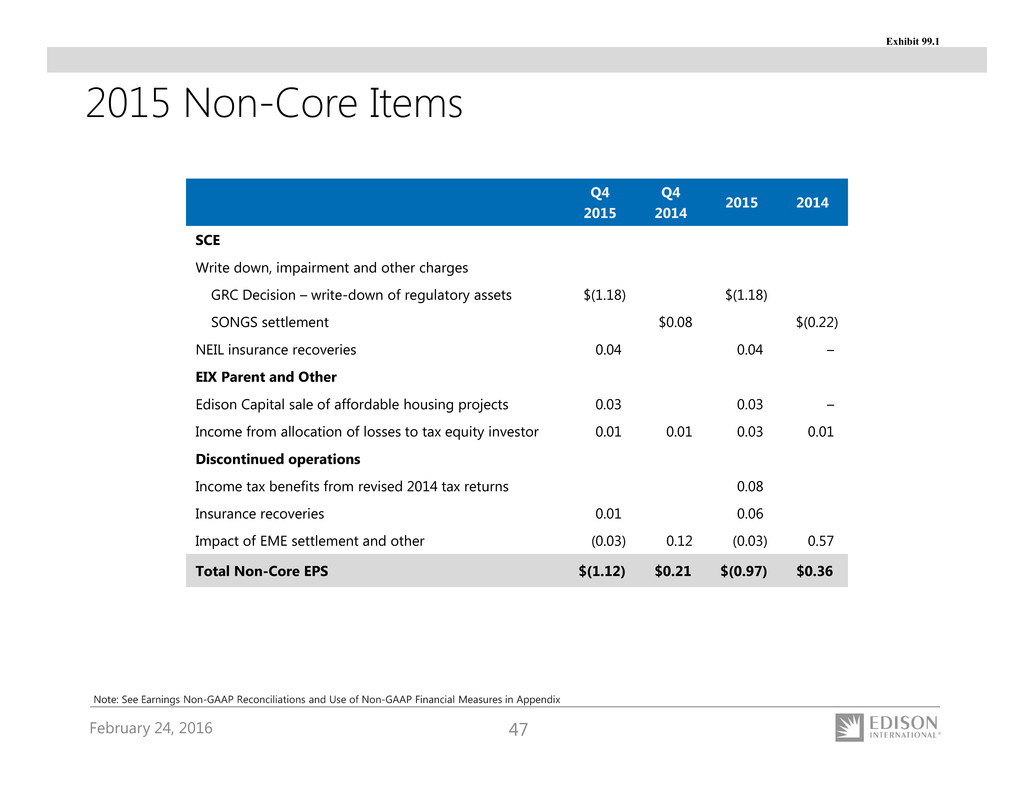
February 24, 2016 47 Q4 2015 Q4 2014 2015 2014 SCE Write down, impairment and other charges GRC Decision – write-down of regulatory assets $(1.18) $(1.18) SONGS settlement $0.08) $(0.22) NEIL insurance recoveries 0.04) 0.04) –) EIX Parent and Other Edison Capital sale of affordable housing projects 0.03) 0.03) –) Income from allocation of losses to tax equity investor 0.01) 0.01) 0.03) 0.01) Discontinued operations Income tax benefits from revised 2014 tax returns 0.08) Insurance recoveries 0.01) 0.06) Impact of EME settlement and other (0.03) 0.12) (0.03) 0.57) Total Non-Core EPS $(1.12) $0.21) $(0.97) $0.36) 2015 Non-Core Items Note: See Earnings Non-GAAP Reconciliations and Use of Non-GAAP Financial Measures in Appendix Exhibit 99.1

February 24, 2016 48 Earnings Non-GAAP Reconciliations Reconciliation of EIX Core Earnings to EIX GAAP Earnings Core Earnings SCE EIX Parent & Other Core Earnings Non-Core Items SCE EIX Parent & Other Discontinued operations Total Non-Core Basic Earnings $356 (1) $355 $24 2 39 $65 $420 $290 (3) $287 $(370) 12 (8) $(366) $(79) Note: See Use of Non-GAAP Financial Measures in Appendix $1,525 (28) $1,497 $(72) 2 185 $115 $1,612 $1,368 (32) $1,336 $(370) 19 35 $(316) $1,020 ($ millions) Q4 2014 Q4 2015 20142015Earnings Attributable to Edison International Exhibit 99.1
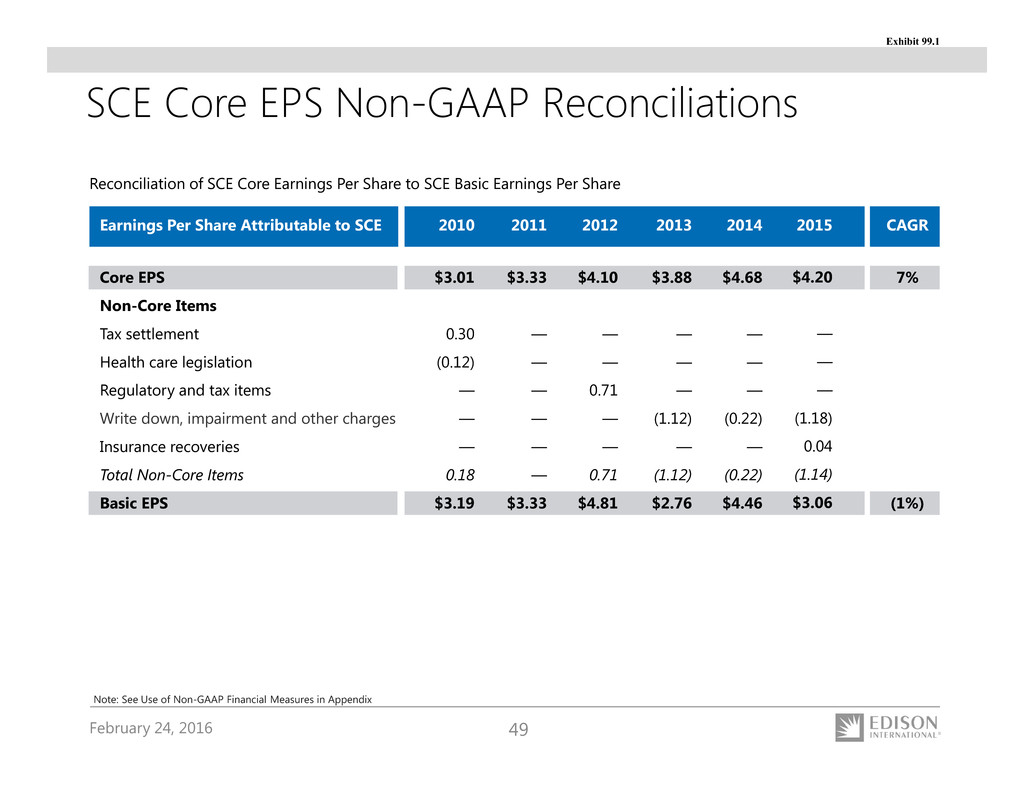
February 24, 2016 49 SCE Core EPS Non-GAAP Reconciliations Core EPS Non-Core Items Tax settlement Health care legislation Regulatory and tax items Write down, impairment and other charges Insurance recoveries Total Non-Core Items Basic EPS Reconciliation of SCE Core Earnings Per Share to SCE Basic Earnings Per Share $3.01 0.30 (0.12) — — — 0.18 $3.19 7% (1%) $3.33 — — — — — — $3.33 $4.10 — — 0.71 — — 0.71 $4.81 $3.88 — — — (1.12) — (1.12) $2.76 Note: See Use of Non-GAAP Financial Measures in Appendix $4.68 — — — (0.22) — (0.22) $4.46 $4.20 — — — (1.18) 0.04 (1.14) $3.06 Earnings Per Share Attributable to SCE 2010 CAGR2011 2012 2013 2014 2015 Exhibit 99.1
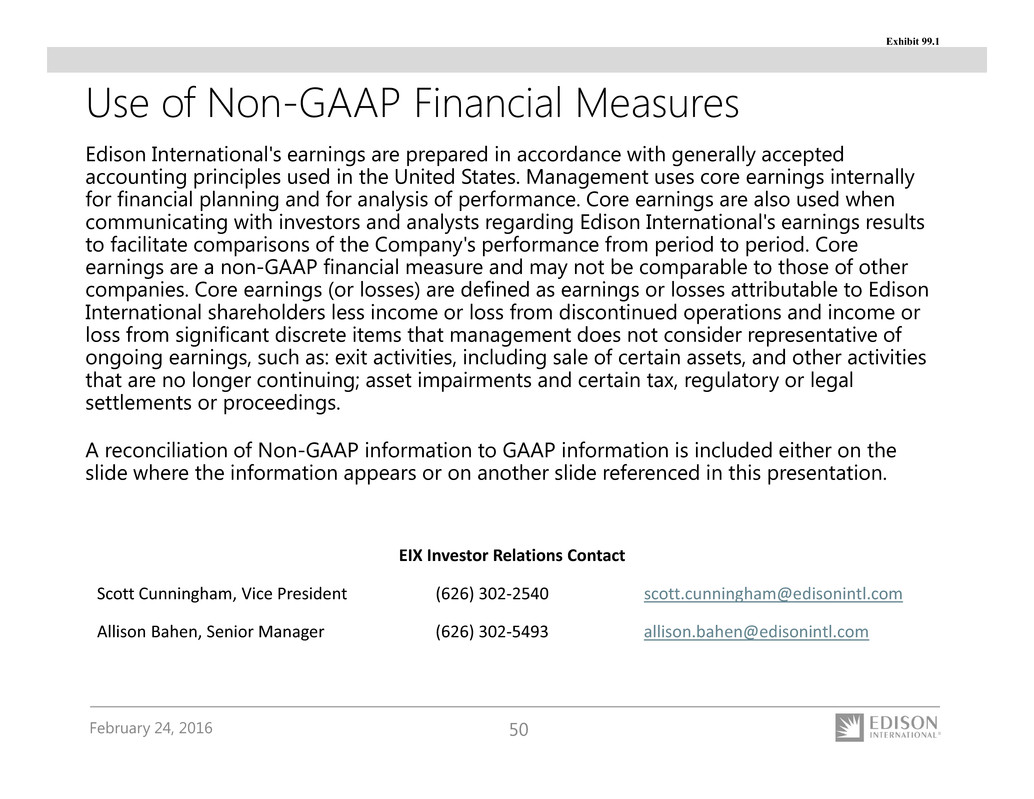
February 24, 2016 50 Use of Non-GAAP Financial Measures Edison International's earnings are prepared in accordance with generally accepted accounting principles used in the United States. Management uses core earnings internally for financial planning and for analysis of performance. Core earnings are also used when communicating with investors and analysts regarding Edison International's earnings results to facilitate comparisons of the Company's performance from period to period. Core earnings are a non-GAAP financial measure and may not be comparable to those of other companies. Core earnings (or losses) are defined as earnings or losses attributable to Edison International shareholders less income or loss from discontinued operations and income or loss from significant discrete items that management does not consider representative of ongoing earnings, such as: exit activities, including sale of certain assets, and other activities that are no longer continuing; asset impairments and certain tax, regulatory or legal settlements or proceedings. A reconciliation of Non-GAAP information to GAAP information is included either on the slide where the information appears or on another slide referenced in this presentation. EIX Investor Relations Contact Scott Cunningham, Vice President (626) 302‐2540 scott.cunningham@edisonintl.com Allison Bahen, Senior Manager (626) 302‐5493 allison.bahen@edisonintl.com Exhibit 99.1


