Exhibit 99.3 Third Quarter 2018 Financial Results October 30, 2018
Forward-Looking Statements Statements contained in this presentation about future performance, including, without limitation, operating results, capital expenditures, rate base growth, dividend policy, financial outlook, and other statements that are not purely historical, are forward-looking statements. These forward-looking statements reflect our current expectations; however, such statements involve risks and uncertainties. Actual results could differ materially from current expectations. These forward-looking statements represent our expectations only as of the date of this presentation, and Edison International assumes no duty to update them to reflect new information, events or circumstances. Important factors that could cause different results include, but are not limited to the: • ability of SCE to recover its costs through regulated rates, including costs related to uninsured wildfire-related and mudslide-related liabilities and capital spending incurred prior to explicit regulatory approval; • ability to obtain sufficient insurance at a reasonable cost, including insurance relating to SCE's nuclear facilities and wildfire-related and mudslide-related exposure, and to recover the costs of such insurance or, in the absence of insurance, the ability to recover uninsured losses; • decisions and other actions by the CPUC, the FERC, the NRC and other regulatory authorities, including determinations of authorized rates of return or return on equity, the 2018 GRC, the recoverability of wildfire-related and mudslide-related costs, and delays in regulatory actions; • ability of Edison International or SCE to borrow funds and access the bank and capital markets on reasonable terms; • actions by credit rating agencies to downgrade our credit ratings or those of our subsidiaries or to place those ratings on negative watch or outlook; • risks associated with the decommissioning of San Onofre, including those related to public opposition, permitting, governmental approvals, on-site storage of spent nuclear fuel, delays, contractual disputes, and cost overruns; • extreme weather-related incidents and other natural disasters (including earthquakes and events caused, or exacerbated, by climate change, such as wildfires), which could cause, among other things, public safety issues, property damage and operational issues; • risks associated with cost allocation resulting in higher rates for utility bundled service customers because of possible customer bypass or departure for other electricity providers such as CCAs and Electric Service Providers; • risks inherent in SCE's transmission and distribution infrastructure investment program, including those related to project site identification, public opposition, environmental mitigation, construction, permitting, power curtailment costs (payments due under power contracts in the event there is insufficient transmission to enable acceptance of power delivery), changes in the CAISO's transmission plans, and governmental approvals; and • risks associated with the operation of transmission and distribution assets and power generating facilities, including public and employee safety issues, the risk of utility assets causing wildfires, failure, availability, efficiency and output of equipment and facilities, and availability and cost of spare parts. Other important factors are discussed under the headings “Forward-Looking Statements”, “Risk Factors” and “Management’s Discussion and Analysis” in Edison International’s Form 10-K and other reports filed with the Securities and Exchange Commission, which are available on our website: www.edisoninvestor.com. These filings also provide additional information on historical and other factual data contained in this presentation. 1
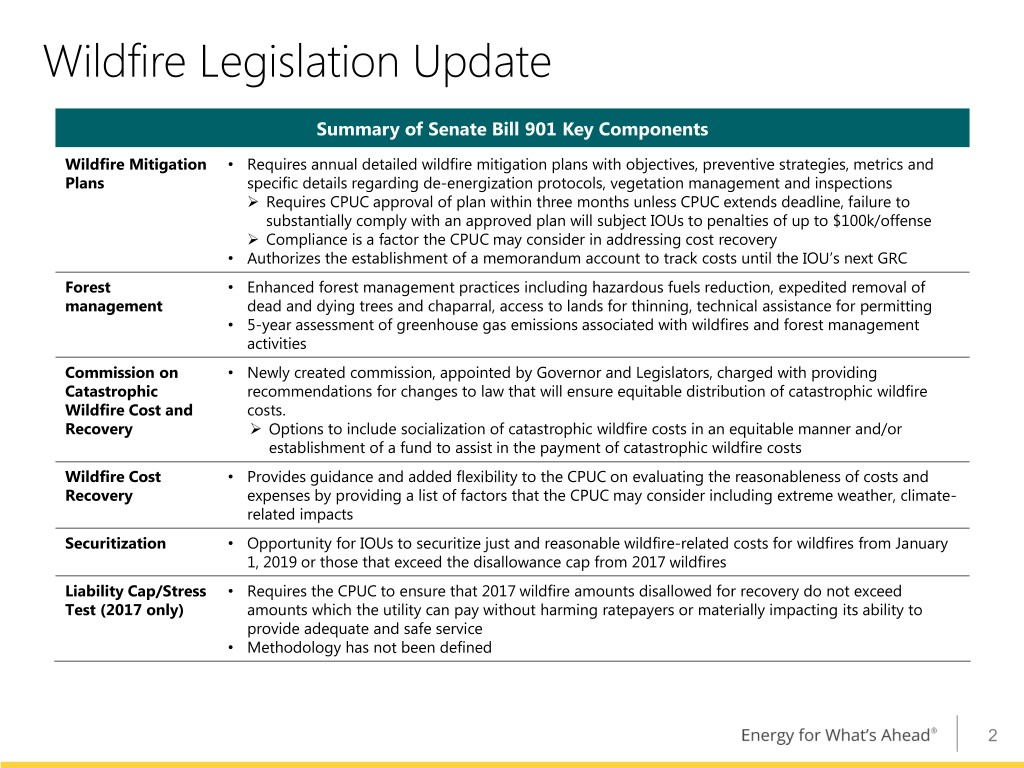
Wildfire Legislation Update Summary of Senate Bill 901 Key Components Wildfire Mitigation • Requires annual detailed wildfire mitigation plans with objectives, preventive strategies, metrics and Plans specific details regarding de-energization protocols, vegetation management and inspections Requires CPUC approval of plan within three months unless CPUC extends deadline, failure to substantially comply with an approved plan will subject IOUs to penalties of up to $100k/offense Compliance is a factor the CPUC may consider in addressing cost recovery • Authorizes the establishment of a memorandum account to track costs until the IOU’s next GRC Forest • Enhanced forest management practices including hazardous fuels reduction, expedited removal of management dead and dying trees and chaparral, access to lands for thinning, technical assistance for permitting • 5-year assessment of greenhouse gas emissions associated with wildfires and forest management activities Commission on • Newly created commission, appointed by Governor and Legislators, charged with providing Catastrophic recommendations for changes to law that will ensure equitable distribution of catastrophic wildfire Wildfire Cost and costs. Recovery Options to include socialization of catastrophic wildfire costs in an equitable manner and/or establishment of a fund to assist in the payment of catastrophic wildfire costs Wildfire Cost • Provides guidance and added flexibility to the CPUC on evaluating the reasonableness of costs and Recovery expenses by providing a list of factors that the CPUC may consider including extreme weather, climate- related impacts Securitization • Opportunity for IOUs to securitize just and reasonable wildfire-related costs for wildfires from January 1, 2019 or those that exceed the disallowance cap from 2017 wildfires Liability Cap/Stress • Requires the CPUC to ensure that 2017 wildfire amounts disallowed for recovery do not exceed Test (2017 only) amounts which the utility can pay without harming ratepayers or materially impacting its ability to provide adequate and safe service • Methodology has not been defined 2
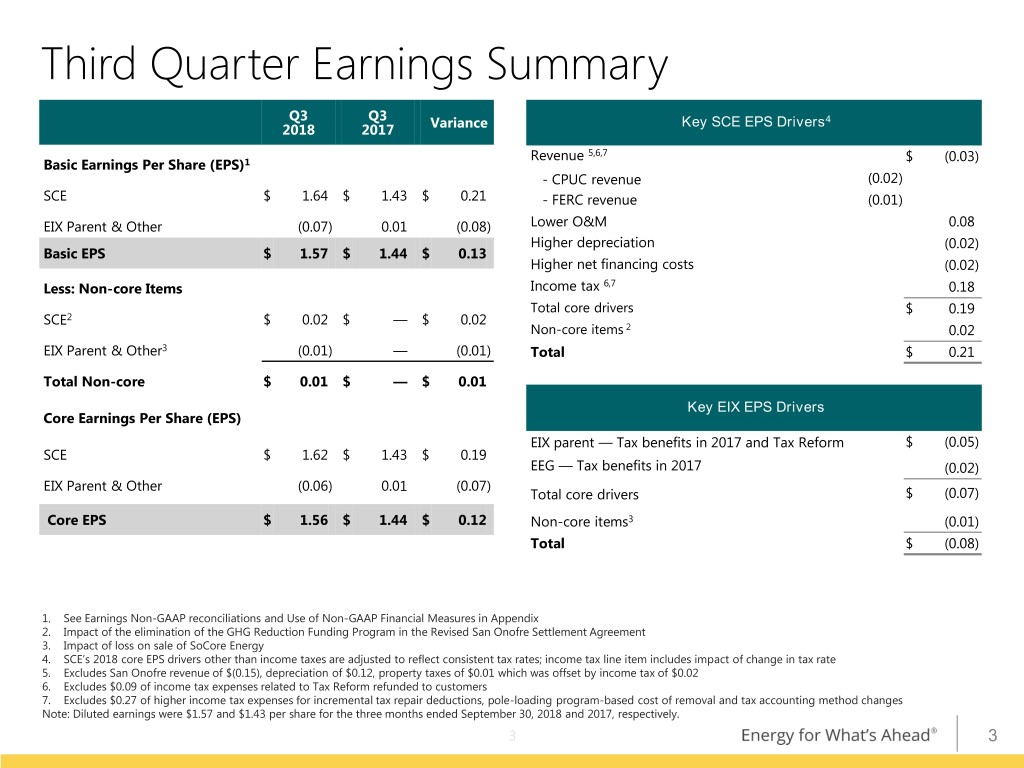
Third Quarter Earnings Summary Q3 Q3 Key SCE EPS Drivers4 2018 2017 Variance Revenue 5,6,7 $ (0.03) Basic Earnings Per Share (EPS)1 - CPUC revenue (0.02) SCE $ 1.64 $ 1.43 $ 0.21 - FERC revenue (0.01) EIX Parent & Other (0.07) 0.01 (0.08) Lower O&M 0.08 Higher depreciation (0.02) Basic EPS $ 1.57 $ 1.44 $ 0.13 Higher net financing costs (0.02) Less: Non-core Items Income tax 6,7 0.18 Total core drivers $ 0.19 SCE2 $ 0.02 $ — $ 0.02 Non-core items 2 0.02 EIX Parent & Other3 (0.01) — (0.01) Total $ 0.21 Total Non-core $ 0.01 $ — $ 0.01 Key EIX EPS Drivers Core Earnings Per Share (EPS) EIX parent — Tax benefits in 2017 and Tax Reform $ (0.05) SCE $ 1.62 $ 1.43 $ 0.19 EEG — Tax benefits in 2017 (0.02) EIX Parent & Other (0.06) 0.01 (0.07) Total core drivers $ (0.07) Core EPS $ 1.56 $ 1.44 $ 0.12 Non-core items3 (0.01) Total $ (0.08) 1. See Earnings Non-GAAP reconciliations and Use of Non-GAAP Financial Measures in Appendix 2. Impact of the elimination of the GHG Reduction Funding Program in the Revised San Onofre Settlement Agreement 3. Impact of loss on sale of SoCore Energy 4. SCE’s 2018 core EPS drivers other than income taxes are adjusted to reflect consistent tax rates; income tax line item includes impact of change in tax rate 5. Excludes San Onofre revenue of $(0.15), depreciation of $0.12, property taxes of $0.01 which was offset by income tax of $0.02 6. Excludes $0.09 of income tax expenses related to Tax Reform refunded to customers 7. Excludes $0.27 of higher income tax expenses for incremental tax repair deductions, pole-loading program-based cost of removal and tax accounting method changes Note: Diluted earnings were $1.57 and $1.43 per share for the three months ended September 30, 2018 and 2017, respectively. 3 3
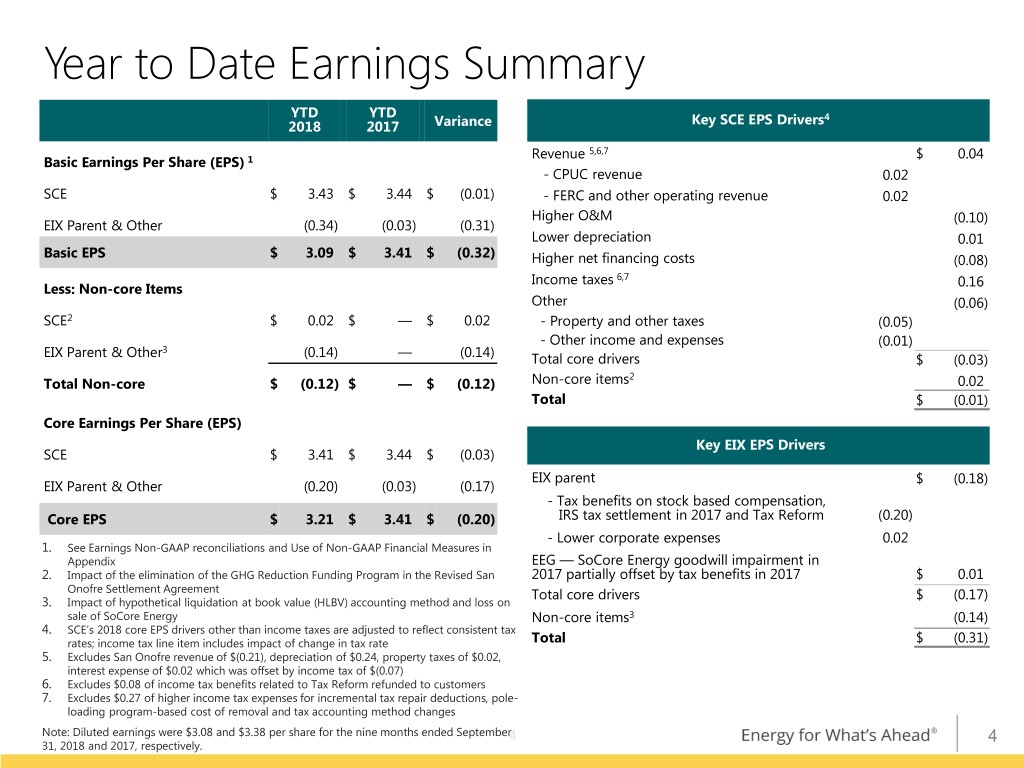
Year to Date Earnings Summary YTD YTD Key SCE EPS Drivers4 2018 2017 Variance Revenue 5,6,7 $ 0.04 Basic Earnings Per Share (EPS) 1 - CPUC revenue 0.02 SCE $ 3.43 $ 3.44 $ (0.01) - FERC and other operating revenue 0.02 Higher O&M (0.10) EIX Parent & Other (0.34) (0.03) (0.31) Lower depreciation 0.01 Basic EPS $ 3.09 $ 3.41 $ (0.32) Higher net financing costs (0.08) Income taxes 6,7 0.16 Less: Non-core Items Other (0.06) SCE2 $ 0.02 $ — $ 0.02 - Property and other taxes (0.05) - Other income and expenses (0.01) EIX Parent & Other3 (0.14) — (0.14) Total core drivers $ (0.03) 2 Total Non-core $ (0.12) $ — $ (0.12) Non-core items 0.02 Total $ (0.01) Core Earnings Per Share (EPS) Key EIX EPS Drivers SCE $ 3.41 $ 3.44 $ (0.03) EIX parent $ (0.18) EIX Parent & Other (0.20) (0.03) (0.17) - Tax benefits on stock based compensation, Core EPS $ 3.21 $ 3.41 $ (0.20) IRS tax settlement in 2017 and Tax Reform (0.20) - Lower corporate expenses 0.02 1. See Earnings Non-GAAP reconciliations and Use of Non-GAAP Financial Measures in Appendix EEG — SoCore Energy goodwill impairment in 2. Impact of the elimination of the GHG Reduction Funding Program in the Revised San 2017 partially offset by tax benefits in 2017 $ 0.01 Onofre Settlement Agreement Total core drivers $ (0.17) 3. Impact of hypothetical liquidation at book value (HLBV) accounting method and loss on sale of SoCore Energy Non-core items3 (0.14) 4. SCE’s 2018 core EPS drivers other than income taxes are adjusted to reflect consistent tax rates; income tax line item includes impact of change in tax rate Total $ (0.31) 5. Excludes San Onofre revenue of $(0.21), depreciation of $0.24, property taxes of $0.02, interest expense of $0.02 which was offset by income tax of $(0.07) 6. Excludes $0.08 of income tax benefits related to Tax Reform refunded to customers 7. Excludes $0.27 of higher income tax expenses for incremental tax repair deductions, pole- loading program-based cost of removal and tax accounting method changes Note: Diluted earnings were $3.08 and $3.38 per share for the nine months ended September4 4 31, 2018 and 2017, respectively.
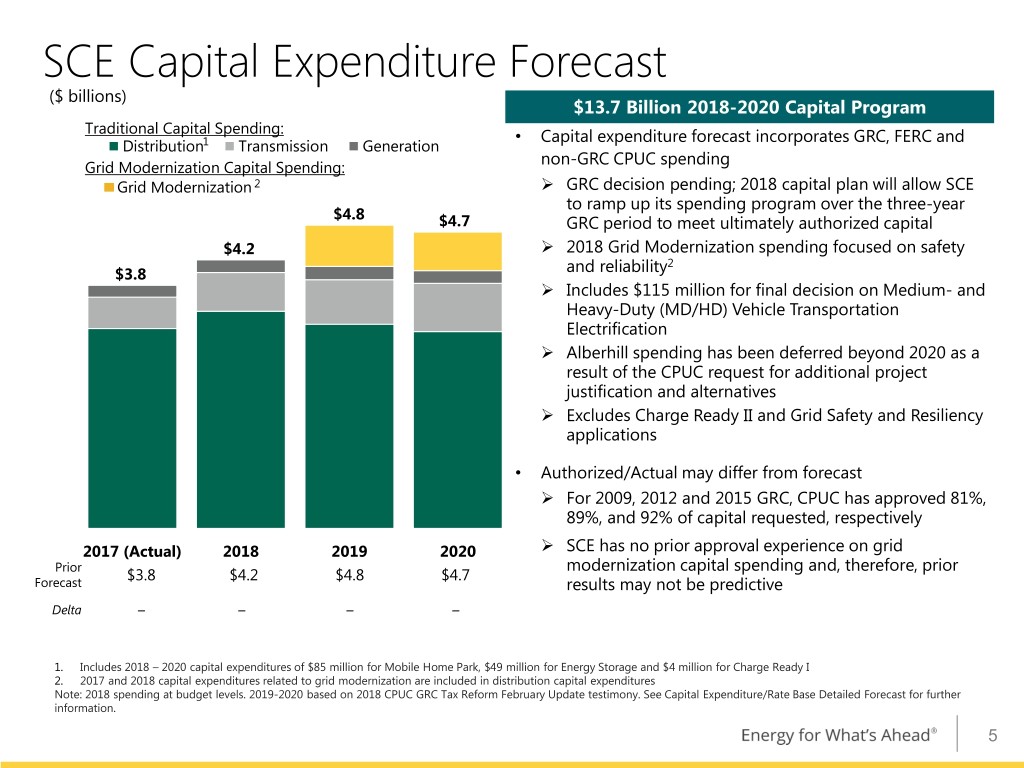
SCE Capital Expenditure Forecast ($ billions) $13.7 Billion 2018-2020 Capital Program Traditional Capital Spending: • Capital expenditure forecast incorporates GRC, FERC and Distribution1 Transmission Generation non-GRC CPUC spending Grid Modernization Capital Spending: Grid Modernization 2 GRC decision pending; 2018 capital plan will allow SCE to ramp up its spending program over the three-year $4.8 $4.7 GRC period to meet ultimately authorized capital $4.2 2018 Grid Modernization spending focused on safety 2 $3.8 and reliability Includes $115 million for final decision on Medium- and Heavy-Duty (MD/HD) Vehicle Transportation Electrification Alberhill spending has been deferred beyond 2020 as a result of the CPUC request for additional project justification and alternatives Excludes Charge Ready II and Grid Safety and Resiliency applications • Authorized/Actual may differ from forecast For 2009, 2012 and 2015 GRC, CPUC has approved 81%, 89%, and 92% of capital requested, respectively 2017 (Actual) 2018 2019 2020 SCE has no prior approval experience on grid Prior modernization capital spending and, therefore, prior $3.8 $4.2 $4.8 $4.7 Forecast results may not be predictive Delta ‒ ‒ ‒ ‒ 1. Includes 2018 – 2020 capital expenditures of $85 million for Mobile Home Park, $49 million for Energy Storage and $4 million for Charge Ready I 2. 2017 and 2018 capital expenditures related to grid modernization are included in distribution capital expenditures Note: 2018 spending at budget levels. 2019-2020 based on 2018 CPUC GRC Tax Reform February Update testimony. See Capital Expenditure/Rate Base Detailed Forecast for further information. 5
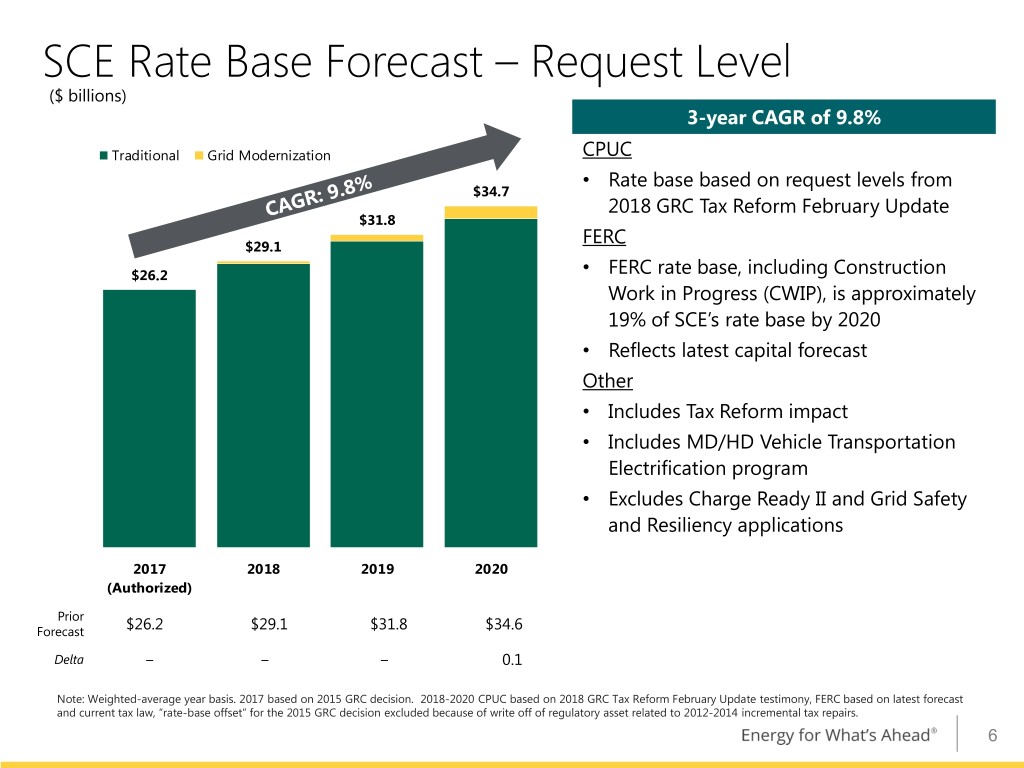
SCE Rate Base Forecast – Request Level ($ billions) 3-year CAGR of 9.8% Traditional Grid Modernization CPUC • Rate base based on request levels from $34.7 2018 GRC Tax Reform February Update $31.8 FERC $29.1 $26.2 • FERC rate base, including Construction Work in Progress (CWIP), is approximately 19% of SCE’s rate base by 2020 • Reflects latest capital forecast Other • Includes Tax Reform impact • Includes MD/HD Vehicle Transportation Electrification program • Excludes Charge Ready II and Grid Safety and Resiliency applications 2017 2018 2019 2020 (Authorized) Prior Forecast $26.2 $29.1 $31.8 $34.6 Delta ‒ ‒ ‒ 0.1 Note: Weighted-average year basis. 2017 based on 2015 GRC decision. 2018-2020 CPUC based on 2018 GRC Tax Reform February Update testimony, FERC based on latest forecast and current tax law, “rate-base offset” for the 2015 GRC decision excluded because of write off of regulatory asset related to 2012-2014 incremental tax repairs. 6
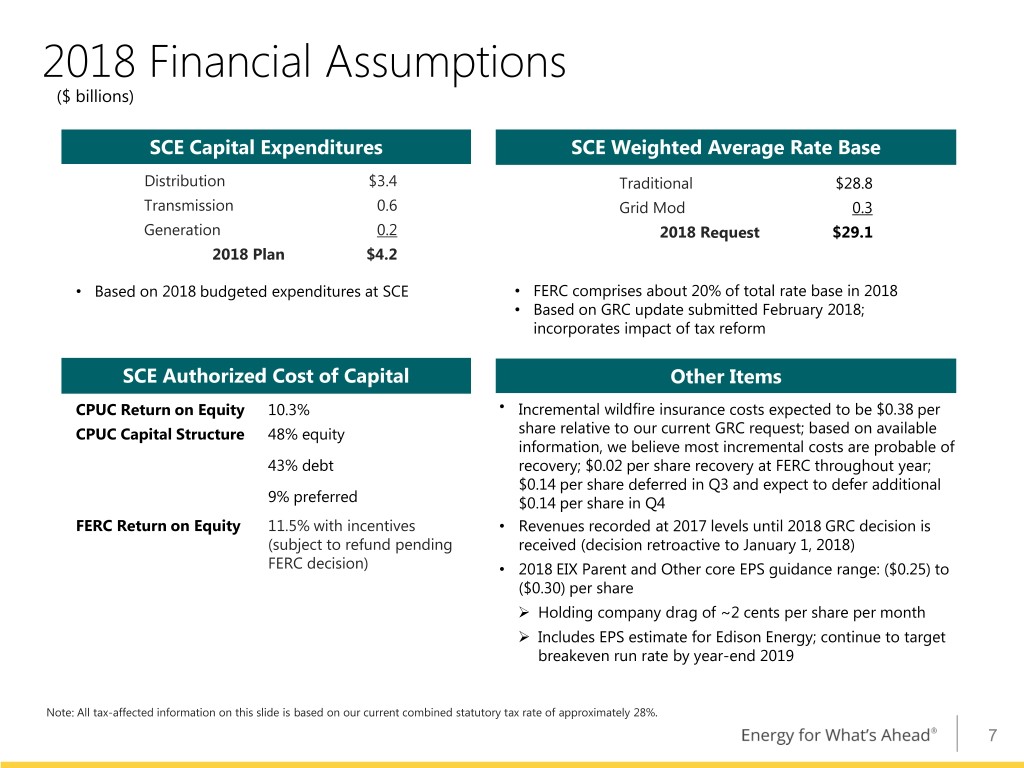
2018 Financial Assumptions ($ billions) SCE Capital Expenditures SCE Weighted Average Rate Base Distribution $3.4 Traditional $28.8 Transmission 0.6 Grid Mod 0.3 Generation 0.2 2018 Request $29.1 2018 Plan $4.2 • Based on 2018 budgeted expenditures at SCE • FERC comprises about 20% of total rate base in 2018 • Based on GRC update submitted February 2018; incorporates impact of tax reform SCE Authorized Cost of Capital Other Items CPUC Return on Equity 10.3% • Incremental wildfire insurance costs expected to be $0.38 per CPUC Capital Structure 48% equity share relative to our current GRC request; based on available information, we believe most incremental costs are probable of 43% debt recovery; $0.02 per share recovery at FERC throughout year; $0.14 per share deferred in Q3 and expect to defer additional 9% preferred $0.14 per share in Q4 FERC Return on Equity 11.5% with incentives • Revenues recorded at 2017 levels until 2018 GRC decision is (subject to refund pending received (decision retroactive to January 1, 2018) FERC decision) • 2018 EIX Parent and Other core EPS guidance range: ($0.25) to ($0.30) per share Holding company drag of ~2 cents per share per month Includes EPS estimate for Edison Energy; continue to target breakeven run rate by year-end 2019 Note: All tax-affected information on this slide is based on our current combined statutory tax rate of approximately 28%. 7
Appendix 8
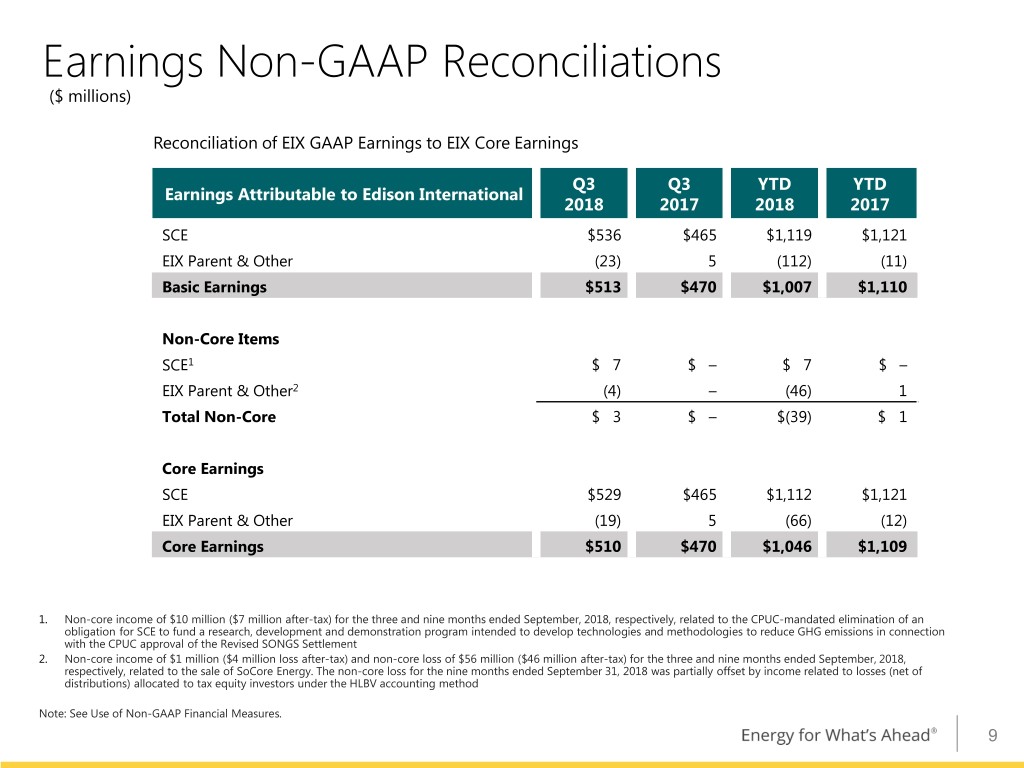
Earnings Non-GAAP Reconciliations ($ millions) Reconciliation of EIX GAAP Earnings to EIX Core Earnings Q3 Q3 YTD YTD Earnings Attributable to Edison International 2018 2017 2018 2017 SCE $536 $465 $1,119 $1,121 EIX Parent & Other (23) 5 (112) (11) Basic Earnings $513 $470 $1,007 $1,110 Non-Core Items SCE1 $ 7 $ – $ 7 $ – EIX Parent & Other2 (4) – (46) 1 Total Non-Core $ 3 $ – $(39) $ 1 Core Earnings SCE $529 $465 $1,112 $1,121 EIX Parent & Other (19) 5 (66) (12) Core Earnings $510 $470 $1,046 $1,109 1. Non-core income of $10 million ($7 million after-tax) for the three and nine months ended September, 2018, respectively, related to the CPUC-mandated elimination of an obligation for SCE to fund a research, development and demonstration program intended to develop technologies and methodologies to reduce GHG emissions in connection with the CPUC approval of the Revised SONGS Settlement 2. Non-core income of $1 million ($4 million loss after-tax) and non-core loss of $56 million ($46 million after-tax) for the three and nine months ended September, 2018, respectively, related to the sale of SoCore Energy. The non-core loss for the nine months ended September 31, 2018 was partially offset by income related to losses (net of distributions) allocated to tax equity investors under the HLBV accounting method Note: See Use of Non-GAAP Financial Measures. 9
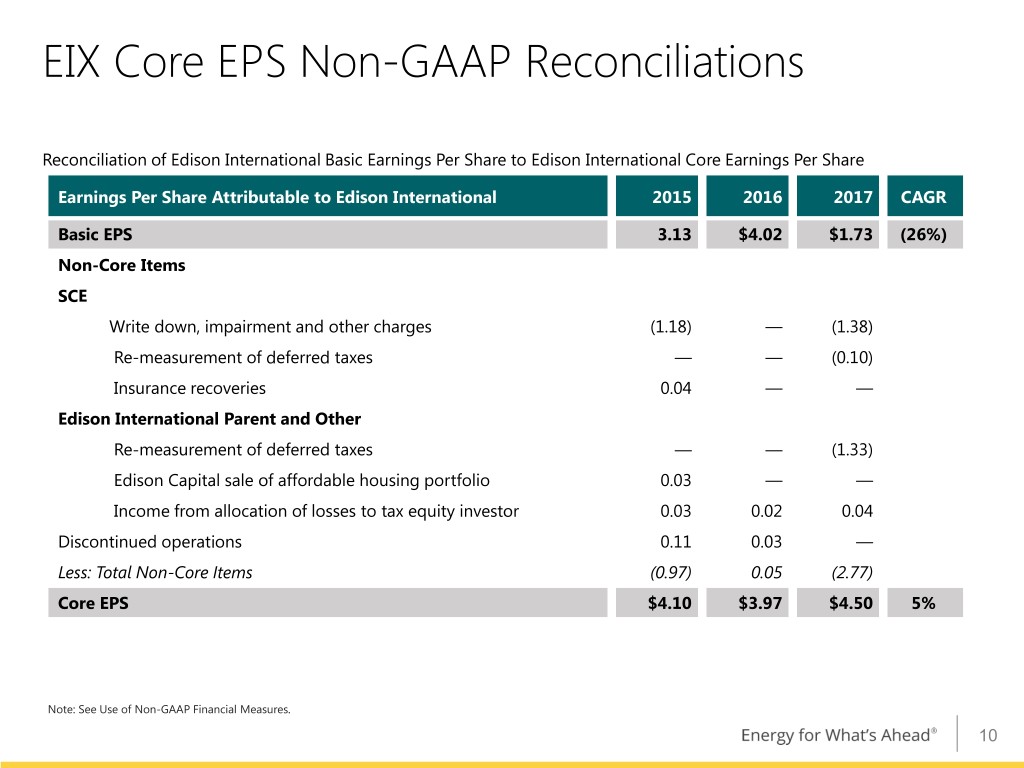
EIX Core EPS Non-GAAP Reconciliations Reconciliation of Edison International Basic Earnings Per Share to Edison International Core Earnings Per Share Earnings Per Share Attributable to Edison International 2015 2016 2017 CAGR Basic EPS 3.13 $4.02 $1.73 (26%) Non-Core Items SCE Write down, impairment and other charges (1.18) — (1.38) Re-measurement of deferred taxes — — (0.10) Insurance recoveries 0.04 — — Edison International Parent and Other Re-measurement of deferred taxes — — (1.33) Edison Capital sale of affordable housing portfolio 0.03 — — Income from allocation of losses to tax equity investor 0.03 0.02 0.04 Discontinued operations 0.11 0.03 — Less: Total Non-Core Items (0.97) 0.05 (2.77) Core EPS $4.10 $3.97 $4.50 5% Note: See Use of Non-GAAP Financial Measures. 10
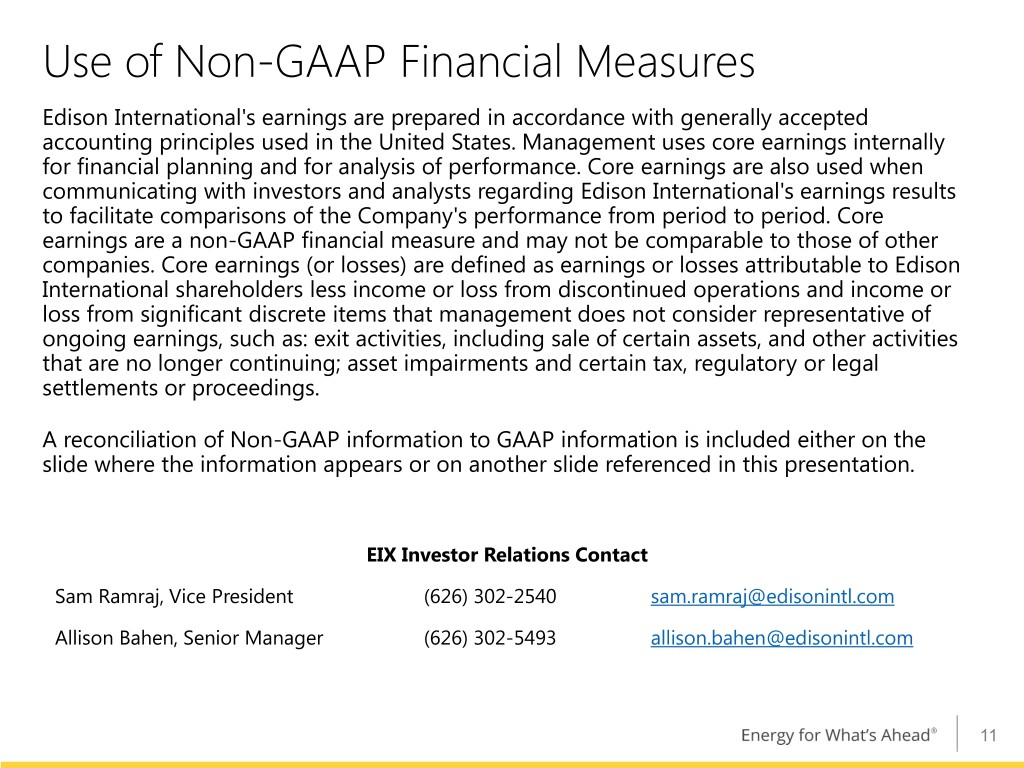
Use of Non-GAAP Financial Measures Edison International's earnings are prepared in accordance with generally accepted accounting principles used in the United States. Management uses core earnings internally for financial planning and for analysis of performance. Core earnings are also used when communicating with investors and analysts regarding Edison International's earnings results to facilitate comparisons of the Company's performance from period to period. Core earnings are a non-GAAP financial measure and may not be comparable to those of other companies. Core earnings (or losses) are defined as earnings or losses attributable to Edison International shareholders less income or loss from discontinued operations and income or loss from significant discrete items that management does not consider representative of ongoing earnings, such as: exit activities, including sale of certain assets, and other activities that are no longer continuing; asset impairments and certain tax, regulatory or legal settlements or proceedings. A reconciliation of Non-GAAP information to GAAP information is included either on the slide where the information appears or on another slide referenced in this presentation. EIX Investor Relations Contact Sam Ramraj, Vice President (626) 302-2540 sam.ramraj@edisonintl.com Allison Bahen, Senior Manager (626) 302-5493 allison.bahen@edisonintl.com 11


