First Quarter 2019 Financial Results April 30, 2019
Forward-Looking Statements Statements contained in this presentation about future performance, including, without limitation, operating results, capital expenditures, rate base growth, dividend policy, financial outlook, and other statements that are not purely historical, are forward-looking statements. These forward-looking statements reflect our current expectations; however, such statements involve risks and uncertainties. Actual results could differ materially from current expectations. These forward-looking statements represent our expectations only as of the date of this presentation, and Edison International assumes no duty to update them to reflect new information, events or circumstances. Important factors that could cause different results include, but are not limited to the: • ability of SCE to recover its costs through regulated rates, including costs related to uninsured wildfire-related and mudslide-related liabilities and capital spending incurred prior to formal regulatory approval; • ability to obtain sufficient insurance at a reasonable cost, including insurance relating to SCE's nuclear facilities and wildfire-related claims, and to recover the costs of such insurance or, in the event liabilities exceed insured amounts, the ability to recover uninsured losses from customers or other parties; • actions, or inaction, of the state of California with respect to achieving a timely and comprehensive solution mitigating the significant risk faced by California investor-owned utilities related to liability for damages arising from catastrophic wildfires where utility facilities are a substantial cause; • decisions and other actions by the CPUC, the FERC, the NRC and other regulatory authorities, including determinations of authorized rates of return or return on equity, the 2018 GRC, the GS&RP application, the 2019 WMP, the recoverability of wildfire-related and mudslide-related costs, and delays in regulatory actions; • ability of Edison International or SCE to borrow funds and access the bank and capital markets on reasonable terms; • actions by credit rating agencies to downgrade Edison International or SCE's credit ratings or to place those ratings on negative watch or outlook; • risks associated with the decommissioning of San Onofre, including those related to public opposition, permitting, governmental approvals, on-site storage of spent nuclear fuel, delays, contractual disputes, and cost overruns; • extreme weather-related incidents and other natural disasters (including earthquakes and events caused, or exacerbated, by climate change, such as wildfires), which could cause, among other things, public safety issues, property damage and operational issues; • risks associated with cost allocation resulting in higher rates for utility bundled service customers because of possible customer bypass or departure for other electricity providers such as CCAs and Electric Service Providers; • risks inherent in SCE's transmission and distribution infrastructure investment program, including those related to project site identification, public opposition, environmental mitigation, construction, permitting, power curtailment costs (payments due under power contracts in the event there is insufficient transmission to enable acceptance of power delivery), changes in the CAISO's transmission plans, and governmental approvals; and • risks associated with the operation of transmission and distribution assets and power generating facilities, including public and employee safety issues, the risk of utility assets causing or contributing to wildfires, failure, availability, efficiency, and output of equipment and facilities, and availability and cost of spare parts. Other important factors are discussed under the headings “Forward-Looking Statements”, “Risk Factors” and “Management’s Discussion and Analysis” in Edison International’s Form 10-K and other reports filed with the Securities and Exchange Commission, which are available on ourwebsite: www.edisoninvestor.com. These filings also provide additional information on historical and other factual data contained in this presentation. April 30, 2019 1
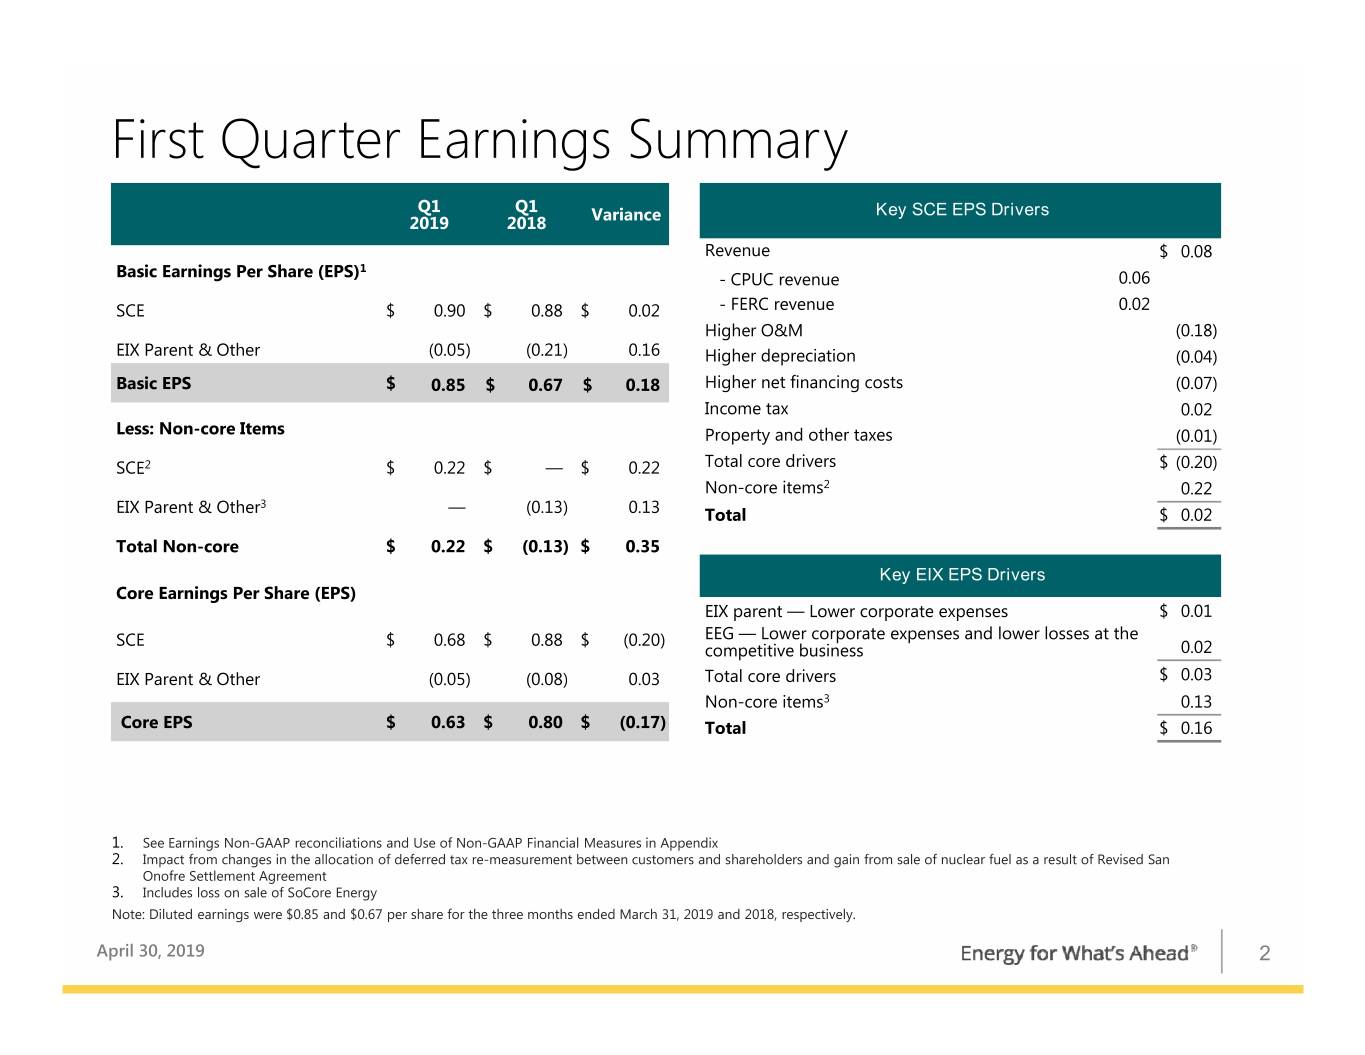
First Quarter Earnings Summary Q1 Q1 Key SCE EPS Drivers 2019 2018 Variance Revenue $0.08 1 Basic Earnings Per Share (EPS) - CPUC revenue 0.06 SCE $ 0.90 $ 0.88 $ 0.02 - FERC revenue 0.02 Higher O&M (0.18) EIX Parent & Other (0.05) (0.21) 0.16 Higher depreciation (0.04) Basic EPS $ 0.85 $ 0.67 $ 0.18 Higher net financing costs (0.07) Income tax 0.02 Less: Non-core Items Property and other taxes (0.01) SCE2 $ 0.22 $ — $ 0.22 Total core drivers $ (0.20) Non-core items2 0.22 3 EIX Parent & Other — (0.13) 0.13 Total $0.02 Total Non-core $ 0.22 $ (0.13) $ 0.35 Key EIX EPS Drivers Core Earnings Per Share (EPS) EIX parent — Lower corporate expenses $0.01 SCE $ 0.68 $ 0.88 $ (0.20) EEG — Lower corporate expenses and lower losses at the competitive business 0.02 EIX Parent & Other (0.05) (0.08) 0.03 Total core drivers $0.03 Non-core items3 0.13 Core EPS $ 0.63 $ 0.80 $ (0.17) Total $0.16 1. See Earnings Non-GAAP reconciliations and Use of Non-GAAP Financial Measures in Appendix 2. Impact from changes in the allocation of deferred tax re-measurement between customers and shareholders and gain from sale of nuclear fuel as a result of Revised San Onofre Settlement Agreement 3. Includes loss on sale of SoCore Energy Note: Diluted earnings were $0.85 and $0.67 per share for the three months ended March 31, 2019 and 2018, respectively. April 30, 2019 2
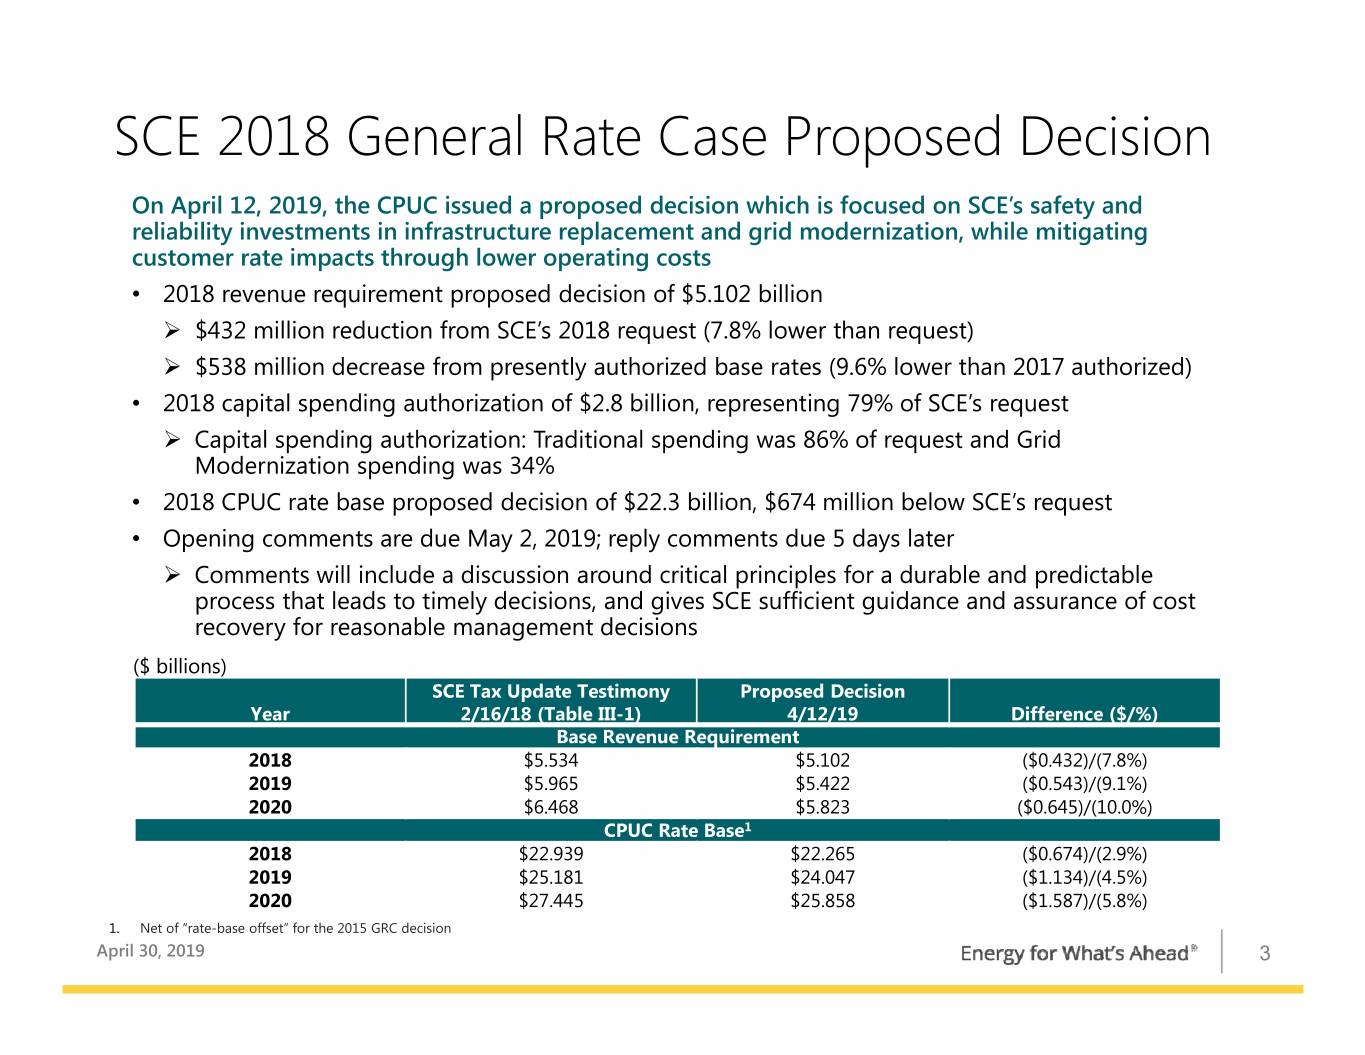
SCE 2018 General Rate Case Proposed Decision On April 12, 2019, the CPUC issued a proposed decision which is focused on SCE’s safety and reliability investments in infrastructure replacement and grid modernization, while mitigating customer rate impacts through lower operating costs • 2018 revenue requirement proposed decision of $5.102 billion $432 million reduction from SCE’s 2018 request (7.8% lower than request) $538 million decrease from presently authorized base rates (9.6% lower than 2017 authorized) • 2018 capital spending authorization of $2.8 billion, representing 79% of SCE’s request Capital spending authorization: Traditional spending was 86% of request and Grid Modernization spending was 34% • 2018 CPUC rate base proposed decision of $22.3 billion, $674 million below SCE’s request • Opening comments are due May 2, 2019; reply comments due 5 days later Comments will include a discussion around critical principles for a durable and predictable process that leads to timely decisions, and gives SCE sufficient guidance and assurance of cost recovery for reasonable management decisions ($ billions) SCE Tax Update Testimony Proposed Decision Year 2/16/18 (Table III-1) 4/12/19 Difference ($/%) Base Revenue Requirement 2018 $5.534 $5.102 ($0.432)/(7.8%) 2019 $5.965 $5.422 ($0.543)/(9.1%) 2020 $6.468 $5.823 ($0.645)/(10.0%) CPUC Rate Base1 2018 $22.939 $22.265 ($0.674)/(2.9%) 2019 $25.181 $24.047 ($1.134)/(4.5%) 2020 $27.445 $25.858 ($1.587)/(5.8%) 1. Net of “rate-base offset” for the 2015 GRC decision April 30, 2019 3
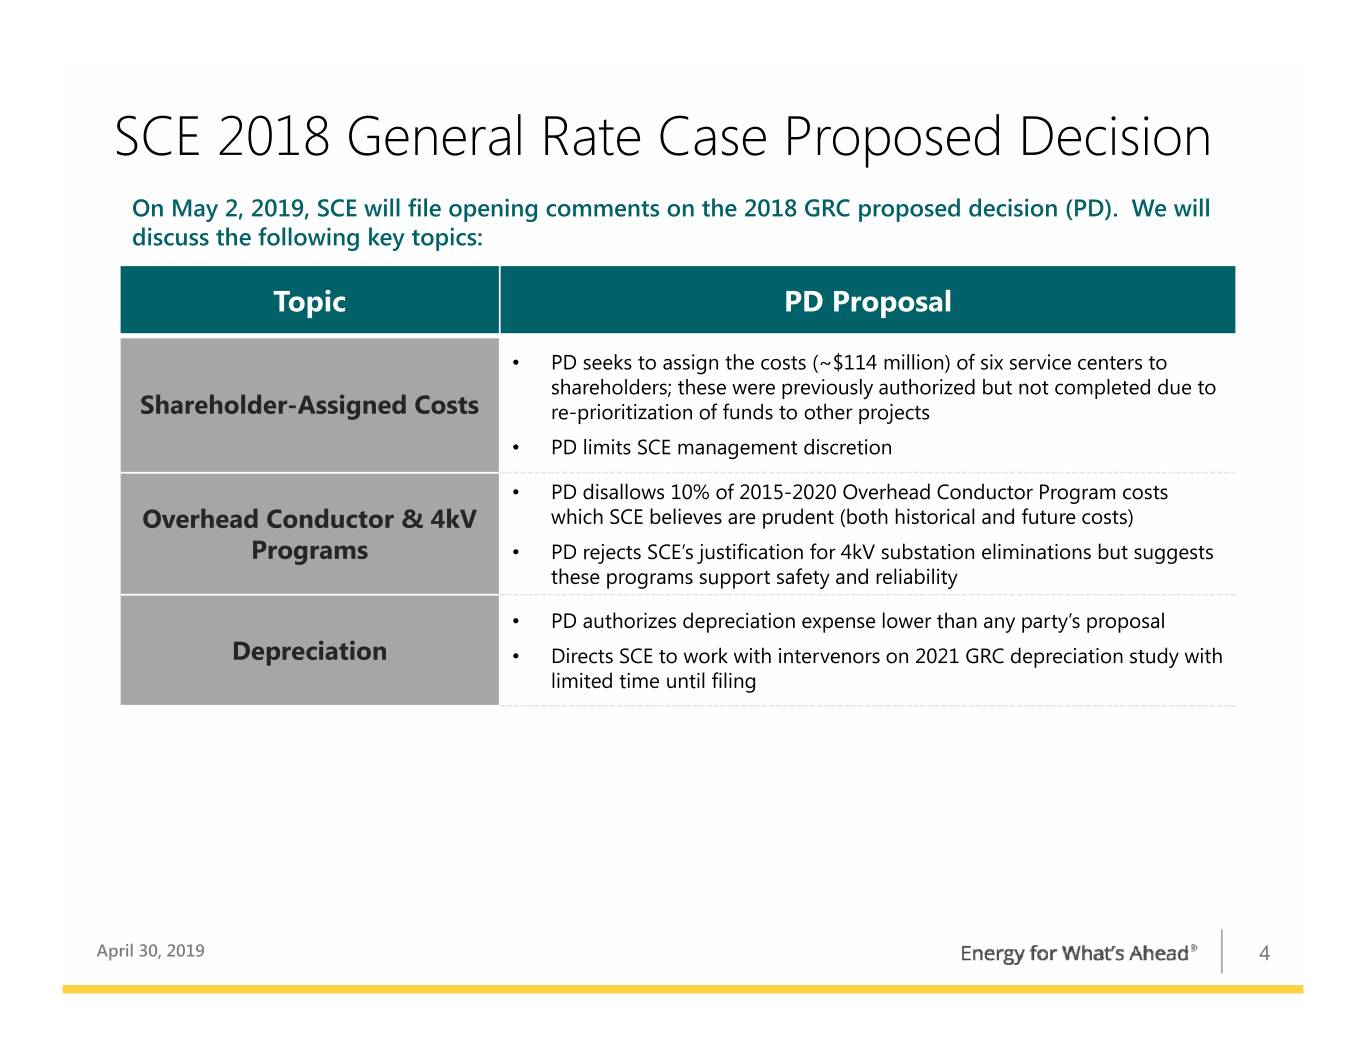
SCE 2018 General Rate Case Proposed Decision On May 2, 2019, SCE will file opening comments on the 2018 GRC proposed decision (PD). We will discuss the following key topics: Topic PD Proposal • PD seeks to assign the costs (~$114 million) of six service centers to shareholders; these were previously authorized but not completed due to Shareholder-Assigned Costs re-prioritization of funds to other projects • PD limits SCE management discretion • PD disallows 10% of 2015-2020 Overhead Conductor Program costs Overhead Conductor & 4kV which SCE believes are prudent (both historical and future costs) Programs • PD rejects SCE’s justification for 4kV substation eliminations but suggests these programs support safety and reliability • PD authorizes depreciation expense lower than any party’s proposal Depreciation • Directs SCE to work with intervenors on 2021 GRC depreciation study with limited time until filing April 30, 2019 4
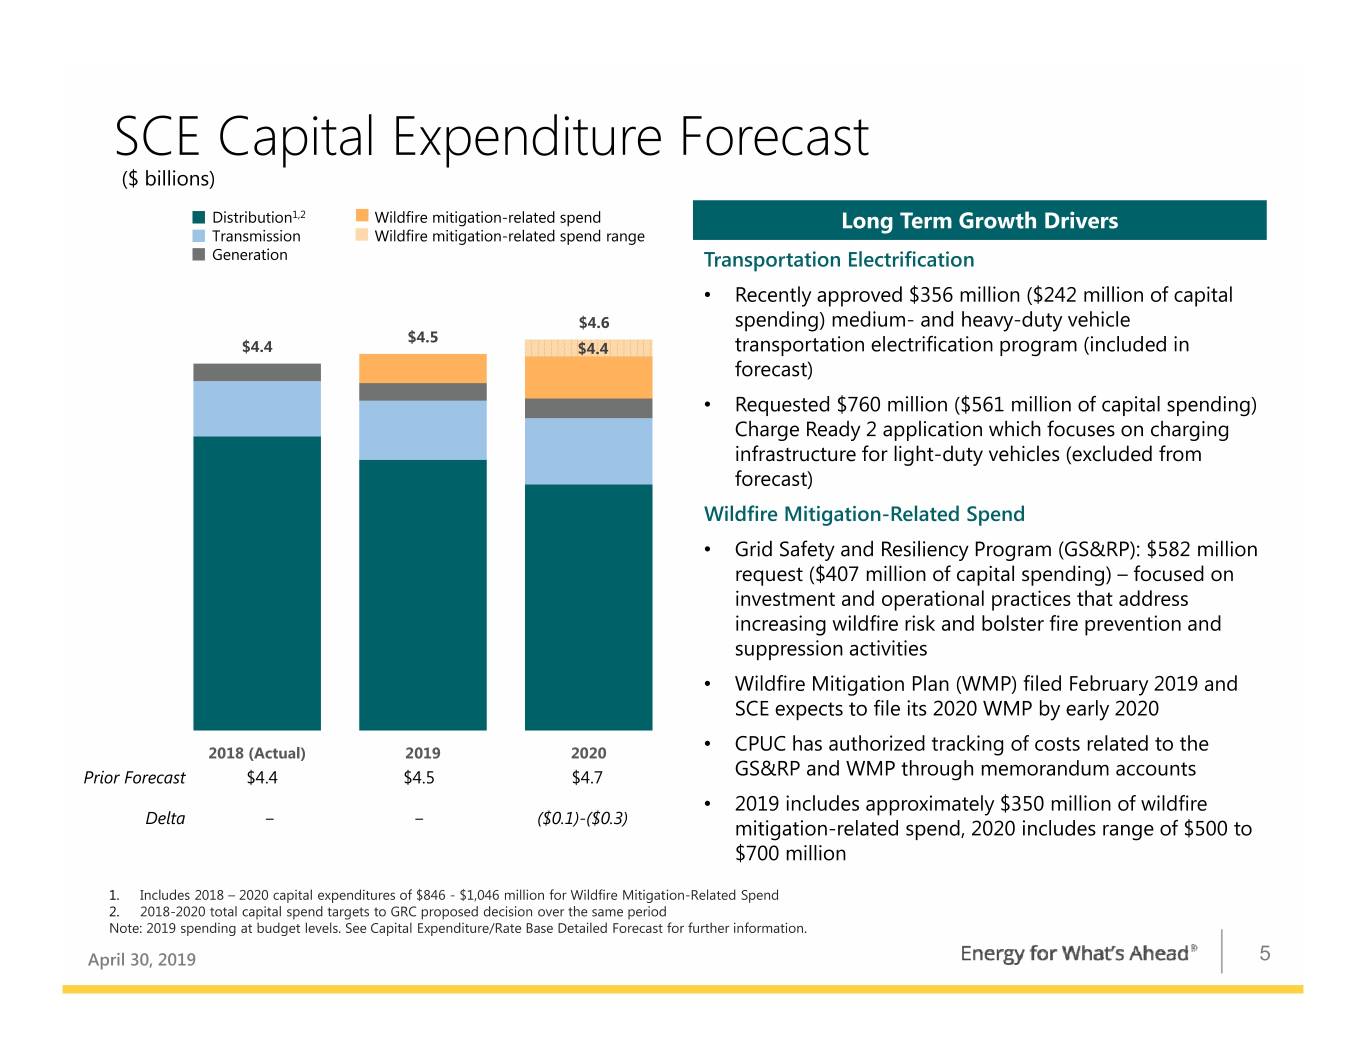
SCE Capital Expenditure Forecast ($ billions) Distribution1,2 Wildfire mitigation-related spend Long Term Growth Drivers Transmission Wildfire mitigation-related spend range Generation Transportation Electrification • Recently approved $356 million ($242 million of capital $4.6 spending) medium- and heavy-duty vehicle $4.5 $4.4 $4.4 transportation electrification program (included in forecast) • Requested $760 million ($561 million of capital spending) Charge Ready 2 application which focuses on charging infrastructure for light-duty vehicles (excluded from forecast) Wildfire Mitigation-Related Spend • Grid Safety and Resiliency Program (GS&RP): $582 million request ($407 million of capital spending) – focused on investment and operational practices that address increasing wildfire risk and bolster fire prevention and suppression activities • Wildfire Mitigation Plan (WMP) filed February 2019 and SCE expects to file its 2020 WMP by early 2020 2018 (Actual) 2019 2020 • CPUC has authorized tracking of costs related to the Prior Forecast $4.4 $4.5 $4.7 GS&RP and WMP through memorandum accounts • 2019 includes approximately $350 million of wildfire Delta ‒‒($0.1)-($0.3) mitigation-related spend, 2020 includes range of $500 to $700 million 1. Includes 2018 – 2020 capital expenditures of $846 - $1,046 million for Wildfire Mitigation-Related Spend 2. 2018-2020 total capital spend targets to GRC proposed decision over the same period Note: 2019 spending at budget levels. See Capital Expenditure/Rate Base Detailed Forecast for further information. April 30, 2019 5
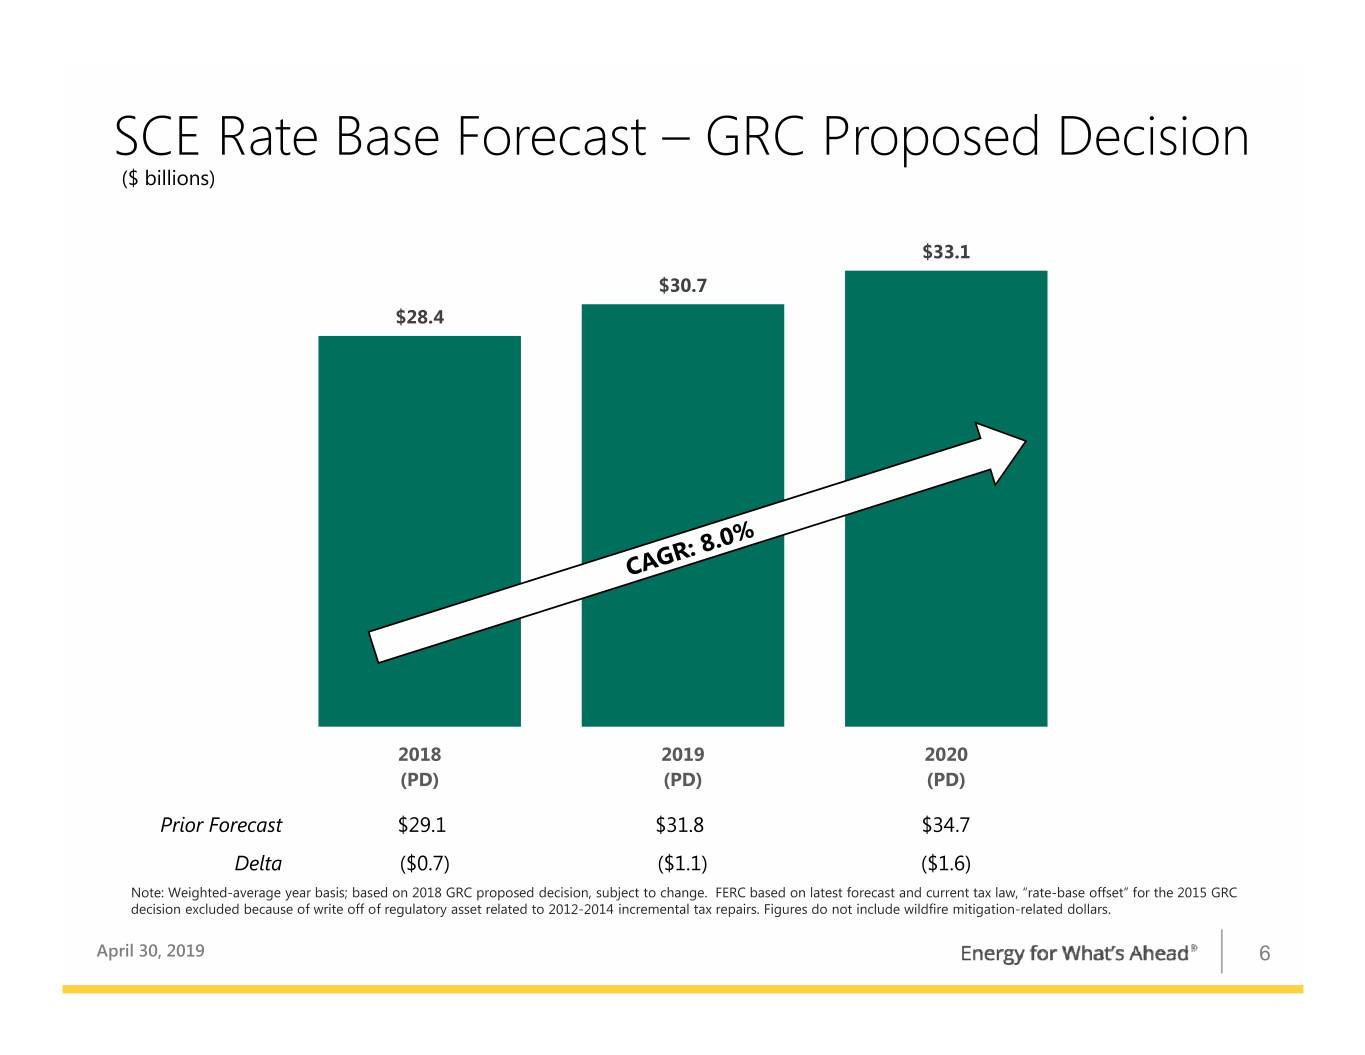
SCE Rate Base Forecast – GRC Proposed Decision ($ billions) $33.1 $30.7 $28.4 2018 2019 2020 (PD) (PD) (PD) Prior Forecast $29.1 $31.8 $34.7 Delta ($0.7) ($1.1) ($1.6) Note: Weighted-average year basis; based on 2018 GRC proposed decision, subject to change. FERC based on latest forecast and current tax law, “rate-base offset” for the 2015 GRC decision excluded because of write off of regulatory asset related to 2012-2014 incremental tax repairs. Figures do not include wildfire mitigation-related dollars. April 30, 2019 6
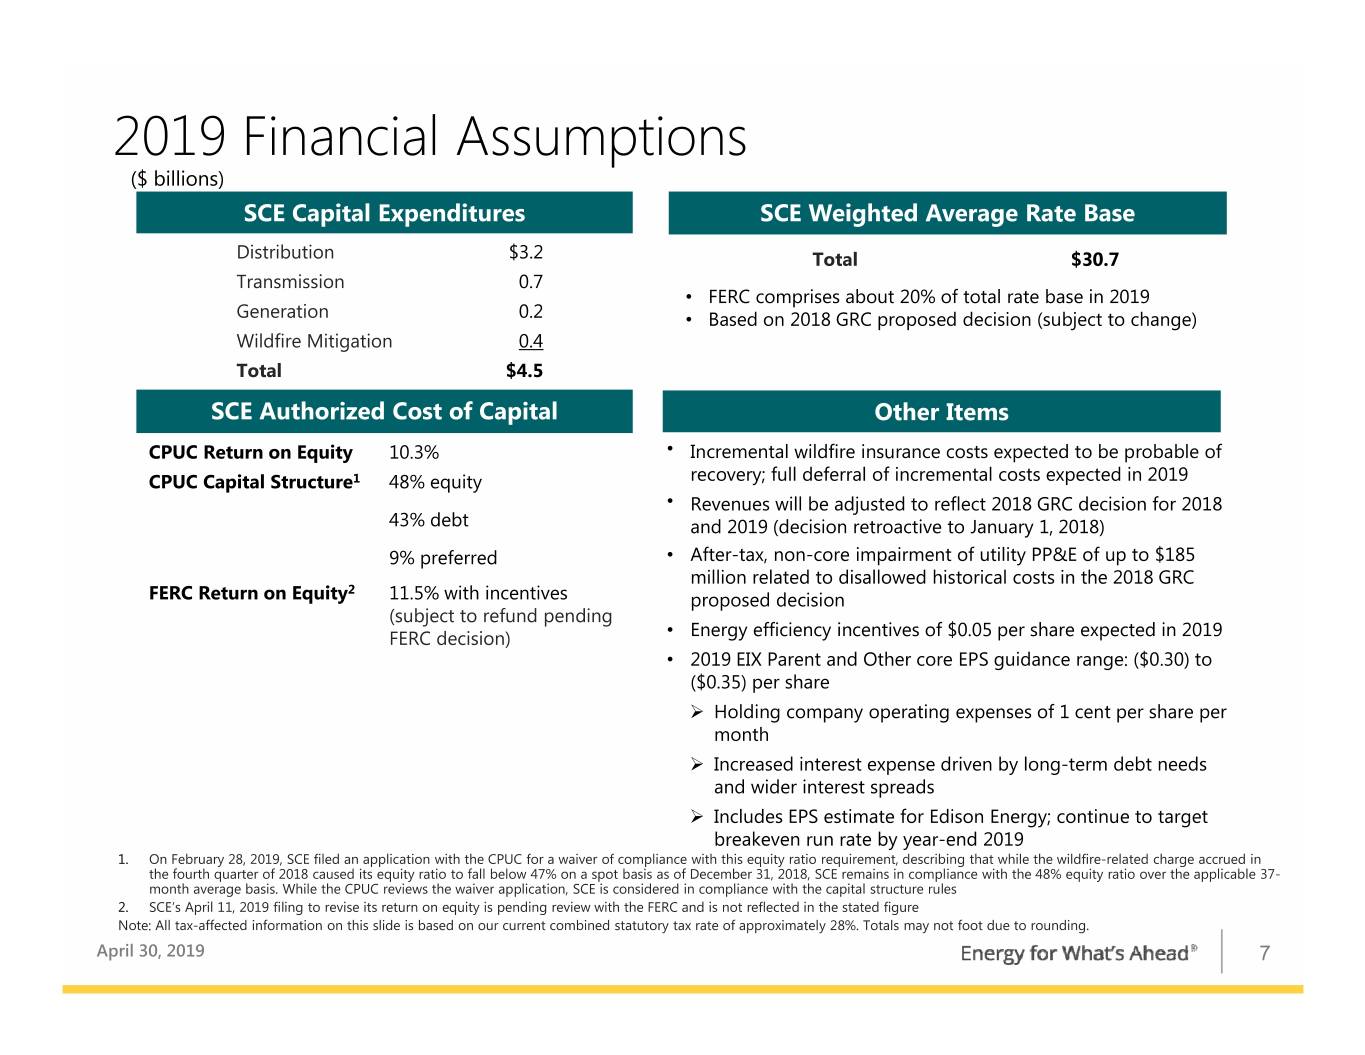
2019 Financial Assumptions ($ billions) SCE Capital Expenditures SCE Weighted Average Rate Base Distribution $3.2 Total $30.7 Transmission 0.7 • FERC comprises about 20% of total rate base in 2019 Generation 0.2 • Based on 2018 GRC proposed decision (subject to change) Wildfire Mitigation 0.4 Total $4.5 SCE Authorized Cost of Capital Other Items CPUC Return on Equity 10.3% • Incremental wildfire insurance costs expected to be probable of CPUC Capital Structure1 48% equity recovery; full deferral of incremental costs expected in 2019 • Revenues will be adjusted to reflect 2018 GRC decision for 2018 43% debt and 2019 (decision retroactive to January 1, 2018) 9% preferred • After-tax, non-core impairment of utility PP&E of up to $185 million related to disallowed historical costs in the 2018 GRC 2 FERC Return on Equity 11.5% with incentives proposed decision (subject to refund pending • FERC decision) Energy efficiency incentives of $0.05 per share expected in 2019 • 2019 EIX Parent and Other core EPS guidance range: ($0.30) to ($0.35) per share Holding company operating expenses of 1 cent per share per month Increased interest expense driven by long-term debt needs and wider interest spreads Includes EPS estimate for Edison Energy; continue to target breakeven run rate by year-end 2019 1. On February 28, 2019, SCE filed an application with the CPUC for a waiver of compliance with this equity ratio requirement, describing that while the wildfire-related charge accrued in the fourth quarter of 2018 caused its equity ratio to fall below 47% on a spot basis as of December 31, 2018, SCE remains in compliance with the 48% equity ratio over the applicable 37- month average basis. While the CPUC reviews the waiver application, SCE is considered in compliance with the capital structure rules 2. SCE’s April 11, 2019 filing to revise its return on equity is pending review with the FERC and is not reflected in the stated figure Note: All tax-affected information on this slide is based on our current combined statutory tax rate of approximately 28%. Totals may not foot due to rounding. April 30, 2019 7
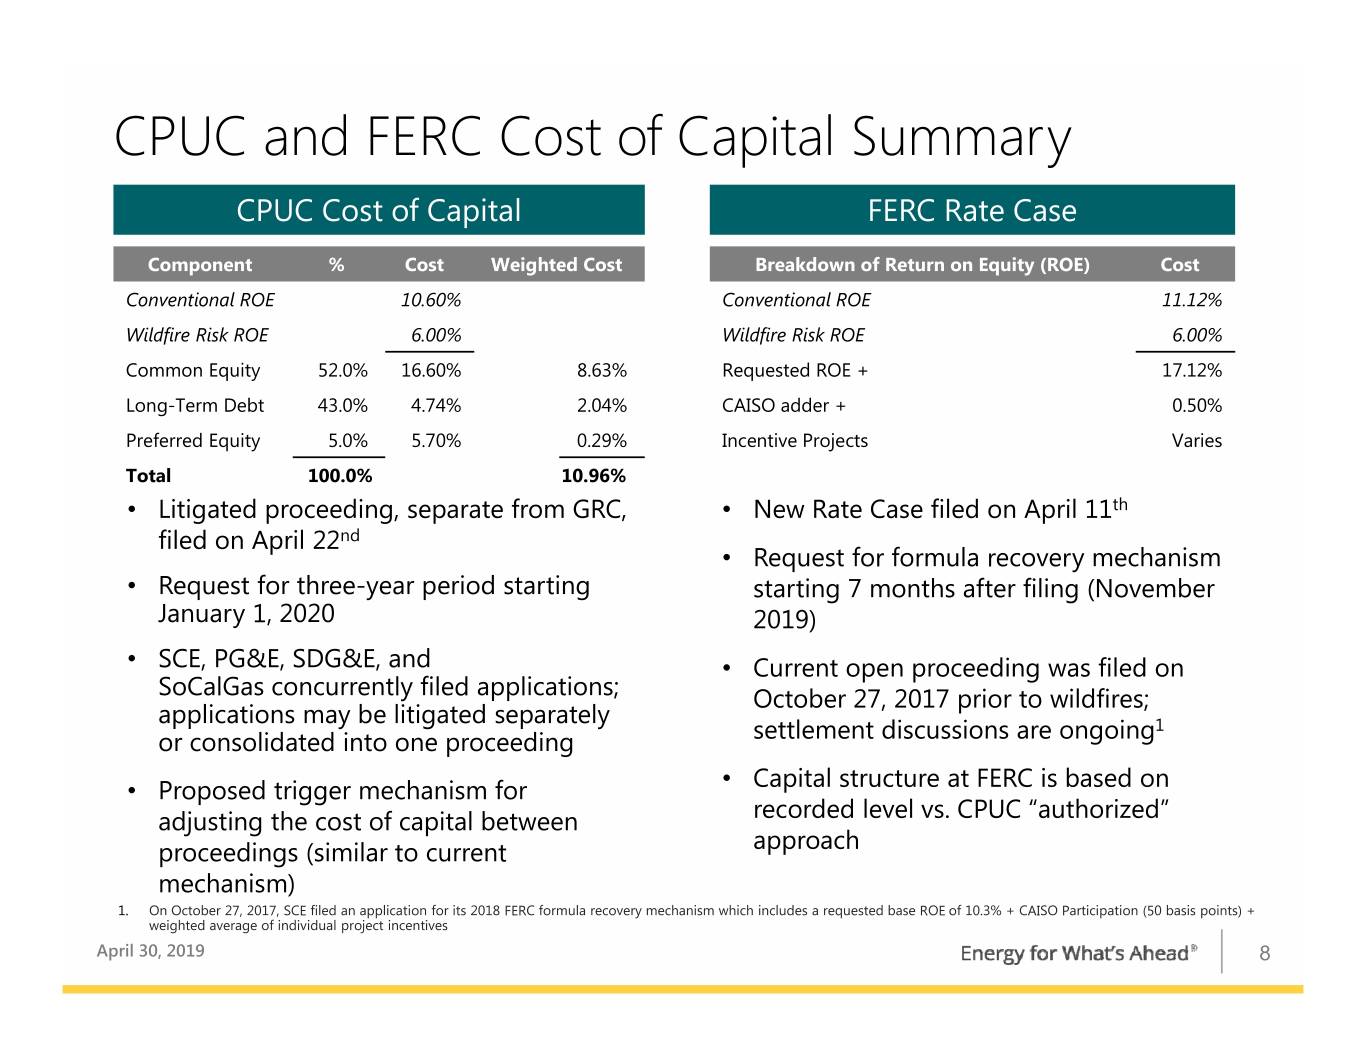
CPUC and FERC Cost of Capital Summary CPUC Cost of Capital FERC Rate Case Component % Cost Weighted Cost Breakdown of Return on Equity (ROE) Cost Conventional ROE 10.60% Conventional ROE 11.12% Wildfire Risk ROE 6.00% Wildfire Risk ROE 6.00% Common Equity 52.0% 16.60% 8.63% Requested ROE + 17.12% Long-Term Debt 43.0% 4.74% 2.04% CAISO adder + 0.50% Preferred Equity 5.0% 5.70% 0.29% Incentive Projects Varies Total 100.0% 10.96% • Litigated proceeding, separate from GRC, • New Rate Case filed on April 11th filed on April 22nd • Request for formula recovery mechanism • Request for three-year period starting starting 7 months after filing (November January 1, 2020 2019) • SCE, PG&E, SDG&E, and • Current open proceeding was filed on SoCalGas concurrently filed applications; October 27, 2017 prior to wildfires; applications may be litigated separately 1 or consolidated into one proceeding settlement discussions are ongoing • • Proposed trigger mechanism for Capital structure at FERC is based on adjusting the cost of capital between recorded level vs. CPUC “authorized” proceedings (similar to current approach mechanism) 1. On October 27, 2017, SCE filed an application for its 2018 FERC formula recovery mechanism which includes a requested base ROE of 10.3% + CAISO Participation (50 basis points) + weighted average of individual project incentives April 30, 2019 8
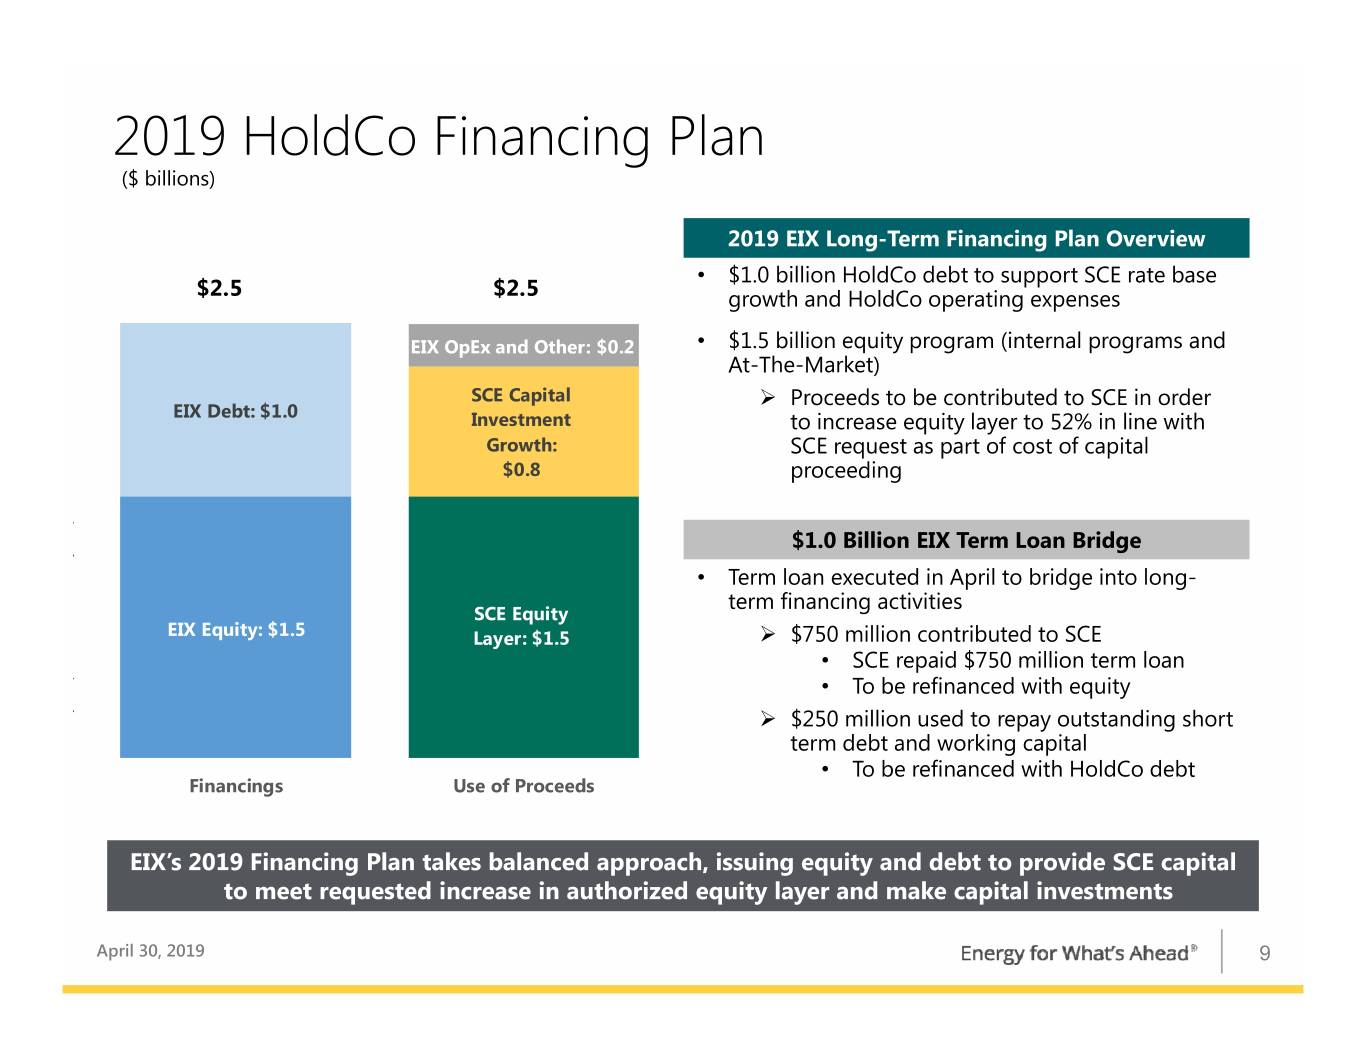
2019 HoldCo Financing Plan ($ billions) 2019 EIX Long-Term Financing Plan Overview • $1.0 billion HoldCo debt to support SCE rate base $2.5 $2.5 growth and HoldCo operating expenses EIX OpEx and Other: $0.2 • $1.5 billion equity program (internal programs and At-The-Market) SCE Capital Proceeds to be contributed to SCE in order EIX Debt: $1.0 Investment to increase equity layer to 52% in line with Growth: SCE request as part of cost of capital $0.8 proceeding $1.0 Billion EIX Term Loan Bridge • Term loan executed in April to bridge into long- term financing activities SCE Equity EIX Equity: $1.5 Layer: $1.5 $750 million contributed to SCE • SCE repaid $750 million term loan • To be refinanced with equity $250 million used to repay outstanding short term debt and working capital • To be refinanced with HoldCo debt Financings Use of Proceeds EIX’s 2019 Financing Plan takes balanced approach, issuing equity and debt to provide SCE capital to meet requested increase in authorized equity layer and make capital investments April 30, 2019 9
Appendix April 30, 2019 10
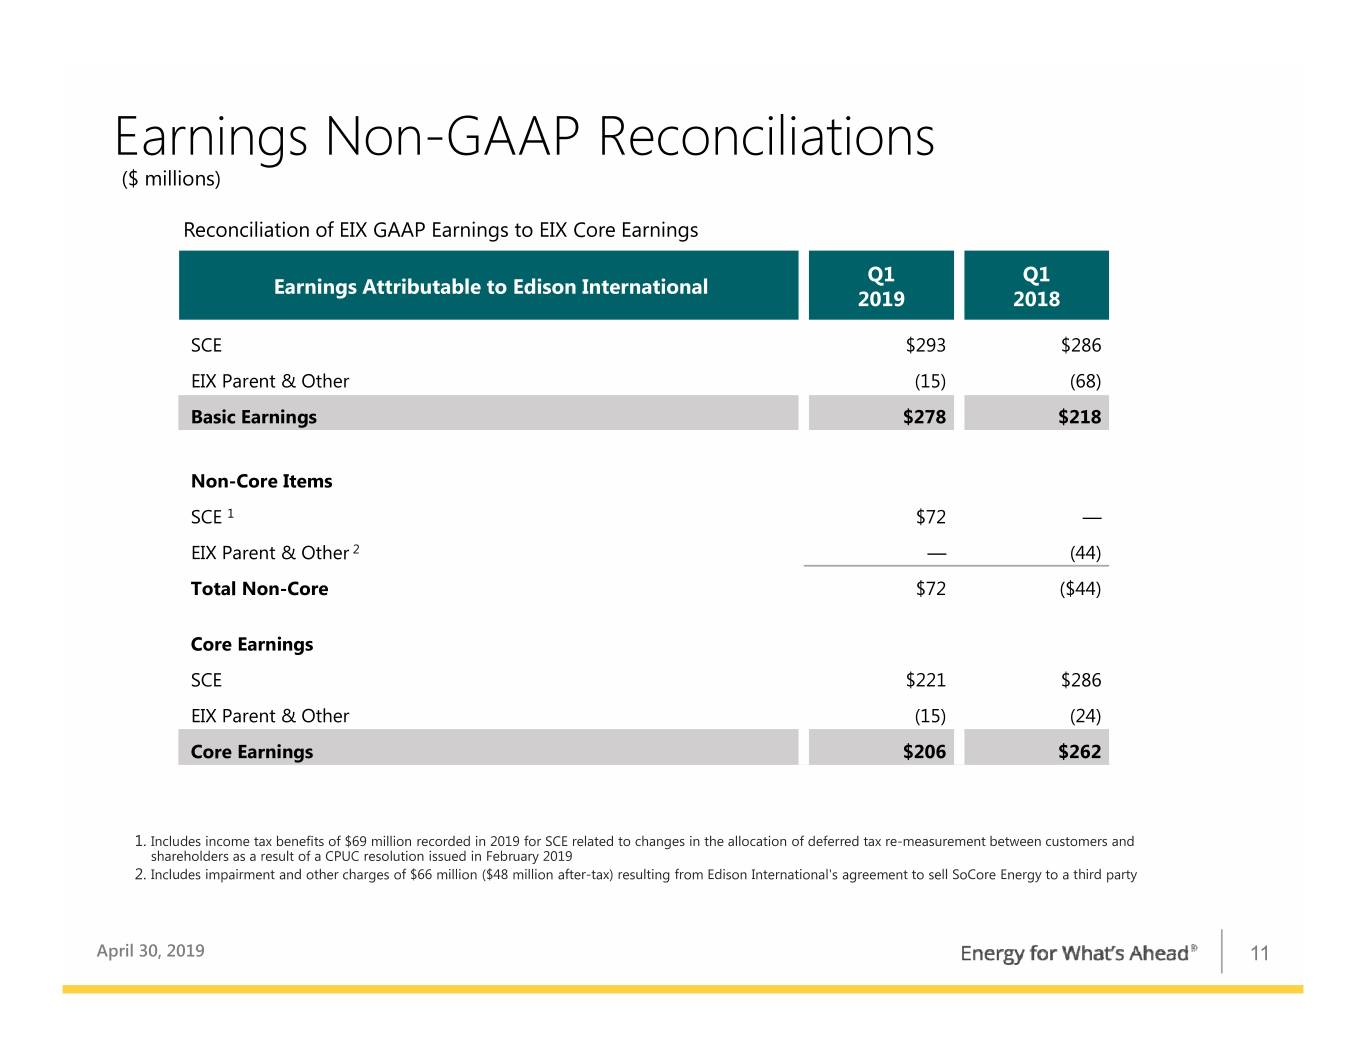
Earnings Non-GAAP Reconciliations ($ millions) Reconciliation of EIX GAAP Earnings to EIX Core Earnings Q1 Q1 Earnings Attributable to Edison International 2019 2018 SCE $293 $286 EIX Parent & Other (15) (68) Basic Earnings $278 $218 Non-Core Items SCE 1 $72 — EIX Parent & Other 2 — (44) Total Non-Core $72 ($44) Core Earnings SCE $221 $286 EIX Parent & Other (15) (24) Core Earnings $206 $262 1. Includes income tax benefits of $69 million recorded in 2019 for SCE related to changes in the allocation of deferred tax re-measurement between customers and shareholders as a result of a CPUC resolution issued in February 2019 2. Includes impairment and other charges of $66 million ($48 million after-tax) resulting from Edison International's agreement to sell SoCore Energy to a third party April 30, 2019 11
Use of Non-GAAP Financial Measures Edison International's earnings are prepared in accordance with generally accepted accounting principles used in the United States. Management uses core earnings internally for financial planning and for analysis of performance. Core earnings are also used when communicating with investors and analysts regarding Edison International's earnings results to facilitate comparisons of the Company's performance from period to period. Core earnings are a non-GAAP financial measure and may not be comparable to those of other companies. Core earnings (or losses) are defined as earnings or losses attributable to Edison International shareholders less income or loss from discontinued operations and income or loss from significant discrete items that management does not consider representative of ongoing earnings, such as: exit activities, including sale of certain assets, and other activities that are no longer continuing; asset impairments and certain tax, regulatory or legal settlements or proceedings. A reconciliation of Non-GAAP information to GAAP information is included either on the slide where the information appears or on another slide referenced in this presentation. EIX Investor Relations Contact Sam Ramraj, Vice President (626) 302-2540 sam.ramraj@edisonintl.com Allison Bahen, Senior Manager (626) 302-5493 allison.bahen@edisonintl.com April 30, 2019 12


