Exhibit 99.1
Leading the Way in Electricity SM
26th Annual
Bernstein Strategic Decisions Conference June 2, 2010
Ted Craver
Chairman, President and Chief Executive Officer
June 2, 2010 EDISON INTERNATIONAL®
Leading the Way in Electricity SM
Forward-Looking Statements
Statements contained in this presentation about future performance, including, without limitation, earnings, asset and rate base growth, load growth, capital investments, and other statements that are not purely historical, are forward-looking statements. These forward-looking statements reflect our current expectations; however, such statements involve risks and uncertainties. Actual results could differ materially from current expectations. These forward-looking statements represent our expectations only as of the date of this presentation, and Edison International assumes no duty to update them to reflect new information, events or circumstances. Important factors that could cause different results are discussed under the headings “Risk Factors,” and “Management’s Discussion and Analysis” in Edison International’s 2009 Form 10-K, most recent Form 10-Q and other reports filed with the Securities and Exchange Commission, which are available on our website: www.edisoninvestor.com. These filings also provide additional information on historical and other factual data contained in this presentation.
June 2, 2010 1 EDISON INTERNATIONAL®
Leading the Way in Electricity SM
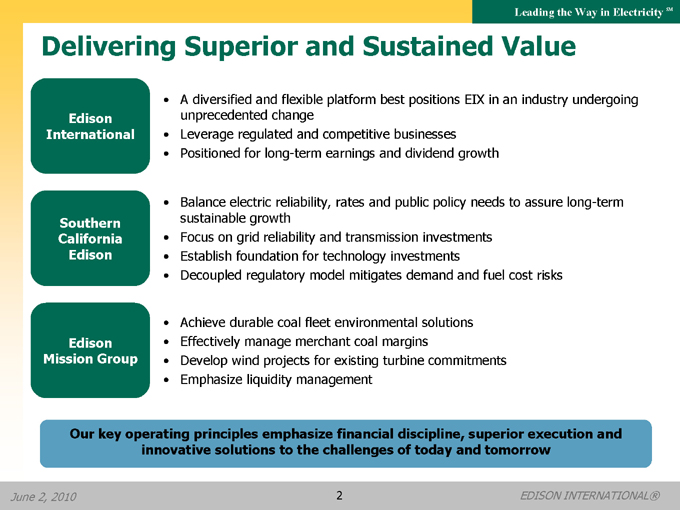
Delivering Superior and Sustained Value
Edison International
A diversified and flexible platform best positions EIX in an industry undergoing unprecedented change Leverage regulated and competitive businesses Positioned for long-term earnings and dividend growth
Southern California Edison
Balance electric reliability, rates and public policy needs to assure long-term
sustainable growth
Focus on grid reliability and transmission investments
Establish foundation for technology investments
Decoupled regulatory model mitigates demand and fuel cost risks
Edison Mission Group
Achieve durable coal fleet environmental solutions
Effectively manage merchant coal margins
Develop wind projects for existing turbine commitments
Emphasize liquidity management
Our key operating principles emphasize financial discipline, superior execution and innovative solutions to the challenges of today and tomorrow
June 2, 2010 2 EDISON INTERNATIONAL®
Leading the Way in Electricity SM
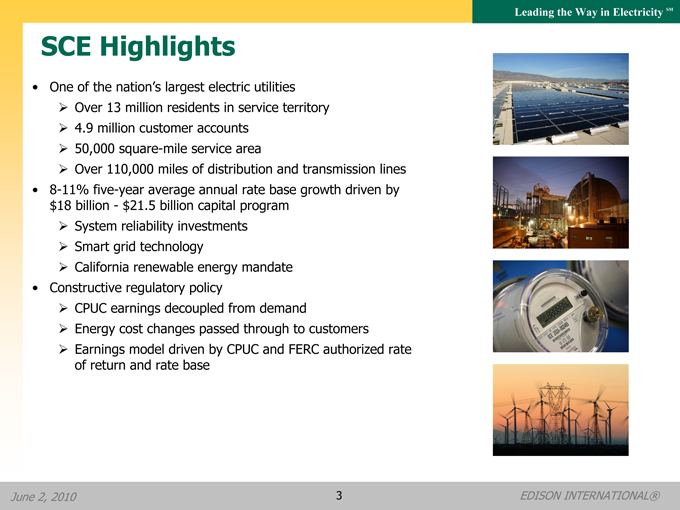
SCE Highlights
One of the nation’s largest electric utilities
• Over 13 million residents in service territory
• 4.9 million customer accounts
• 50,000 square-mile service area
• Over 110,000 miles of distribution and transmission lines
8-11% five-year average annual rate base growth driven by
$18 billion - $21.5 billion capital program
• System reliability investments
• Smart grid technology
• California renewable energy mandate
Constructive regulatory policy
• CPUC earnings decoupled from demand
• Energy cost changes passed through to customers
• Earnings model driven by CPUC and FERC authorized rate
of return and rate base
June 2, 2010 3 EDISON INTERNATIONAL®

Leading the Way in Electricity SM
SCE Capital Investment Forecast
($ billions)
$4.6
$2.9
2009 2010 2011 2012 2013 2014
Total
Base Case1 $4.0 $4.4 $4.6 $4.3 $4.2 $21.5
Low Case2 $3.3 $3.7 $3.9 $3.6 $3.5 $18.0
Base Case Forecast
By Classification
$%
Solar Rooftop Program 1.0 4
Edison SmartConnect™ 1.1 5
Generation 3.0 14
Transmission 5.5 26
Distribution 10.9 51
Total 21.5 100
By Proceeding%
2009 CPUC Rate Case 22
2012 CPUC Rate Case 41
Other CPUC 11
FERC Rate Cases 26
Total 100
1 | | Subject to timely receipt of permitting, licensing and regulatory approvals. |
2 Low Case reflects a 16.5% potential variability to project investment levels related to execution risk, scope change, delays, regulatory constraints and other contingencies.
June 2, 2010 4 EDISON INTERNATIONAL®

Leading the Way in Electricity SM
SCE Rate Base Forecast
($ billions)
$25.2
$23.0
$20.8
$18.1
$16.2
$14.8
2009 2010 2011 2012 2013 2014
5-Yr
CAGR
Base Case1 $14.8 $16.2 $18.1 $20.8 $23.0 $25.2 11%
Low Case2 $15.8 $17.2 $19.0 $20.5 $22.2 8%
1 Forecast includes: (1) 2009 CPUC GRC & FERC Decisions; (2) currently forecasted 2010-2014 FERC and 2012-2014 CPUC rate base, subject to timely receipt of permitting, licensing and regulatory approvals; (3) FERC construction work in progress forecast; (4) estimated impact of accelerated depreciation of the Economic Stimulus Act of 2009; and (5) CPUC approved solar rooftop program.
2 | | Reflects Low Case from SCE Capital Investment Forecast. |
June 2, 2010 5 EDISON INTERNATIONAL®
Leading the Way in Electricity SM
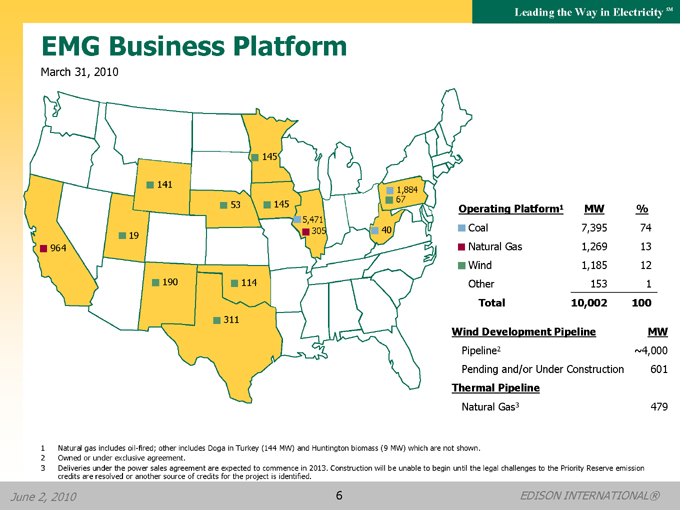
EMG Business Platform
March 31, 2010
145
141
1,884 145 67 53 5,471 305 40 19 964
190 114
311
Operating Platform1 MW %
Coal 7,395 74
Natural Gas 1,269 13
Wind 1,185 12
Other 153 1
Total 10,002 100
Wind Development Pipeline MW
Pipeline2 ~4,000
Pending and/or Under Construction 601
Thermal Pipeline
Natural Gas3 479
1 Natural gas includes oil-fired; other includes Doga in Turkey (144 MW) and Huntington biomass (9 MW) which are not shown.
2 | | Owned or under exclusive agreement. |
3 Deliveries under the power sales agreement are expected to commence in 2013. Construction will be unable to begin until the legal challenges to the Priority Reserve emission credits are resolved or another source of credits for the project is identified.
June 2, 2010 6 EDISON INTERNATIONAL®
Leading the Way in Electricity SM
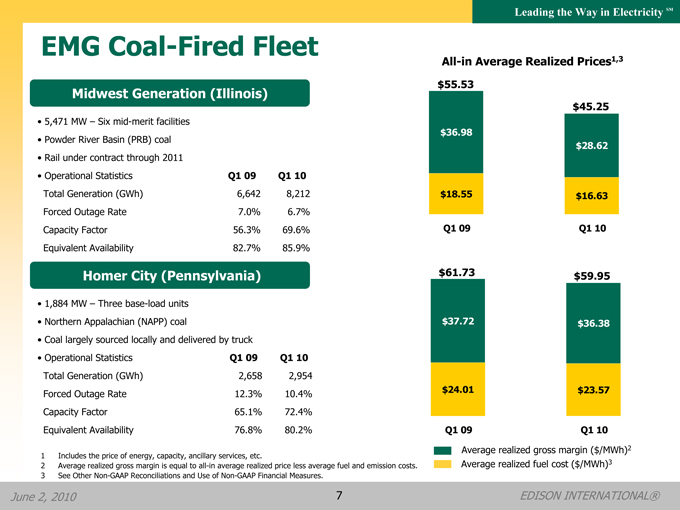
EMG Coal-Fired Fleet
Midwest Generation (Illinois)
• 5,471 MW – Six mid-merit facilities
• Powder River Basin (PRB) coal
• Rail under contract through 2011
• Operational Statistics Q1 09 Q1 10
Total Generation (GWh) 6,642 8,212
Forced Outage Rate 7.0% 6.7%
Capacity Factor 56.3% 69.6%
Equivalent Availability 82.7% 85.9%
Homer City (Pennsylvania)
• 1,884 MW – Three base-load units
• Northern Appalachian (NAPP) coal
• Coal largely sourced locally and delivered by truck
• Operational Statistics Q1 09 Q1 10
Total Generation (GWh) 2,658 2,954
Forced Outage Rate 12.3% 10.4%
Capacity Factor 65.1% 72.4%
Equivalent Availability 76.8% 80.2%
All-in Average Realized Prices1,3
$55.53
$45.25
$36.98
$28.62
$18.55 $16.63
Q1 09 Q1 10
$61.73 $59.95
$37.72 $36.38
$24.01 $23.57
Q1 09 Q1 10
Average realized gross margin ($/MWh)2
Average realized fuel cost ($/MWh)3
1 | | Includes the price of energy, capacity, ancillary services, etc. |
2 | | Average realized gross margin is equal to all-in average realized price less average fuel and emission costs. |
3 | | See Other Non-GAAP Reconciliations and Use of Non-GAAP Financial Measures. |
June 2, 2010 7 EDISON INTERNATIONAL®
Leading the Way in Electricity SM
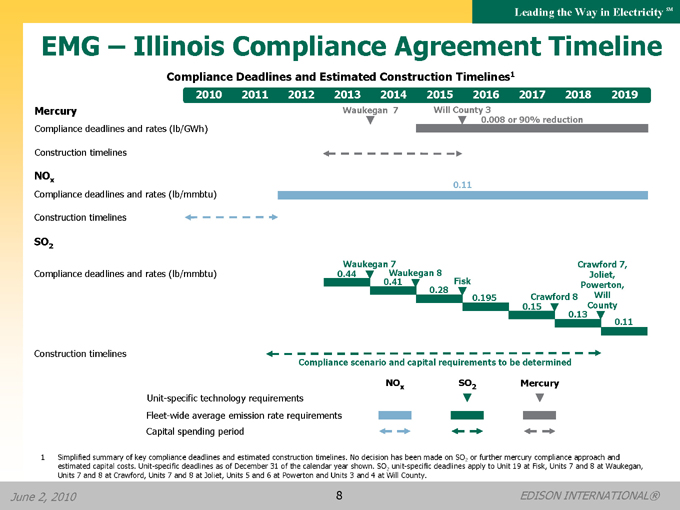
EMG – Illinois Compliance Agreement Timeline
Compliance Deadlines and Estimated Construction Timelines1
2010 2011 2012 2013 2014 2015 2016 2017 2018 2019
Mercury Waukegan 7 Will County 3
0.008 or 90% reduction
Compliance deadlines and rates (lb/GWh)
Construction timelines
NOx
0.11
Compliance deadlines and rates (lb/mmbtu)
Construction timelines
SO2
Waukegan 7 Crawford 7,
Compliance deadlines and rates (lb/mmbtu) 0.44 Waukegan 8 Joliet,
0.41 Fisk Powerton,
0.28 0.195 Crawford 8 Will
0.15 County
0.13
0.11
Construction timelines
Compliance scenario and capital requirements to be determined
NOx SO2 Mercury
Unit-specific technology requirements
Fleet-wide average emission rate requirements
Capital spending period
1 Simplified summary of key compliance deadlines and estimated construction timelines. No decision has been made on SO2 or further mercury compliance approach and estimated capital costs. Unit-specific deadlines as of December 31 of the calendar year shown. SO2 unit-specific deadlines apply to Unit 19 at Fisk, Units 7 and 8 at Waukegan, Units 7 and 8 at Crawford, Units 7 and 8 at Joliet, Units 5 and 6 at Powerton and Units 3 and 4 at Will County.
June 2, 2010 8 EDISON INTERNATIONAL®
Leading the Way in Electricity SM
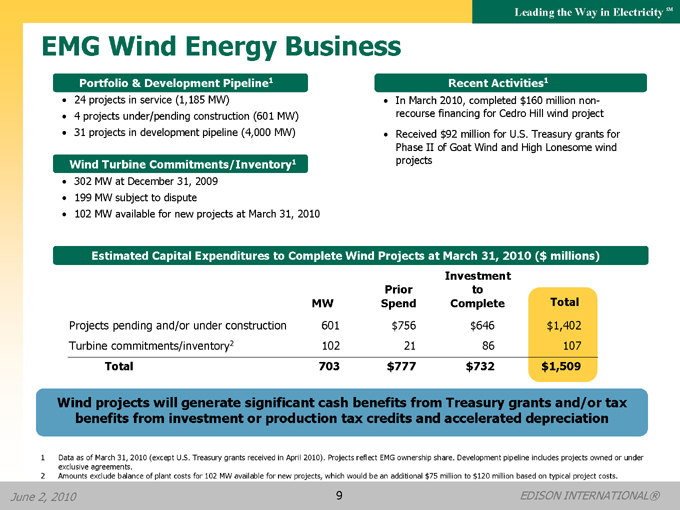
EMG Wind Energy Business
Portfolio & Development Pipeline1
24 projects in service (1,185 MW)
4 | | projects under/pending construction (601 MW) 31 projects in development pipeline (4,000 MW) |
Wind Turbine Commitments/Inventory1
302 MW at December 31, 2009 199 MW subject to dispute
102 MW available for new projects at March 31, 2010
Recent Activities1
In March 2010, completed $160 million non-recourse financing for Cedro Hill wind project Received $92 million for U.S. Treasury grants for Phase II of Goat Wind and High Lonesome wind projects
Estimated Capital Expenditures to Complete Wind Projects at March 31, 2010 ($ millions)
Investment to Complete
Prior Spend
MW
Total
Projects pending and/or under construction 601 $756 $646 $1,402
Turbine commitments/inventory2 102 21 86 107
Total 703 $777 $732 $1,509
Wind projects will generate significant cash benefits from Treasury grants and/or tax benefits from investment or production tax credits and accelerated depreciation
1 Data as of March 31, 2010 (except U.S. Treasury grants received in April 2010). Projects reflect EMG ownership share. Development pipeline includes projects owned or under exclusive agreements.
2 Amounts exclude balance of plant costs for 102 MW available for new projects, which would be an additional $75 million to $120 million based on typical project costs.
June 2, 2010 9 EDISON INTERNATIONAL®

Leading the Way in Electricity SM
Funding for 2010-11 Wind Investments
($ millions)
$289 $1,125
$104 $732 $765 $294 $471
Bank/Vendor Financing
$206 million Big Sky
$88 million Cedro Hill4
U.S. Treasury Grants
$92 million received in April 2010
$379 million anticipated in 20115
2010-2011 Spend (at 12/31/09)
Mitsubishi Turbines1
Q1 10 Spend & Other2
2010-2011 Spend3 (at 3/31/10)
Sources
1 EME’s turbine supply agreement with Mitsubishi Power Systems Americas, Inc. is subject to a legal dispute. Remaining payments subject to dispute under this agreement are $289 million.
2 | | Includes adjustments to cost estimates. |
3 Excludes balance of plant costs for 102 MW available for new projects, which would be an additional $75 million to $120 million based on typical project costs.
4 | | Remaining available balance. |
5 | | Estimate based on estimated construction costs and anticipated commercial operation dates. |
June 2, 2010 10 EDISON INTERNATIONAL®
Leading the Way in Electricity SM
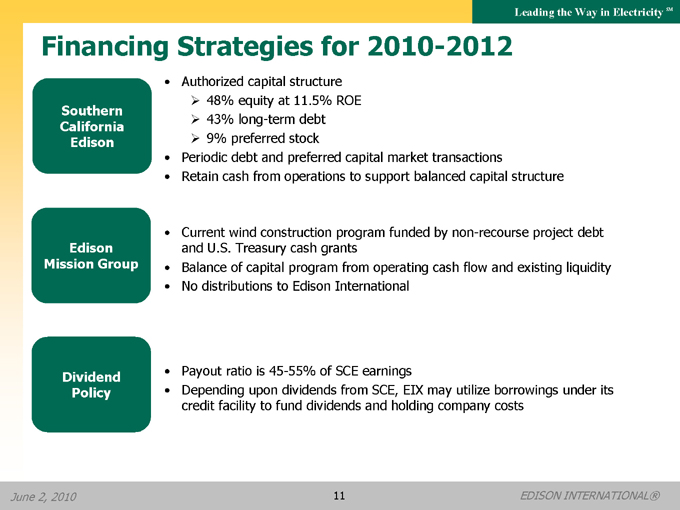
Financing Strategies for 2010-2012
Southern California Edison
Authorized capital structure
48% equity at 11.5% ROE
43% long-term debt
9% preferred stock
Periodic debt and preferred capital market transactions
Retain cash from operations to support balanced capital structure
Edison Mission Group
Current wind construction program funded by non-recourse project debt and U.S. Treasury cash grants Balance of capital program from operating cash flow and existing liquidity No distributions to Edison International
Dividend Policy
Payout ratio is 45-55% of SCE earnings
Depending upon dividends from SCE, EIX may utilize borrowings under its credit facility to fund dividends and holding company costs
June 2, 2010 11 EDISON INTERNATIONAL®
Leading the Way in Electricity SM
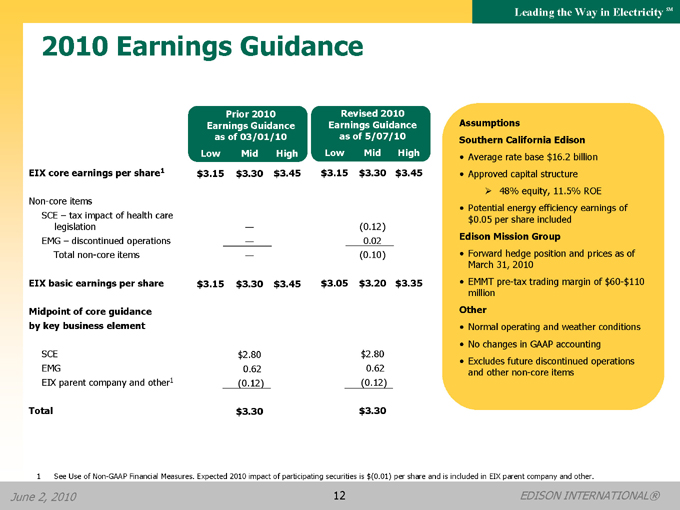
2010 Earnings Guidance
Prior 2010 Earnings Guidance as of 03/01/10 as of 5/07/10
Revised 2010 Earnings Guidance
Low Mid High Low Mid High
EIX core earnings per share1 $3.15 $3.30 $3.45 $3.15 $3.30 $3.45
Non-core items
SCE – tax impact of health care
legislation — (0.12)
EMG – discontinued operations — 0.02
Total non-core items — (0.10)
EIX basic earnings per share $3.15 $3.30 $3.45 $3.05 $3.20 $3.35
Midpoint of core guidance
by key business element
SCE $2.80 $2.80
EMG 0.62 0.62
EIX parent company and other1(0.12)(0.12)
Total $3.30 $3.30
Assumptions
Southern California Edison
• Average rate base $16.2 billion
• Approved capital structure
• 48% equity, 11.5% ROE
• Potential energy efficiency earnings of
$0.05 per share included
Edison Mission Group
• Forward hedge position and prices as of
March 31, 2010
• EMMT pre-tax trading margin of $60-$110
million
Other
• Normal operating and weather conditions
• No changes in GAAP accounting
• Excludes future discontinued operations
and other non-core items
1 See Use of Non-GAAP Financial Measures. Expected 2010 impact of participating securities is $(0.01) per share and is included in EIX parent company and other.
June 2, 2010 12 EDISON INTERNATIONAL®
Leading the Way in Electricity SM
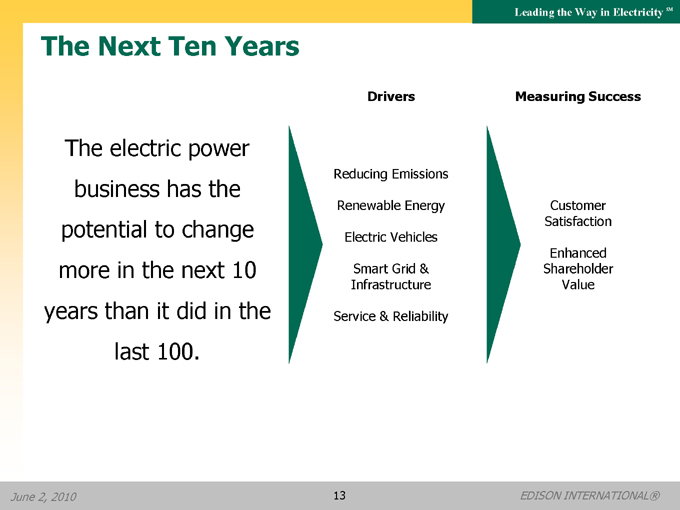
The Next Ten Years
Drivers
Measuring Success
The electric power business has the potential to change more in the next 10 years than it did in the last 100.
Reducing Emissions Renewable Energy Electric Vehicles
Smart Grid & Infrastructure
Service & Reliability
Customer Satisfaction
Enhanced Shareholder Value
June 2, 2010 13 EDISON INTERNATIONAL®
Leading the Way in Electricity SM
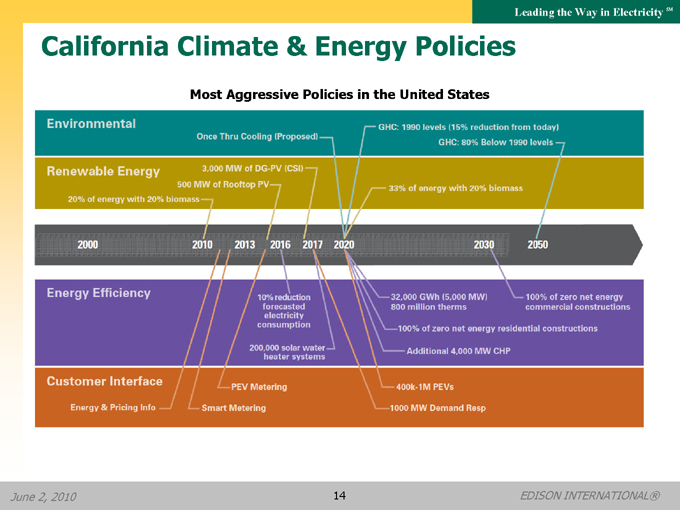
California Climate & Energy Policies
Most Aggressive Policies in the United States
Enviromental
One thru cooling (proposed)
GHC: 1990 levels (15% reduction from today)
GHC: 80% Below 1990 levels
Renewable Energy
3,000 MW of DG-PV (CSI)
500 MW of Rooftop PV
20% of energy with 20% biomass
33% of energy with 20% biomass
2000
2010
2013
2016
2017
2020
2030
2050
Energy Efficiency
10% reduction forecasted electricity consumption
200,000 solar water heater systems
32,000 GWh (5,000 MW) 800 million therms
100% of zero net energy residential constructions
Additional 4,000 MW CHP
100% of zero net energy commercial constructions
Customer Interface
Energy & Pricing Info
PEV Metering
Smart Metering
400k-1M PEVs
1000MV Demand Resp
June 2, 2010 14 EDISON INTERNATIONAL®

Leading the Way in Electricity SM
SCE Renewable Portfolio
SCE 2010 20% Renewable Energy Goal
Contracts are in place to meet 20% of customers’ energy requirement with renewable resources, but a portion of energy delivery may be delayed in 2010 due to transmission constraints. SCE expects to meet the 2010 goal with flexible compliance that allows banking and earmarking of past and future renewable energy surplus.
Renewable Resources
(billion kWh)
Small Hydro 4% Solar 6% Biomass 7%
Geothermal 57% Wind 26%
SCE Renewable Resource % of Total Delivered Portfolio
9% Increase
94% Increase
13.6
14.8
28.7
2009 2010 2020
20% RPS (forecast)
Potential 33% RPS (forecast)
17% 19+%
June 2, 2010 15 EDISON INTERNATIONAL®
Leading the Way in Electricity SM
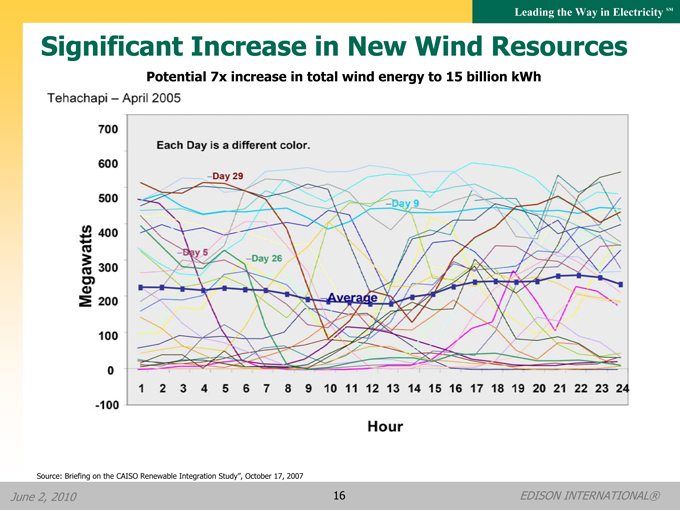
Significant Increase in New Wind Resources
Potential 7x increase in total wind energy to 15 billion kWh
Tehachapi – April 2005
Megawatts
700
600
500
400
300
200
100
0
-100
9
10
11
12
13
14
15
16
17
18
19
20
21
22
23
24
Hour
Each Day is a different color.
–Day 29 –Day5 –Day26 Average –Day9
Source: Briefing on the CAISO Renewable Integration Study”, October 17, 2007
June 2, 2010 16 EDISON INTERNATIONAL®
Leading the Way in Electricity SM
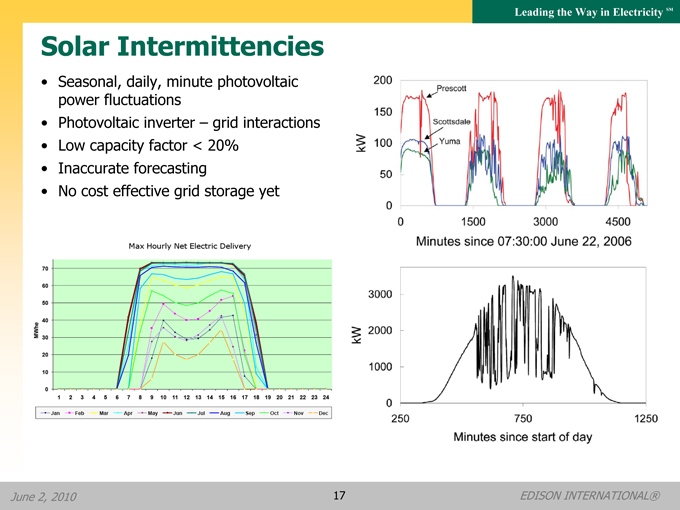
Solar Intermittencies
• Seasonal, daily, minute photovoltaic power fluctuations
• Photovoltaic inverter – grid interactions
• Low capacity factor < 20%
• Inaccurate forecasting
• No cost effective grid storage yet
June 2, 2010 17 EDISON INTERNATIONAL®
Leading the Way in Electricity SM
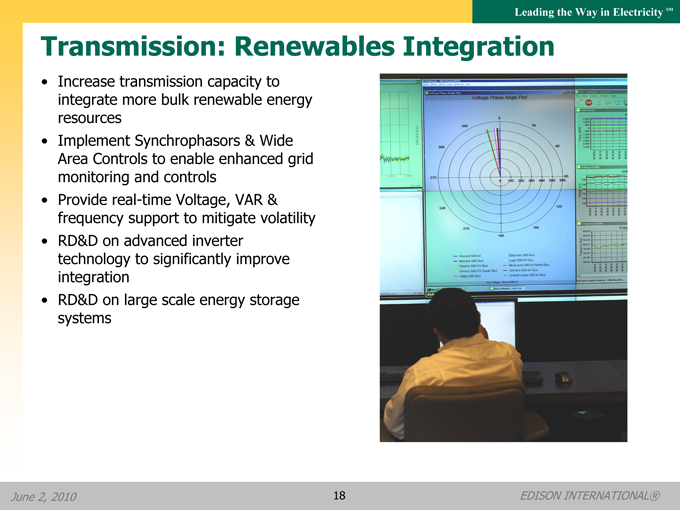
Transmission: Renewables Integration
Increase transmission capacity to integrate more bulk renewable energy resources Implement Synchrophasors & Wide Area Controls to enable enhanced grid monitoring and controls Provide real-time Voltage, VAR & frequency support to mitigate volatility RD&D on advanced inverter technology to significantly improve integration RD&D on large scale energy storage systems
June 2, 2010 18 EDISON INTERNATIONAL®

Leading the Way in Electricity SM
Plug-in Vehicle Forecast for SCE Service Area
Early Market (2010-2014) Thousands of vehicles
Modest number of PEVs
Early adopters with high expectations 1,200
Uncertainty around market development 1,000
New policies and standards
developed & implemented 800
Growing Market (2015+) 600
Growing number of PEVs;
Some clarity around customer charging behavior and impacts to electric grid 400
Growing significance of load
management 200
0
High Mid Low
2010 2012 2014 2016 2018 2020
June 2, 2010 19 EDISON INTERNATIONAL®
Leading the Way in Electricity SM
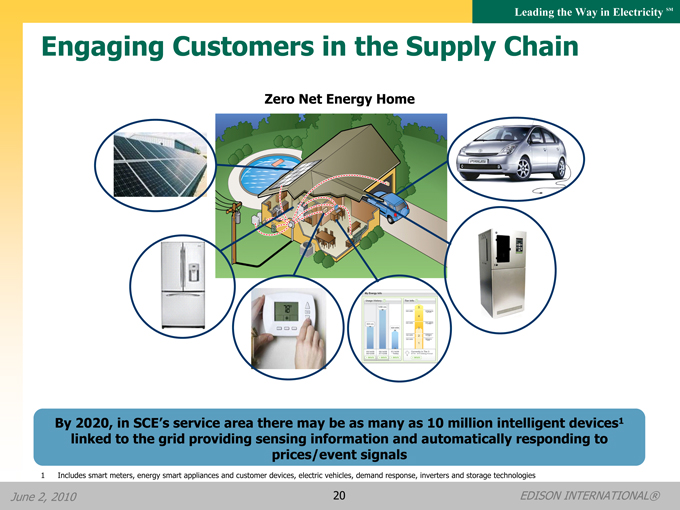
Engaging Customers in the Supply Chain
Zero Net Energy Home
By 2020, in SCE’s service area there may be as many as 10 million intelligent devices1 linked to the grid providing sensing information and automatically responding to prices/event signals
1 Includes smart meters, energy smart appliances and customer devices, electric vehicles, demand response, inverters and storage technologies
June 2, 2010 20 EDISON INTERNATIONAL®
Leading the Way in Electricity SM
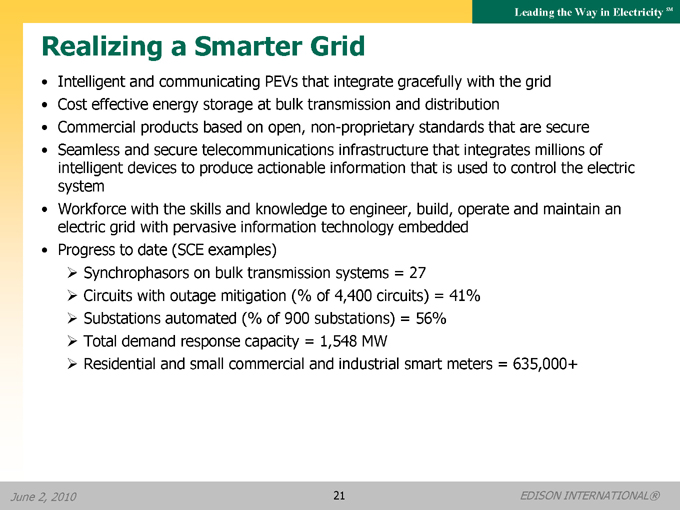
Realizing a Smarter Grid
• Intelligent and communicating PEVs that integrate gracefully with the grid
• Cost effective energy storage at bulk transmission and distribution
• Commercial products based on open, non-proprietary standards that are secure
• Seamless and secure telecommunications infrastructure that integrates millions of
intelligent devices to produce actionable information that is used to control the electric
system
• Workforce with the skills and knowledge to engineer, build, operate and maintain an
electric grid with pervasive information technology embedded
• Progress to date (SCE examples)
Synchrophasors on bulk transmission systems = 27
Circuits with outage mitigation (% of 4,400 circuits) = 41%
Substations automated (% of 900 substations) = 56%
Total demand response capacity = 1,548 MW
Residential and small commercial and industrial smart meters = 635,000+
June 2, 2010 21 EDISON INTERNATIONAL®
Leading the Way in Electricity SM
Our Shareholder Value Proposition
Dual platform operating across the full spectrum of the
electricity industry
Southern California Edison
Among the best domestic electric utility growth
platforms
Supportive regulatory framework
Leadership in renewable energy, energy efficiency,
electric vehicles and smart grid development
Edison Mission Group
See real equity value in the portfolio
Working coal fleet environmental compliance issues
Current wind construction program is self-funding
Commitment to long-term shareholder value creation
Incentive compensation and stock ownership guidelines
consistent with shareholder interests
Edison people committed to excellence in safety and
customer service
June 2, 2010 22 EDISON INTERNATIONAL®
Leading the Way in Electricity SM
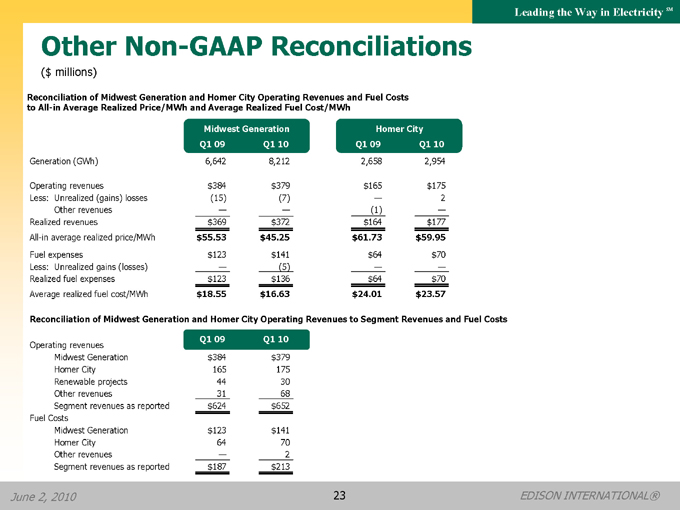
Other Non-GAAP Reconciliations
($ millions)
Reconciliation of Midwest Generation and Homer City Operating Revenues and Fuel Costs to All-in Average Realized Price/MWh and Average Realized Fuel Cost/MWh
Midwest Generation Homer City
Q1 09 Q1 10 Q1 09 Q1 10
Generation (GWh) 6,642 8,212 2,658 2,954
Operating revenues $384 $379 $165 $175
Less: Unrealized (gains) losses (15) (7) — 2
Other revenues — — (1) —
Realized revenues $369 $372 $164 $177
All-in average realized price/MWh $55.53 $45.25 $61.73 $59.95
Fuel expenses $123 $141 $64 $70
Less: Unrealized gains (losses) — (5) — —
Realized fuel expenses $123 $136 $64 $70
Average realized fuel cost/MWh $18.55 $16.63 $24.01 $23.57
Reconciliation of Midwest Generation and Homer City Operating Revenues to Segment Revenues and Fuel Costs
Operating revenues Q1 09 Q1 10
Midwest Generation $384 $379
Homer City 165 175
Renewable projects 44 30
Other revenues 31 68
Segment revenues as reported $624 $652
Fuel Costs
Midwest Generation $123 $141
Homer City 64 70
Other revenues — 2
Segment revenues as reported $187 $213
June 2, 2010 23 EDISON INTERNATIONAL®
Leading the Way in Electricity SM
Use of Non-GAAP Financial Measures
Edison International’s earnings are prepared in accordance with generally accepted accounting principles used in the United States and represent the company’s earnings as reported to the Securities and Exchange Commission. Our management uses core earnings and EPS by principal operating subsidiary internally for financial planning and for analysis of performance. We also use core earnings and EPS by principal operating subsidiary when communicating with analysts and investors regarding our earnings results and outlook, to facilitate the company’s performance from period to period.
Core earnings is a Non-GAAP financial measure and may not be comparable to those of other companies. Core earnings and core earnings per share are defined as GAAP earnings and GAAP earnings per share excluding income or loss from discontinued operations and income or loss from significant discrete items that management does not consider representative of ongoing earnings. GAAP earnings refer to net income attributable to Edison International or attributable to the common shareholders of each subsidiary and Edison International GAAP earnings per share refers to basic earnings per common share attributable to Edison International common shareholders. EPS by principal operating subsidiary is based on the principal operating subsidiaries’ net income attributable to the common shareholders of each subsidiary, respectively, and Edison International’s weighted average outstanding common shares. The impact of participating securities (vested stock options that earn dividend equivalents that may participate in undistributed earnings with common stock) for each principal operating subsidiary is not material to each principal operating subsidiary’s EPS and is therefore reflected in the results of the Edison International holding company, which we refer to as EIX parent company and other.
EBITDA is defined as earnings before interest, income taxes, depreciation and amortization. Adjusted EBITDA includes production tax credits from EMG’s wind projects and excludes amounts from gain on the sale of assets, loss on early extinguishment of debt and leases, and impairment of assets and investments. Our management uses Adjusted EBITDA as an important financial measure for evaluating EMG.
The average realized energy price and average realized fuel cost is a non-GAAP performance measure since such statistical measures exclude unrealized gains or losses recorded as operating revenues and unrealized gains or losses recorded as fuel expenses. Management believes that the average realized energy price and average realized fuel cost is more meaningful for investors as it reflects the impact of hedge contracts at the time of actual generation in period-over-period comparisons or as compared to real-time market prices.
A reconciliation of Non-GAAP information to GAAP information, including the impact of participating securities, is included either on the slide where the information appears or on another slide referenced in this presentation.
24