Exhibit 99.1

Business Update
Handout
September 14, 2006
Forward-Looking Statement
This presentation contains “forward-looking statements” within the meaning of the Private Securities Litigation Reform Act of 1995. Forward-looking statements reflect Edison International’s current expectations and projections about future events based on Edison International’s knowledge of present facts and circumstances and assumptions about future events and include any statement that does not directly relate to a historical or current fact. In this presentation and elsewhere, the words “expects,” “believes,” “anticipates,” “estimates,” “projects,” “intends,” “plans,” “probable,” “may,” “will,” “could,” “would,” “should,” and variations of such words and similar expressions, or discussions of strategy or of plans, are intended to identify forward-looking statements. Such statements necessarily involve risks and uncertainties that could cause actual results to differ materially from those anticipated. Some of the risks, uncertainties and other important factors that could cause results to differ, or that otherwise could impact Edison International or its subsidiaries, include but are not limited to:
| | • | | the ability of Edison International to meet its financial obligations and to pay dividends on its common stock if its subsidiaries are unable to pay dividends; |
| | • | | the ability of Southern California Edison (SCE) to recover its costs in a timely manner from its customers through regulated rates; |
| | • | | decisions and other actions by the California Public Utilities Commission (CPUC) and other regulatory authorities and delays in regulatory actions; |
| | • | | market risks affecting SCE’s energy procurement activities; |
| | • | | access to capital markets and the cost of capital; |
| | • | | changes in interest rates, rates of inflation and foreign exchange rates; |
| | • | | governmental, statutory, regulatory or administrative changes or initiatives affecting the electricity industry, including the market structure rules applicable to each market and environmental regulations that could require additional expenditures or otherwise affect the cost and manner of doing business; |
| | • | | risks associated with operating nuclear and other power generating facilities, including operating risks, nuclear fuel storage, equipment failure, availability, heat rate and output; |
| | • | | the availability of labor, equipment and materials; |
| | • | | the ability to obtain sufficient insurance, including insurance relating to SCE’s nuclear facilities; |
| | • | | effects of legal proceedings, changes in or interpretations of tax laws, rates or policies, and changes in accounting standards; |
| | • | | supply and demand for electric capacity and energy, and the resulting prices and dispatch volumes, in the wholesale markets to which MEHC generating units have access; |
| | • | | the cost and availability of coal, natural gas, and fuel oil, nuclear fuel, and associated transportation; • the cost and availability of emission credits or allowances for emission credits; |
| | • | | transmission congestion in and to each market area and the resulting differences in prices between delivery points; |
| | • | | the ability to provide sufficient collateral in support of hedging activities and purchased power and fuel; |
| | • | | the extent of additional supplies of capacity, energy and ancillary services from current competitors or new market entrants, including the development of new generation facilities and technologies; |
| | • | | the difficulty of predicting wholesale prices, transmission congestion, energy demand, and other activities in the complex and volatile markets in which MEHC and its subsidiaries participate; |
| | • | | general political, economic and business conditions; |
| | • | | weather conditions, natural disasters and other unforeseen events; and |
| | • | | changes in the fair value of investments and other assets accounted for using fair value accounting. |
Additional information about risks and uncertainties, including more detail about the factors described above, is contained in Edison International’s reports filed with the Securities and Exchange Commission. Readers are urged to read such reports and carefully consider the risks, uncertainties and other factors that affect Edison International’s business. Readers also should review future reports filed by Edison International with the Securities and Exchange Commission. The information contained in this presentation is subject to change without notice. Forward-looking statements speak only as of the date they are made and Edison International is not obligated to publicly update or revise forward-looking statements.
1
Edison International - -Value Drivers
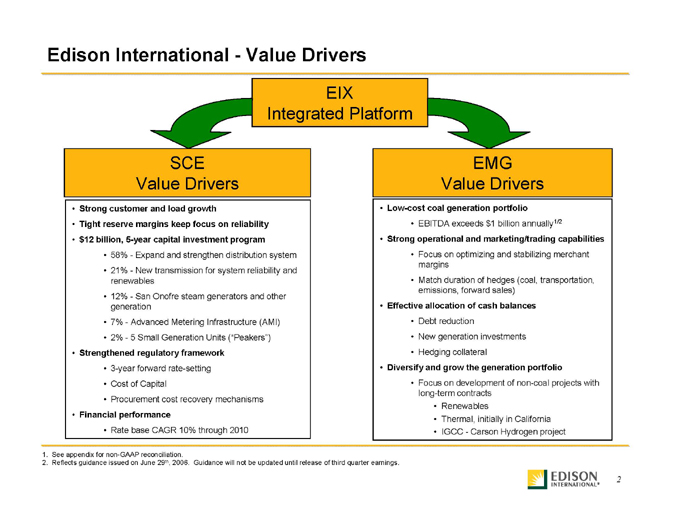
EIX Integrated Platform
SCE Value Drivers
• | | Strong customer and load growth |
• | | Tight reserve margins keep focus on reliability |
• | | $12 billion, 5-year capital investment program |
| | • | | 58% - Expand and strengthen distribution system |
| | • | | 21% - New transmission for system reliability and renewables |
| | • | | 12% - San Onofre steam generators and other generation |
| | • | | 7% - Advanced Metering Infrastructure (AMI) |
| | • | | 2% - 5 Small Generation Units (“Peakers”) |
• | | Strengthened regulatory framework |
| | • | | 3-year forward rate-setting |
| | • | | Procurement cost recovery mechanisms |
| | • | | Rate base CAGR 10% through 2010 |
EMG Value Drivers
• | | Low-cost coal generation portfolio |
| | • | | EBITDA exceeds $1 billion annually1/2 |
• | | Strong operational and marketing/trading capabilities |
| | • | | Focus on optimizing and stabilizing merchant margins |
| | • | | Match duration of hedges (coal, transportation, emissions, forward sales) |
• | | Effective allocation of cash balances |
| | • | | New generation investments |
• | | Diversify and grow the generation portfolio |
| | • | | Focus on development of non-coal projects with long-term contracts |
| | • | | Thermal, initially in California |
| | • | | IGCC - Carson Hydrogen project |
1. | | See appendix for non-GAAP reconciliation. |
2. | | Reflects guidance issued on June 29th, 2006. Guidance will not be updated until release of third quarter earnings. |
2
System Growth
Capital Investment
Regulatory Framework
Southern California Edison (SCE)
3
SCE Value Driver – System Growth
System Growth
Capital Investment
Regulatory Framework
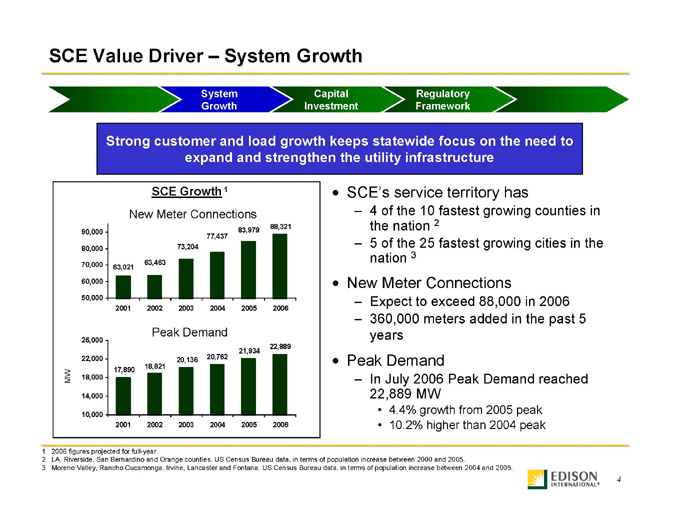
Strong customer and load growth keeps statewide focus on the need to expand and strengthen the utility infrastructure
SCE Growth 1
New Meter Connections
90,000
80,000
70,000
60,000
50,000
63,021
63,463
73,204
77,437
83,979
2001
2002
2003
2004
2005
2006
Peak Demand
MW
26,000
22,000
18,000
14,000
10,000
17,890
18,821
20,136
20,762
21,934
2001
2002
2003
2004
2005
2006
SCE’s service territory has
| | – | | 4 of the 10 fastest growing counties in the nation 2 |
| | – | | 5 of the 25 fastest growing cities in the nation 3 |
New Meter Connections
| | – | | Expect to exceed 88,000 in 2006 |
| | – | | 360,000 meters added in the past 5 years |
Peak Demand
| | – | | In July 2006 Peak Demand reached 22,889 MW |
| | • | | 4.4% growth from 2005 peak |
| | • | | 10.2% higher than 2004 peak |
1. | | 2006 figures projected for full-year. |
2. | | LA, Riverside, San Bernardino and Orange counties. US Census Bureau data, in terms of population increase between 2000 and 2005. |
3. | | Moreno Valley, Rancho Cucamonga, Irvine, Lancaster and Fontana. US Census Bureau data, in terms of population increase between 2004 and 2005. |
4
SCE Value Driver – System Growth
System Growth
Capital Investment
Regulatory Framework
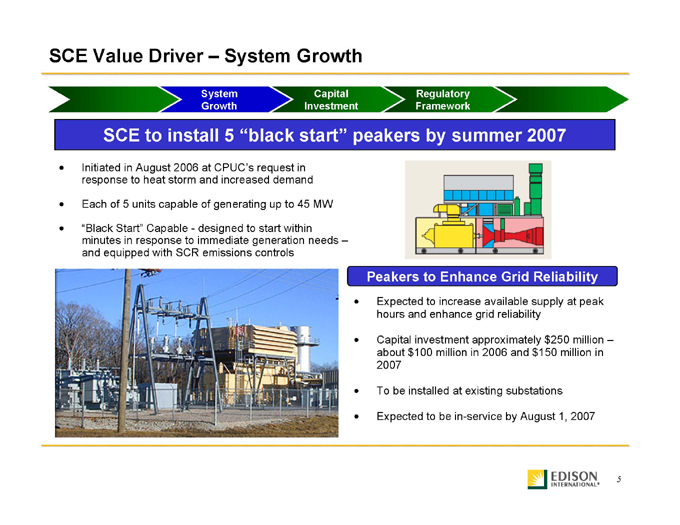
SCE to install 5 “black start” peakers by summer 2007
| | • | | Initiated in August 2006 at CPUC’s request in response to heat storm and increased demand |
| | • | | Each of 5 units capable of generating up to 45 MW |
| | • | | “Black Start” Capable - designed to start within minutes in response to immediate generation needs – and equipped with SCR emissions controls |
Peakers to Enhance Grid Reliability
| | • | | Expected to increase available supply at peak hours and enhance grid reliability |
| | • | | Capital investment approximately $250 million – about $100 million in 2006 and $150 million in 2007 |
| | • | | To be installed at existing substations |
| | • | | Expected to be in-service by August 1, 2007 |
5
SCE Value Driver – System Growth
System Growth
Capital Investment
Regulatory Framework
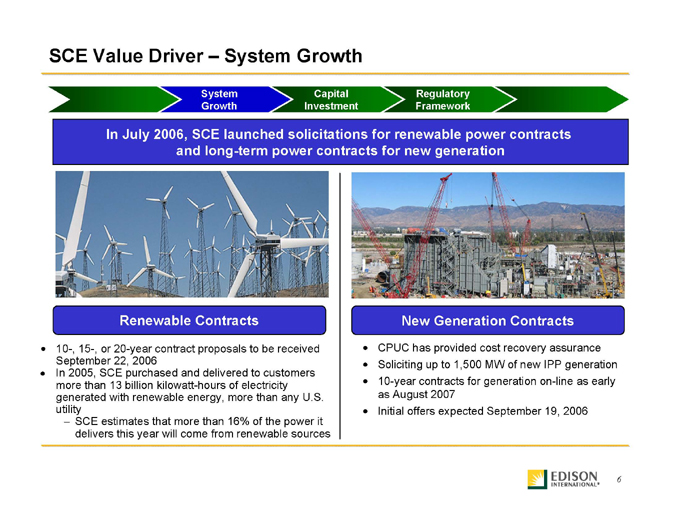
In July 2006, SCE launched solicitations for renewable power contracts and long-term power contracts for new generation
Renewable Contracts
| | • | | 10-, 15-, or 20-year contract proposals to be received September 22, 2006 |
| | • | | In 2005, SCE purchased and delivered to customers more than 13 billion kilowatt-hours of electricity generated with renewable energy, more than any U.S. utility |
| | – | | SCE estimates that more than 16% of the power it delivers this year will come from renewable sources |
New Generation Contracts
| | • | | CPUC has provided cost recovery assurance |
| | • | | Soliciting up to 1,500 MW of new IPP generation |
| | • | | 10-year contracts for generation on-line as early as August 2007 |
| | • | | Initial offers expected September 19, 2006 |
6
SCE Value Driver – Capital Investment
System Growth
Capital Investment
Regulatory Framework
SCE cited as industry leader in advanced metering
“SCE has taken an industry leadership position as the first U.S. utility to adopt EPRI’s IntelliGrid Architecture for a system-wide advanced metering deployment.”
Arshad Mansoor, V.P. of Power Delivery & Marketing Electric Power Research Institute (EPRI) News Release Palo Alto, CA – August 21, 2006
SCE AMI Phase I selected as “2005-2006 Best AMR Initiative in a North American IOU” by international utility peers.
Utility Planning Network and Automatic Meter Reader Association (UPN-AMRA), August 9, 2006
7
SCE Value Driver – Capital Investment
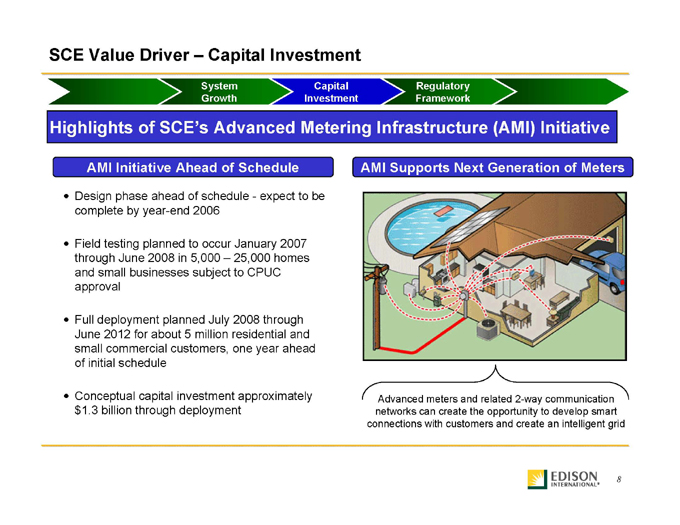
Highlights of SCE’s Advanced Metering Infrastructure (AMI) Initiative
AMI Initiative Ahead of Schedule
| | • | | Design phase ahead of schedule - expect to be complete by year-end 2006 |
| | • | | Field testing planned to occur January 2007 through June 2008 in 5,000 – 25,000 homes and small businesses subject to CPUC approval |
| | • | | Full deployment planned July 2008 through June 2012 for about 5 million residential and small commercial customers, one year ahead of initial schedule |
| | • | | Conceptual capital investment approximately $1.3 billion through deployment |
AMI Supports Next Generation of Meters
Advanced meters and related 2-way communication networks can create the opportunity to develop smart connections with customers and create an intelligent grid
8
SCE Value Driver – Capital Investment
Regulatory Framework
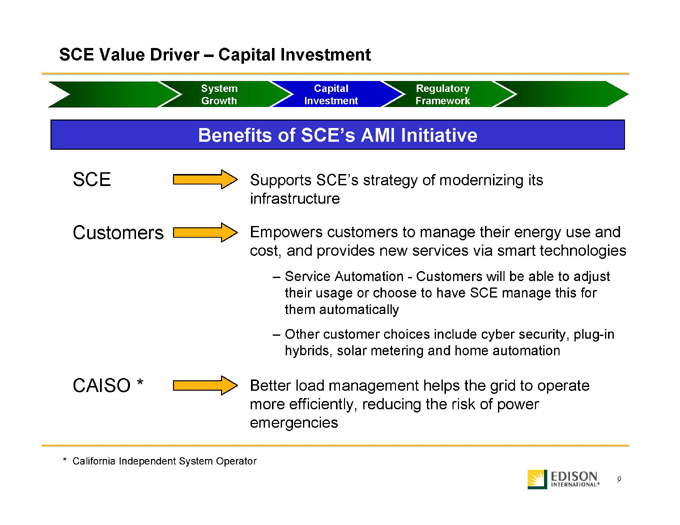
Benefits of SCE’s AMI Initiative
Supports | | SCE’s strategy of modernizing its infrastructure |
Empowers | | customers to manage their energy use and cost, and provides new services via smart technologies |
| | – | | Service Automation - Customers will be able to adjust their usage or choose to have SCE manage this for them automatically |
| | – | | Other customer choices include cyber security, plug-in hybrids, solar metering and home automation |
Better | | load management helps the grid to operate more efficiently, reducing the risk of power emergencies |
* | | California Independent System Operator |
9
SCE Value Driver – Capital Investment
Regulatory Framework
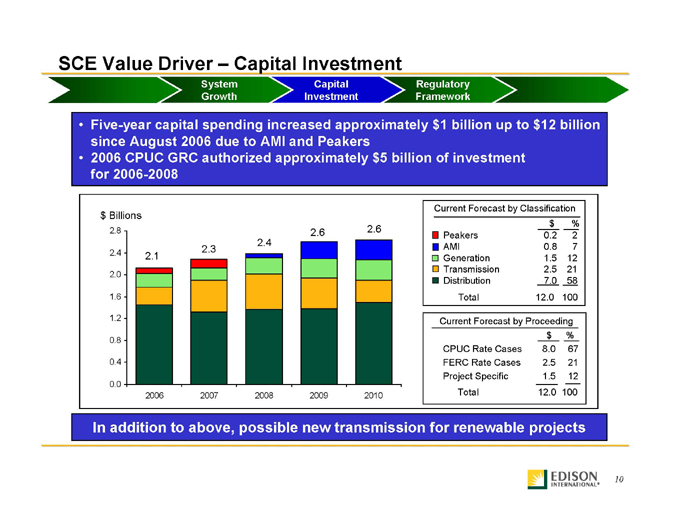
| | • | | Five-year capital spending increased approximately $1 billion up to $12 billion since August 2006 due to AMI and Peakers |
| | • | | 2006 CPUC GRC authorized approximately $5 billion of investment for 2006-2008 |
$ Billions
2.0
1.6
1.2
0.8
0.4
0.0
Current Forecast by Classification
$ %
Peakers 0.2 2
AMI 0.8 7
Generation 1.5 12
Transmission 2.5 21
Distribution 7.0 58
Total 12.0 100
Current Forecast by Proceeding
$ %
In addition to above, possible new transmission for renewable projects
10
SCE Value Driver – Capital Investment
Regulatory Framework
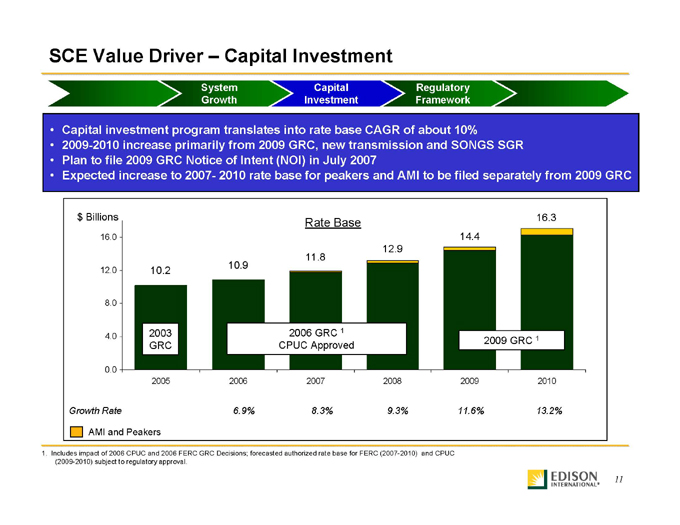
• | | Capital investment program translates into rate base CAGR of about 10% |
• | | 2009-2010 increase primarily from 2009 GRC, new transmission and SONGS SGR |
• | | Plan to file 2009 GRC Notice of Intent (NOI) in July 2007 |
• | | Expected increase to 2007- 2010 rate base for peakers and AMI to be filed separately from 2009 GRC |
$ Billions
16.3
Rate Base
8.0
0.0
6.9% | | 8.3% 9.3% 11.6% 13.2% |
AMI and Peakers
1. | | Includes impact of 2006 CPUC and 2006 FERC GRC Decisions; forecasted authorized rate base for FERC (2007-2010) and CPUC (2009-2010) subject to regulatory approval. |
11
SCE Value Driver – Regulatory Framework
Regulatory Framework
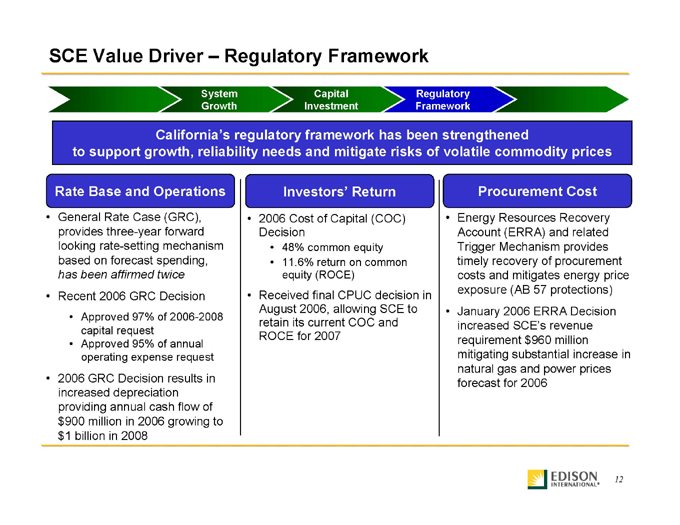
California’s regulatory framework has been strengthened to support growth, reliability needs and mitigate risks of volatile commodity prices
Rate Base and Operations
• | | General Rate Case (GRC), provides three-year forward looking rate-setting mechanism based on forecast spending, has been affirmed twice |
• | | Recent 2006 GRC Decision |
| | • | | Approved 97% of 2006-2008 capital request |
| | • | | Approved 95% of annual operating expense request |
| | • | | 2006 GRC Decision results in increased depreciation providing annual cash flow of $900 million in 2006 growing to $1 billion in 2008 |
Investors’ Return
• | | 2006 Cost of Capital (COC) Decision |
| | • | | 11.6% return on common equity (ROCE) |
• | | Received final CPUC decision in August 2006, allowing SCE to retain its current COC and ROCE for 2007 |
Procurement Cost
• | | Energy Resources Recovery Account (ERRA) and related Trigger Mechanism provides timely recovery of procurement costs and mitigates energy price exposure (AB 57 protections) |
• | | January 2006 ERRA Decision increased SCE’s revenue requirement $960 million mitigating substantial increase in natural gas and power prices forecast for 2006 |
12
Operational/Marketing/ | | Trading Capabilities |
Edison Mission Group (EMG)
13
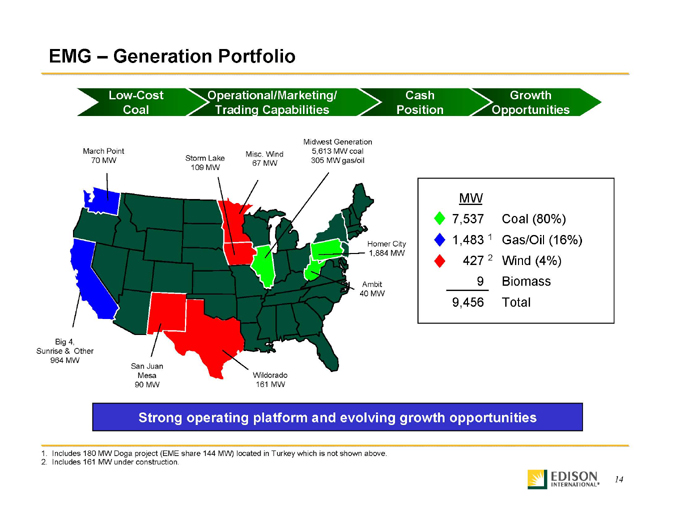
EMG – Generation Portfolio
Operational/Marketing/ | | Trading Capabilities |
Misc. Wind
67 MW
Storm Lake
109 MW
March Point
70 MW
Homer City
1,884 MW
Ambit
40 MW
Big 4, Sunrise & Other
964 MW
San Juan Mesa
90 MW
Wildorado
161 MW
MW
9 Biomass
9,456 Total
Strong operating platform and evolving growth opportunities
1. | | Includes 180 MW Doga project (EME share 144 MW) located in Turkey which is not shown above. |
2. | | Includes 161 MW under construction. |
14
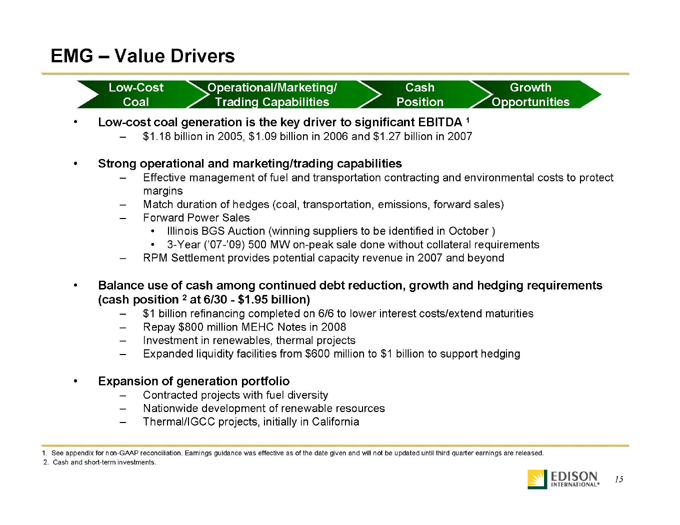
EMG – Value Drivers
Operational/Marketing/ | | Trading Capabilities |
| | • | | Low-cost coal generation is the key driver to significant EBITDA 1 |
| | – | | $1.18 billion in 2005, $1.09 billion in 2006 and $1.27 billion in 2007 |
| | • | | Strong operational and marketing/trading capabilities |
| | – | | Effective management of fuel and transportation contracting and environmental costs to protect margins |
| | – | | Match duration of hedges (coal, transportation, emissions, forward sales) |
| | • | | Illinois BGS Auction (winning suppliers to be identified in October ) |
| | • | | 3-Year (‘07-’09) 500 MW on-peak sale done without collateral requirements |
| | – | | RPM Settlement provides potential capacity revenue in 2007 and beyond |
| | • | | Balance use of cash among continued debt reduction, growth and hedging requirements (cash position 2 at 6/30 - $1.95 billion) |
| | – | | $1 billion refinancing completed on 6/6 to lower interest costs/extend maturities |
| | – | | Repay $800 million MEHC Notes in 2008 |
| | – | | Investment in renewables, thermal projects |
| | – | | Expanded liquidity facilities from $600 million to $1 billion to support hedging |
| | • | | Expansion of generation portfolio |
| | – | | Contracted projects with fuel diversity |
| | – | | Nationwide development of renewable resources |
| | – | | Thermal/IGCC projects, initially in California |
1. | | See appendix for non-GAAP reconciliation. Earnings guidance was effective as of the date given and will not be updated until third quarter earnings are released. |
2. | | Cash and short-term investments. |
15
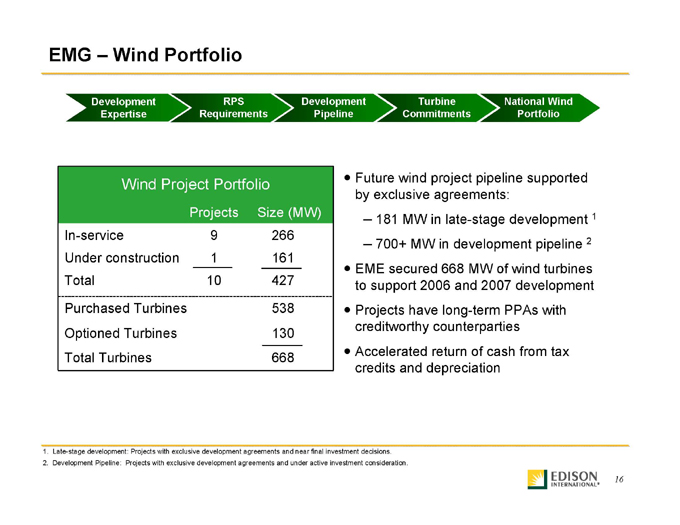
EMG – Wind Portfolio
Wind Project Portfolio
Projects Size (MW) In-service 9 266 Under construction 1 161 Total 10 427 Purchased Turbines 538 Optioned Turbines 130 Total Turbines 668
• | | Future wind project pipeline supported by exclusive agreements: |
| | – | | 181 MW in late-stage development 1 |
| | – | | 700+ MW in development pipeline 2 |
• | | EME secured 668 MW of wind turbines to support 2006 and 2007 development |
• | | Projects have long-term PPAs with creditworthy counterparties |
• | | Accelerated return of cash from tax credits and depreciation |
1. | | Late-stage development: Projects with exclusive development agreements and near final investment decisions. |
2. | | Development Pipeline: Projects with exclusive development agreements and under active investment consideration. |
16
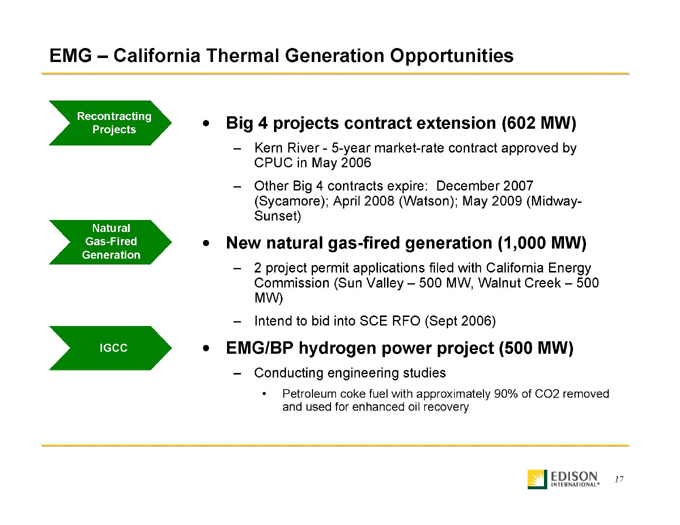
EMG – California Thermal Generation Opportunities
Recontracting Projects
• | | Big 4 projects contract extension (602 MW) |
| | – | | Kern River - 5-year market-rate contract approved by CPUC in May 2006 |
| | – | | Other Big 4 contracts expire: December 2007 (Sycamore); April 2008 (Watson); May 2009 (Midway-Sunset) |
Natural Gas-Fired Generation
• | | New natural gas-fired generation (1,000 MW) |
| | – | | 2 project permit applications filed with California Energy Commission (Sun Valley – 500 MW, Walnut Creek – 500 MW) |
| | – | | Intend to bid into SCE RFO (Sept 2006) |
• | | EMG/BP hydrogen power project (500 MW) |
| | – | | Conducting engineering studies |
| | • | | Petroleum coke fuel with approximately 90% of CO2 removed and used for enhanced oil recovery |
17
Performance
Balance Sheet Strength
Growth
Dividends
Shareholder Returns
Year to Date Performance through June 30, 2006
18
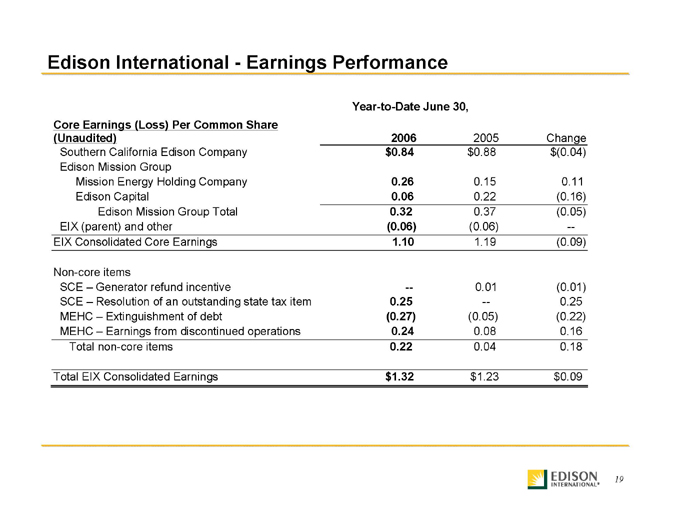
Edison International - - Earnings Performance
Year-to-Date June 30,
Core Earnings (Loss) Per Common Share
(Unaudited)
2006
2005
Change
Southern California Edison Company
$0.84 $0.88 $(0.04)
Edison Mission Group
Mission Energy Holding Company
0.26 0.15 0.11
Edison Capital
0.06 0.22 (0.16)
Edison Mission Group Total
0.32 0.37 (0.05)
EIX (parent) and other
(0.06) (0.06) —
EIX Consolidated Core Earnings
1.10 1.19 (0.09)
SCE – Generator refund incentive
— 0.01 (0.01)
SCE – Resolution of an outstanding state tax item
0.25 — 0.25
MEHC – Extinguishment of debt
(0.27) (0.05) (0.22)
MEHC – Earnings from discontinued operations
0.24 0.08 0.16
Total non-core items
0.22 0.04 0.18
Total | | EIX Consolidated Earnings |
19
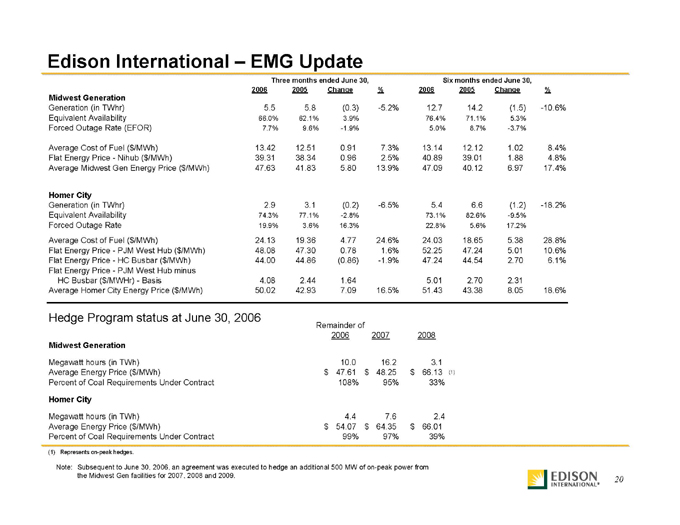
Edison International – EMG Update
Three months ended June 30, Six months ended June 30,
2006 2005 Change % 2006 2005 Change %
Midwest Generation
Generation (in TWhr) 5.5 5.8 (0.3) -5.2% 12.7 14.2 (1.5) -10.6%
Equivalent Availability 66.0% 62.1% 3.9% 76.4% 71.1% 5.3%
Forced Outage Rate (EFOR) 7.7% 9.6% -1.9% 5.0% 8.7% -3.7%
Average Cost of Fuel ($/MWh) 13.42 12.51 0.91 7.3% 13.14 12.12 1.02 8.4%
Flat Energy Price - Nihub ($/MWh) 39.31 38.34 0.96 2.5% 40.89 39.01 1.88 4.8%
Average Midwest Gen Energy Price ($/MWh) 47.63 41.83 5.80 13.9% 47.09 40.12 6.97 17.4%
Homer City
Generation (in TWhr) 2.9 3.1 (0.2) -6.5% 5.4 6.6 (1.2) -18.2%
Equivalent Availability 74.3% 77.1% -2.8% 73.1% 82.6% -9.5%
Forced Outage Rate 19.9% 3.6% 16.3% 22.8% 5.6% 17.2%
Average Cost of Fuel ($/MWh) 24.13 19.36 4.77 24.6% 24.03 18.65 5.38 28.8%
Flat Energy Price - PJM West Hub ($/MWh) 48.08 47.30 0.78 1.6% 52.25 47.24 5.01 10.6%
Flat Energy Price - HC Busbar ($/MWh) 44.00 44.86 (0.86) -1.9% 47.24 44.54 2.70 6.1%
Flat Energy Price - PJM West Hub minus
HC Busbar ($/MWHr) - Basis 4.08 2.44 1.64 5.01 2.70 2.31
Average Homer City Energy Price ($/MWh) 50.02 42.93 7.09 16.5% 51.43 43.38 8.05 18.6%
Hedge Program status at June 30, 2006
Remainder of
2006 2007 2008
Midwest Generation
Megawatt hours (in TWh) 10.0 16.2 3.1
Average Energy Price ($/MWh) $ 47.61 $ 48.25 $ 66.13 (1)
Percent of Coal Requirements Under Contract 108% 95% 33%
Homer City
Megawatt hours (in TWh) 4.4 7.6 2.4
Average Energy Price ($/MWh) $ 54.07 $ 64.35 $ 66.01
Percent of Coal Requirements Under Contract 99% 97% 39%
(1) | | Represents on-peak hedges. |
Note: Subsequent to June 30, 2006, an agreement was executed to hedge an additional 500 MW of on-peak power from
the Midwest Gen facilities for 2007, 2008 and 2009. 20
20
Performance
Balance Sheet Strength
Growth
Dividends
Shareholder Returns
Guidance as of June 29th, 2006
21
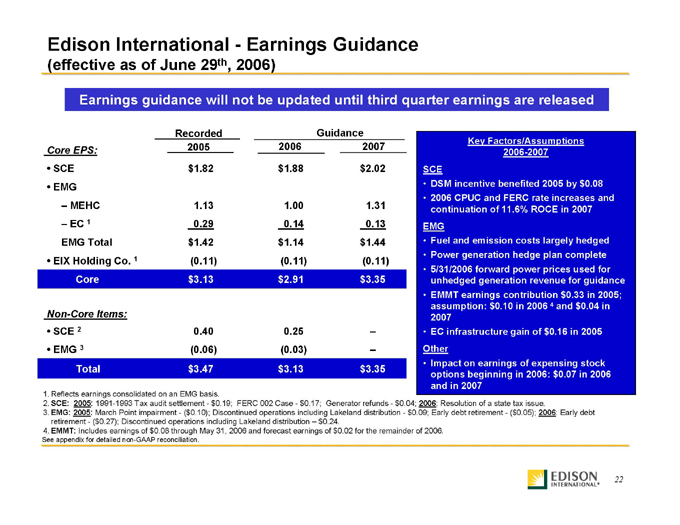
Edison International - - Earnings Guidance
(effective as of June 29th, 2006)
Earnings guidance will not be updated until third quarter earnings are released
Recorded | | Guidance Core EPS: 2005 2006 2007 |
– | | EC 1 0.29 0.14 0.13 EMG Total $1.42 $1.14 $1.44 |
• | | EIX Holding Co. 1 (0.11) (0.11) (0.11) Core $3.13 $2.91 $3.35 |
Non-Core Items:
• | | EMG 3 (0.06) (0.03) –Total $3.47 $3.13 $3.35 |
Key Factors/Assumptions 2006-2007 SCE
• | | DSM incentive benefited 2005 by $0.08 |
• | | 2006 CPUC and FERC rate increases and continuation of 11.6% ROCE in 2007 EMG |
• | | Fuel and emission costs largely hedged |
• | | Power generation hedge plan complete |
• | | 5/31/2006 forward power prices used for unhedged generation revenue for guidance |
• | | EMMT earnings contribution $0.33 in 2005; assumption: $0.10 in 2006 4 and $0.04 in 2007 |
• EC infrastructure gain of $0.16 in 2005 Other
• | | Impact on earnings of expensing stock options beginning in 2006: $0.07 in 2006 and in 2007 |
1. Reflects earnings consolidated on an EMG basis
2. | | SCE: 2005: 1991-1993 Tax audit settlement - $0.19; FERC 002 Case - $0.17; Generator refunds - $0.04; 2006: Resolution of a state tax issue. |
3. | | EMG: 2005: March Point impairment - ($0.10); Discontinued operations including Lakeland distribution - $0.09; Early debt retirement - ($0.05); 2006: Early debt retirement - ($0.27); Discontinued operations including Lakeland distribution – $0.24. |
4. | | EMMT: Includes earnings of $0.08 through May 31, 2006 and forecast earnings of $0.02 for the remainder of 2006. |
See appendix for detailed non-GAAP reconciliation.
22
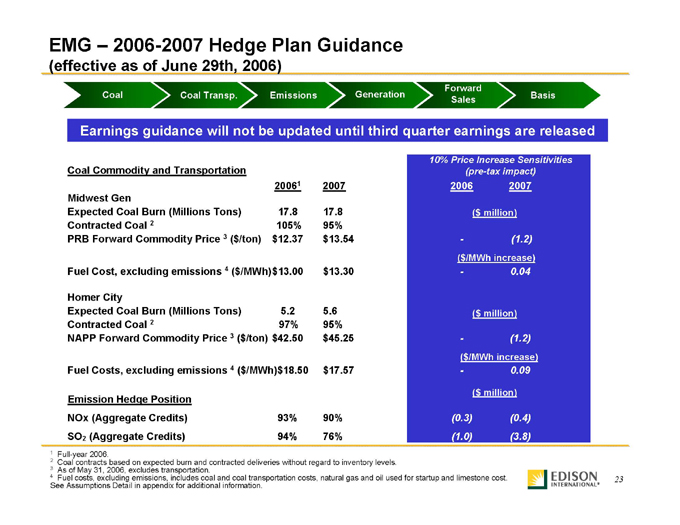
EMG – 2006-2007 Hedge Plan Guidance
(effective as of June 29th, 2006)
Earnings guidance will not be updated until third quarter earnings are released
Coal Commodity and Transportation
20061 2007 Midwest Gen Expected Coal Burn (Millions Tons) 17.8 17.8 Contracted Coal 2 105% 95% PRB Forward Commodity Price 3 ($/ton) $12.37 $13.54
Fuel | | Cost, excluding emissions 4 ($/MWh)$13.00 $13.30 |
Homer City
Expected Coal Burn (Millions Tons) 5.2 5.6 Contracted Coal 2 97% 95% NAPP Forward Commodity Price 3 ($/ton) $42.50 $45.25
Fuel Costs, excluding emissions 4 ($/MWh)$18.50 $17.57
Emission Hedge Position
NOx | | (Aggregate Credits) 93% 90% SO2 (Aggregate Credits) 94% 76% |
10% Price Increase Sensitivities (pre-tax impact)
($ million)
($ million)
($ million)
2 | | Coal contracts based on expected burn and contracted deliveries without regard to inventory levels. |
3 | | As of May 31, 2006, excludes transportation. |
4 | | Fuel costs, excluding emissions, includes coal and coal transportation costs, natural gas and oil used for startup and limestone cost. |
See Assumptions Detail in appendix for additional information.
23
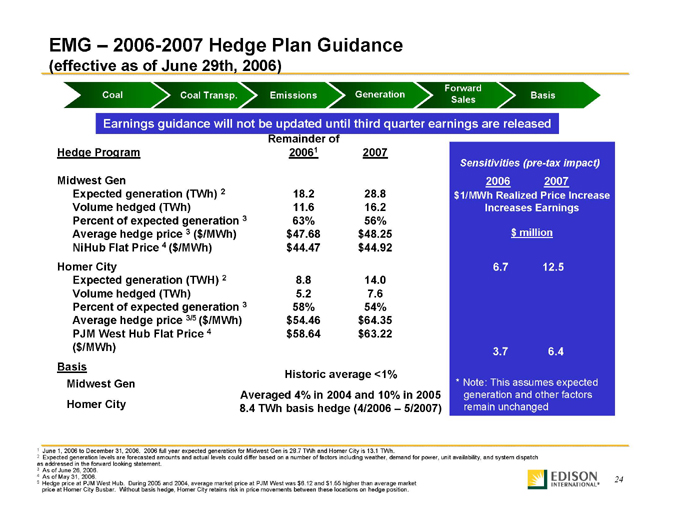
EMG – 2006-2007 Hedge Plan Guidance
(effective as of June 29th, 2006)
Earnings guidance will not be updated until third quarter earnings are released
Remainder of
Midwest Gen
Expected generation (TWh) 2 18.2 28.8 Volume hedged (TWh) 11.6 16.2 Percent of expected generation 3 63% 56% Average hedge price 3 ($/MWh) $47.68 $48.25 NiHub Flat Price 4 ($/MWh) $44.47 $44.92 Homer City Expected generation (TWH) 2 8.8 14.0 Volume hedged (TWh) 5.2 7.6 Percent of expected generation 3 58% 54% Average hedge price 3/5 ($/MWh) $54.46 $64.35 PJM West Hub Flat Price 4 $58.64 $63.22
($/MWh) Basis
Historic average <1% Midwest Gen Averaged 4% in 2004 and 10% in 2005 Homer City 8.4 TWh basis hedge (4/2006 – 5/2007)
Sensitivities (pre-tax impact)
2006 | | 2007 $1/MWh Realized Price Increase Increases Earnings |
$ million
* | | Note: This assumes expected generation and other factors remain unchanged |
1 | | June 1, 2006 to December 31, 2006. 2006 full year expected generation for Midwest Gen is 28.7 TWh and Homer City is 13.1 TWh. |
2 | | Expected generation levels are forecasted amounts and actual levels could differ based on a number of factors including weather, demand for power, unit availability, and system dispatch as addressed in the forward looking statement. |
5 | | Hedge price at PJM West Hub. During 2005 and 2004, average market price at PJM West was $6.12 and $1.55 higher than average market price at Homer City Busbar. Without basis hedge, Homer City retains risk in price movements between these locations on hedge position. |
24
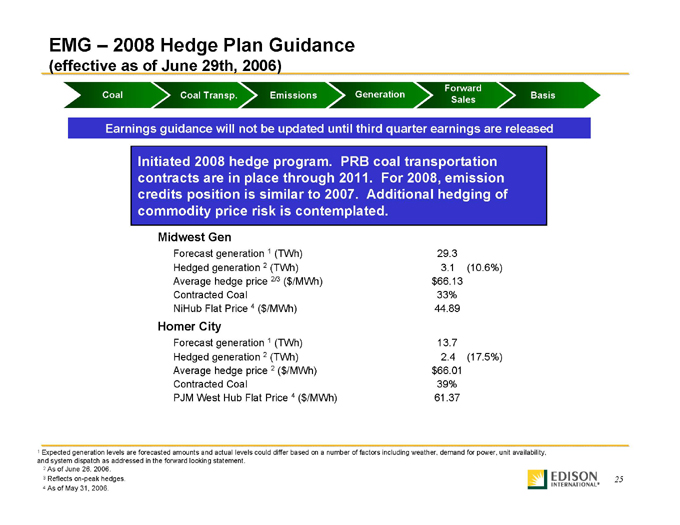
EMG – 2008 Hedge Plan Guidance
(effective as of June 29th, 2006)
Earnings guidance will not be updated until third quarter earnings are released
Initiated 2008 hedge program. PRB coal transportation contracts are in place through 2011. For 2008, emission credits position is similar to 2007. Additional hedging of commodity price risk is contemplated.
Midwest Gen
Forecast | | generation 1 (TWh) 29.3 |
Hedged generation 2 (TWh) 3.1 (10.6%) Average hedge price 2/3 ($/MWh) $66.13 Contracted Coal 33% NiHub Flat Price 4 ($/MWh) 44.89
Homer City
Forecast | | generation 1 (TWh) 13.7 |
Hedged generation 2 (TWh) 2.4 (17.5%) Average hedge price 2 ($/MWh) $66.01 Contracted Coal 39% PJM West Hub Flat Price 4 ($/MWh) 61.37
1 | | Expected generation levels are forecasted amounts and actual levels could differ based on a number of factors including weather, demand for power, unit availability, and system dispatch as addressed in the forward looking statement. |
3 | | Reflects on-peak hedges. |
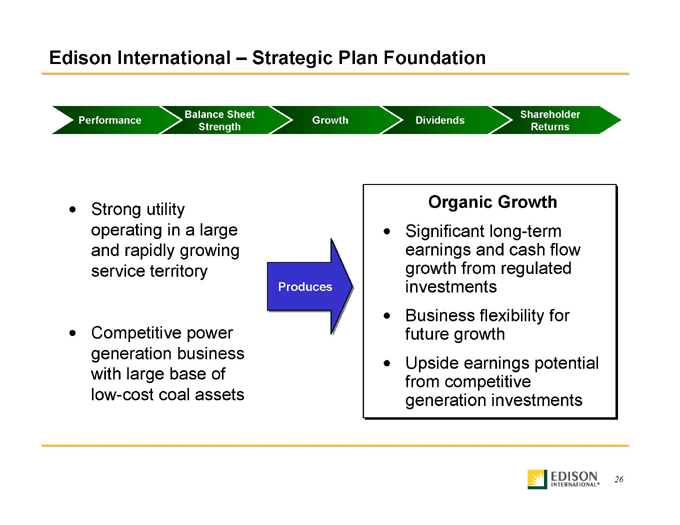
Edison International – Strategic Plan Foundation
Performance
Balance Sheet Strength
Growth
Dividends
Shareholder Returns
| | • | | Strong utility operating in a large and rapidly growing service territory |
Competitive power generation business with large base of low-cost coal assets
Produces
Organic Growth
| | • | | Significant long-term earnings and cash flow growth from regulated investments |
| | • | | Business flexibility for future growth |
| | • | | Upside earnings potential from competitive generation investments |
26

Appendix
27
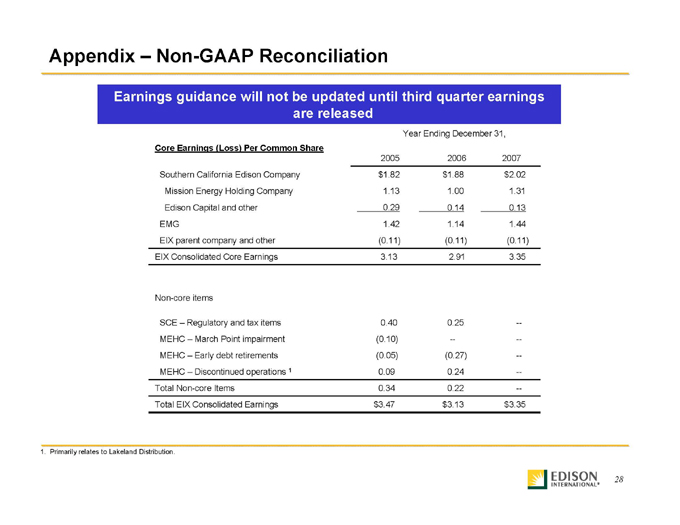
Appendix – Non-GAAP Reconciliation
Earnings guidance will not be updated until third quarter earnings are released
Year Ending December 31,
Core Earnings (Loss) Per Common Share
2005 2006 2007 Southern California Edison Company $1.82 $1.88 $2.02 Mission Energy Holding Company 1.13 1.00 1.31 Edison Capital and other 0.29 0.14 0.13 EMG 1.42 1.14 1.44 EIX parent company and other (0.11) (0.11) (0.11) EIX Consolidated Core Earnings 3.13 2.91 3.35
Non-core items
SCE – Regulatory and tax items 0.40 0.25 —MEHC – March Point impairment (0.10) — —MEHC – Early debt retirements (0.05) (0.27) —MEHC – Discontinued operations 1 0.09 0.24 —Total Non-core Items 0.34 0.22 —Total EIX Consolidated Earnings $3.47 $3.13 $3.35
1. | | Primarily relates to Lakeland Distribution. |
28
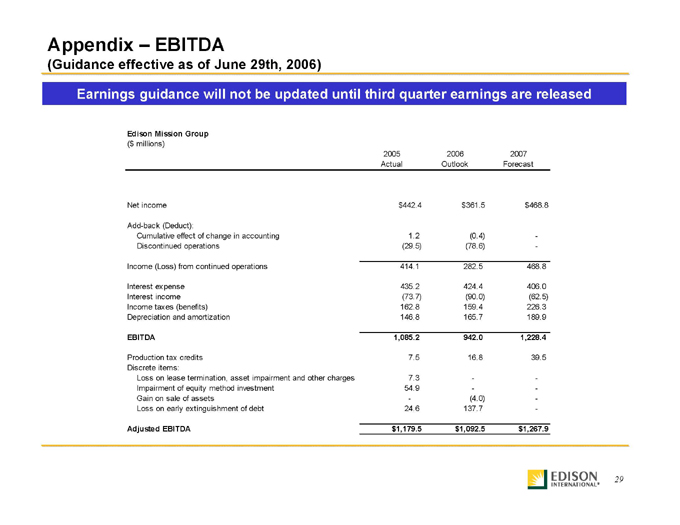
Appendix – EBITDA
(Guidance effective as of June 29th, 2006)
Earnings guidance will not be updated until third quarter earnings are released
Edison Mission Group
($ millions)
2005 | | 2006 2007 Actual Outlook Forecast |
Net | | income $442.4 $361.5 $468.8 |
Add-back (Deduct):
Cumulative | | effect of change in accounting 1.2 (0.4) -Discontinued operations (29.5) (78.6) - |
Income | | (Loss) from continued operations 414.1 282.5 468.8 |
Interest expense 435.2 424.4 406.0 Interest income (73.7) (90.0) (62.5) Income taxes (benefits) 162.8 159.4 226.3 Depreciation and amortization 146.8 165.7 189.9
EBITDA | | 1,085.2 942.0 1,228.4 |
Production tax credits 7.5 16.8 39.5 Discrete items: Loss on lease termination, asset impairment and other charges 7.3—-Impairment of equity method investment 54.9—-Gain on sale of assets—(4.0) -Loss on early extinguishment of debt 24.6 137.7 -
Adjusted | | EBITDA $1,179.5 $1,092.5 $1,267.9 |
29
SCE Value Driver – Execution
System Growth
Capital Investment
Execution
Regulatory Framework
Dependable Earnings
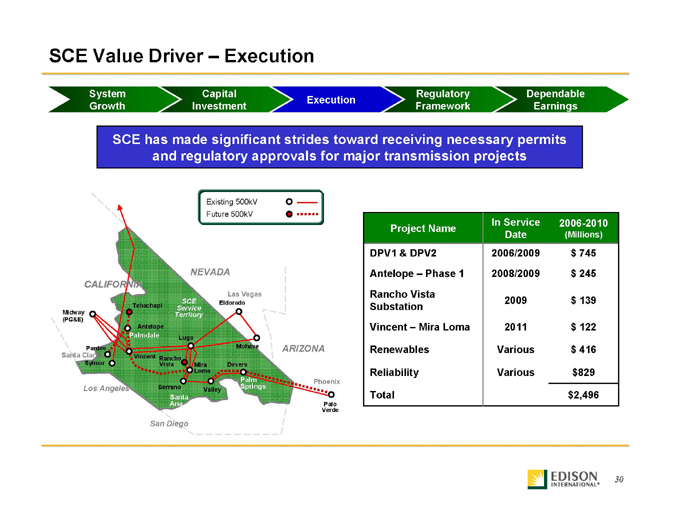
SCE has made significant strides toward receiving necessary permits and regulatory approvals for major transmission projects
Existing 500kV Future 500kV
NEVADA CALIFORNIA
Las Vegas
SCE Eldorado Tehachapi Service
Midway Territory
(PG&E)
Antelope
Rancho
Sylmar | | Vista Mira Devers Loma |
Palm Phoenix
Los Angeles Serrano Springs
Valley
Santa
San Diego
In Service 2006-2010 Project Name Date (Millions)
DPV1 & DPV2 2006/2009 $ 745 Antelope – Phase 1 2008/2009 $ 245 Rancho Vista 2009 $ 139 Substation Vincent – Mira Loma 2011 $ 122
Renewables | | Various $ 416 Reliability Various $829 Total $2,496 |
30
Assumption Details
| | • | | NAPP, “Northern Appalachian”; PRB, “Powder River Basin” |
| | • | | Actual future Fuel Costs, excluding emissions, may differ from estimated future fuel costs, excluding emissions due to a number of factors including SO2 adjustments, Btu adjustments, changes in spot prices/new contracts, inventory build or reduction, changes in costs based on contractually determined escalators and exercise of options under certain agreements. |
| | • | | Fuel Costs, excluding emissions, include coal and coal transportation costs, natural gas and oil used for start-up and, at Homer City, limestone costs and excludes all emissions purchases and/or sales. Reflects average inventory costs. |
| | • | | NAPP Coal is a proxy for the actual coal purchased by Homer City. Two types of coal, ready to burn and raw, are purchased for Units 1 and 2. Ready to burn coal is of a quality that can be burned directly in Units 1 and 2, whereas the raw coal purchased for Units 1 and 2 must be cleaned in the coal cleaning plant. Coal for all three units is generally sourced within 100 miles of the facility. |
| | • | | Coal Contracts (% hedged) are based on expected burn for the calendar year and deliveries during that year. Percentages are calculated without regard to potential changes in coal inventory. |
| | • | | Energy price sensitivities are based on a $1/MWh change in the realized price for each unhedged MWh sold. This sensitivity does not capture possible changes to generation output or correlated changes in the price of fuel or emissions. |
| | • | | Coal price sensitivities are based on the unhedged fuel requirement and a 10% change in coal commodity price of PRB, related to Midwest Generation requirements, and NAPP coal, as a proxy for the coal types burned at Homer City. A 10% change in NAPP coal is assumed to drive a 10% change in Homer City coal types although the absolute price change may be different. |
| | • | | Average hedge price reflects the total value of the on- and off-peak hedges and is not directly comparable to the flat energy price. |
| | • | | The earnings impact of SO2 price changes incorporates a forecast of emissions that may vary depending upon the sulfur content of coal and generation levels. Generation levels may also impact NOx emissions and the related earnings impact. |
31
EMG – Capital Expenditures
Planned Expenditures
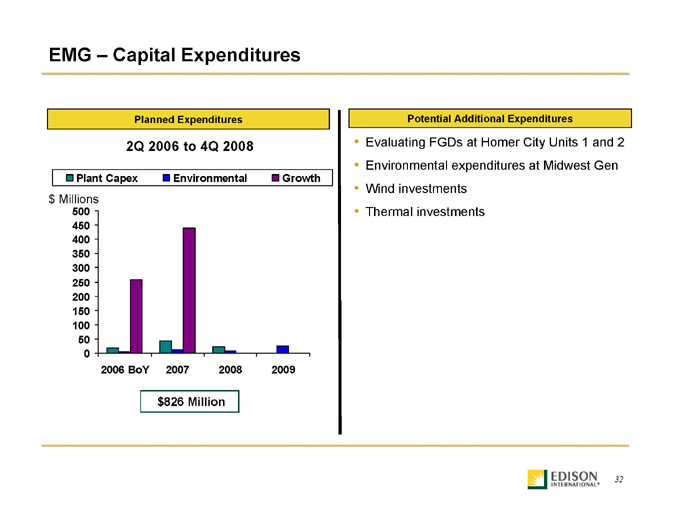
2Q 2006 to 4Q 2008
Plant | | Capex Environmental Growth |
$ Millions
500 450 400 350 300 250 200 150 100 50 0
$826 Million
Potential Additional Expenditures
Evaluating FGDs at Homer City Units 1 and 2 Environmental expenditures at Midwest Gen Wind investments Thermal investments
32
EMG – Capital Expenditures
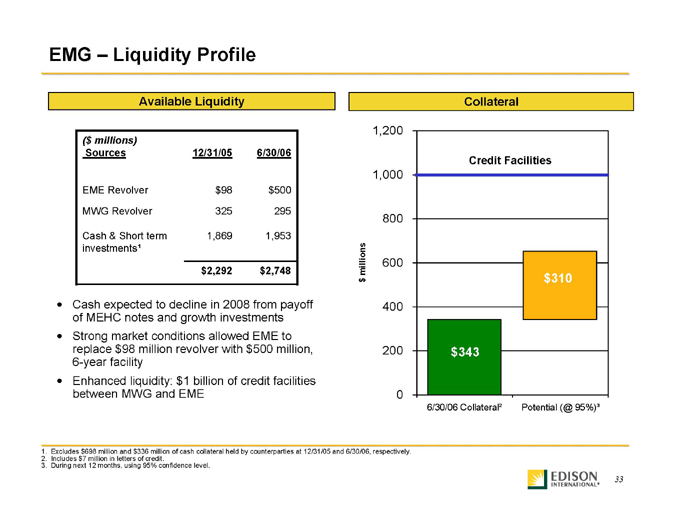
Available Liquidity
($ millions)
Cash | | & Short term 1,869 1,953 investments¹ |
| | • | | Cash expected to decline in 2008 from payoff of MEHC notes and growth investments |
| | • | | Strong market conditions allowed EME to replace $98 million revolver with $500 million, 6-year facility |
| | • | | Enhanced liquidity: $1 billion of credit facilities between MWG and EME |
Collateral
1,200
Credit Facilities
1,000
800
400
0
6/30/06 | | Collateral² Potential (@ 95%)³ |
1. | | Excludes $698 million and $336 million of cash collateral held by counterparties at 12/31/05 and 6/30/06, respectively. |
2. | | Includes $7 million in letters of credit. |
3. | | During next 12 months, using 95% confidence level. |
33