Exhibit 99.1
EDISON INTERNATIONAL®
Business Update
Al Fohrer Chief Executive Officer Southern California Edison Company
Merrill Lynch Power & Gas Conference
September 2006
EDISON INTERNATIONAL®
Forward-Looking Statement
This presentation contains “forward-looking statements” within the meaning of the Private Securities Litigation Reform Act of 1995. Forward-looking statements reflect Edison International’s current expectations and projections about future events based on Edison International’s knowledge of present facts and circumstances and assumptions about future events and include any statement that does not directly relate to a historical or current fact. In this presentation and elsewhere, the words “expects,” “believes,” “anticipates,” “estimates,” “projects,” “intends,” “plans,” “probable,” “may,” “will,” “could,” “would,” “should,” and variations of such words and similar expressions, or discussions of strategy or of plans, are intended to identify forward-looking statements. Such statements necessarily involve risks and uncertainties that could cause actual results to differ materially from those anticipated. Some of the risks, uncertainties and other important factors that could cause results to differ, or that otherwise could impact Edison International or its subsidiaries, include but are not limited to:
• the ability of Edison International to meet its financial obligations and to pay dividends on its common stock if its subsidiaries are unable to pay dividends;
• the ability of Southern California Edison (SCE) to recover its costs in a timely manner from its customers through regulated rates;
• decisions and other actions by the California Public Utilities Commission (CPUC) and other regulatory authorities and delays in regulatory actions;
• market risks affecting SCE’s energy procurement activities;
• access to capital markets and the cost of capital;
• changes in interest rates, rates of inflation and foreign exchange rates;
• governmental, statutory, regulatory or administrative changes or initiatives affecting the electricity industry, including the market structure rules applicable to each market and environmental regulations that could require additional expenditures or otherwise affect the cost and manner of doing business;
• risks associated with operating nuclear and other power generating facilities, including operating risks, nuclear fuel storage, equipment failure, availability, heat rate and output;
• the availability of labor, equipment and materials;
• the ability to obtain sufficient insurance, including insurance relating to SCE’s nuclear facilities;
• effects of legal proceedings, changes in or interpretations of tax laws, rates or policies, and changes in accounting standards;
• supply and demand for electric capacity and energy, and the resulting prices and dispatch volumes, in the wholesale markets to which MEHC generating units have access;
• the cost and availability of coal, natural gas, and fuel oil, nuclear fuel, and associated transportation;
• the cost and availability of emission credits or allowances for emission credits;
• transmission congestion in and to each market area and the resulting differences in prices between delivery points;
• the ability to provide sufficient collateral in support of hedging activities and purchased power and fuel;
• the extent of additional supplies of capacity, energy and ancillary services from current competitors or new market entrants, including the development of new generation facilities and technologies;
• the difficulty of predicting wholesale prices, transmission congestion, energy demand, and other activities in the complex and volatile markets in which MEHC and its subsidiaries participate;
• general political, economic and business conditions;
• weather conditions, natural disasters and other unforeseen events; and
• changes in the fair value of investments and other assets accounted for using fair value accounting.
Additional information about risks and uncertainties, including more detail about the factors described above, is contained in Edison International’s reports filed with the Securities and Exchange Commission. Readers are urged to read such reports and carefully consider the risks, uncertainties and other factors that affect Edison International’s business. Readers also should review future reports filed by Edison International with the Securities and Exchange Commission. The information contained in this presentation is subject to change without notice. Forward-looking statements speak only as of the date they are made and Edison International is not obligated to publicly update or revise forward-looking statements.
EDISON INTERNATIONAL®
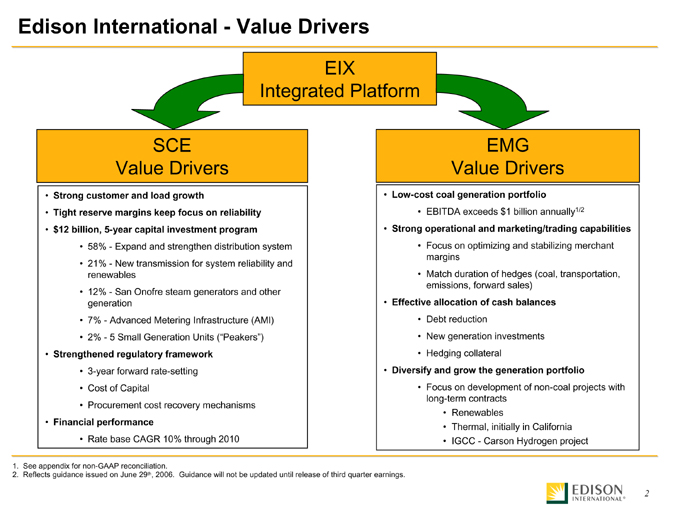
Edison International - - Value Drivers
EIX Integrated Platform
SCE Value Drivers EMG Value Drivers
• Strong customer and load growth
• Low-cost coal generation portfolio
• Tight reserve margins keep focus on reliability
• EBITDA exceeds $1 billion annually1/2
• $ 12 billion, 5-year capital investment program
• Strong operational and marketing/trading capabilities
• 58% - Expand and strengthen distribution system
• Focus on optimizing and stabilizing merchant margins
• 21% - New transmission for system reliability and renewables
• Match duration of hedges (coal, transportation, emissions, forward sales)
• 12% - San Onofre steam generators and other generation
• Effective allocation of cash balances
• 7% - Advanced Metering Infrastructure (AMI)
• Debt reduction
• 2% - 5 Small Generation Units (“Peakers”)
• New generation investments
• Strengthened regulatory framework
• Hedging collateral
• 3-year forward rate-setting
• Diversify and grow the generation portfolio
• Cost of Capital
• Focus on development of non-coal projects with long-term contracts
• Procurement cost recovery mechanisms
• Renewables
• Financial performance
• Thermal, initially in California
• Rate base CAGR 10% through 2010
• IGCC - Carson Hydrogen project
1. See appendix for non-GAAP reconciliation.
2. Reflects guidance issued on June 29th, 2006. Guidance will not be updated until release of third quarter earnings.
EDISON INTERNATIONAL®
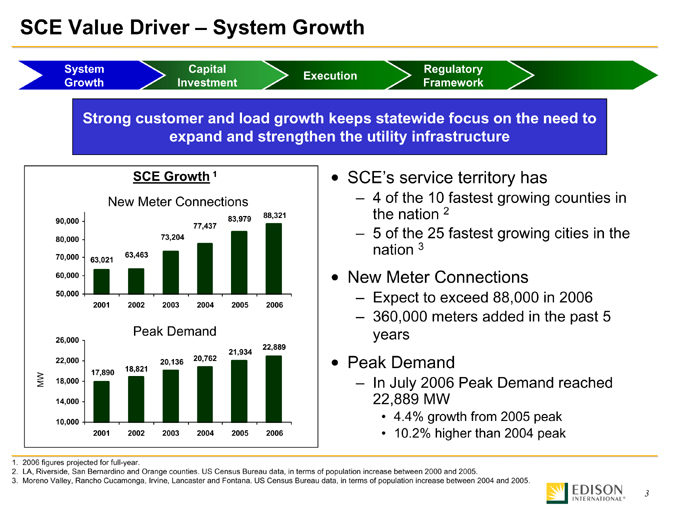
SCE Value Driver – System Growth
System Growth
Capital Investment
Execution
Regulatory Framework
Strong customer and load growth keeps statewide focus on the need to expand and strengthen the utility infrastructure
SCE Growth 1
90,000 80,000 70,000 60,000 50,000 63,021 63,463 73,204 77,437 83,979 88,321
2001 2002 2003 2004 2005 2006
Peak Demand
MW
26,000 22,000 18,000 14,000 10,000 17,890 18,821 20,136 20,762 21,934 22,889
2001 2002 2003 2004 2005 2006
SCE’s service territory has
– 4 of the 10 fastest growing counties in the nation 2
– 5 of the 25 fastest growing cities in the nation 3
New Meter Connections
– Expect to exceed 88,000 in 2006
– 360,000 meters added in the past 5 years
Peak Demand
– In July 2006 Peak Demand reached 22,889 MW
• 4.4% growth from 2005 peak
• 10.2% higher than 2004 peak
1. 2006 figures projected for full-year.
2. LA, Riverside, San Bernardino and Orange counties. US Census Bureau data, in terms of population increase between 2000 and 2005.
3. Moreno Valley, Rancho Cucamonga, Irvine, Lancaster and Fontana. US Census Bureau data, in terms of population increase between 2004 and 2005.
EDISON INTERNATIONAL®
SCE Value Driver – System Growth
System Growth
Capital Investment
Execution
Regulatory Framework
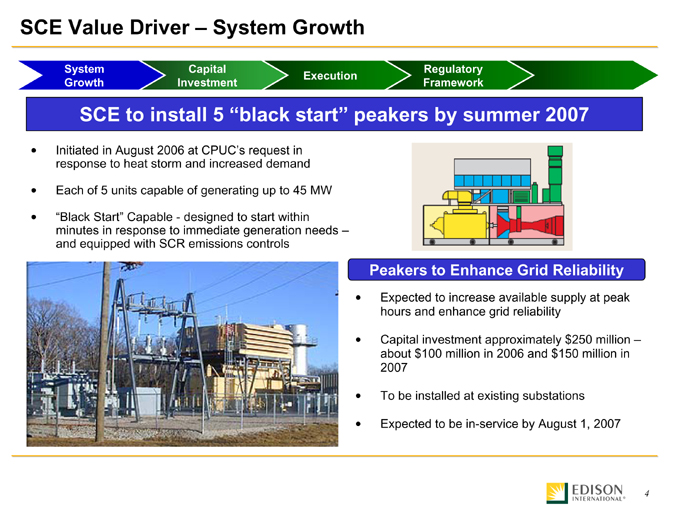
SCE to install 5 “black start” peakers by summer 2007
• Initiated in August 2006 at CPUC’s request in response to heat storm and increased demand
• Each of 5 units capable of generating up to 45 MW
• “Black Start” Capable - designed to start within minutes in response to immediate generation needs – and equipped with SCR emissions controls
Peakers to Enhance Grid Reliability
• Expected to increase available supply at peak hours and enhance grid reliability
• Capital investment approximately $250 million – about $100 million in 2006 and $150 million in 2007
• To be installed at existing substations
• Expected to be in-service by August 1, 2007
EDISON INTERNATIONAL®
4
SCE Value Driver – System Growth
System Growth
Capital Investment
Execution
Regulatory Framework
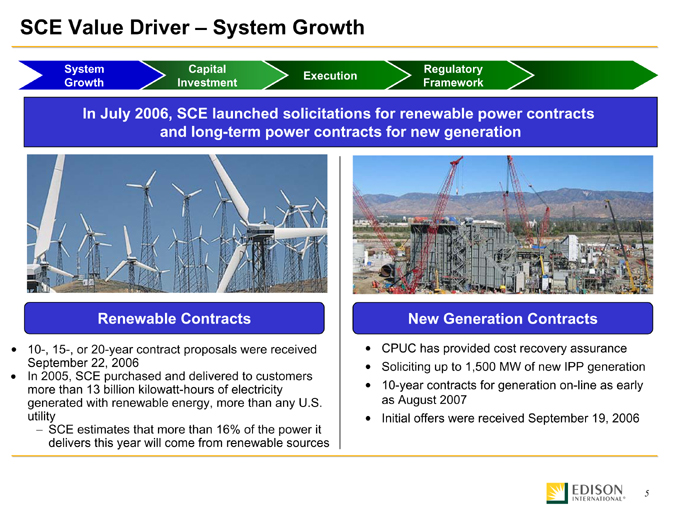
In July 2006, SCE launched solicitations for renewable power contracts and long-term power contracts for new generation
Renewable Contracts
• 10-, 15-, or 20-year contract proposals were received September 22, 2006
• In 2005, SCE purchased and delivered to customers more than 13 billion kilowatt-hours of electricity generated with renewable energy, more than any U.S. utility
– SCE estimates that more than 16% of the power it delivers this year will come from renewable sources
New Generation Contracts
• CPUC has provided cost recovery assurance
• Soliciting up to 1,500 MW of new IPP generation
• 10-year contracts for generation on-line as early as August 2007
• Initial offers were received September 19, 2006
EDISON INTERNATIONAL®
SCE Value Driver – Capital Investment
System Growth
Capital Investment
Execution
Regulatory Framework
SCE cited as industry leader in advanced metering
“SCE has taken an industry leadership position as the first U.S. utility to adopt EPRI’s IntelliGrid Architecture for a system-wide advanced metering deployment.”
Arshad Mansoor, V.P. of Power Delivery & Marketing
Electric Power Research Institute (EPRI) News Release
Palo Alto, CA – August 21, 2006
SCE AMI Phase I selected as “2005-2006 Best AMR Initiative in a North American IOU” by international utility peers.
Utility Planning Network and Automatic Meter Reader Association (UPN-AMRA), August 9, 2006
EDISON INTERNATIONAL®
SCE Value Driver – Capital Investment
System Growth
Capital Investment
Execution
Regulatory Framework
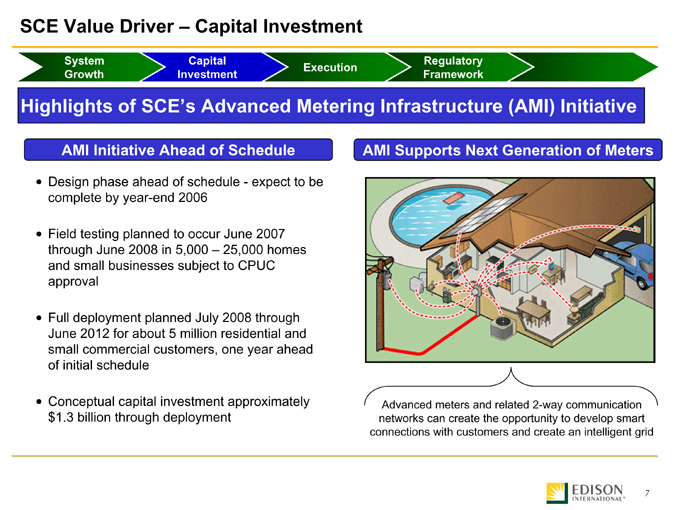
Highlights of SCE’s Advanced Metering Infrastructure (AMI) Initiative
AMI Initiative Ahead of Schedule
AMI Supports Next Generation of Meters
• Design phase ahead of schedule - expect to be complete by year-end 2006
• Field testing planned to occur June 2007 through June 2008 in 5,000 – 25,000 homes and small businesses subject to CPUC approval
• Full deployment planned July 2008 through June 2012 for about 5 million residential and small commercial customers, one year ahead of initial schedule
• Conceptual capital investment approximately $1.3 billion through deployment
Advanced meters and related 2-way communication networks can create the opportunity to develop smart connections with customers and create an intelligent grid
EDISON INTERNATIONAL®
SCE Value Driver – Capital Investment
System Growth
Capital Investment
Execution
Regulatory Framework
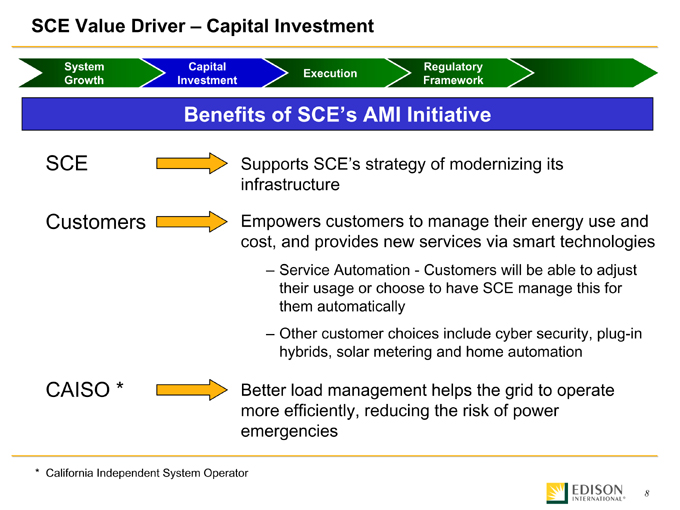
Benefits of SCE’s AMI Initiative
SCE
Supports SCE’s strategy of modernizing its infrastructure
Customers
Empowers customers to manage their energy use and cost, and provides new services via smart technologies
– Service Automation - Customers will be able to adjust their usage or choose to have SCE manage this for them automatically
– Other customer choices include cyber security, plug-in hybrids, solar metering and home automation
CAISO *
Better load management helps the grid to operate more efficiently, reducing the risk of power emergencies
* California Independent System Operator
EDISON INTERNATIONAL®
SCE Value Driver – Capital Investment
System Growth
Capital Investment
Execution
Regulatory Framework
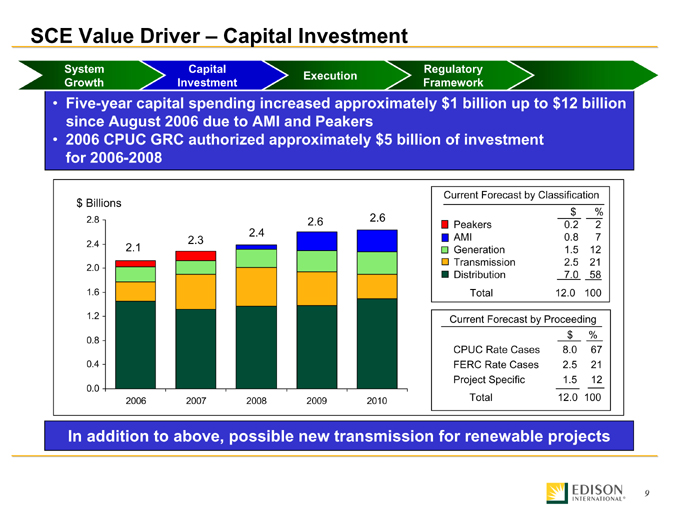
• Five-year capital spending increased approximately $1 billion up to $12 billion since August 2006 due to AMI and Peakers
• 2006 CPUC GRC authorized approximately $5 billion of investment for 2006-2008
$ Billions
2.8 2.4 2.0 1.6 1.2 0.8 0.4 0.0 2.1 2.3 2.4 2.6 2.6
2006 2007 2008 2009 2010
Current Forecast by Classification
$ %
Peakers 0.2 2
AMI 0.8 7
Generation 1.5 12
Transmission 2.5 21
Distribution 7.0 58
Total 12.0 100
Current Forecast by Proceeding $ %
CPUC Rate Cases 8.0 67
FERC Rate Cases 2.5 21
Project Specific 1.5 12
Total 12.0 100
In addition to above, possible new transmission for renewable projects
EDISON INTERNATIONAL®
9
SCE Value Driver - Capital Investment
System Growth
Capital Investment
Execution
Regulatory Framework
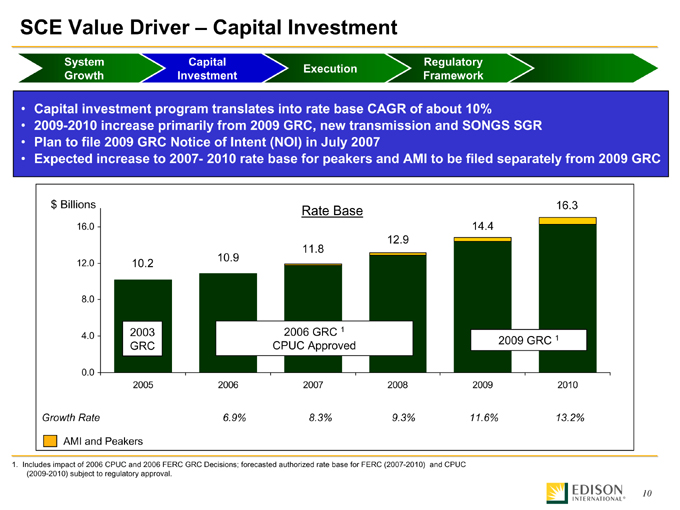
• Capital investment program translates into rate base CAGR of about 10%
• 2009-2010 increase primarily from 2009 GRC, new transmission and SONGS SGR
• Plan to file 2009 GRC Notice of Intent (NOI) in July 2007
• Expected increase to 2007- 2010 rate base for peakers and AMI to be filed separately from 2009 GRC
Rate Base
$ Billions
16.0 12.0 8.0 4.0 0.0 10.2 10.9 11.8 12.9 14.4 16.3
2003 GRC
2006 GRC 1
CPUC Approved
2009 GRC 1
2005 2006 2007 2008 2009 2010
Growth Rate
6.9% 8.3% 9.3% 11.6% 13.2%
AMI and Peakers
1. Includes impact of 2006 CPUC and 2006 FERC GRC Decisions; forecasted authorized rate base for FERC (2007-2010) and CPUC (2009-2010) subject to regulatory approval.
EDISON INTERNATIONAL®
10
SCE Value Driver—Execution
System Growth
Capital Investment
Execution
Regulatory Framework
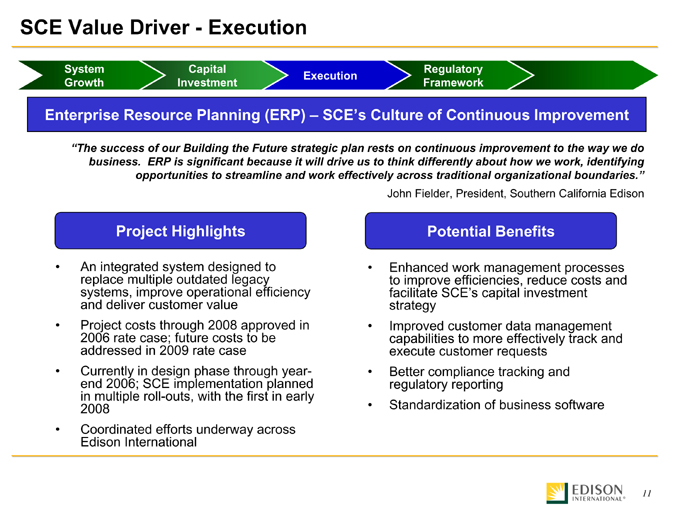
Enterprise Resource Planning (ERP) – SCE’s Culture of Continuous Improvement
“The success of our Building the Future strategic plan rests on continuous improvement to the way we do business. ERP is significant because it will drive us to think differently about how we work, identifying opportunities to streamline and work effectively across traditional organizational boundaries.”
John Fielder, President, Southern California Edison
Project Highlights
• An integrated system designed to replace multiple outdated legacy systems, improve operational efficiency and deliver customer value
• Project costs through 2008 approved in 2006 rate case; future costs to be addressed in 2009 rate case
• Currently in design phase through year-end 2006; SCE implementation planned in multiple roll-outs, with the first in early 2008
• Coordinated efforts underway across Edison International
Potential Benefits
• Enhanced work management processes to improve efficiencies, reduce costs and facilitate SCE’s capital investment strategy
• Improved customer data management capabilities to more effectively track and execute customer requests
• Better compliance tracking and regulatory reporting
• Standardization of business software
EDISON INTERNATIONAL®
11
SCE Value Driver – Regulatory Framework
System Growth
Capital Investment
Execution
Regulatory Framework
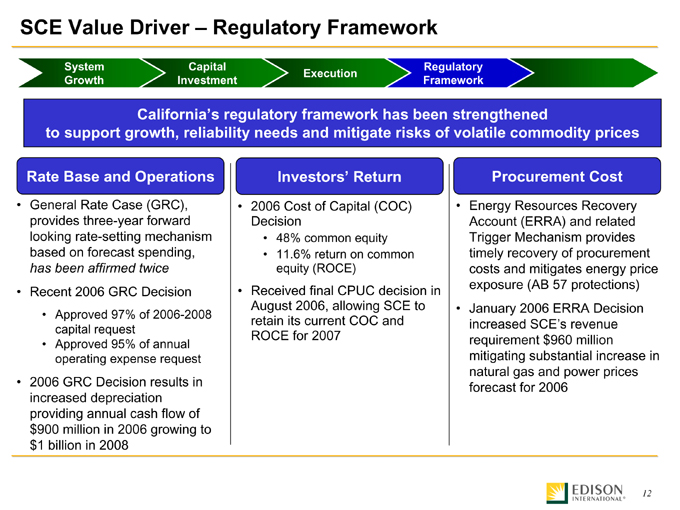
California’s regulatory framework has been strengthened to support growth, reliability needs and mitigate risks of volatile commodity prices
Rate Base and Operations
• General Rate Case (GRC), provides three-year forward looking rate-setting mechanism based on forecast spending, has been affirmed twice
• Recent 2006 GRC Decision
• Approved 97% of 2006-2008 capital request
• Approved 95% of annual operating expense request
• 2006 GRC Decision results in increased depreciation providing annual cash flow of $900 million in 2006 growing to $1 billion in 2008
Investors’ Return
• 2006 Cost of Capital (COC) Decision
• 48% common equity
• 11.6% return on common equity (ROCE)
• Received final CPUC decision in August 2006, allowing SCE to retain its current COC and ROCE for 2007
Procurement Cost
• Energy Resources Recovery Account (ERRA) and related Trigger Mechanism provides timely recovery of procurement costs and mitigates energy price exposure (AB 57 protections)
• January 2006 ERRA Decision increased SCE’s revenue requirement $960 million mitigating substantial increase in natural gas and power prices forecast for 2006
EDISON INTERNATIONAL®
12
Appendix
EDISON INTERNATIONAL®
13
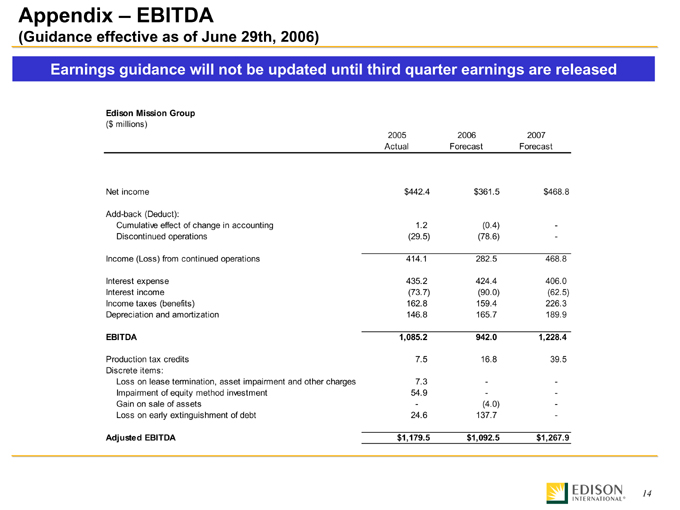
Appendix – EBITDA
(Guidance effective as of June 29th, 2006)
Earnings guidance will not be updated until third quarter earnings are released
Edison Mission Group
($ millions)
2005 Actual
2006 Forecast
2007 Forecast
Net income
Add-back (Deduct):
Cumulative effect of change in accounting
Discontinued operations
Income (Loss) from continued operations
Interest expense
Interest income
Income taxes (benefits)
Depreciation and amortization
EBITDA
Production tax credits
Discrete items: Loss on lease termination, asset impairment and other charges
Impairment of equity method investment
Gain on sale of assets
Loss on early extinguishment of debt
Adjusted EBITDA
$442.4 1.2 (29.5) 414.1 435.2 (73.7) 162.8 146.8 1,085.2 7.5 7.3 54.9 - 24.6
$1,179.5 $361.5 (0.4) (78.6) 282.5 424.4 (90.0) 159.4 165.7 942.0 16.8 - - (4.0) 137.7 $1,092.5
$468.8 - - 468.8 406.0 (62.5) 226.3 189.9 1,228.4 39.5 - - - - - $1,267.9
EDISON INTERNATIONAL®
14
SCE Value Driver – Execution
System Growth
Capital Investment
Execution
Regulatory Framework
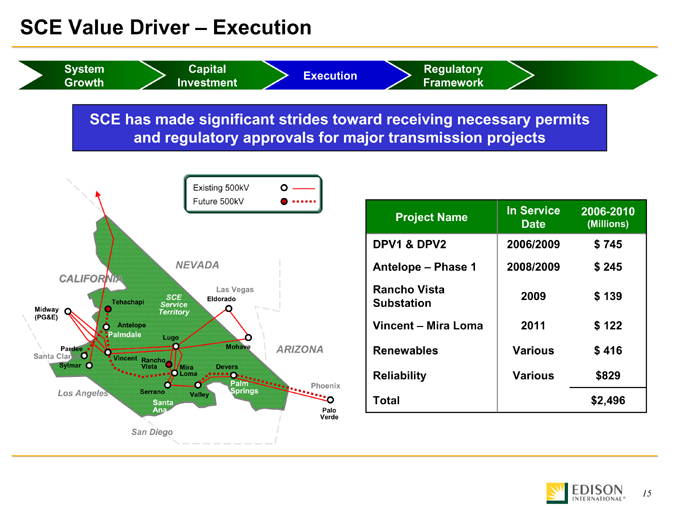
SCE has made significant strides toward receiving necessary permits and regulatory approvals for major transmission projects
Existing 500kV
Future 500kV
CALIFORNIA
NEVADA
Midway (PG&E)
Tehachapi
SCE Service Territory
Las Vegas
Eldorado
Antelope
Palmdale
Luga
Mohave
ARIZONA
Pardee
Santa Clarita
Sylamar
Vincent
Rancho Vista
Mira Loma
Devers
Los Angeles
Serrano
Santa Ane
Valley
Palm Springe
Phoenix
Palo Verde
San Diego
Project Name
DPV1 & DPV2 Antelope – Phase 1 Rancho Vista Substation Vincent – Mira Loma Renewables Reliability Total
In Service Date 2006/2009 2008/2009 2009 2011 Various Various
2006-2010 (Millions) $ 745 $ 245 $ 139 $ 122 $ 416 $829 $2,496
EDISON INTERNATIONAL®
15