
Exhibit 99.1
EDISON INTERNATIONAL®
Business Update
Handout
May 2007
EDISON
INTERNATIONAL®
Forward-Looking Statement This presentation contains “forward-looking statements” within the meaning of the Private Securities Litigation Reform Act of 1995. Forward-looking statements reflect Edison International’s current expectations and projections about future events based on Edison International’s knowledge of present facts and circumstances and assumptions about future events and include any statement that does not directly relate to a historical or current fact. In this presentation and elsewhere, the words “expects,” “believes,” “anticipates,” “estimates,” “projects,” “intends,” “plans,” “probable,” “may,” “will,” “could,” “would,” “should,” and variations of such words and similar expressions, or discussions of strategy or of plans, are intended to identify forward-looking statements. Such statements necessarily involve risks and uncertainties that could cause actual results to differ materially from those anticipated. Some of the risks, uncertainties and other important factors that could cause results to differ, or that otherwise could impact Edison International or its subsidiaries, include but are not limited to: • the ability of Edison International to meet its financial obligations and to pay dividends on its common stock if its subsidiaries are unable to pay dividends; • the ability of Southern California Edison Company (SCE) to recover its costs in a timely manner from its customers through regulated rates; • decisions and other actions by the California Public Utilities Commission (CPUC), the Federal Energy Regulatory Commission (FERC) and other regulatory authorities and delays in regulatory actions; • market risks affecting SCE’s energy procurement activities; • access to capital markets and the cost of capital; • changes in interest rates, rates of inflation and foreign exchange rates; • governmental, statutory, regulatory or administrative changes or initiatives affecting the electricity industry, including the market structure rules applicable to each market; • environmental regulations that could require additional expenditures or otherwise affect the cost and manner of doing business; • risks associated with operating nuclear and other power generating facilities, including operating risks, nuclear fuel storage, equipment failure, availability, heat rate, output, and availability and cost of spare parts and repairs; • the availability of labor, equipment and materials; • the ability to obtain sufficient insurance, including insurance relating to SCE’s nuclear facilities; • effects of legal proceedings, changes in or interpretations of tax laws, rates or policies, and changes in accounting standards; • the outcome of disputes with the Internal Revenue Service (IRS) and other tax authorities regarding tax positions taken by Edison International; • supply and demand for electric capacity and energy, and the resulting prices and dispatch volumes, in the wholesale markets to which Edison Mission Group Inc.’s (EMG) generating units have access; • the cost and availability of coal, natural gas, fuel oil, nuclear fuel, and associated transportation; • the cost and availability of emission credits or allowances for emission credits; • transmission congestion in and to each market area and the resulting differences in prices between delivery points; • the ability to provide sufficient collateral in support of hedging activities and purchased power and fuel; • the risk of counter-party default in hedging transactions or power-purchase and fuel contracts; • the extent of additional supplies of capacity, energy and ancillary services from current competitors or new market entrants, including the development of new generation facilities and technologies; • the difficulty of predicting wholesale prices, transmission congestion, energy demand and other aspects of the complex and volatile markets in which EMG and its subsidiaries participate; • general political, economic and business conditions; • weather conditions, natural disasters and other unforeseen events; and • changes in the fair value of investments and other assets. Additional information about risks and uncertainties, including more detail about the factors described above, is contained in Edison International’s reports filed with the Securities and Exchange Commission. Readers are urged to read such reports and carefully consider the risks, uncertainties and other factors that affect Edison International’s business. Readers also should review future reports filed by Edison International with the Securities and Exchange Commission. The information contained in this presentation is subject to change without notice. Forward-looking statements speak only as of the date they are made and Edison International is not obligated to publicly update or revise forward-looking statements. EDISON INTERNATIONAL® 1
Edison International – Key Investment Messages
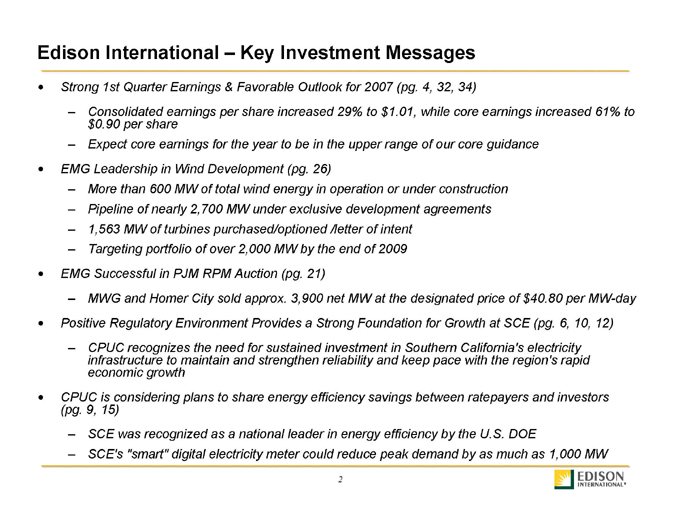
• Strong 1st Quarter Earnings & Favorable Outlook for 2007 (pg. 4, 32, 34)
– Consolidated earnings per share increased 29% to $1.01, while core earnings increased 61% to $0.90 per share
– Expect core earnings for the year to be in the upper range of our core guidance
• EMG Leadership in Wind Development (pg. 26)
– More than 600 MW of total wind energy in operation or under construction
– Pipeline of nearly 2,700 MW under exclusive development agreements
– 1,563 MW of turbines purchased/optioned /letter of intent
– Targeting portfolio of over 2,000 MW by the end of 2009
• EMG Successful in PJM RPM Auction (pg. 21)
– MWG and Homer City sold approx. 3,900 net MW at the designated price of $40.80 per MW-day
• Positive Regulatory Environment Provides a Strong Foundation for Growth at SCE (pg. 6, 10, 12)
– CPUC recognizes the need for sustained investment in Southern California’s electricity infrastructure to maintain and strengthen reliability and keep pace with the region’s rapid economic growth
• CPUC is considering plans to share energy efficiency savings between ratepayers and investors (pg. 9, 15)
– SCE was recognized as a national leader in energy efficiency by the U.S. DOE
– SCE’s “smart” digital electricity meter could reduce peak demand by as much as 1,000 MW
EDISON INTERNATIONAL® 2
Edison International—First Quarter 2007 Financial Highlights
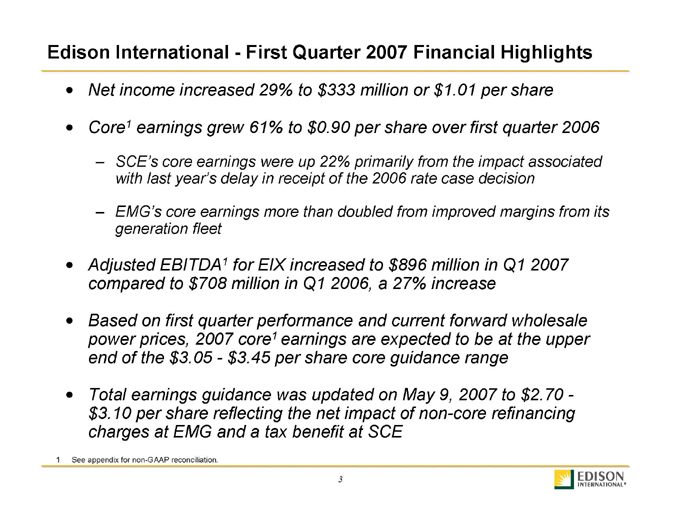
• Net income increased 29% to $333 million or $1.01 per share
• Core1 earnings grew 61% to $0.90 per share over first quarter 2006
– SCE’s core earnings were up 22% primarily from the impact associated with last year’s delay in receipt of the 2006 rate case decision
– EMG’s core earnings more than doubled from improved margins from its generation fleet
• Adjusted EBITDA1 for EIX increased to $896 million in Q1 2007 compared to $708 million in Q1 2006, a 27% increase
• Based on first quarter performance and current forward wholesale power prices, 2007 core1 earnings are expected to be at the upper end of the $3.05—$3.45 per share core guidance range
• Total earnings guidance was updated on May 9, 2007 to $2.70 -$3.10 per share reflecting the net impact of non-core refinancing charges at EMG and a tax benefit at SCE
1 See appendix for non-GAAP reconciliation.
EDISON INTERNATIONAL® 3
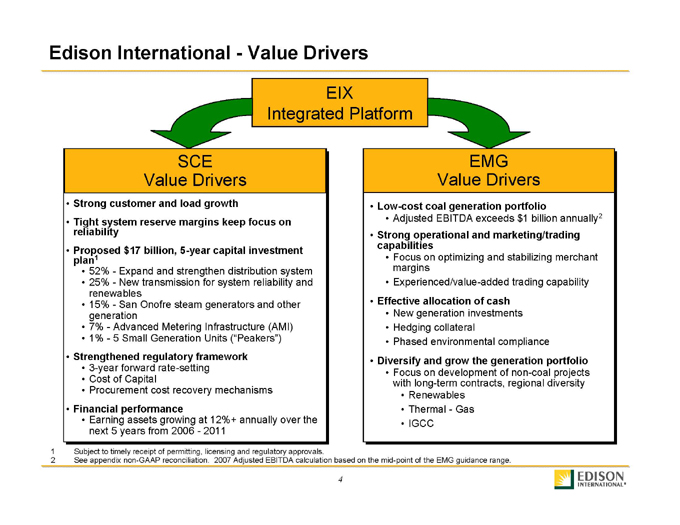
Edison International—Value Drivers EIX Integrated Platform SCE Value Drivers • Strong customer and load growth • Tight system reserve margins keep focus on reliability • Proposed $17 billion, 5-year capital investment plan1 • 52%—Expand and strengthen distribution system • 25%—New transmission for system reliability and renewables • 15%—San Onofre steam generators and other generation • 7%—Advanced Metering Infrastructure (AMI) • 1%—5 Small Generation Units (“Peakers”) • Strengthened regulatory framework • 3-year forward rate-setting • Cost of Capital • Procurement cost recovery mechanisms • Financial performance • Earning assets growing at 12%+ annually over the next 5 years from 2006—2011 EMG Value Drivers • Low-cost coal generation portfolio • Adjusted EBITDA exceeds $1 billion annually2 • Strong operational and marketing/trading capabilities • Focus on optimizing and stabilizing merchant margins • Experienced/value-added trading capability • Effective allocation of cash • New generation investments • Hedging collateral • Phased environmental compliance • Diversify and grow the generation portfolio • Focus on development of non-coal projects with long-term contracts, regional diversity • Renewables • Thermal—Gas • IGCC 1 Subject to timely receipt of permitting, licensing and regulatory approvals. 2 See appendix non-GAAP reconciliation. 2007 Adjusted EBITDA calculation based on the mid-point of the EMG guidance range. EDISON INTERNATIONAL® 4
System Growth
Reliability
Capital Investment
Regulatory Framework
Dependable Earnings
Southern California Edison (SCE)
EDISON
INTERNATIONAL® 5
SCE Value Driver – System Growth
System Growth
Reliability
Capital Investment
Regulatory Framework
Dependable Earnings
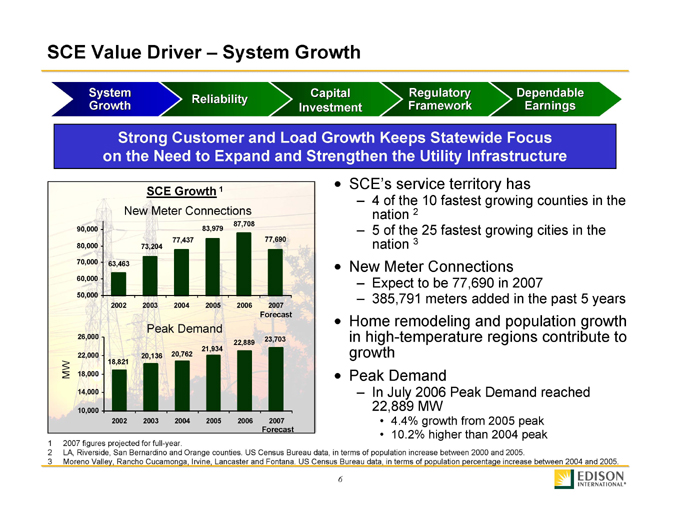
Strong Customer and Load Growth Keeps Statewide Focus on the Need to Expand and Strengthen the Utility Infrastructure
SCE Growth 1
New Meter Connections
87,708 77,690 90,000 83,979 80,000 73,204 77,437 70,000 63,463 60,000 50,000 2002 2003 2004 2005 2006 2007
Forecast Peak Demand MW 26,000 23,703 22,889 21,934 22,000 20,136 20,762
18,821 18,000 14,000 10,000
2002 2003 2004 2005 2006 2007 Forecast • SCE’s service territory has
– 4 of the 10 fastest growing counties in the nation 2
– 5 of the 25 fastest growing cities in the nation 3
• New Meter Connections
– Expect to be 77,690 in 2007
– 385,791 meters added in the past 5 years
• Home remodeling and population growth in high-temperature regions contribute to growth
• Peak Demand
– In July 2006 Peak Demand reached 22,889 MW
• 4.4% growth from 2005 peak
• 10.2% higher than 2004 peak
1 | | 2007 figures projected for full-year. |
2 LA, Riverside, San Bernardino and Orange counties. US Census Bureau data, in terms of population increase between 2000 and 2005. 3 Moreno Valley, Rancho Cucamonga, Irvine, Lancaster and Fontana. US Census Bureau data, in terms of population percentage increase between 2004 and 2005. EDISON INTERNATIONAL® 6
SCE Value Driver – Reliability
System Growth
Reliability
Capital Investment
Regulatory Framework
Dependable Earnings
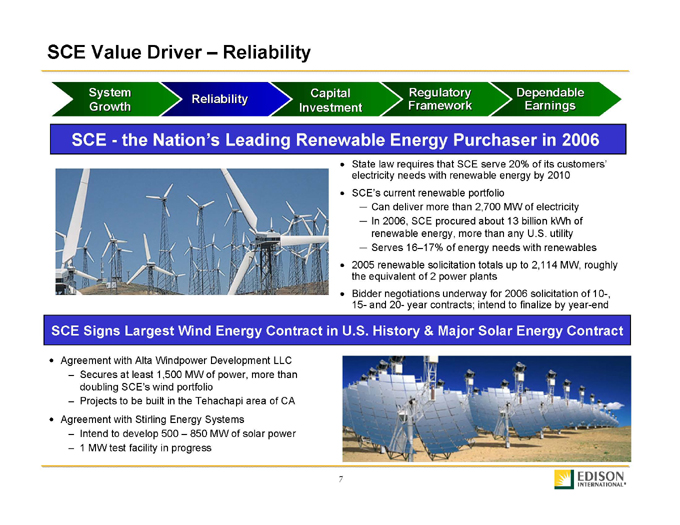
SCE - the Nation’s Leading Renewable Energy Purchaser in 2006
State law requires that SCE serve 20% of its customers’ electricity needs with renewable energy by 2010
SCE’s current renewable portfolio
— Can deliver more than 2,700 MW of electricity
— In 2006, SCE procured about 13 billion kWh of renewable energy, more than any U.S. utility
— Serves 16–17% of energy needs with renewables 2005 renewable solicitation totals up to 2,114 MW, roughly the equivalent of 2 power plants
Bidder negotiations underway for 2006 solicitation of 10-, 15- and 20- year contracts; intend to finalize by year-end
SCE Signs Largest Wind Energy Contract in U.S. History & Major Solar Energy Contract
Agreement with Alta Windpower Development LLC
– Secures at least 1,500 MW of power, more than doubling SCE’s wind portfolio
– Projects to be built in the Tehachapi area of CA
Agreement with Stirling Energy Systems
– Intend to develop 500 – 850 MW of solar power
1 MW test facility in progress
EDISON
INTERNATIONAL® 7
SCE Value Driver – Reliability
System Growth
Reliability
Capital Investment
Regulatory Framework
Dependable Earnings
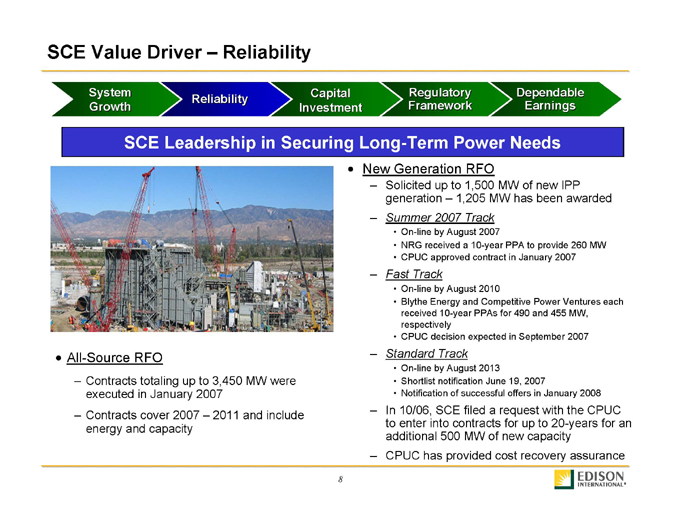
SCE Leadership in Securing Long-Term Power Needs
All-Source RFO
– Contracts totaling up to 3,450 MW were executed in January 2007
– Contracts cover 2007 – 2011 and include energy and capacity
New Generation RFO
– Solicited up to 1,500 MW of new IPP generation – 1,205 MW has been awarded
– Summer 2007 Track
• On-line by August 2007
• NRG received a 10-year PPA to provide 260 MW
• CPUC approved contract in January 2007
– Fast Track
• On-line by August 2010
• Blythe Energy and Competitive Power Ventures each received 10-year PPAs for 490 and 455 MW, respectively
• CPUC decision expected in September 2007
– Standard Track
• On-line by August 2013
• Shortlist notification June 19, 2007
• Notification of successful offers in January 2008
– In 10/06, SCE filed a request with the CPUC to enter into contracts for up to 20-years for an additional 500 MW of new capacity
– CPUC has provided cost recovery assurance
EDISON
INTERNATIONAL® 8
SCE Value Driver – Reliability
System Growth
Reliability
Capital Investment
Regulatory Framework
Dependable Earnings
Recognized as a Leader in Energy Efficiency by U.S. EPA & DOE
SCE is committed to creating, transmitting and improving end use efficiency of electricity in an environmentally responsible manner
During the past 5 years, SCE has –
– Saved more than 4 billion kWh – enough energy to power 500,000 homes for an entire year
– Reduced greenhouse gas emissions by more than 2 million tons – the equivalent of removing 250,000 cars from the road
During the next 2 years, SCE will –
– Help customers save an additional 2 billion kWh, reducing greenhouse gas emissions by another 1 million tons
SCE offers a wide array of energy efficiency and demand response programs which offer financial incentives and/or other benefits for saving energy and shifting usage from on-peak periods
– Time-of-Use (TOU) rates, load management programs and energy management systems (EMS) are some of the many programs offered
Regulatory mechanisms mitigate the revenue impact of changes in electricity sales
EDISON
INTERNATIONAL®
9
SCE Value Driver – Capital Investment
System Growth
Reliability
Capital Investment
Regulatory Framework
Dependable Earnings
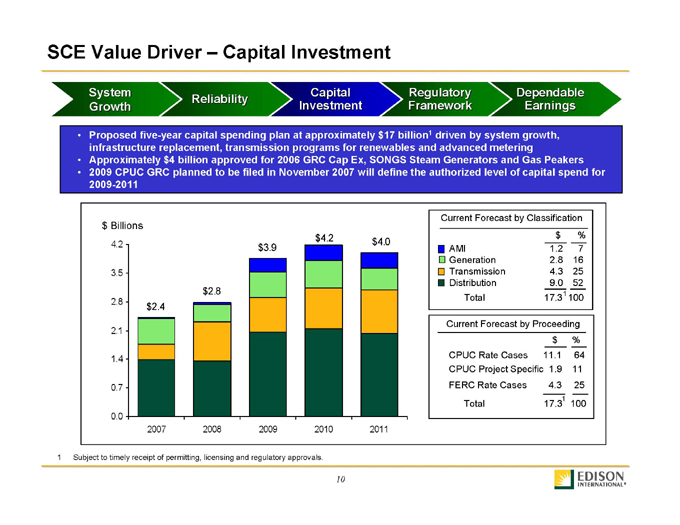
• Proposed five-year capital spending plan at approximately $17 billion1 driven by system growth, infrastructure replacement, transmission programs for renewables and advanced metering
• Approximately $4 billion approved for 2006 GRC Cap Ex, SONGS Steam Generators and Gas Peakers
• 2009 CPUC GRC planned to be filed in November 2007 will define the authorized level of capital spend for 2009-2011
$ Billions 0.0 0.7 1.4 2.1 2.8 3.5 4.2
2007 2008 2009 2010 2011
$2.4 $2.8 $3.9 $4.2 $4.0
Current Forecast by Classification
$%
AMI 1.2 7
Generation 2.8 16
Transmission 4.3 25
Distribution 9.0 52
Total 17.31 100
Current Forecast by Proceeding
$%
CPUC Rate Cases 11.1 64
CPUC Project Specific 1.9 11
FERC Rate Cases 4.3 25
Total 17.3 1 100
1 Subject to timely receipt of permitting, licensing and regulatory approvals.
EDISON
INTERNATIONAL®
10

SCE Value Driver – Capital Investment
System Growth
Reliability
Capital Investment
Regulatory Framework
Dependable Earnings
• Rate base growth of 12%+ annually from 2006 – 2011 subject to maintaining project permitting and construction schedules, and regulatory approvals
• Increasing rate base primarily from 2009 GRC, new transmission, SONGS SGR and AMI
• Plan to file 2009 GRC Notice of Intent (NOI) in July 2007 and application in November 2007
Rate Base 12% + Annual Growth
$ Billions 0.0 3.0 6.0 9.0 12.0 15.0 18.0 21.0
2006 2007 2008 2009 2010 2011
$10.9 $11.7 $12.7 $14.5 $17.6 $20.4
2006 GRC 1 CPUC Approved 2009 GRC 1
1 Includes impact of 2006 CPUC and 2006 FERC GRC Decisions; forecasted rate base for FERC (2007-2011) and CPUC (2009-2011) subject to regulatory approval.
EDISON
INTERNATIONAL®
11
SCE Value Driver – Capital Investment
System Growth Reliability Capital Investment Regulatory Framework Dependable Earnings
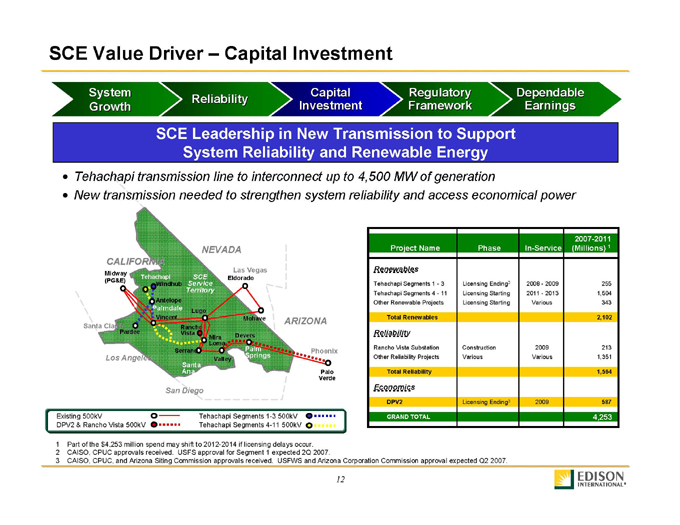
SCE Leadership in New Transmission to Support System Reliability and Renewable Energy
• Tehachapi transmission line to interconnect up to 4,500 MW of generation
• New transmission needed to strengthen system reliability and access economical power
NEVADA CALIFORNIA
Las Vegas Midway Tehachapi SCE Eldorado (PG&E) Service Windhub Territory Antelope
Tehachapi Palmdale Lugo Vincent Mohave ARIZONA Santa Clarita Rancho Pardee Vista Mira Devers Loma
Serrano Palm Phoenix Los Angeles Springs Valley Santa Ana Palo Verde San Diego Santa Ana
Existing 500kV Tehachapi Segments 1-3 500kV DPV2 & Rancho Vista 500kV Tehachapi Segments 4-11 500kV
2007-2011
Project Name Phase In-Service(Millions) 1
Renewables
Tehachapi Segments 1—3 Licensing Ending2 2008—2009 255
Tehachapi Segments 4—11 Licensing Starting 2011—2013 1,504
Other Renewable Projects Licensing Starting Various 343
Total Renewables 2,102
Reliability
Rancho Vista Substation Construction 2009 213
Other Reliability Projects Various Various 1,351
Total Reliability 1,564
Economics
DPV2 Licensing Ending3 2009 587
GRAND TOTAL 4,253
1 Part of the $4,253 million spend may shift to 2012-2014 if licensing delays occur.
2 CAISO, CPUC approvals received. USFS approval for Segment 1 expected 2Q 2007.
3 CAISO, CPUC, and Arizona Siting Commission approvals received. USFWS and Arizona Corporation Commission approval expected Q2 2007.
EDISON INTERNATIONAL® 12
SCE Value Driver – Capital Investment
System Growth Reliability Capital Investment Regulatory Framework Dependable Earnings
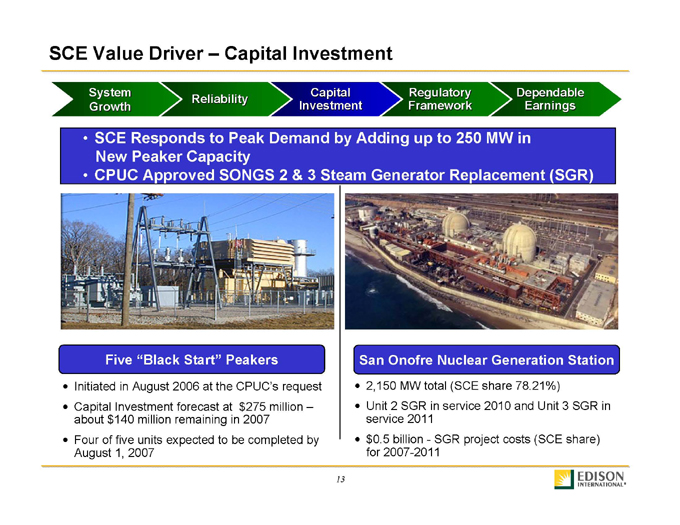
• SCE Responds to Peak Demand by Adding up to 250 MW in New Peaker Capacity
• CPUC Approved SONGS 2 & 3 Steam Generator Replacement (SGR)
Five “Black Start” Peakers
• Initiated in August 2006 at the CPUC’s request
• Capital Investment forecast at $275 million –about $140 million remaining in 2007
• Four of five units expected to be completed by August 1, 2007
San Onofre Nuclear Generation Station
2,150 MW total (SCE share 78.21%)
Unit 2 SGR in service 2010 and Unit 3 SGR in service 2011 $0.5 billion—SGR project costs (SCE share) for 2007-2011
EDISON
INTERNATIONAL® 13
SCE Value Driver – Capital Investment
System Growth Reliability Capital Investment Regulatory Framework Dependable Earnings
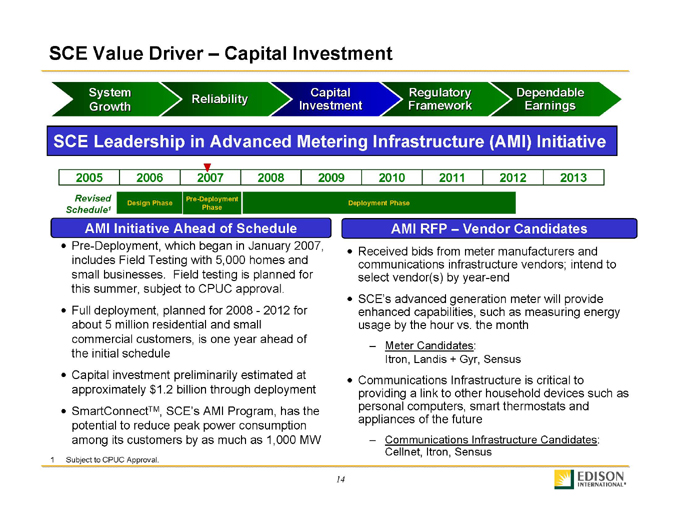
SCE Leadership in Advanced Metering Infrastructure (AMI) Initiative
2005 2006 2007 2008 2009 2010 2011 2012 2013
Revised Pre-Deployment
Design Phase Deployment Phase
Schedule1 Phase
AMI Initiative Ahead of Schedule
• Pre-Deployment, which began in January 2007, includes Field Testing with 5,000 homes and small businesses. Field testing is planned for this summer, subject to CPUC approval.
• Full deployment, planned for 2008—2012 for about 5 million residential and small commercial customers, is one year ahead of the initial schedule
• Capital investment preliminarily estimated at approximately $1.2 billion through deployment
• SmartConnectTM, SCE’s AMI Program, has the potential to reduce peak power consumption among its customers by as much as 1,000 MW
AMI RFP – Vendor Candidates
• Received bids from meter manufacturers and communications infrastructure vendors; intend to select vendor(s) by year-end
• SCE’s advanced generation meter will provide enhanced capabilities, such as measuring energy usage by the hour vs. the month
– Meter Candidates:
Itron, Landis + Gyr, Sensus
• Communications Infrastructure is critical to providing a link to other household devices such as personal computers, smart thermostats and appliances of the future
– Communications Infrastructure Candidates: Cellnet, Itron, Sensus
EDISON
INTERNATIONAL® 14
SCE Value Driver – Regulatory Framework
System Growth Reliability Capital Investment Regulatory Framework Dependable Earnings
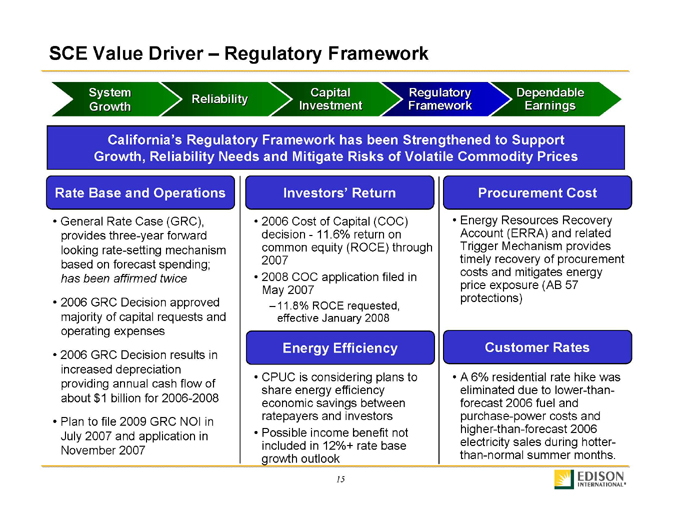
California’s Regulatory Framework has been Strengthened to Support Growth, Reliability Needs and Mitigate Risks of Volatile Commodity Prices
Rate Base and Operations
• General Rate Case (GRC), provides three-year forward looking rate-setting mechanism based on forecast spending; has been affirmed twice
• 2006 GRC Decision approved majority of capital requests and operating expenses
• 2006 GRC Decision results in increased depreciation providing annual cash flow of about $1 billion for 2006-2008
• Plan to file 2009 GRC NOI in July 2007 and application in November 2007
Investors’ Return
• 2006 Cost of Capital (COC) decision—11.6% return on common equity (ROCE) through 2007
• 2008 COC application filed in May 2007
– 11.8% ROCE requested, effective January 2008
Energy Efficiency
• CPUC is considering plans to share energy efficiency economic savings between ratepayers and investors
• Possible income benefit not included in 12%+ rate base growth outlook
Procurement Cost
• Energy Resources Recovery Account (ERRA) and related Trigger Mechanism provides timely recovery of procurement costs and mitigates energy price exposure (AB 57 protections)
Customer Rates
• A 6% residential rate hike was eliminated due to lower-than-forecast 2006 fuel and purchase-power costs and higher-than-forecast 2006 electricity sales during hotter-than-normal summer months.
EDISON INTERNATIONAL® 15
Coal Generation
Operational/Marketing/ Trading Capabilities
Cash Position
Growth Opportunities
Edison Mission Group (EMG)
A Competitive Power Generation Company
EDISON
INTERNATIONAL® 16
EMG – High Quality Generation Portfolio
Coal Generation
Operational/Marketing/ Trading Capabilities
Cash Position
Growth Opportunities
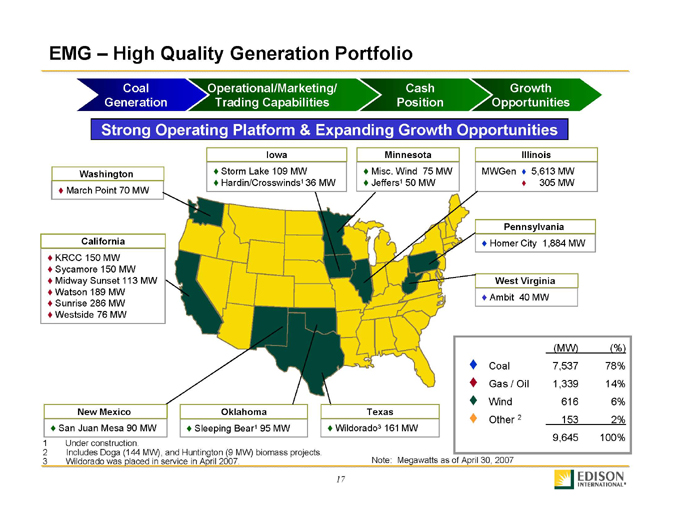
Strong Operating Platform & Expanding Growth Opportunities
Washington March Point 70 MW
Iowa Storm Lake 109 MW Hardin/Crosswinds1 36 MW
Minnesota Misc. Wind 75 MW Jeffers1 50 MW
Illinois MWGen 5,613 MW 305 MW
California KRCC 150 MW Sycamore 150 MW Midway Sunset 113 MW Watson 189 MW Sunrise 286 MW Westside 76 MW
Pennsylvania Homer City 1,884 MW
West Virginia Ambit 40 MW
New Mexico San Juan Mesa 90 MW
Oklahoma Sleeping Bear1 95 MW
Texas Wildorado3 161 MW
(MW) (%)
Coal 7,537 78%
Gas / Oil 1,339 14%
Wind 616 6%
Other 2 153 2%
9,645 100%
1 Under construction.
2 Includes Doga (144 MW), and Huntington (9 MW) biomass projects.
3 Wildorado was placed in service in April 2007.
Note: Megawatts as of April 30, 2007
EDISON
INTERNATIONAL® 17
EMG – Key Value Drivers
Coal Generation
Operational/Marketing/ Trading Capabilities
Cash Position
Growth Opportunities
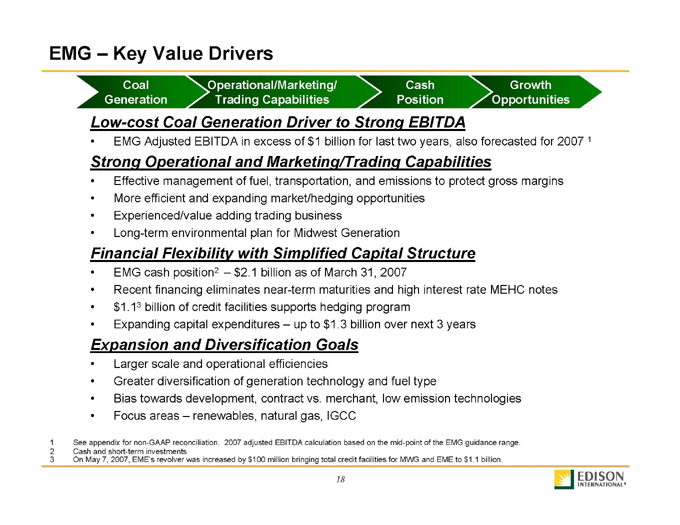
Low-cost Coal Generation Driver to Strong EBITDA
• EMG Adjusted EBITDA in excess of $1 billion for last two years, also forecasted for 2007 1
Strong Operational and Marketing/Trading Capabilities
• Effective management of fuel, transportation, and emissions to protect gross margins
• More efficient and expanding market/hedging opportunities
• Experienced/value adding trading business
• Long-term environmental plan for Midwest Generation
Financial Flexibility with Simplified Capital Structure
• EMG cash position2 – $2.1 billion as of March 31, 2007
• Recent financing eliminates near-term maturities and high interest rate MEHC notes
•$ 1.13 billion of credit facilities supports hedging program
• Expanding capital expenditures – up to $1.3 billion over next 3 years
Expansion and Diversification Goals
• Larger scale and operational efficiencies
• Greater diversification of generation technology and fuel type
• Bias towards development, contract vs. merchant, low emission technologies
• Focus areas – renewables, natural gas, IGCC
1 See appendix for non-GAAP reconciliation. 2007 adjusted EBITDA calculation based on the mid-point of the EMG guidance range.
2 Cash and short-term investments
3 On May 7, 2007, EME’s revolver was increased by $100 million bringing total credit facilities for MWG and EME to $1.1 billion.
EDISON ®
INTERNATIONAL 18
EMG – Merchant Coal Fleet
Coal Generation
Operational/Marketing/ Trading Capabilities
Cash Position
Growth Opportunities
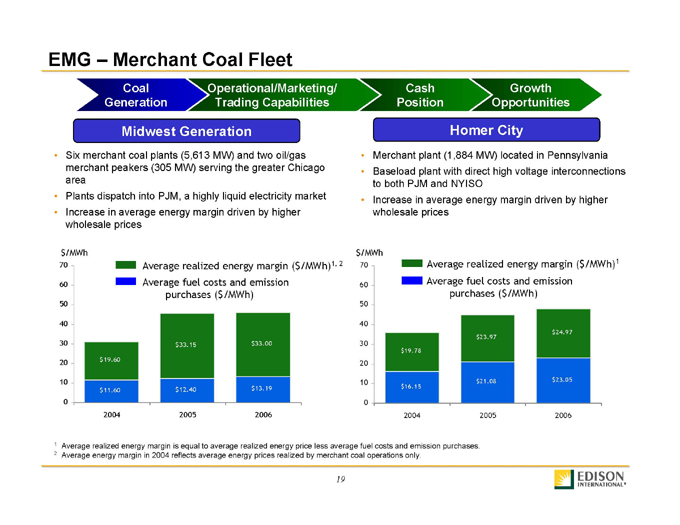
Midwest Generation
• Six merchant coal plants (5,613 MW) and two oil/gas merchant peakers (305 MW) serving the greater Chicago area
• Plants dispatch into PJM, a highly liquid electricity market
• Increase in average energy margin driven by higher wholesale prices
Average realized energy margin ($/MWh)1, 2
Average fuel costs and emission purchases ($/MWh)
$/MWh 0 10 20 30 40 50 60 70 2004 2005 2006
$19.60 $11.60 $33.15 $12.40 $33.00 $13.19
Homer City
• Merchant plant (1,884 MW) located in Pennsylvania
• Baseload plant with direct high voltage interconnections to both PJM and NYISO
• Increase in average energy margin driven by higher wholesale prices
Average realized energy margin ($/MWh)1
Average fuel costs and emission purchases ($/MWh)
$/MWh 0 10 20 30 40 50 60 70 2004 2005 2006
$19.78 $16.15 $23.97 $21.08 $24.97 $23.05
1 Average realized energy margin is equal to average realized energy price less average fuel costs and emission purchases.
2 Average energy margin in 2004 reflects average energy prices realized by merchant coal operations only.
EDISON
INTERNATIONAL® 19
EMG – Hedging Status
Coal Generation
Operational/Marketing/ Trading Capabilities
Cash Position
Growth Opportunities
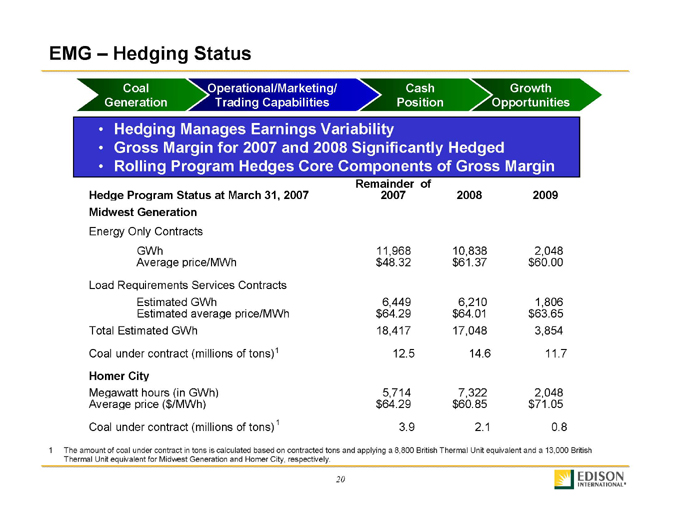
• Hedging Manages Earnings Variability
• Gross Margin for 2007 and 2008 Significantly Hedged
• Rolling Program Hedges Core Components of Gross Margin
Remainder of
Hedge Program Status at March 31, 2007
2007 2008 2009
Midwest Generation
Energy Only Contracts GWh 11,968 10,838 2,048
Average price/MWh $48.32 $61.37 $60.00
Load Requirements Services Contracts
Estimated GWh 6,449 6,210 1,806
Estimated average price/MWh $64.29 $64.01 $63.65
Total Estimated GWh 18,417 17,048 3,854
Coal under contract (millions of tons)1 12.5 14.6 11.7
Homer City
Megawatt hours (in GWh) 5,714 7,322 2,048
Average price ($/MWh) $64.29 $60.85 $71.05
Coal under contract (millions of tons)1 3.9 2.1 0.8
1 The amount of coal under contract in tons is calculated based on contracted tons and applying a 8,800 British Thermal Unit equivalent and a 13,000 British Thermal Unit equivalent for Midwest Generation and Homer City, respectively.
EDISON
INTERNATIONAL® 20
PJM Reliability Pricing Model
Coal Generation
Operational/Marketing/ Trading Capabilities
Cash Position
Growth Opportunities
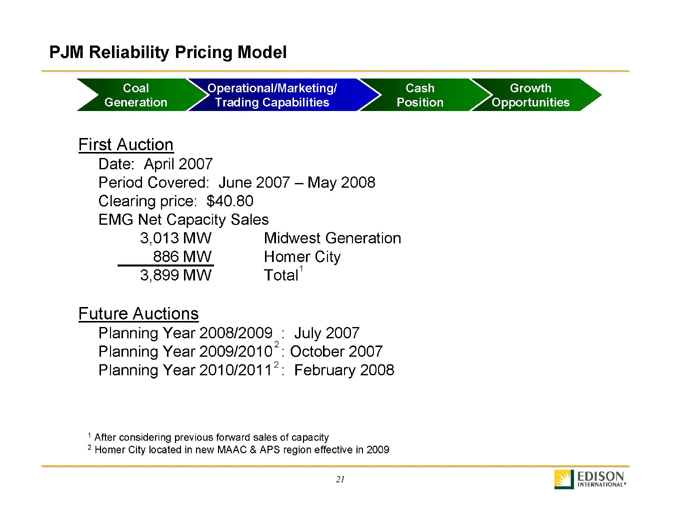
First Auction
Date: April 2007
Period Covered: June 2007 – May 2008 Clearing price: $40.80 EMG Net Capacity Sales 3,013 MW Midwest Generation 886 MW Homer City 3,899 MW Total1
Future Auctions
Planning Year 2008/2009 : July 2007 Planning Year 2009/20102 : October 2007 Planning Year 2010/20112 : February 2008
1 After considering previous forward sales of capacity
2 Homer City located in new MAAC & APS region effective in 2009
EDISON
INTERNATIONAL® 21
EMG – Operational, Marketing and Trading Capabilities
Coal Generation
Operational/Marketing/ Trading Capabilities
Cash Position
Growth Opportunities
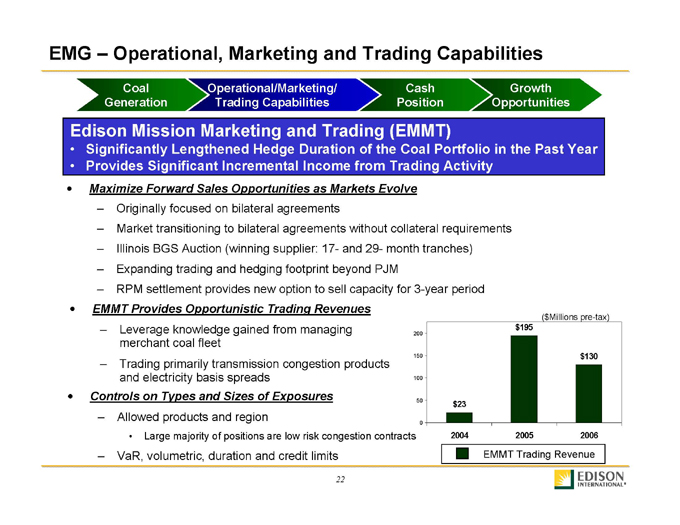
Edison Mission Marketing and Trading (EMMT)
• Significantly Lengthened Hedge Duration of the Coal Portfolio in the Past Year
• Provides Significant Incremental Income from Trading Activity
• Maximize Forward Sales Opportunities as Markets Evolve
– Originally focused on bilateral agreements
– Market transitioning to bilateral agreements without collateral requirements
– Illinois BGS Auction (winning supplier: 17- and 29- month tranches)
– Expanding trading and hedging footprint beyond PJM
– RPM settlement provides new option to sell capacity for 3-year period
• EMMT Provides Opportunistic Trading Revenues
– Leverage knowledge gained from managing merchant coal fleet
– Trading primarily transmission congestion products and electricity basis spreads
• Controls on Types and Sizes of Exposures
– Allowed products and region
• Large majority of positions are low risk congestion contracts
– VaR, volumetric, duration and credit limits
($ Millions pre-tax)
0 50 100 150 200 $23 $195 $130 2004 2005 2006
EMMT Trading Revenue
EDISON
INTERNATIONAL® 22
EMG – Simplified Capital Structure
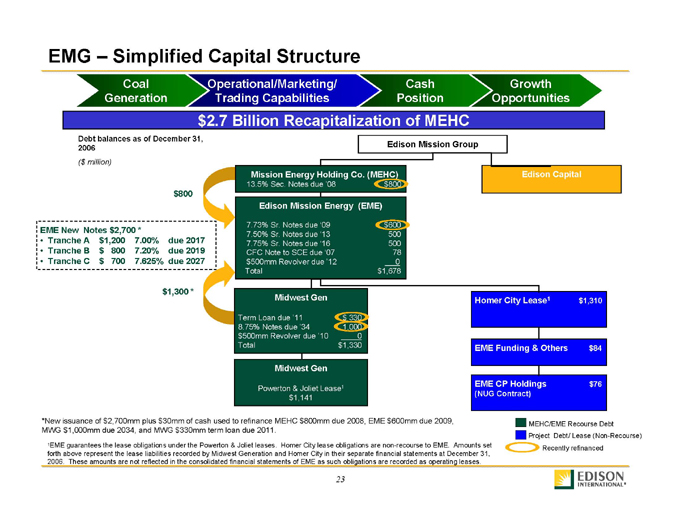
Coal Generation Operational/Marketing/ Trading Capabilities Cash Position Growth Opportunities $2.7 Billion Recapitalization of MEHC
Debt balances as of December 31, 2006($ million) $800
EME New Notes $2,700 *
• Tranche A $1,200 7.00% due 2017
• Tranche B $ 800 7.20% due 2019
• Tranche C $ 700 7.625% due 2027 $1,300 *
Edison Mission Group Mission Energy Holding Co. (MEHC)
13.5% Sec. Notes due ‘08 $800
Edison Mission Energy (EME)
7.73% Sr. Notes due ‘09 $600
7.50% Sr. Notes due ‘13 500
7.75% Sr. Notes due ‘16 500
CFC Note to SCE due ‘07 78
$500mm Revolver due ‘12 0
Total $1,678
Midwest Gen Term Loan due ‘11 $ 330 8.75% Notes due ‘34 1,000 $500mm Revolver due ‘10 0 Total $1,330
Midwest Gen Powerton & Joliet Lease1 $1,141
Edison Capital Homer City Lease1 $1,310 EME Funding & Others $84
EME CP Holdings (NUG Contract) $76
MEHC/EME Recourse Debt Project Debt/ Lease (Non-Recourse) Recently refinanced
*New issuance of $2,700mm plus $30mm of cash used to refinance MEHC $800mm due 2008, EME $600mm due 2009, MWG $1,000mm due 2034, and MWG $330mm term loan due 2011.
1EME guarantees the lease obligations under the Powerton & Joliet leases. Homer City lease obligations are non-recourse to EME. Amounts set forth above represent the lease liabilities recorded by Midwest Generation and Homer City in their separate financial statements at December 31, 2006. These amounts are not reflected in the consolidated financial statements of EME as such obligations are recorded as operating leases.
EDISON
INTERNATIONAL® 23
EMG – Midwest Gen Environmental Agreement
Coal Generation Operational/Marketing/ Trading Capabilities Cash Position Growth Opportunities
Provides Reasonable Certainty of Amount & Timing of Emission Reductions through 2018.
• Comprehensive agreement addresses mercury, NOx, and SO2 emissions
• Achieves specified emission reductions through retrofits or unit shutdowns
– Mercury – 90% removal by 2015
– NOx – emissions of 0.11 lbs. per million Btus by 2011 (66% reduction)
– SO2 – emissions of 0.11 lbs. per million Btus by 2019, with interim step downs (78% reduction)
• Helps continue good relationships with key constituents and regulators and supports growth
– Agreement supported by Gov. Blagojevich, City of Chicago, and several influential environmental and community groups
– Illinois EPA assistance with IGCC and wind development, permit approvals
• Emission credit selling allowed
• Agreement filed under Illinois State Implementation Plan of CAIR
EDISON
INTERNATIONAL® 24
EMG – Environmental Compliance
Coal Generation Operational/Marketing/ Trading Capabilities Cash Position Growth Opportunities
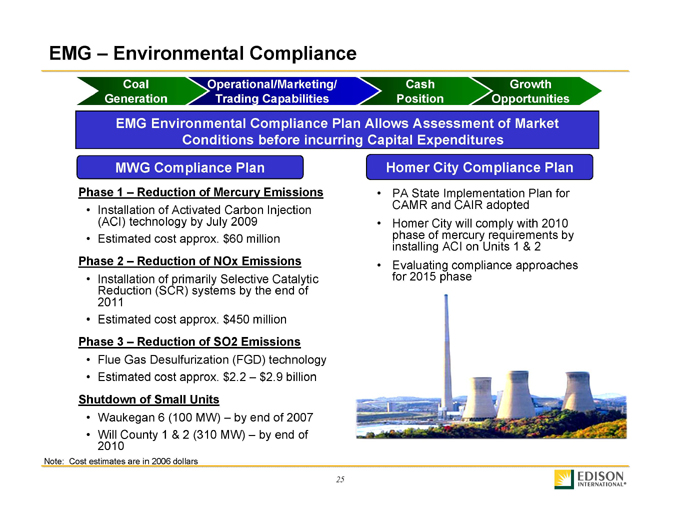
EMG Environmental Compliance Plan Allows Assessment of Market Conditions before incurring Capital Expenditures
MWG Compliance Plan
Phase 1 – Reduction of Mercury Emissions
• Installation of Activated Carbon Injection (ACI) technology by July 2009
• Estimated cost approx. $60 million
Phase 2 – Reduction of NOx Emissions
• Installation of primarily Selective Catalytic Reduction (SCR) systems by the end of 2011
• Estimated cost approx. $450 million
Phase 3 – Reduction of SO2 Emissions
• Flue Gas Desulfurization (FGD) technology
• Estimated cost approx. $2.2 – $2.9 billion
Shutdown of Small Units
• Waukegan 6 (100 MW) – by end of 2007
• Will County 1 & 2 (310 MW) – by end of 2010
Homer City Compliance Plan
• PA State Implementation Plan for CAMR and CAIR adopted
• Homer City will comply with 2010 phase of mercury requirements by installing ACI on Units 1 & 2
• Evaluating compliance approaches for 2015 phase
Note: Cost estimates are in 2006 dollars
EDISON
INTERNATIONAL® 25
EMG – Wind Energy Development Strategy & Portfolio
Coal Generation Operational/Marketing/ Trading Capabilities Cash Position Growth Opportunities
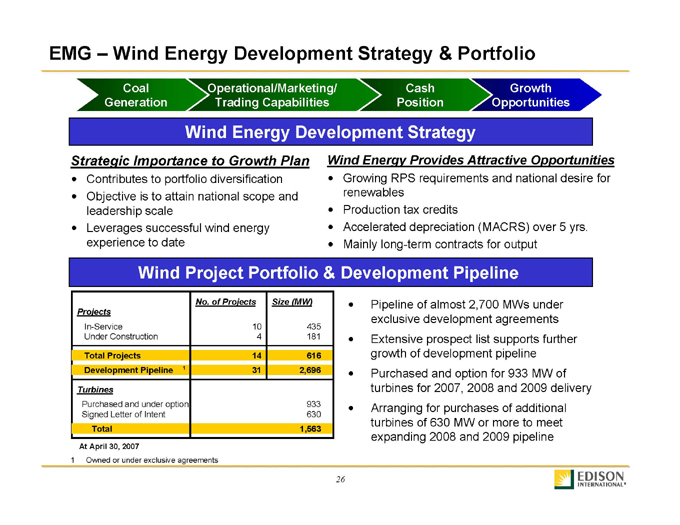
Wind Energy Development Strategy
Strategic Importance to Growth Plan
• Contributes to portfolio diversification
• Objective is to attain national scope and leadership scale
• Leverages successful wind energy experience to date
Wind Energy Provides Attractive Opportunities
• Growing RPS requirements and national desire for renewables
• Production tax credits
• Accelerated depreciation (MACRS) over 5 yrs.
• Mainly long-term contracts for output
Wind Project Portfolio & Development Pipeline
No. of Projects Size (MW)
Projects
In-Service 10 435
Under Construction 4 181
Total Projects 14 616
Development Pipeline 1 31 2,696
Turbines
Purchased and under option 933
Signed Letter of Intent 630
Total 1,563
• Pipeline of almost 2,700 MWs under exclusive development agreements
• Extensive prospect list supports further growth of development pipeline
• Purchased and option for 933 MW of turbines for 2007, 2008 and 2009 delivery
• Arranging for purchases of additional turbines of 630 MW or more to meet expanding 2008 and 2009 pipeline
At April 30, 2007
1 Owned or under exclusive agreements
EDISON
INTERNATIONAL ® 26
EMG – Wind Projects and Pipeline
Coal Generation Operational/Marketing/ Trading Capabilities Cash Position Growth Opportunities
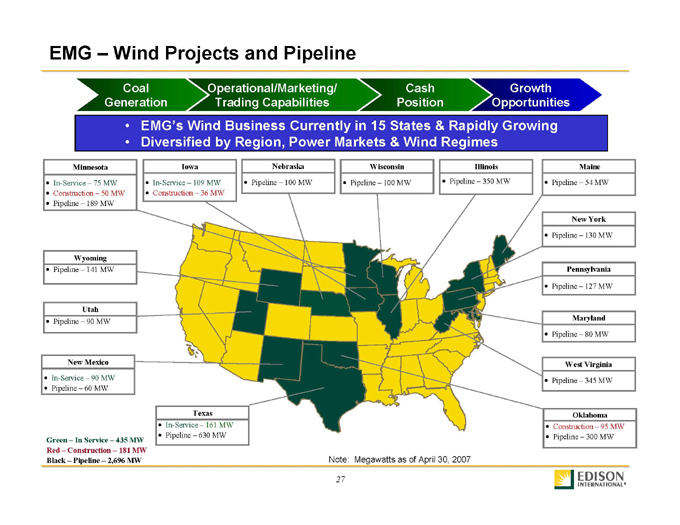
EMG’s Wind Business Currently in 15 States & Rapidly Growing
Diversified by Region, Power Markets & Wind Regimes
Minnesota In-Service – 75 MW Construction – 50 MW Pipeline – 189 MW
Iowa In-Service – 109 MW Construction ��� 36 MW
Nebraska Pipeline – 100 MW
Wisconsin Pipeline – 100 MW
Illinois Pipeline – 350 MW
Maine Pipeline – 54 MW
Wyoming Pipeline – 141 MW
Utah Pipeline – 90 MW
New Mexico In-Service – 90 MW Pipeline – 60 MW
Texas In-Service – 161 MW Pipeline – 630 MW
New York Pipeline – 130 MW
Pennsylvania Pipeline – 127 MW
Maryland Pipeline – 80 MW
West Virginia Pipeline – 345 MW
Oklahoma Construction – 95 MW Pipeline – 300 MW
Green – In Service – 435 MW Red – Construction – 181 MW Black – Pipeline – 2,696 MW
Note: Megawatts as of April 30, 2007
EDISON
INTERNATIONAL ® 27
EMG – Thermal Generation Opportunities
Coal Generation Operational/Marketing/ Trading Capabilities Cash Position Growth Opportunities
Thermal Generation Opportunities
Recontracting Projects
Recontracting Existing “Big Four” Gas Assets (602 MW)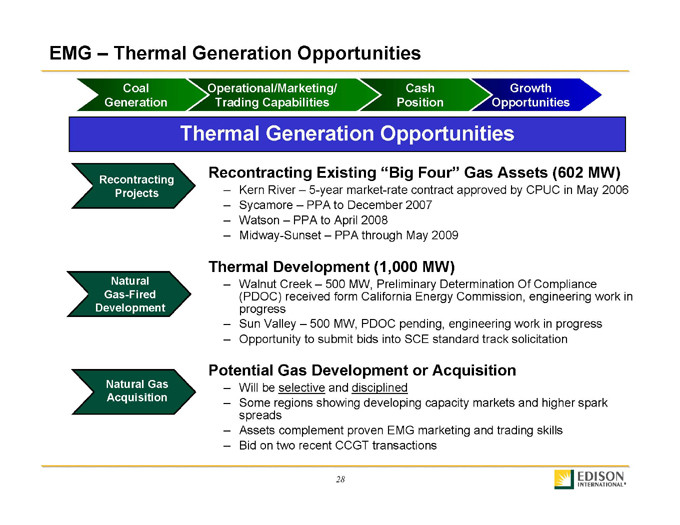
Kern River – 5-year market-rate contract approved by CPUC in May 2006
Sycamore – PPA to December 2007
Watson – PPA to April 2008
Midway-Sunset – PPA through May 2009
Natural Gas-Fired Development
Thermal Development (1,000 MW)
Walnut Creek – 500 MW, Preliminary Determination Of Compliance (PDOC) received form California Energy Commission, engineering work in progress
Sun Valley – 500 MW, PDOC pending, engineering work in progress
Opportunity to submit bids into SCE standard track solicitation
Natural Gas Acquisition
Potential Gas Development or Acquisition
Will be selective and disciplined
Some regions showing developing capacity markets and higher spark spreads
Assets complement proven EMG marketing and trading skills
Bid on two recent CCGT transactions
EDISON
INTERNATIONAL ® 28
EMG – IGCC Projects
Coal Generation Operational/Marketing/ Trading Capabilities Cash Position Growth Opportunities
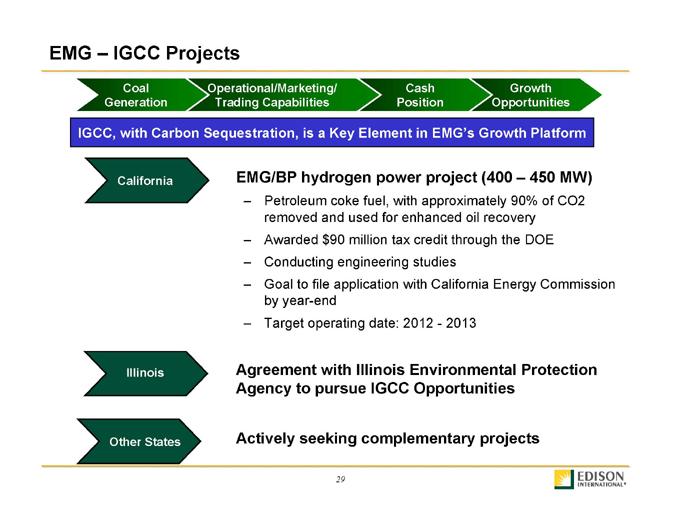
IGCC, with Carbon Sequestration, is a Key Element in EMG’s Growth Platform
California
EMG/BP hydrogen power project (400 – 450 MW)
Petroleum coke fuel, with approximately 90% of CO2 removed and used for enhanced oil recovery
Awarded $90 million tax credit through the DOE
Conducting engineering studies
Goal to file application with California Energy Commission by year-end
Target operating date: 2012—2013
Illinois
Agreement with Illinois Environmental Protection Agency to pursue IGCC Opportunities
Other States
Actively seeking complementary projects
EDISON
INTERNATIONAL ® 29
Performance
Balance Sheet Strength
Growth
Dividends
Shareholder Returns
Year to Date Performance Through March 31, 2007 And Annual Performance Through December 31, 2005 & 2006
EDISON
INTERNATIONAL ® 30
Edison International – Earnings Performance
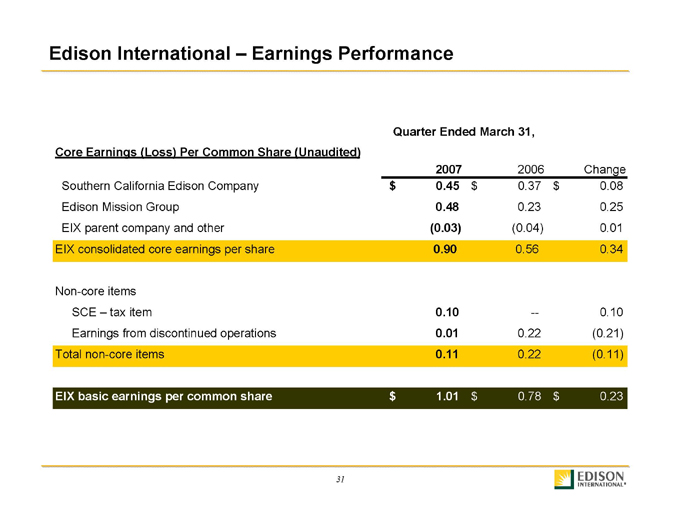
Quarter Ended March 31,
Core Earnings (Loss) Per Common Share (Unaudited)
Southern California Edison Company
Edison Mission Group
EIX parent company and other
EIX consolidated core earnings per share
Non-core items SCE – tax item
Earnings from discontinued operations Total non-core items
EIX basic earnings per common share
2007 2006 Change $ 0.45 $ 0.37 $ 0.08 0.48 0.23 0.25
(0.03)(0.04) 0.01 0.90 0.56 0.34 0.10 — 0.10
0.01 0.22 (0.21) 0.11 0.22 (0.11) $ 1.01 $ 0.78 $ 0.23
EDISON
INTERNATIONAL ® 31
Edison International – Earnings Performance
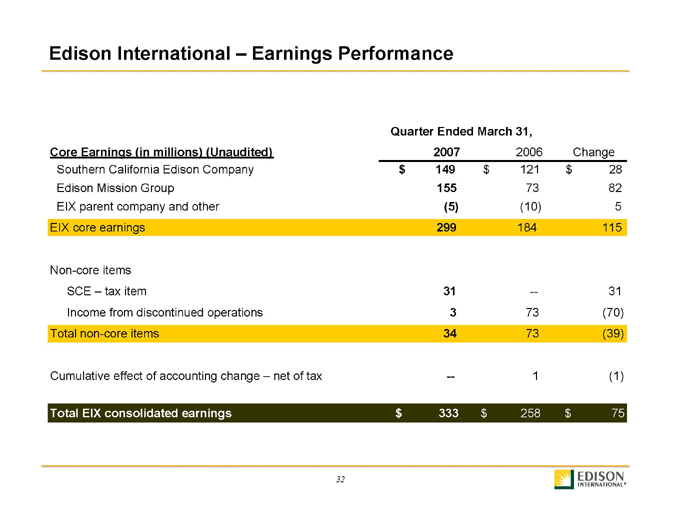
Quarter Ended March 31,
Core Earnings (in millions) (Unaudited) 2007 2006 Change
Southern California Edison Company $ 149 $ 121 $ 28
Edison Mission Group 155 73 82
EIX parent company and other(5)(10) 5
EIX core earnings 299 184 115
Non-core items
SCE – tax item 31 — 31
Income from discontinued operations 3 73(70)
Total non-core items 34 73(39)
Cumulative effect of accounting change – net of tax — 1(1)
Total EIX consolidated earnings $ 333 $ 258 $ 75
EDISON
INTERNATIONAL ® 32
Edison International – EMG Operating Performance Update
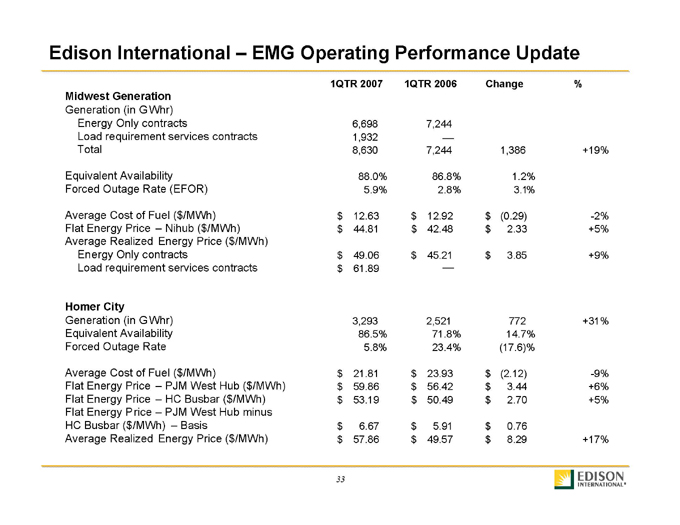
1QTR 2007 1QTR 2006 Change%
Midwest Generation
Generation (in G Whr)
Energy Only contracts 6,698 7,244
Load requirement services contracts 1,932
Total 8,630 7,244 1,386 +19%
Equivalent Availability 88.0% 86.8% 1.2%
Forced Outage Rate (EFOR) 5.9% 2.8% 3.1%
Average Cost of Fuel ($/MWh) $ 12.63 $ 12.92 $ (0.29) -2%
Flat Energy Price – Nihub ($/MWh) $ 44.81 $ 42.48 $ 2.33 +5%
Average Realized Energy Price ($/MWh)
Energy Only contracts $ 49.06 $ 45.21 $ 3.85 +9%
Load requirement services contracts $ 61.89
Homer City
Generation (in G Whr) 3,293 2,521 772 +31%
Equivalent Availability 86.5% 71.8% 14.7%
Forced Outage Rate 5.8% 23.4%(17.6)%
Average Cost of Fuel ($/MWh) $ 21.81 $ 23.93 $ (2.12) -9%
Flat Energy Price – PJM West Hub ($/MWh) $ 59.86 $ 56.42 $ 3.44 +6%
Flat Energy Price – HC Busbar ($/MWh) $ 53.19 $ 50.49 $ 2.70 +5%
Flat Energy Price – PJM West Hub minus
HC Busbar ($/MWh) – Basis $ 6.67 $ 5.91 $ 0.76
Average Realized Energy Price ($/MWh) $ 57.86 $ 49.57 $ 8.29 +17%
EDISON
INTERNATIONAL ® 33
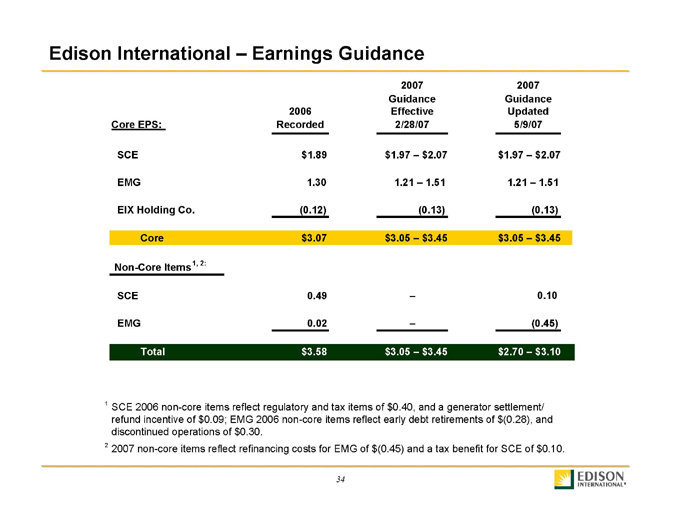
Edison International – Earnings Guidance
Core EPS: 2006 Recorded 2007 Guidance Effective 2/28/07 2007 Guidance Updated 5/9/07
SCE $ 1.89 $1.97 – $ 2.07 $1.97 – $ 2.07
EMG 1.30 1.21 – 1.51 1.21 – 1.51
EIX Holding Co.(0.12)(0.13)(0.13)
Core $ 3.07 $3.05 – $ 3.45 $3.05 – $ 3.45
Non-Core Items1, 2:
SCE 0.49 – 0.10
EMG 0.02 –(0.45)
Total $ 3.58 $3.05 – $ 3.45 $2.70 – $ 3.10
1 SCE 2006 non-core items reflect regulatory and tax items of $0.40, and a generator settlement/ refund incentive of $0.09; EMG 2006 non-core items reflect early debt retirements of $(0.28), and discontinued operations of $0.30.
2 2007 non-core items reflect refinancing costs for EMG of $(0.45) and a tax benefit for SCE of $0.10.
EDISON
INTERNATIONAL® 34

Edison International – Earnings Performance
Year Ended December 31,
Earnings (Loss) Per Common Share (Unaudited) 2006 2005 Change
Southern California Edison Company$ 1.89 $ 1.82 $ 0.07
Edison Mission Group:
Mission Energy Holding Company1.03 1.17(0.14)
Edison Capital 0.27 0.25 0.02
Edison Mission Group Total 1.30 1.42(0.12)
EIX (Parent) and Other(0.12)(0.11)(0.01)
EIX Consolidated Core Earnings3.07 3.13(0.06)
Non-core items:
SCE – Regulatory and tax items 0.40 0.36 0.04
SCE – Generator settlement / refund incentive 0.09 0.04 0.05
MEHC – March Point impairment ?(0.10) 0.10
MEHC – Early debt retirements(0.28)(0.05)(0.23)
Discontinued operations 0.30 0.09 0.21
Total Non-core Items 0.51 0.34 0.17
Total EIX Consolidated Earnings$ 3.58 $3.47 $ 0.11
EDISON
INTERNATIONAL ® 35
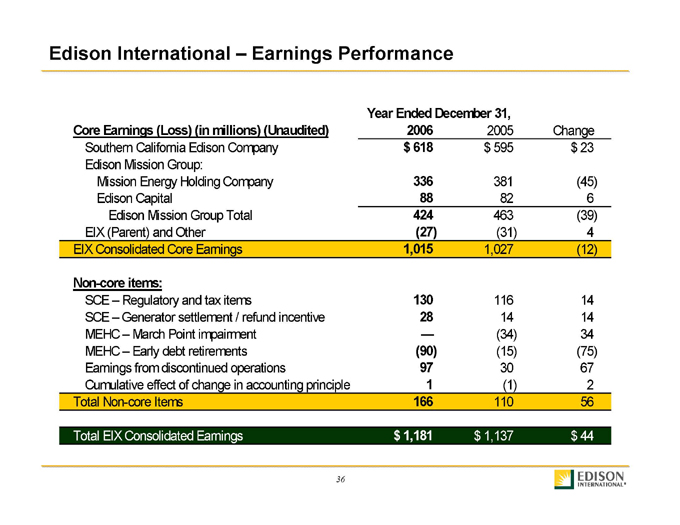
Edison International – Earnings Performance
Year Ended December 31,
Core Earnings (Loss) (in millions) (Unaudited) 2006 2005 Change
Southern California Edison Company $ 618 $ 595 $ 23
Edison Mission Group:
Mission Energy Holding Company 336 381(45)
Edison Capital 88 82 6
Edison Mission Group Total 424 463(39)
EIX (Parent) and Other(27)(31) 4
EIX Consolidated Core Earnings 1,015 1,027(12)
Non-core items:
SCE – Regulatory and tax items 130 116 14
SCE – Generator settlement / refund incentive 28 14 14
MEHC – March Point impairment ?(34) 34
MEHC – Early debt retirements (90)(15)(75)
Earnings from discontinued operations 97 30 67
Cumulative effect of change in accounting principle 1(1) 2
Total Non-core Items 166 110 56
Total EIX Consolidated Earnings $ 1,181 $ 1,137 $ 44
EDISON
INTERNATIONAL ® 36
Appendix
EDISON
INTERNATIONAL ® 37
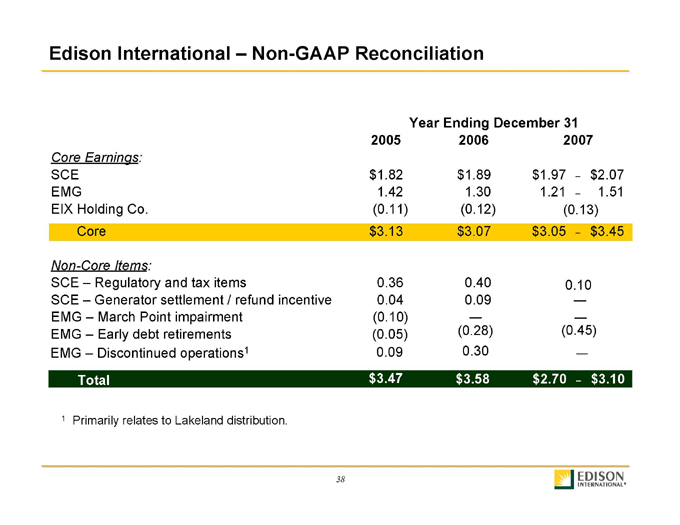
Edison International – Non-GAAP Reconciliation
Year Ending December 31
2005 2006 2007
Core Earnings:
SCE $ 1.82 $ 1.89 $ 1.97 – $ 2.07
EMG 1.42 1.30 1.21 – 1.51
EIX Holding Co.(0.11) (0.12) (0.13)
Core $ 3.13 $ 3.07 $ 3.05 – $ 3.45
Non-Core Items:
SCE – Regulatory and tax items 0.36 0.40 0.10
SCE – Generator settlement / refund incentive 0.04 0.09 —
EMG – March Point impairment(0.10) —
EMG – Early debt retirements(0.05)(0.28)(0.45)
EMG – Discontinued operations1 0.09 0.30 —
Total $ 3.47 $ 3.58 $ 2.70 – $ 3.10
EDISON
INTERNATIONAL ® 38
Edison International – Non-GAAP Reconciliation
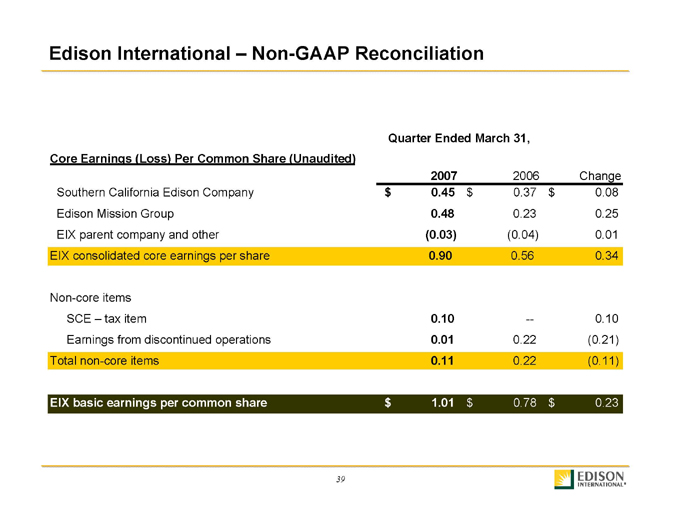
Quarter Ended March 31,
Core Earnings (Loss) Per Common Share (Unaudited)
2007 2006 Change
Southern California Edison Company $ 0.45 $ 0.37 $ 0.08
Edison Mission Group 0.48 0.23 0.25
EIX parent company and other(0.03)(0.04) 0.01
EIX consolidated core earnings per share 0.90 0.56 0.34
Non-core items
SCE – tax item 0.10 — 0.10
Earnings from discontinued operations 0.01 0.22(0.21)
Total non-core items 0.11 0.22(0.11)
EIX basic earnings per common share $ 1.01 $ 0.78 $ 0.23
EDISON
INTERNATIONAL ® 39
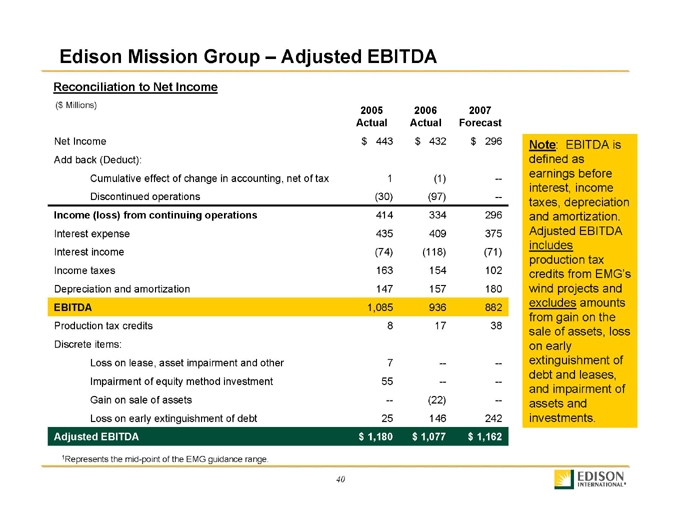
Edison Mission Group – Adjusted EBITDA
Reconciliation to Net Income
($ Millions)
2005 2006 2007
Actual Actual Forecast
Net Income $ 443 $ 432 $ 296
Add back (Deduct):
Cumulative effect of change in accounting, net of tax 1(1) —
Discontinued operations(30)(97) —
Income (loss) from continuing operations 414 334 296
Interest expense 435 409 375
Interest income(74)(118)(71)
Income taxes 163 154 102
Depreciation and amortization 147 157 180
EBITDA 1,085 936 882
Production tax credits 8 17 38
Discrete items:
Loss on lease, asset impairment and other 7 — —
Impairment of equity method investment 55 — —
Gain on sale of assets —(22) —
Loss on early extinguishment of debt 25 146 242
Adjusted EBITDA $ 1,180 $ 1,077 $ 1,162
1Represents the mid-point of the EMG guidance range.
Note: EBITDA is defined as earnings before interest, income taxes, depreciation and amortization. Adjusted EBITDA includes production tax credits from EMG’s wind projects and excludes amounts from gain on the sale of assets, loss on early extinguishment of debt and leases, and impairment of assets and investments.
EDISON
INTERNATIONAL ® 40
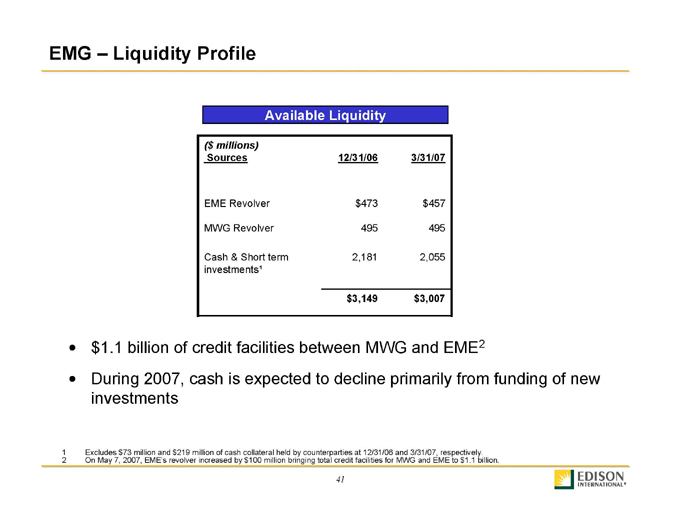
EMG – Liquidity Profile
Available Liquidity
($ millions)
Sources 12/31/06 3/31/07
EME Revolver $ 473 $ 457
MWG Revolver 495 495
Cash & Short term 2,181 2,055
investments¹
$ 3,149 $ 3,007
$1.1 billion of credit facilities between MWG and EME2
During 2007, cash is expected to decline primarily from funding of new investments
1 Excludes $73 million and $219 million of cash collateral held by counterparties at 12/31/06 and 3/31/07, respectively.
2 On May 7, 2007, EME’s revolver increased by $100 million bringing total credit facilities for MWG and EME to $1.1 billion.
EDISON
INTERNATIONAL ® 41
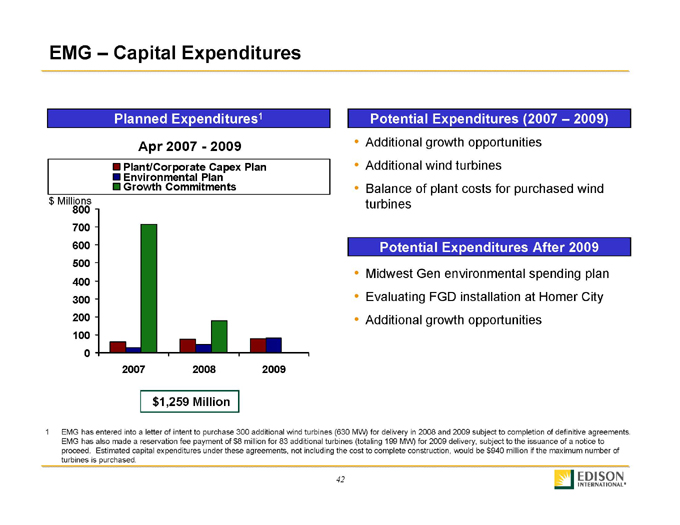
EMG – Capital Expenditures
Planned Expenditures1
Apr 2007—2009
Plant/Corporate Capex Plan Environmental Plan Growth Commitments
$ Millions 800 700 600 500 400 300 200 100 0
2007 2008 2009 $1,259 Million
Potential Expenditures (2007 – 2009)
• Additional growth opportunities
• Additional wind turbines
• Balance of plant costs for purchased wind turbines
Potential Expenditures After 2009
• Midwest Gen environmental spending plan
• Evaluating FGD installation at Homer City
• Additional growth opportunities
1 EMG has entered into a letter of intent to purchase 300 additional wind turbines (630 MW) for delivery in 2008 and 2009 subject to completion of definitive agreements. EMG has also made a reservation fee payment of $8 million for 83 additional turbines (totaling 199 MW) for 2009 delivery, subject to the issuance of a notice to proceed. Estimated capital expenditures under these agreements, not including the cost to complete construction, would be $940 million if the maximum number of turbines is purchased.
EDISON
INTERNATIONAL ® 42
Edison International – 2006 Financial Highlights
Record high net income of approx. $1.2 billion or $3.58 per share vs. guidance of $3.19 per share
Core1 earnings of $3.07 per share exceeded guidance of $2.91 per share
EIX dividend increased by 7.4% to an annual rate of $1.16 per share
Growth initiatives on plan for both SCE and EMG
SCE invested $2.2 billion in capital projects in 2006
Major transmission projects progressing
Advanced Metering Infrastructure (AMI) deployment accelerated one year
EMG advanced plans to diversify and grow its generation portfolio
EMG significantly advanced development of renewable energy projects
MOU with Illinois EPA provides much greater certainty for future state environmental regulations and flexibility to comply
Maintained utility authorized equity return for 2007 at 11.6%
EDISON
INTERNATIONAL ® 43