Exhibit 99.1
Leading the Way in Electricity SM
EDISON INTERNATIONAL®
Deutsche Bank
Energy and Utilities Conference
May 31, 2007
Tom McDaniel, Executive Vice President,
Chief Financial Officer and Treasurer
EDISON INTERNATIONAL®
Leading the Way in Electricity SM
Forward Looking Statements
Statements contained in this presentation about future performance, including, without limitation, earnings, asset and rate base growth, load growth, capital investments, and other statements that are not purely historical, are forward-looking statements. These forward-looking statements reflect our current expectations; however, such statements involve risks and uncertainties. Actual results could differ materially from current expectations. Important factors that could cause different results are discussed under the headings “Risk Factors” and “Management’s Discussion and Analysis” in Edison International’s 2006 Form 10-K and subsequent reports filed with the Securities and Exchange Commission and available on our website: www.edison.com. These forward-looking statements represent our expectations only as of the date of this presentation, and Edison International assumes no duty to update them to reflect new information, events or circumstances.
Deutsche Bank Energy & Utilities Conference 1 EDISON INTERNATIONAL®
Leading the Way in Electricity SM
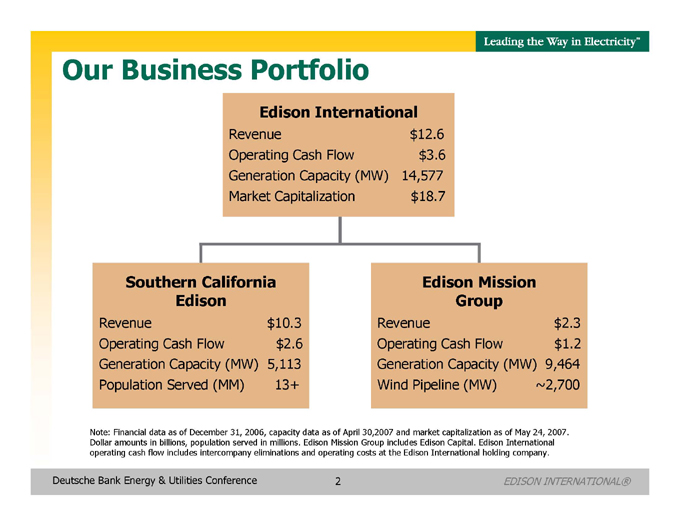
Our Business Portfolio
Edison International
Revenue $12.6
Operating Cash Flow $3.6
Generation Capacity (MW) 14,577
Market Capitalization $18.7
Southern California Edison
Revenue $10.3
Operating Cash Flow $2.6
Generation Capacity (MW) 5,113
Population Served (MM) 13+
Edison Mission Group
Revenue $2.3
Operating Cash Flow $1.2
Generation Capacity (MW) 9,464
Wind Pipeline (MW) ~2,700
Note: Financial data as of December 31, 2006, capacity data as of April 30,2007 and market capitalization as of May 24, 2007. Dollar amounts in billions, population served in millions. Edison Mission Group includes Edison Capital. Edison International operating cash flow includes intercompany eliminations and operating costs at the Edison International holding company.
Deutsche Bank Energy & Utilities Conference 2 EDISON INTERNATIONAL®
Leading the Way in Electricity SM
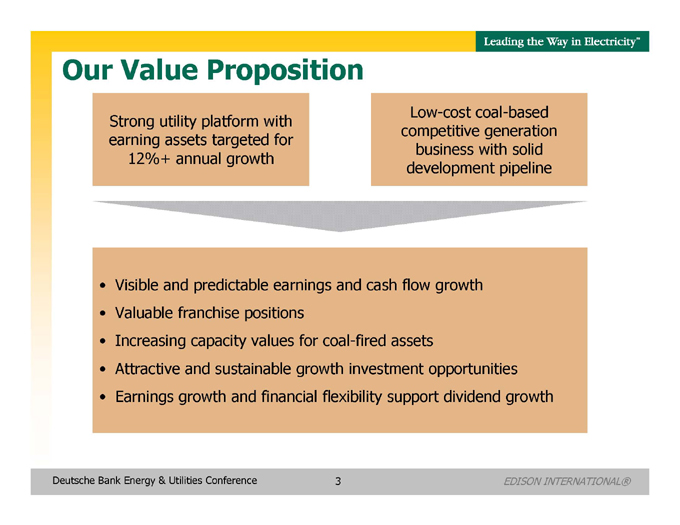
Our Value Proposition
Strong utility platform with earning assets targeted for 12%+ annual growth
Low-cost coal-based competitive generation business with solid development pipeline
Visible and predictable earnings and cash flow growth
Valuable franchise positions
Increasing capacity values for coal-fired assets
Attractive and sustainable growth investment opportunities
Earnings growth and financial flexibility support dividend growth
Deutsche Bank Energy & Utilities Conference 3 EDISON INTERNATIONAL®
Leading the Way in Electricity SM
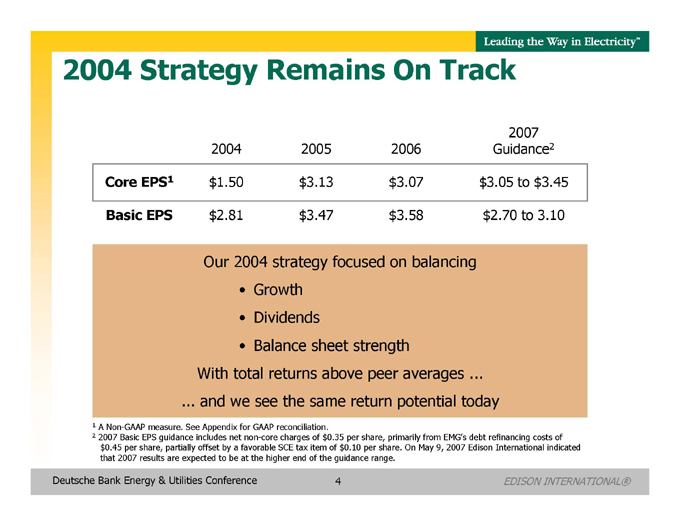
2004 Strategy Remains On Track
2007 2004 2005 2006 Guidance2
Core EPS1 $1.50 $3.13 $3.07 $3.05 to $3.45
Basic EPS $2.81 $3.47 $3.58 $2.70 to 3.10
Our 2004 strategy focused on balancing
Growth
Dividends
Balance sheet strength
With total returns above peer averages . . and we see the same return potential today
1 A Non-GAAP measure. See Appendix for GAAP reconciliation.
2 2007 Basic EPS guidance includes net non-core charges of $0.35 per share, primarily from EMG’s debt refinancing costs of $0.45 per share, partially offset by a favorable SCE tax item of $0.10 per share. On May 9, 2007 Edison International indicated that 2007 results are expected to be at the higher end of the guidance range.
Deutsche Bank Energy & Utilities Conference 4 EDISON INTERNATIONAL®
Leading the Way in Electricity SM
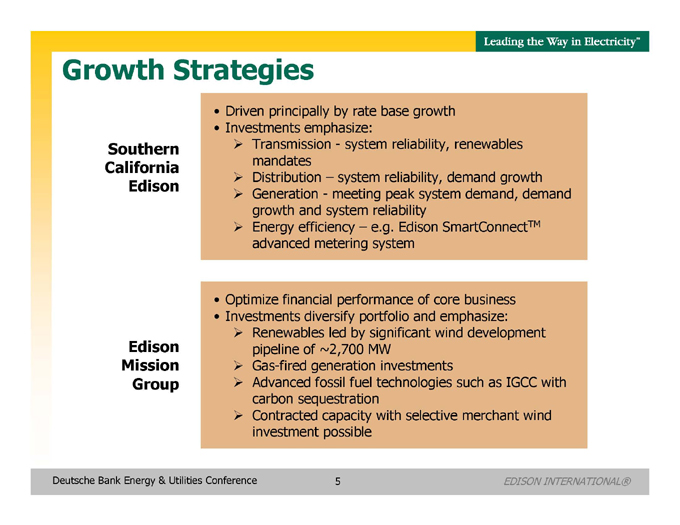
Growth Strategies
Southern California Edison
Driven principally by rate base growth
Investments emphasize:
Transmission - system reliability, renewables mandates
Distribution – system reliability, demand growth
Generation - meeting peak system demand, demand growth and system reliability
Energy efficiency – e.g. Edison SmartConnectTM advanced metering system
Edison Mission Group
Optimize financial performance of core business
Investments diversify portfolio and emphasize:
Renewables led by significant wind development pipeline of ~2,700 MW
Gas-fired generation investments
Advanced fossil fuel technologies such as IGCC with carbon sequestration
Contracted capacity with selective merchant wind investment possible
Deutsche Bank Energy & Utilities Conference 5 EDISON INTERNATIONAL®
Leading the Way in Electricity SM
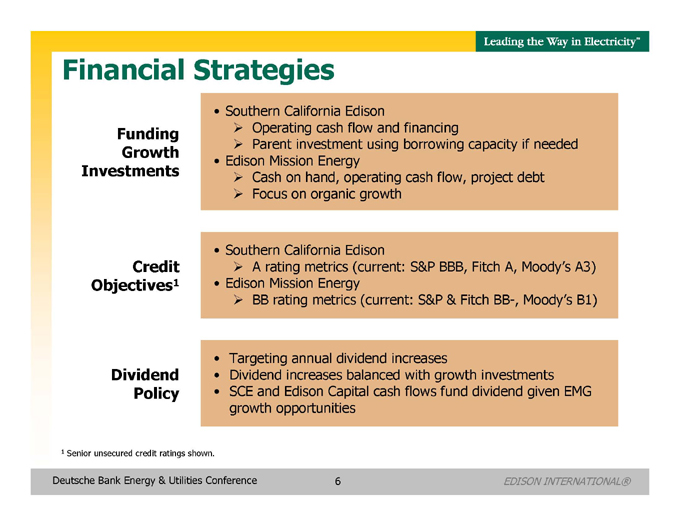
Financial Strategies
Funding Growth Investments
Southern California Edison
Operating cash flow and financing
Parent investment using borrowing capacity if needed
Edison Mission Energy
Cash on hand, operating cash flow, project debt
Focus on organic growth
Credit Objectives1
Southern California Edison
A rating metrics (current: S&P BBB, Fitch A, Moody’s A3)
Edison Mission Energy
BB rating metrics (current: S&P & Fitch BB-, Moody’s B1)
Dividend Policy
Targeting annual dividend increases
Dividend increases balanced with growth investments
SCE and Edison Capital cash flows fund dividend given EMG growth opportunities
1 Senior unsecured credit ratings shown.
Deutsche Bank Energy & Utilities Conference 6 EDISON INTERNATIONAL®
Leading the Way in Electricity SM
Southern California Edison (SCE)
An Investor-Owned Electric Utility
Deutsche Bank Energy & Utilities Conference 7 EDISON INTERNATIONAL®
Leading the Way in Electricity SM
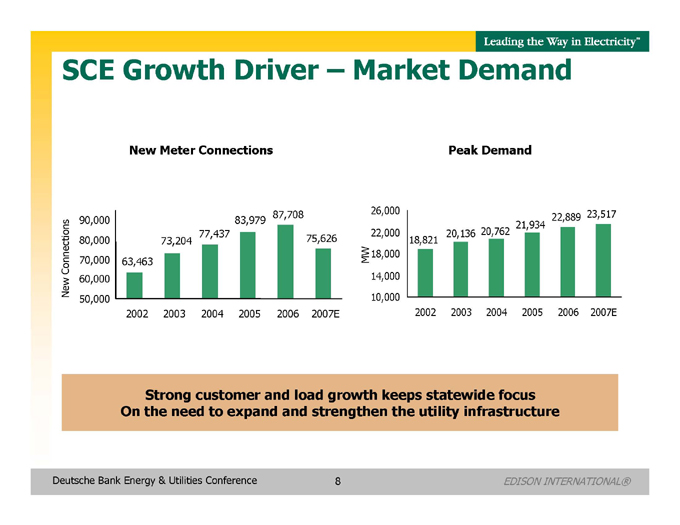
SCE Growth Driver – Market Demand
New Meter Connections
87,708 90,000 83,979 Connections 77,437 75,626 80,000 73,204 70,000 63,463 New 60,000 50,000 2002 2003 2004 2005 2006 2007E
Peak Demand
26,000 23,517 21,934 22,889 22,000 18,821 20,136 20,762 18,000 14,000 10,000 2002 2003 2004 2005 2006 2007E
Strong customer and load growth keeps statewide focus On the need to expand and strengthen the utility infrastructure
Deutsche Bank Energy & Utilities Conference 8 EDISON INTERNATIONAL®
Leading the Way in Electricity SM
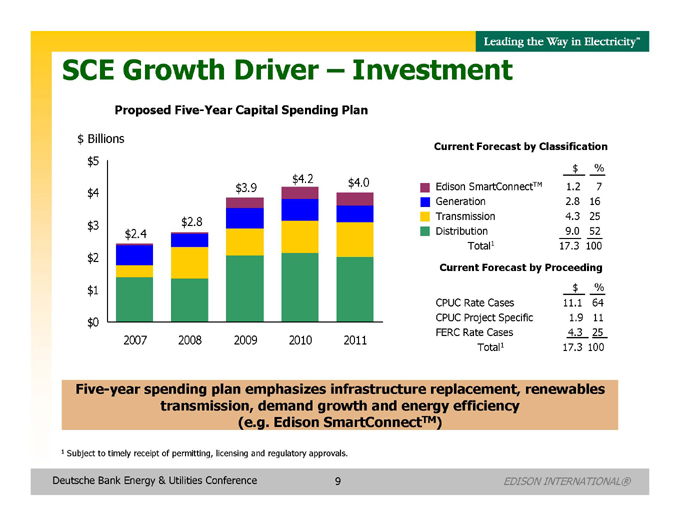
SCE Growth Driver – Investment
Proposed Five-Year Capital Spending Plan
$ Billions $5 $4.2 $4.0
$4$ 3.9
$3 $2.8 $2.4 $2
$1
$0
2007 2008 2009 2010 2011
Current Forecast by Classification
$%
Edison SmartConnectTM 1.2 7
Generation 2.8 16
Transmission 4.3 25
Distribution 9.0 52
Total1 17.3 100
Current Forecast by Proceeding
$%
CPUC Rate Cases 11.1 64
CPUC Project Specific 1.9 11
FERC Rate Cases 4.3 25
Total1 17.3 100
Five-year spending plan emphasizes infrastructure replacement, renewables transmission, demand growth and energy efficiency (e.g. Edison SmartConnectTM)
1 Subject to timely receipt of permitting, licensing and regulatory approvals.
Deutsche Bank Energy & Utilities Conference 9 EDISON INTERNATIONAL®
Leading the Way in Electricity SM
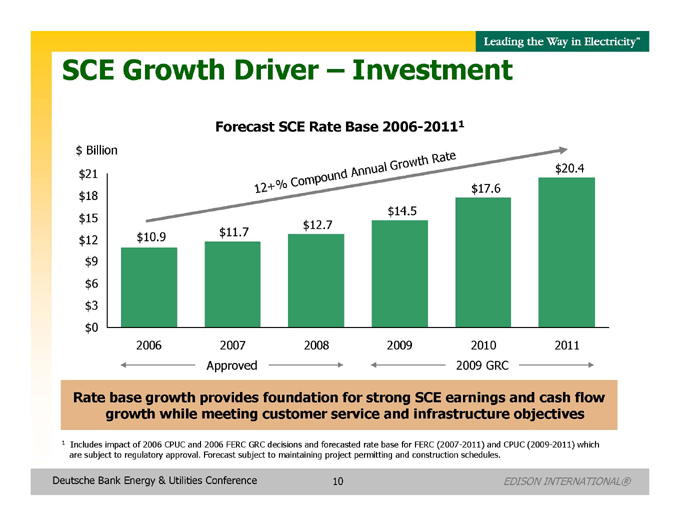
CE Growth Driver – Investment
Forecast SCE Rate Base 2006-20111
$ Billion
th Rate
al Grow $20.4 $21 d Annu
mpoun
+% Co
12$17.6 $18 $14.5 $15 $12.7 $10.9 $11.7 $12 $9 $6 $3 $0
2006 2007 2008 2009 2010 2011
Approved 2009 GRC
Rate base growth provides foundation for strong SCE earnings and cash flow growth while meeting customer service and infrastructure objectives
1 Includes impact of 2006 CPUC and 2006 FERC GRC decisions and forecasted rate base for FERC (2007-2011) and CPUC (2009-2011) which are subject to regulatory approval. Forecast subject to maintaining project permitting and construction schedules.
Deutsche Bank Energy & Utilities Conference 10 EDISON INTERNATIONAL®
Leading the Way in Electricity SM
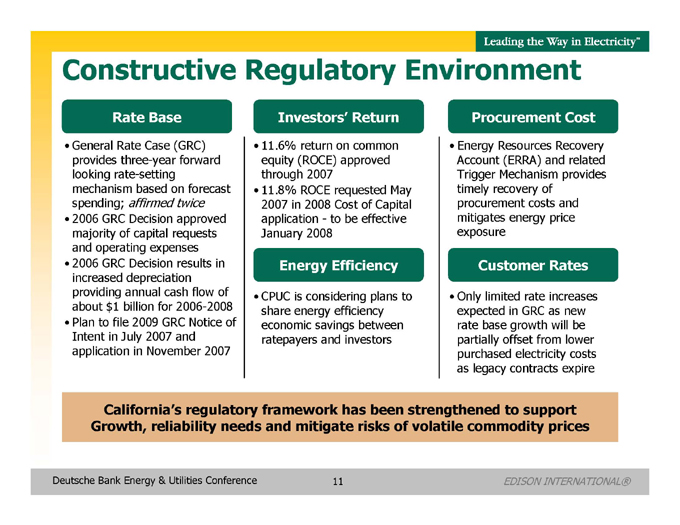
Constructive Regulatory Environment
Rate Base
General Rate Case (GRC) provides three-year forward looking rate-setting mechanism based on forecast
spending; affirmed twice
2006 GRC Decision approved majority of capital requests and operating expenses
2006 GRC Decision results in increased depreciation providing annual cash flow of about $1 billion for 2006-2008
Plan to file 2009 GRC Notice of Intent in July 2007 and application in November 2007
Investors’ Return
11.6% return on common equity (ROCE) approved through 2007
11.8% ROCE requested May 2007 in 2008 Cost of Capital application - to be effective January 2008
Energy Efficiency
CPUC is considering plans to share energy efficiency economic savings between ratepayers and investors
Procurement Cost
Energy Resources Recovery Account (ERRA) and related Trigger Mechanism provides timely recovery of procurement costs and mitigates energy price exposure
Customer Rates
Only limited rate increases expected in GRC as new rate base growth will be partially offset from lower purchased electricity costs as legacy contracts expire
California’s regulatory framework has been strengthened to support Growth, reliability needs and mitigate risks of volatile commodity prices
Deutsche Bank Energy & Utilities Conference 11 EDISON INTERNATIONAL®
Leading the Way in Electricity SM
Edison Mission Group (EMG)
A Competitive Power Generation Company
Deutsche Bank Energy & Utilities Conference 12 EDISON INTERNATIONAL®
Leading the Way in Electricity SM
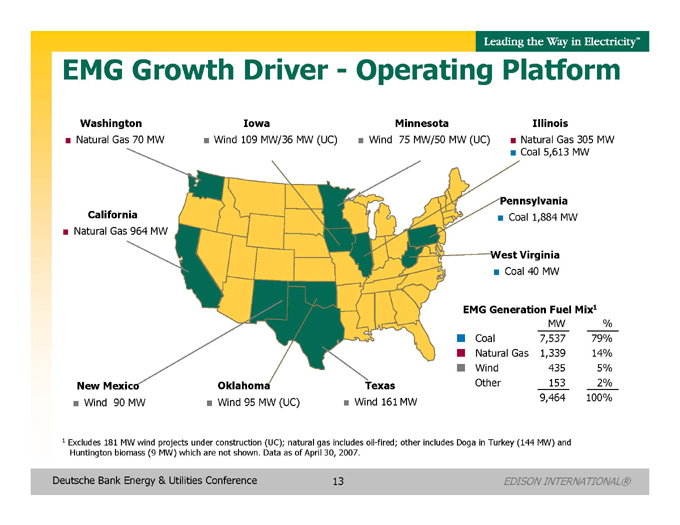
EMG Growth Driver - Operating Platform
Washington Iowa Minnesota Illinois
Natural Gas 70 MW ?Wind 109 MW/36 MW (UC) ?Wind 75 MW/50 MW (UC) ?Natural Gas 305 MW
Coal 5,613 MW
California
Natural Gas 964 MW
New Mexico
Wind 90 MW
Oklahoma
Wind 95 MW (UC)
Texas
Wind 161 MW
Pennsylvania
Coal 1,884 MW
West Virginia
Coal 40 MW
EMG Generation Fuel Mix1
MW%
Coal 7,537 79%
Natural Gas 1,339 14%
Wind 435 5%
Other 153 2%
9,464 100%
1 Excludes 181 MW wind projects under construction (UC); natural gas includes oil-fired; other includes Doga in Turkey (144 MW) and Huntington biomass (9 MW) which are not shown. Data as of April 30, 2007.
Deutsche Bank Energy & Utilities Conference 13 EDISON INTERNATIONAL®
Leading the Way in Electricity SM
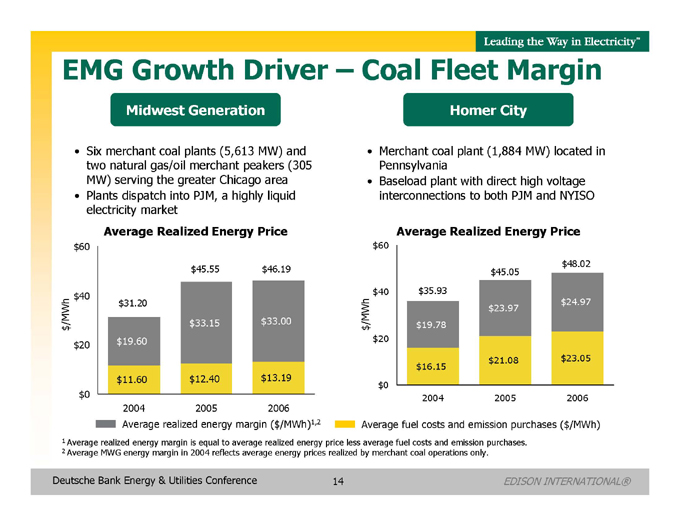
EMG Growth Driver – Coal Fleet Margin
Midwest Generation
Six merchant coal plants (5,613 MW) and two natural gas/oil merchant peakers (305 MW) serving the greater Chicago area
Plants dispatch into PJM, a highly liquid electricity market
Average Realized Energy Price
$60
$45.55 $46.19
$40 $31.20
/MWh $33.15 $33.00 $
$20$ 19.60
$11.60 $12.40 $13.19 $0 2004 2005 2006
Average realized energy margin ($/MWh)1,2
Homer City
Merchant coal plant (1,884 MW) located in Pennsylvania
Baseload plant with direct high voltage interconnections to both PJM and NYISO
Average Realized Energy Price
$60 $48.02 $45.05
$40$ 35.93 $24.97 /MWh $23.97 $ $19.78 $20 $21.08 $23.05 $16.15 $0 2004 2005 2006
Average fuel costs and emission purchases ($/MWh)
1 Average realized energy margin is equal to average realized energy price less average fuel costs and emission purchases.
2 Average MWG energy margin in 2004 reflects average energy prices realized by merchant coal operations only.
Deutsche Bank Energy & Utilities Conference 14 EDISON INTERNATIONAL®
Leading the Way in Electricity SM
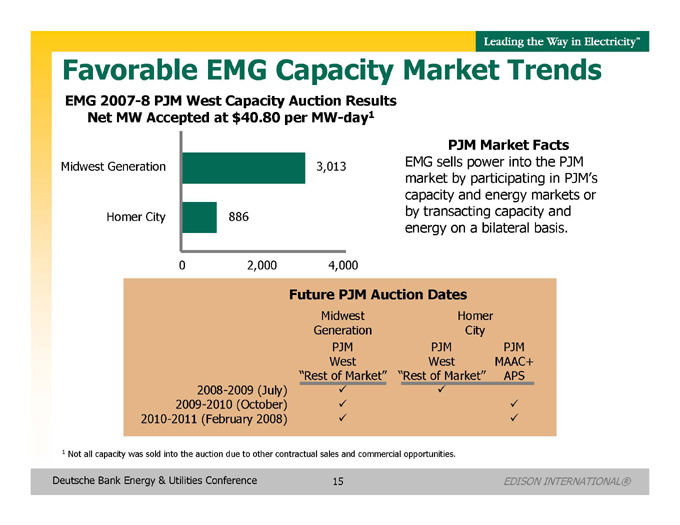
Favorable EMG Capacity Market Trends
EMG 2007-8 PJM West Capacity Auction Results Net MW Accepted at $40.80 per MW-day1
Midwest Generation 3,013
Homer City 886
0 2,000 4,000
PJM Market Facts
EMG sells power into the PJM market by participating in PJM’s capacity and energy markets or by transacting capacity and energy on a bilateral basis.
Future PJM Auction Dates
Midwest Homer
Generation City
PJM PJM PJM
West West MAAC+
“Rest of Market” “Rest of Market” APS
2008-2009 (July)üü
2009-2010 (October)üü
2010-2011 (February 2008)üü
1 Not all capacity was sold into the auction due to other contractual sales and commercial opportunities.
Deutsche Bank Energy & Utilities Conference 15 EDISON INTERNATIONAL®
Leading the Way in Electricity SM
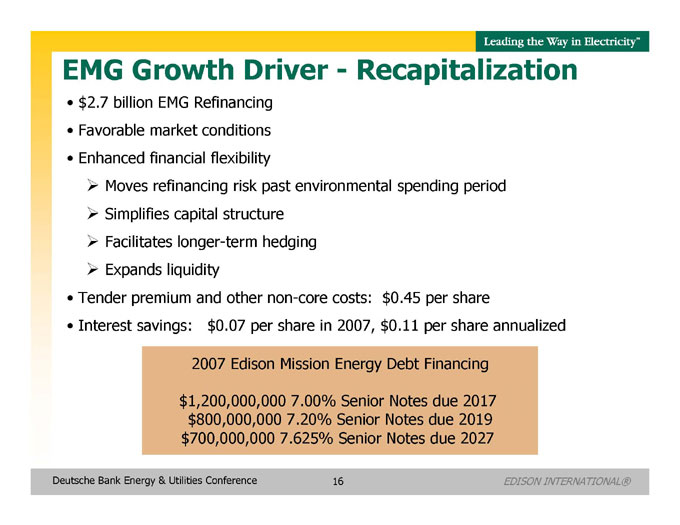
EMG Growth Driver - Recapitalization
$ 2.7 billion EMG Refinancing
Favorable market conditions
Enhanced financial flexibility
Moves refinancing risk past environmental spending period
Simplifies capital structure
Facilitates longer-term hedging
Expands liquidity
Tender premium and other non-core costs: $0.45 per share
Interest savings: $0.07 per share in 2007, $0.11 per share annualized
2007 Edison Mission Energy Debt Financing
$1,200,000,000 7.00% Senior Notes due 2017 $800,000,000 7.20% Senior Notes due 2019 $700,000,000 7.625% Senior Notes due 2027
Deutsche Bank Energy & Utilities Conference 16 EDISON INTERNATIONAL®
Leading the Way in Electricity SM
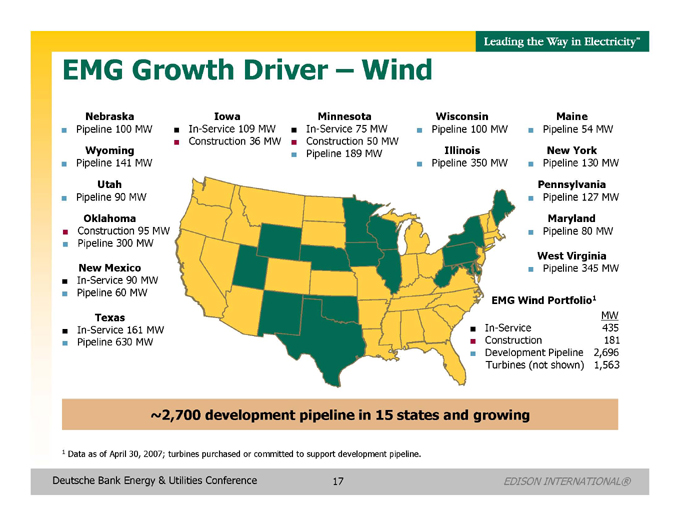
EMG Growth Driver – Wind
Nebraska Pipeline 100 MW
Wyoming Pipeline 141 MW
Utah Pipeline 90 MW
Oklahoma Construction 95 MW
Pipeline 300 MW
New Mexico
In-Service 90 MW
Pipeline 60 MW Texas
In-Service 161 MW
Pipeline 630 MW Iowa
In-Service 109 MW Construction 36 MW
Minnesota
In-Service 75 MW Construction 50 MW Pipeline 189 MW
Wisconsin Pipeline 100 MW
Illinois Pipeline 350 MW
Maine Pipeline 54 MW
New York Pipeline 130 MW
Pennsylvania
Pipeline 127 MW
Maryland
Pipeline 80 MW
West Virginia
Pipeline 345 MW
EMG Wind Portfolio1 MW
In-Service 435
Construction 181
Development Pipeline 2,696
Turbines (not shown) 1,563
~2,700 development pipeline in 15 states and growing
1 Data as of April 30, 2007; turbines purchased or committed to support development pipeline.
Deutsche Bank Energy & Utilities Conference 17 EDISON INTERNATIONAL®
Leading the Way in Electricity SM
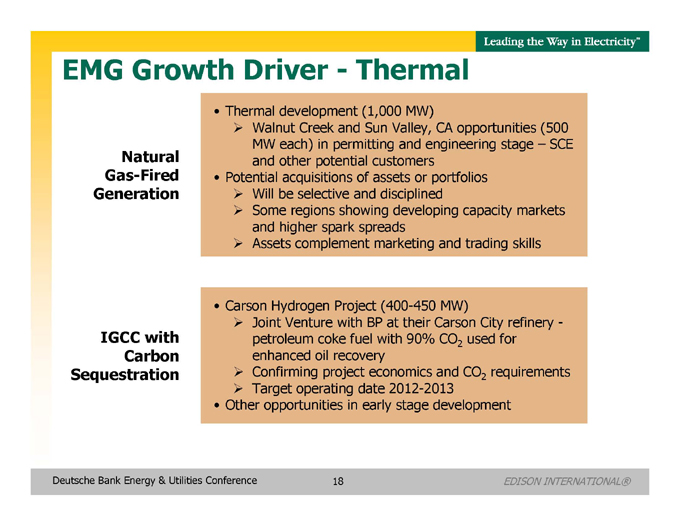
EMG Growth Driver - Thermal
Natural Gas-Fired Generation
Thermal development (1,000 MW)
Walnut Creek and Sun Valley, CA opportunities (500 MW each) in permitting and engineering stage – SCE and other potential customers
Potential acquisitions of assets or portfolios
Will be selective and disciplined
Some regions showing developing capacity markets and higher spark spreads
Assets complement marketing and trading skills
IGCC with Carbon Sequestration
Carson Hydrogen Project (400-450 MW)
Joint Venture with BP at their Carson City refinery -
petroleum coke fuel with 90% CO2 used for
enhanced oil recovery
Confirming project economics and CO2 requirements
Target operating date 2012-2013
Other opportunities in early stage development
Deutsche Bank Energy & Utilities Conference 18 EDISON INTERNATIONAL®
Leading the Way in Electricity SM
Our Shareholder Value Proposition
Attractive business portfolio and growth opportunities
Southern California Edison
Demonstrated need for utility infrastructure investments
Among the best domestic electric utility growth platforms
Edison Mission Group
Favorable market conditions for unregulated generation portfolio
Strong growth pipeline led by wind investments and clean fossil fuel technologies
Commitment to long-term shareholder value creation
Incentive compensation and stock ownership guidelines consistent with shareholder interests
Deutsche Bank Energy & Utilities Conference 19 EDISON INTERNATIONAL®
Leading the Way in Electricity SM
EDISON INTERNATIONAL®
Leading the Way in Electricity SM
Deutsche Bank Energy & Utilities Conference EDISON INTERNATIONAL®
Leading the Way in Electricity SM
Appendix
Deutsche Bank Energy & Utilities Conference 21 EDISON INTERNATIONAL®
Leading the Way in Electricity SM
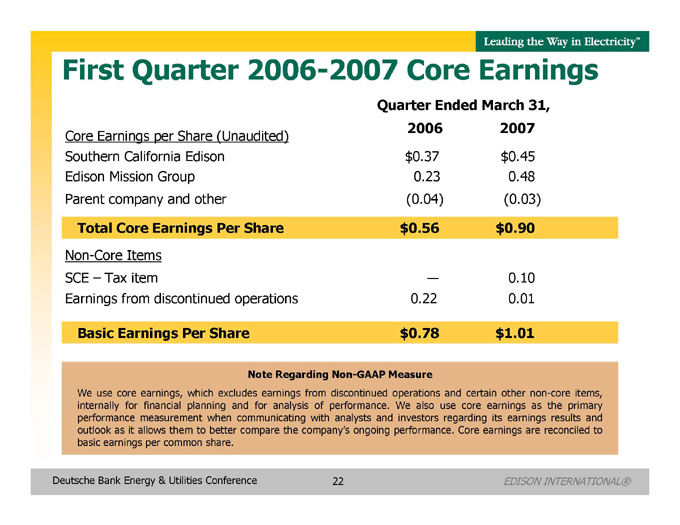
First Quarter 2006-2007 Core Earnings
Quarter Ended March 31,
2006 2007
Core Earnings per Share (Unaudited)
Southern California Edison $ 0.37 $ 0.45
Edison Mission Group 0.23 0.48
Parent company and other(0.04)(0.03)
Total Core Earnings Per Share $ 0.56 $ 0.90
Non-Core Items
SCE – Tax item – 0.10
Earnings from discontinued operations 0.22 0.01
Basic Earnings Per Share $ 0.78 $ 1.01
Note Regarding Non-GAAP Measure
We use core earnings, which excludes earnings from discontinued operations and certain other non-core items, internally for financial planning and for analysis of performance. We also use core earnings as the primary performance measurement when communicating with analysts and investors regarding its earnings results and outlook as it allows them to better compare the company’s ongoing performance. Core earnings are reconciled to basic earnings per common share.
Deutsche Bank Energy & Utilities Conference 22 EDISON INTERNATIONAL®
Leading the Way in Electricity SM
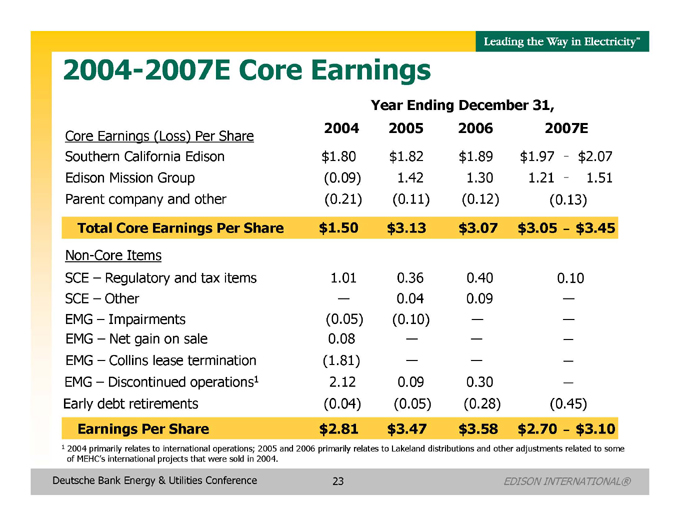
2004-2007E Core Earnings
Year Ending December 31,
2004 2005 2006 2007E
Core Earnings (Loss) Per Share
Southern California Edison $ 1.80 $ 1.82 $ 1.89 $ 1.97 – $ 2.07
Edison Mission Group(0.09) 1.42 1.30 1.21 – 1.51
Parent company and other(0.21)(0.11)(0.12)(0.13)
Total Core Earnings Per Share $ 1.50 $ 3.13 $ 3.07 $ 3.05 – $ 3.45
Non-Core Items
SCE – Regulatory and tax items 1.01 0.36 0.40 0.10
SCE – Other — 0.04 0.09 —
EMG – Impairments(0.05)(0.10) — —
EMG – Net gain on sale 0.08 — — —
EMG – Collins lease termination(1.81)
EMG – Discontinued operations1 2.12 0.09 0.30 —
Early debt retirements(0.04)(0.05)(0.28)(0.45)
Earnings Per Share $ 2.81 $ 3.47 $ 3.58 $ 2.70 – $ 3.10
1 2004 primarily relates to international operations; 2005 and 2006 primarily relates to Lakeland distributions and other adjustments related to some of MEHC’s international projects that were sold in 2004.
Deutsche Bank Energy & Utilities Conference 23 EDISON INTERNATIONAL®