Exhibit 99.1

Business Update
Handout
June 2007
EDISON INTERNATIONAL®
Leading the Way in ElectricitySM
Forward Looking Statements
Statements contained in this presentation about future performance, including, without limitation, earnings, asset and rate base growth, load growth, capital investments, and other statements that are not purely historical, are forward-looking statements. These forward-looking statements reflect our current expectations; however, such statements involve risks and uncertainties. Actual results could differ materially from current expectations. Important factors that could cause different results are discussed under the headings “Risk Factors” and “Management’s Discussion and Analysis” in Edison International’s 2006 Form 10-K and subsequent reports filed with the Securities and Exchange Commission and available on our website: www.edison.com. These forward-looking statements represent our expectations only as of the date of this presentation, and Edison International assumes no duty to update them to reflect new information, events or circumstances.
EDISON INTERNATIONAL®
Leading the Way in ElectricitySM
Edison International – What’s New
Suzlon Wind Energy Corporation has signed a contract with EMG for 300 units of the S88 - 2.1 MW turbine, or 630 MW of wind turbine capacity. The two-phase contract calls for delivery of 315 MW of turbine capacity in 2008 and another 315 MW of capacity in 2009. The turbines will be sited at various locations across the country, which are yet to be announced.
New meter connections for 2007 expected to be 75,626, slightly lower than our May update number of 77,690 as the drop in housing starts which began in mid-2006 is a little deeper than previously forecasted.
SCE expanded its agreement with Calpine to purchase 225 MW of geothermal energy for 10 years and entered into a new agreement for 714 MW of non-renewable capacity for 2008-2011.
Although DPV2 has received CAISO, CPUC, USFWS and Arizona Siting Commission approvals, the Arizona Corporation Commission (ACC) denied approval of the project on May 30, 2007. The company is evaluating its options for the project.
Bid evaluation in process for 2007 solicitation of 10-, 15- and 20-year renewable contracts; intend to finalize by 2Q 2008.
2 EDISON INTERNATIONAL®
Leading the Way in ElectricitySM
Edison International – Key Investment Messages
Strong 1st Quarter Earnings & Favorable Core1 Outlook for 2007 (pg. 5, 31-34)
Consolidated earnings per share increased 29% to $1.01, while core1 earnings increased 61% to $0.90 per share
Expect core1 earnings for the year to be in the upper range of the core1 guidance
EMG Leadership in Wind Development (pg. 27-28)
More than 600 MW of total wind energy in operation or under construction
Pipeline of nearly 2,700 MW under exclusive development agreements
1,563 MW of turbines purchased/optioned
Targeting portfolio of over 2,000 MW by the end of 2009
EMG Successful in PJM RPM Auction (pg. 22)
MWG and Homer City sold approx. 3,900 net MW at the designated price of $40.80 per MW-day
Positive Regulatory Environment Provides a Strong Foundation for Growth at SCE (pg. 7, 11, 13)
CPUC recognizes the need for sustained investment in Southern California’s electricity infrastructure to maintain and strengthen reliability and keep pace with the region’s rapid economic growth
CPUC is considering plans to share energy efficiency savings between ratepayers and investors (pg. 10, 16)
SCE was recognized as a national leader in energy efficiency by the U.S. DOE
SCE’s “smart” digital electricity meter could reduce peak demand by as much as 1,000 MW
1 See appendix for non-GAAP reconciliation.
3
EDISON INTERNATIONAL®
Leading the Way in ElectricitySM
Edison International – 1Q 2007 Financial Highlights
Net income increased 29% to $333 million or $1.01 per share
Core1 earnings grew 61% to $0.90 per share over first quarter 2006
SCE’s core1 earnings were up 22% primarily from the impact associated with last year’s delay in receipt of the 2006 rate case decision
EMG’s core1 earnings more than doubled from improved margins from its generation fleet
Adjusted EBITDA1 for EIX increased to $896 million in Q1 2007 compared to $708 million in Q1 2006, a 27% increase
Based on first quarter performance and current forward wholesale power prices, 2007 core1 earnings are expected to be at the upper end of the $3.05 – $3.45 per share core1 guidance range
Total earnings guidance was updated on May 9, 2007 to $2.70 – $3.10 per share reflecting the net impact of non-core1 refinancing charges at EMG and a tax benefit at SCE
1 See appendix for non-GAAP reconciliation.
4
EDISON INTERNATIONAL®
Leading the Way in ElectricitySM
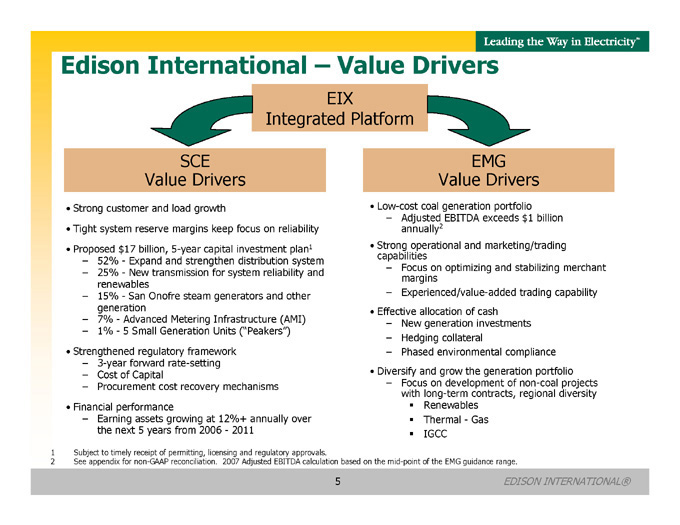
Edison International – Value Drivers
EIX Integrated Platform
SCE Value Drivers
EMG Value Drivers
Strong customer and load growth
Tight system reserve margins keep focus on reliability
Proposed $17 billion, 5-year capital investment plan1
52% - Expand and strengthen distribution system
25% - New transmission for system reliability and renewables
15% - San Onofre steam generators and other generation
7% - Advanced Metering Infrastructure (AMI)
1% - 5 Small Generation Units (“Peakers”)
Strengthened regulatory framework
3-year forward rate-setting
Cost of Capital
Procurement cost recovery mechanisms
Financial performance
Earning assets growing at 12%+ annually over the next 5 years from 2006—2011
Low-cost coal generation portfolio
Adjusted EBITDA exceeds $1 billion annually2
Strong operational and marketing/trading capabilities
Focus on optimizing and stabilizing merchant margins
Experienced/value-added trading capability
Effective allocation of cash
New generation investments
Hedging collateral
Phased environmental compliance
Diversify and grow the generation portfolio
Focus on development of non-coal projects with long-term contracts, regional diversity
Renewables
Thermal - Gas
IGCC
1 Subject to timely receipt of permitting, licensing and regulatory approvals.
2 See appendix for non-GAAP reconciliation. 2007 Adjusted EBITDA calculation based on the mid-point of the EMG guidance range.
5
EDISON INTERNATIONAL®
Leading the Way in ElectricitySM
Southern California Edison (SCE)
An Investor-Owned Electric Utility
EDISON INTERNATIONAL®
Leading the Way in ElectricitySM
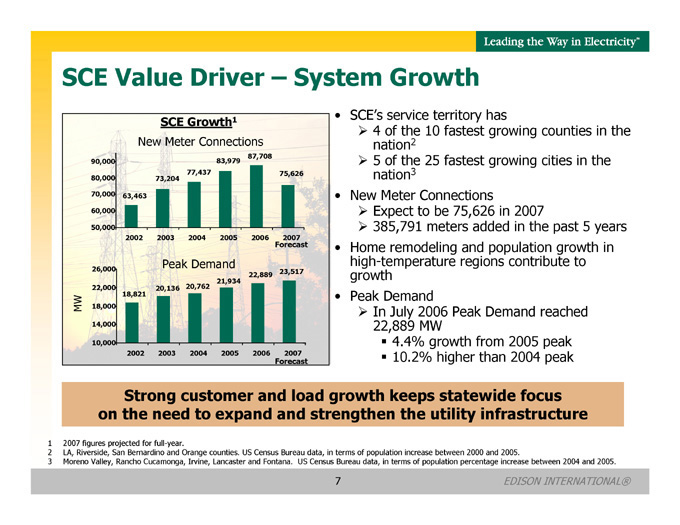
SCE Value Driver – System Growth
SCE Growth1
New Meter Connections
90,000
80,000
70,000
60,000
50,000
63,463
73,204
77,437
83,979
87,708
75,626
2002 2003 2004 2005 2006 2007
Forecast
Peak Demand
26,000
22,000
18,000
14,000
10,000
18,821
20,136
20,762
21,934
22,889
23,517
2002 2003 2004 2005 2006 2007
Forecast
SCE’s service territory has
4 of the 10 fastest growing counties in the nation2
5 of the 25 fastest growing cities in the nation3
New Meter Connections
Expect to be 75,626 in 2007
385,791 meters added in the past 5 years
Home remodeling and population growth in high-temperature regions contribute to growth
Peak Demand
In July 2006 Peak Demand reached 22,889 MW
4.4% growth from 2005 peak
10.2% higher than 2004 peak
Strong customer and load growth keeps statewide focus on the need to expand and strengthen the utility infrastructure
1 2007 figures projected for full-year.
2 LA, Riverside, San Bernardino and Orange counties. US Census Bureau data, in terms of population increase between 2000 and 2005.
3 Moreno Valley, Rancho Cucamonga, Irvine, Lancaster and Fontana. US Census Bureau data, in terms of population percentage increase between 2004 and 2005.
7
EDISON INTERNATIONAL®
Leading the Way in ElectricitySM
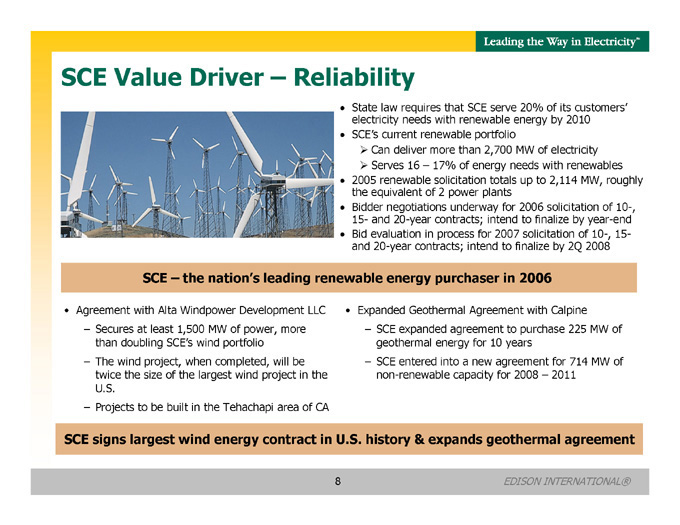
SCE Value Driver – Reliability
State law requires that SCE serve 20% of its customers’ electricity needs with renewable energy by 2010
SCE’s current renewable portfolio
Can deliver more than 2,700 MW of electricity
Serves 16 – 17% of energy needs with renewables
2005 renewable solicitation totals up to 2,114 MW, roughly the equivalent of 2 power plants
Bidder negotiations underway for 2006 solicitation of 10-, 15- and 20-year contracts; intend to finalize by year-end
Bid evaluation in process for 2007 solicitation of 10-, 15- and 20-year contracts; intend to finalize by 2Q 2008
SCE – the nation’s leading renewable energy purchaser in 2006
Agreement with Alta Windpower Development LLC
Secures at least 1,500 MW of power, more than doubling SCE’s wind portfolio
The wind project, when completed, will be twice the size of the largest wind project in the U.S.
Projects to be built in the Tehachapi area of CA
Expanded Geothermal Agreement with Calpine
SCE expanded agreement to purchase 225 MW of geothermal energy for 10 years
SCE entered into a new agreement for 714 MW of non-renewable capacity for 2008 – 2011
SCE signs largest wind energy contract in U.S. history & expands geothermal agreement
8
EDISON INTERNATIONAL®
Leading the Way in ElectricitySM
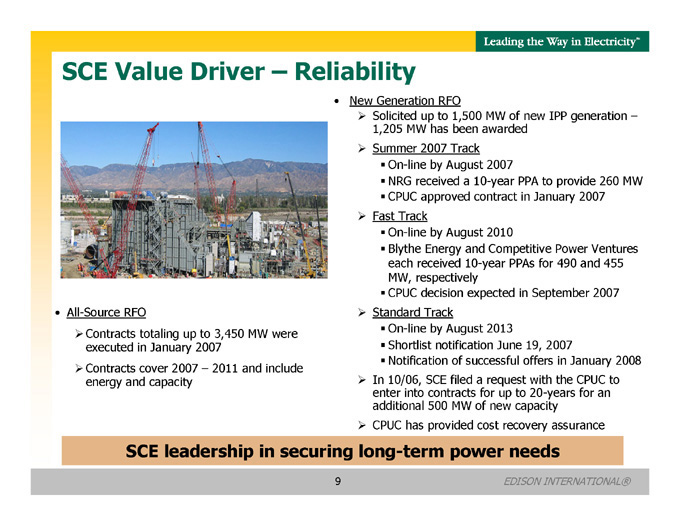
SCE Value Driver – Reliability
All-Source RFO
Contracts totaling up to 3,450 MW were executed in January 2007
Contracts cover 2007 – 2011 and include energy and capacity
New Generation RFO
Solicited up to 1,500 MW of new IPP generation –1,205 MW has been awarded
Summer 2007 Track On-line by August 2007
NRG received a 10-year PPA to provide 260 MW CPUC approved contract in January 2007
Fast Track
On-line by August 2010
Blythe Energy and Competitive Power Ventures each received 10-year PPAs for 490 and 455 MW, respectively
CPUC decision expected in September 2007
Standard Track
On-line by August 2013
Shortlist notification June 19, 2007
Notification of successful offers in January 2008
In 10/06, SCE filed a request with the CPUC to enter into contracts for up to 20-years for an additional 500 MW of new capacity
CPUC has provided cost recovery assurance
SCE leadership in securing long-term power needs
9
EDISON INTERNATIONAL®
Leading the Way in ElectricitySM
SCE Value Driver – Reliability
SCE is committed to creating, transmitting and improving end-use efficiency of electricity in an environmentally responsible manner
During the past 5 years, SCE has –
Saved more than 4 billion kWh – enough energy to power 500,000 homes for an entire year
Reduced greenhouse gas emissions by more than 2 million tons – the equivalent of removing 250,000 cars from the road
During the next 2 years, SCE will –
Help customers save an additional 2 billion kWh, reducing greenhouse gas emissions by another 1 million tons
SCE offers a wide array of energy efficiency and demand response programs which offer financial incentives and/or other benefits for saving energy and shifting usage from on-peak periods
Time-of-Use (TOU) rates, load management programs and energy management systems (EMS) are some of the many programs offered
Regulatory mechanisms mitigate the revenue impact of changes in electricity sales
Recognized as a leader in energy efficiency by U.S. EPA & DOE
10
EDISON INTERNATIONAL®
Leading the Way in ElectricitySM
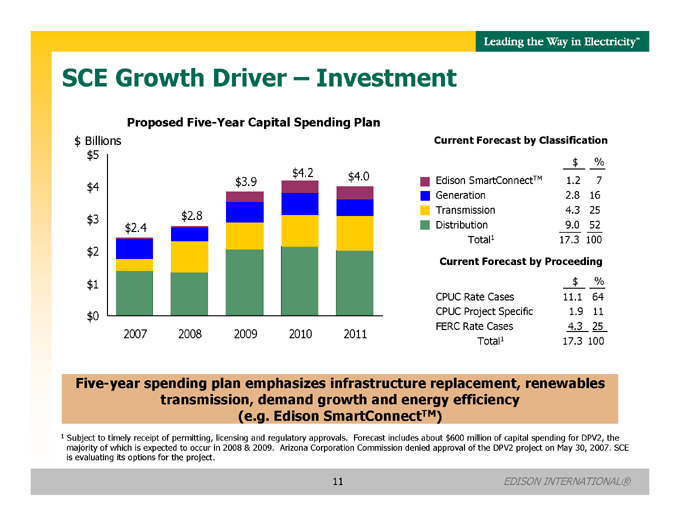
SCE Growth Driver – Investment
Proposed Five-Year Capital Spending Plan
$ Billions $5
$4
$3
$2
$1
$0
$2.4 $2.8 $ 3.9 $4.2 $4.0
2007 2008 2009 2010 2011
Current Forecast by Classification
$
%
Edison SmartConnectTM
1.2
7
Generation
2.8
16
Transmission
4.3
25
Distribution
9.0
52
Total1
17.3
100
Current Forecast by Proceeding
$
%
CPUC Rate Cases
11.1
64
CPUC Project Specific
1.9
11
FERC Rate Cases
4.3
25
Total1
17.3
100
Five-year spending plan emphasizes infrastructure replacement, renewables transmission, demand growth and energy efficiency (e.g. Edison SmartConnectTM)
1 Subject to timely receipt of permitting, licensing and regulatory approvals. Forecast includes about $600 million of capital spending for DPV2, the majority of which is expected to occur in 2008 & 2009. Arizona Corporation Commission denied approval of the DPV2 project on May 30, 2007. SCE is evaluating its options for the project.
11
EDISON INTERNATIONAL®
Leading the Way in ElectricitySM
SCE Growth Driver – Investment
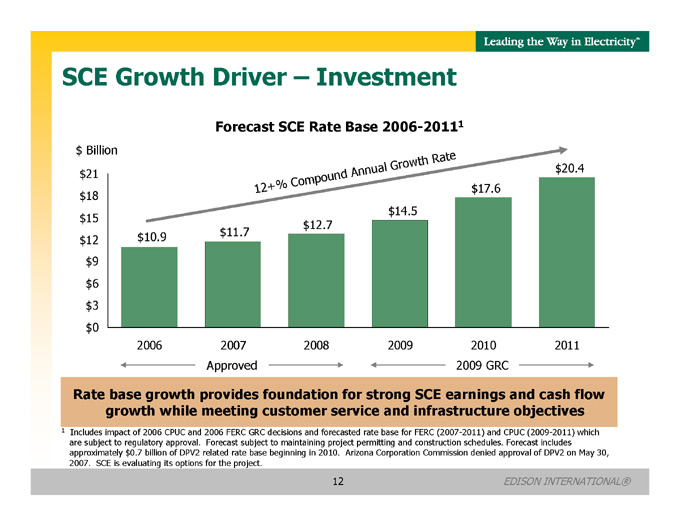
Forecast SCE Rate Base 2006-20111
12 + % Compound Annual Growth Rate
$ Billion
$17.6 $18 $14.5 $15 $12.7 $10.9 $11.7 $12 $9 $6 $3 $0 $20.4 $21
2006 2007 2008 2009 2010 2011
Approved 2009 GRC
Rate base growth provides foundation for strong SCE earnings and cash flow growth while meeting customer service and infrastructure objectives
1 Includes impact of 2006 CPUC and 2006 FERC GRC decisions and forecasted rate base for FERC (2007-2011) and CPUC (2009-2011) which are subject to regulatory approval. Forecast subject to maintaining project permitting and construction schedules. Forecast includes approximately $0.7 billion of DPV2 related rate base beginning in 2010. Arizona Corporation Commission denied approval of DPV2 on May 30, 2007. SCE is evaluating its options for the project.
12
EDISON INTERNATIONAL®
Leading the Way in ElectricitySM
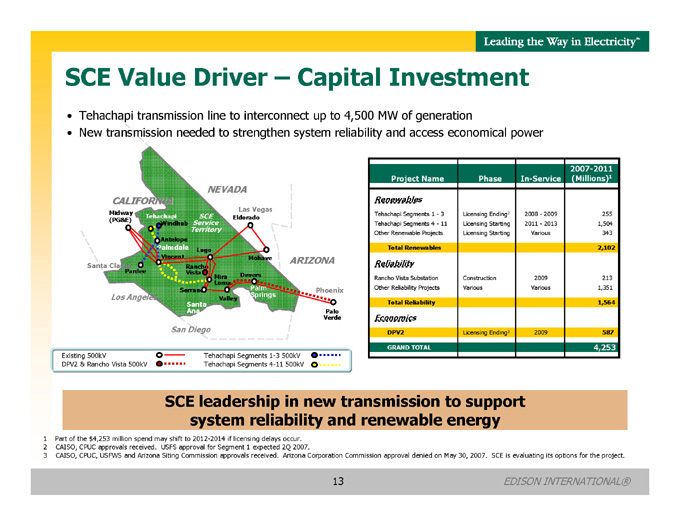
SCE Value Driver – Capital Investment
Tehachapi transmission line to interconnect up to 4,500 MW of generation
New transmission needed to strengthen system reliability and access economical power
NEVADA
CALIFORNIA
Midway (PG&E)
Santa Clarita
Pardee
Los Angeles
Tehachapi Windhub
Antelope
Palmdale
Vincent
Rancho Vista
Serrano
Santa Ana
SCE Service Territory
Lugo
Las Vegas
Eldorado
Mira Loma
Valley
Mohave
Devers
Palm Springs
ARIZONA
Phoenix
Palo Verde
San Diego
Existing 500kV
DPV2 & Rancho Vista 500kV
Tehachapi Segments 1-3 500kV Tehachapi Segments 4-11 500kV
| | | | | | |
Project Name | | Phase | | In-Service | | 2007-
2011
(Millions)1 |
Renewables | | | | | | |
Tehachapi Segments 1- 3 | | Licensing Ending2 | | 2008 -
2009 | | 255 |
Tehachapi Segments 4 - 11 | | Licensing Starting | | 2011 -
2013 | | 1,504 |
Other Renewable Projects | | Licensing Starting | | Various | | 343 |
Total Renewables | | | | | | 2,102 |
Reliability | | | | | | |
Rancho Vista Substation | | Construction | | 2009 | | 213 |
Other Reliability Projects | | Various | | Various | | 1,351 |
Total Reliability | | | | | | 1,564 |
Economics | | | | | | |
DPV2 | | Licensing
Ending3 | | 2009 | | 587 |
GRAND TOTAL | | | | | | 4,253 |
SCE leadership in new transmission to support system reliability and renewable energy
1 Part of the $4,253 million spend may shift to 2012-2014 if licensing delays occur.
2 CAISO, CPUC approvals received. USFS approval for Segment 1 expected 2Q 2007.
3 CAISO, CPUC, USFWS and Arizona Siting Commission approvals received. Arizona Corporation Commission approval denied on May 30, 2007. SCE is evaluating its options for the project.
13 EDISON INTERNATIONAL®
Leading the Way in ElectricitySM
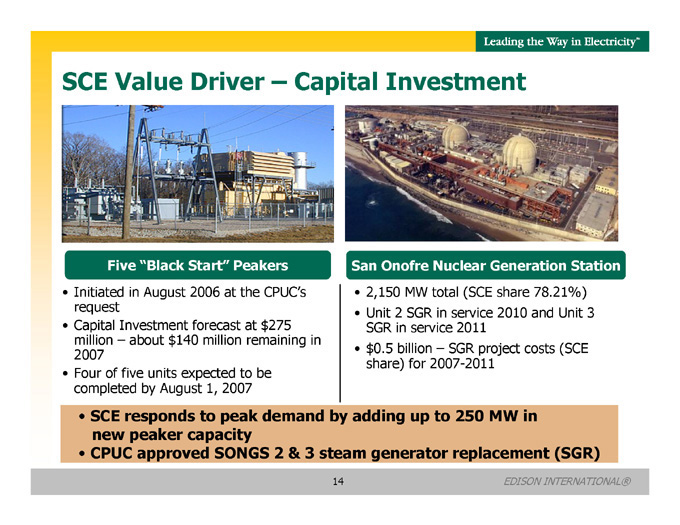
SCE Value Driver – Capital Investment
Five “Black Start” Peakers
Initiated in August 2006 at the CPUC’s request
Capital Investment forecast at $275 million – about $140 million remaining in 2007
Four of five units expected to be completed by August 1, 2007
San Onofre Nuclear Generation Station
2,150 MW total (SCE share 78.21%)
Unit 2 SGR in service 2010 and Unit 3 SGR in service 2011
$ 0.5 billion – SGR project costs (SCE share) for 2007-2011
SCE responds to peak demand by adding up to 250 MW in new peaker capacity
CPUC approved SONGS 2 & 3 steam generator replacement (SGR)
14 EDISON INTERNATIONAL®
Leading the Way in ElectricitySM
SCE Value Driver – Capital Investment
2005 2006 2007 2008 2009 2010 2011 2012 2013
Revised Schedule1
Design Phase
Pre-Deployment Phase
Deployment Phase
AMI Initiative Ahead of Schedule
Pre-Deployment, which began in January 2007, includes Field Testing with 5,000 homes and small businesses. Field testing is planned for this summer, subject to CPUC approval
Full deployment, planned for 2008 – 2012 for about 5 million residential and small commercial customers, is one year ahead of the initial schedule
Capital investment preliminarily estimated at approximately $1.2 billion through deployment
Edison SmartConnectTM, SCE’s AMI Program, has the potential to reduce peak power consumption among its customers by as much as 1,000 MW
AMI RFP – Vendor Candidates
Received bids from meter manufacturers and communications infrastructure vendors; intend to select vendor(s) by year-end
SCE’s advanced generation meter will provide enhanced capabilities, such as measuring energy usage by the hour vs. the month
– Meter Candidates:
Itron, Landis + Gyr, Sensus
Communications Infrastructure is critical to providing a link to other household devices such as personal computers, smart thermostats and appliances of the future
– Communications Infrastructure Candidates: Cellnet, Itron, Sensus
SCE leadership in advanced metering infrastructure (AMI) initiative
1 Subject to CPUC Approval.
15 EDISON INTERNATIONAL®
Leading the Way in ElectricitySM
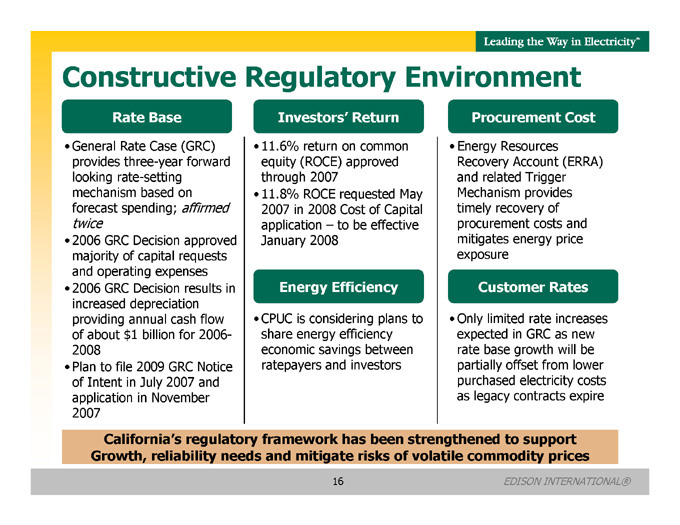
Constructive Regulatory Environment
Rate Base
General Rate Case (GRC) provides three-year forward looking rate-setting mechanism based on forecast spending; affirmed
twice
2006 GRC Decision approved majority of capital requests and operating expenses
2006 GRC Decision results in increased depreciation providing annual cash flow of about $1 billion for 2006-2008
Plan to file 2009 GRC Notice of Intent in July 2007 and application in November 2007
Investors’ Return
11.6% return on common equity (ROCE) approved through 2007
11.8% ROCE requested May 2007 in 2008 Cost of Capital application – to be effective January 2008
Energy Efficiency
CPUC is considering plans to share energy efficiency economic savings between ratepayers and investors
Procurement Cost
Energy Resources Recovery Account (ERRA) and related Trigger Mechanism provides timely recovery of procurement costs and mitigates energy price exposure
Customer Rates
Only limited rate increases expected in GRC as new rate base growth will be partially offset from lower purchased electricity costs as legacy contracts expire
California’s regulatory framework has been strengthened to support Growth, reliability needs and mitigate risks of volatile commodity prices
16 EDISON INTERNATIONAL®
Leading the Way in ElectricitySM
Edison Mission Group (EMG)
A Competitive Power Generation Company
17 EDISON INTERNATIONAL®
Leading the Way in ElectricitySM
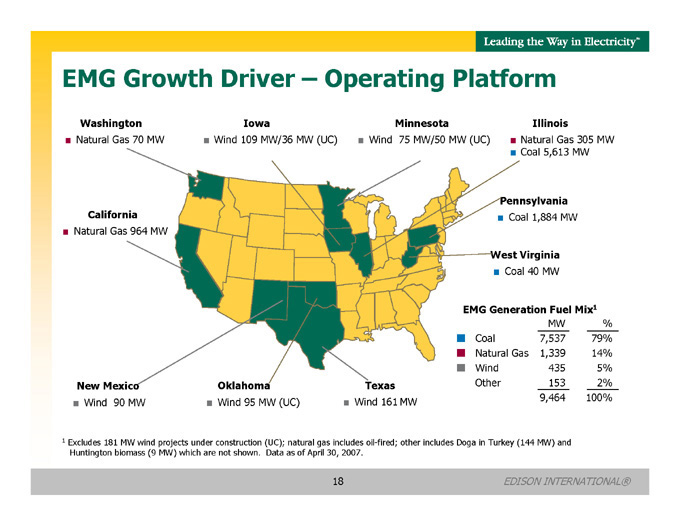
EMG Growth Driver – Operating Platform
Washington
Natural Gas 70 MW
Iowa
Wind 109 MW/36 MW (UC)
Minnesota
Wind 75 MW/50 MW (UC)
Illinois
Natural Gas 305 MW Coal 5,613 MW
California
Natural Gas 964 MW
Pennsylvania
Coal 1,884 MW
West Virginia
Coal 40 MW
EMG Generation Fuel Mix1
| | | | |
| | | MW | | % |
Coal | | 7,537 | | 79% |
Natural Gas | | 1,339 | | 14% |
Wind | | 435 | | 5% |
Other | | 153 | | 2% |
| | | 9,464 | | 100% |
New Mexico
Wind 90 MW
Oklahoma
Wind 95 MW (UC)
Texas
Wind 161 MW
1 Excludes 181 MW wind projects under construction (UC); natural gas includes oil-fired; other includes Doga in Turkey (144 MW) and Huntington biomass (9 MW) which are not shown. Data as of April 30, 2007.
18 EDISON INTERNATIONAL®
Leading the Way in ElectricitySM
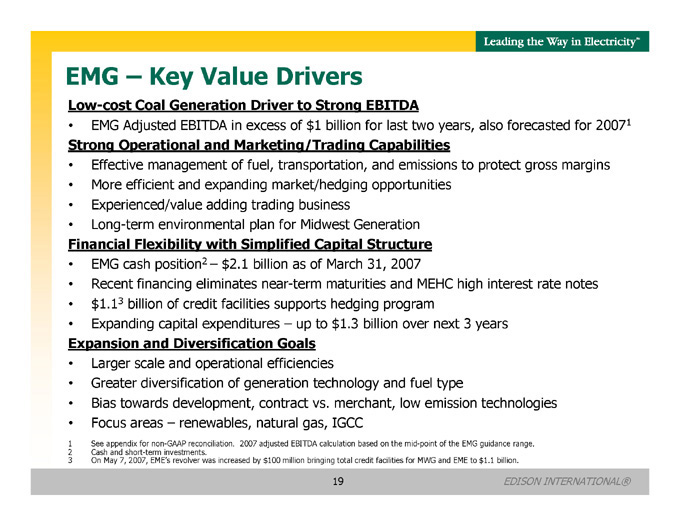
EMG – Key Value Drivers
Low-cost Coal Generation Driver to Strong EBITDA
EMG Adjusted EBITDA in excess of $1 billion for last two years, also forecasted for 20071
Strong Operational and Marketing/Trading Capabilities
Effective management of fuel, transportation, and emissions to protect gross margins
More efficient and expanding market/hedging opportunities
Experienced/value adding trading business
Long-term environmental plan for Midwest Generation
Financial Flexibility with Simplified Capital Structure
EMG cash position2 – $2.1 billion as of March 31, 2007
Recent financing eliminates near-term maturities and MEHC high interest rate notes
$ 1.13 billion of credit facilities supports hedging program
Expanding capital expenditures – up to $1.3 billion over next 3 years
Expansion and Diversification Goals
Larger scale and operational efficiencies
Greater diversification of generation technology and fuel type
Bias towards development, contract vs. merchant, low emission technologies
Focus areas – renewables, natural gas, IGCC
1 See appendix for non-GAAP reconciliation. 2007 adjusted EBITDA calculation based on the mid-point of the EMG guidance range.
2 Cash and short-term investments.
3 On May 7, 2007, EME’s revolver was increased by $100 million bringing total credit facilities for MWG and EME to $1.1 billion.
19 EDISON INTERNATIONAL®
Leading the Way in ElectricitySM
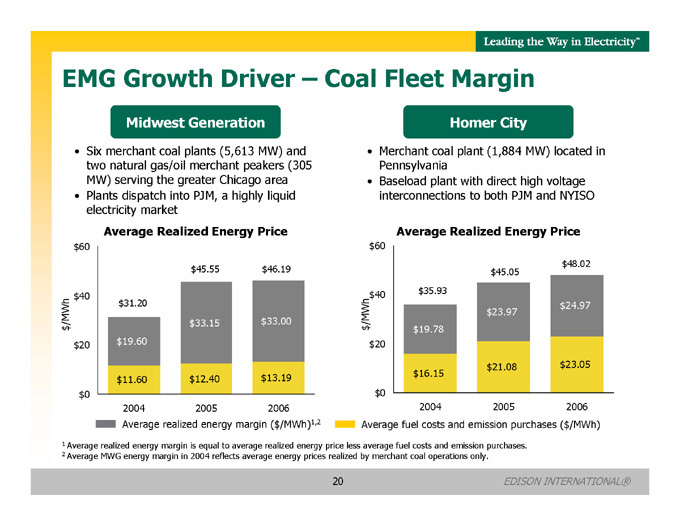
EMG Growth Driver – Coal Fleet Margin
Midwest Generation
• Six merchant coal plants (5,613 MW) and two natural gas/oil merchant peakers (305 MW) serving the greater Chicago area
• Plants dispatch into PJM, a highly liquid electricity market
Homer City
• Merchant coal plant (1,884 MW) located in Pennsylvania
• Baseload plant with direct high voltage interconnections to both PJM and NYISO
Average Realized Energy Price
$60
$40
$20
$0
$/MWh
2004 2005 2006
$31.20 $19.60 $11.60
$45.55 $33.15 $12.40
$46.19 $33.00 $13.19
Average realized energy margin ($/MWh)1,2
Average Realized Energy Price
$60 $40 $20 $0
$/MWh
2004 2005 2006
$35.93
$19.78
$16.15
$45.05
$23.97
$21.08
$48.02
$24.97
$23.05
Average fuel costs and emission purchases ($/MWh)
1 Average realized energy margin is equal to average realized energy price less average fuel costs and emission purchases.
2 Average MWG energy margin in 2004 reflects average energy prices realized by merchant coal operations only.
20 EDISON INTERNATIONAL®
Leading the Way in ElectricitySM
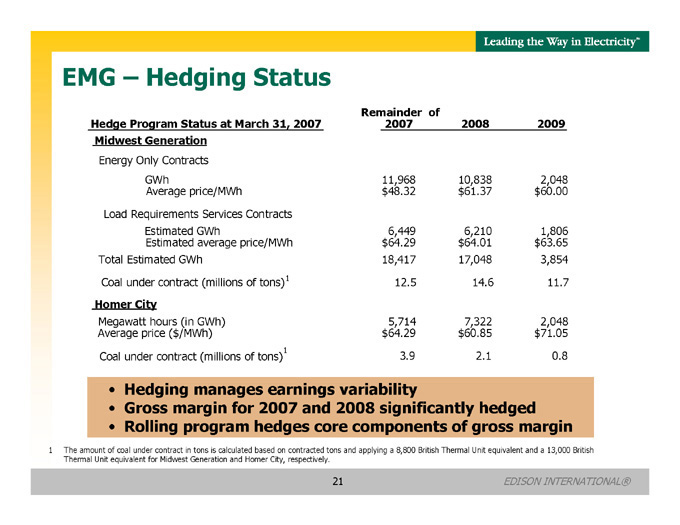
EMG – Hedging Status
| | | | | | |
Hedge Program Status at March 31, 2007 Midwest Generation | | Remainder
of 2007 | | 2008 | | 2009 |
Energy Only Contracts | | | | | | |
GWh | | 11,968 | | 10,838 | | 2,048 |
Average price/MWh | | $48.32 | | $61.37 | | $60.00 |
Load Requirements Services Contracts | | | | | | |
Estimated GWh | | 6,449 | | 6,210 | | 1,806 |
Estimated average price/MWh | | $64.29 | | $64.01 | | $63.65 |
Total Estimated GWh | | 18,417 | | 17,048 | | 3,854 |
Coal under contract (millions of tons)1 | | 12.5 | | 14.6 | | 11.7 |
Homer City | | | | | | |
Megawatt hours (in GWh) | | 5,714 | | 7,322 | | 2,048 |
Average price ($/MWh) | | $64.29 | | $60.85 | | $71.05 |
Coal under contract (millions of tons)1 | | 3.9 | | 2.1 | | 0.8 |
• Hedging manages earnings variability
• Gross margin for 2007 and 2008 significantly hedged
• Rolling program hedges core components of gross margin
1 The amount of coal under contract in tons is calculated based on contracted tons and applying a 8,800 British Thermal Unit equivalent and a 13,000 British Thermal Unit equivalent for Midwest Generation and Homer City, respectively.
21 EDISON INTERNATIONAL®
Leading the Way in ElectricitySM
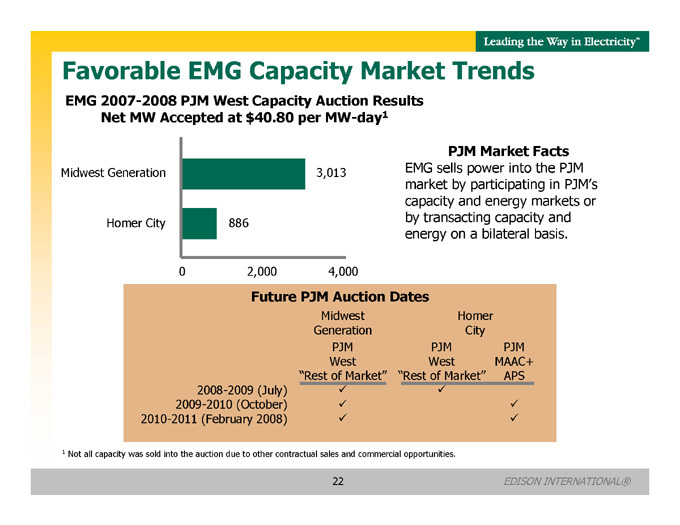
Favorable EMG Capacity Market Trends
EMG 2007-2008 PJM West Capacity Auction Results Net MW Accepted at $40.80 per MW-day1
Midwest Generation
Homer City
0 2,000 4,000
3,013
886
PJM Market Facts
EMG sells power into the PJM market by participating in PJM’s capacity and energy markets or by transacting capacity and energy on a bilateral basis.
Future PJM Auction Dates
| | | | | | |
| | | | | Homer
City
APS | | |
| | | Midwest
Generation
PJM West
“Rest of
Market” | | PJM
West
“Rest of
Market” | | PJM
MAAC+ |
2008-2009 (July) | | 3 | | 3 | | |
2009-2010 (October) | | 3 | | | | 3 |
2010-2011 (February 2008) | | 3 | | | | 3 |
1 Not all capacity was sold into the auction due to other contractual sales and commercial opportunities.
22 EDISON INTERNATIONAL®
Leading the Way in ElectricitySM
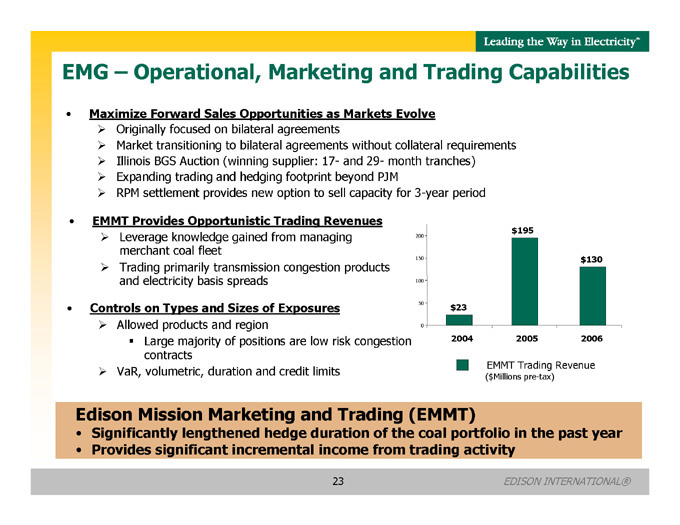
EMG – Operational, Marketing and Trading Capabilities
Maximize Forward Sales Opportunities as Markets Evolve
Originally focused on bilateral agreements
Market transitioning to bilateral agreements without collateral requirements
Illinois BGS Auction (winning supplier: 17- and 29- month tranches)
Expanding trading and hedging footprint beyond PJM
RPM settlement provides new option to sell capacity for 3-year period
EMMT Provides Opportunistic Trading Revenues
Leverage knowledge gained from managing merchant coal fleet
Trading primarily transmission congestion products and electricity basis spreads
Controls on Types and Sizes of Exposures
Allowed products and region
Large majority of positions are low risk congestion contracts
VaR, volumetric, duration and credit limits
Edison Mission Marketing and Trading (EMMT)
Significantly lengthened hedge duration of the coal portfolio in the past year
Provides significant incremental income from trading activity
200 150 100 50 0
$23
$195
$130
2004 2005 2006
EMMT Trading Revenue
($ Millions pre-tax)
23 EDISON INTERNATIONAL®
Leading the Way in ElectricitySM
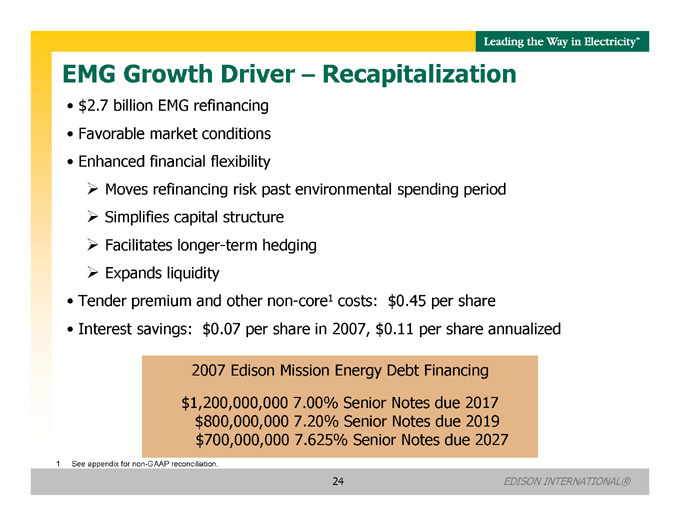
EMG Growth Driver – Recapitalization
$ 2.7 billion EMG refinancing
Favorable market conditions
Enhanced financial flexibility
Moves refinancing risk past environmental spending period
Simplifies capital structure
Facilitates longer-term hedging
Expands liquidity
Tender premium and other non-core1 costs: $0.45 per share
Interest savings: $0.07 per share in 2007, $0.11 per share annualized
2007 Edison Mission Energy Debt Financing $1,200,000,000 7.00% Senior Notes due 2017 $800,000,000 7.20% Senior Notes due 2019 $700,000,000 7.625% Senior Notes due 2027
1 See appendix for non-GAAP reconciliation.
24
EDISON INTERNATIONAL®
Leading the Way in ElectricitySM
EMG – Midwest Gen Environmental Agreement
Comprehensive agreement addresses mercury, NOx, and SO2 emissions
Achieves specified emission reductions through retrofits or unit shutdowns
Mercury – 90% removal by 2015
NOx – emissions of 0.11 lbs. per million Btus by 2011 (66% reduction)
SO2 – emissions of 0.11 lbs. per million Btus by 2019, with interim step downs (78% reduction)
Helps continue good relationships with key constituents and regulators and supports growth
Agreement supported by Gov. Blagojevich, City of Chicago, and several influential environmental and community groups
Illinois EPA assistance with IGCC and wind development, permit approvals
Emission credit selling allowed
Agreement filed under Illinois State Implementation Plan of CAIR
Provides reasonable certainty of amount & timing of emission reductions through 2018
25
EDISON INTERNATIONAL®
Leading the Way in ElectricitySM
EMG – Environmental Compliance
MWG Compliance Plan
Phase 1 – Reduction of Mercury Emissions
Installation of Activated Carbon Injection (ACI) technology by July 2009
Estimated cost approx. $60 million
Phase 2 – Reduction of NOx Emissions
Installation of primarily Selective Catalytic Reduction (SCR) systems by the end of 2011
Estimated cost approx. $450 million
Phase 3 – Reduction of SO2 Emissions
Flue Gas Desulfurization (FGD) technology
Estimated cost approx. $2.2 – $2.9 billion
Shutdown of Small Units
Waukegan 6 (100 MW) – by end of 2007
Will County 1 & 2 (310 MW) – by end of 2010
Homer City Compliance Plan
PA State Implementation Plan for CAMR and CAIR adopted
Homer City will comply with 2010 phase of mercury requirements by installing ACI on Units 1 & 2
Evaluating compliance approaches for 2015 phase
EMG environmental compliance plan allows assessment of market conditions before incurring capital expenditures
Note: Cost estimates are in 2006 dollars.
26
EDISON INTERNATIONAL®
Leading the Way in ElectricitySM
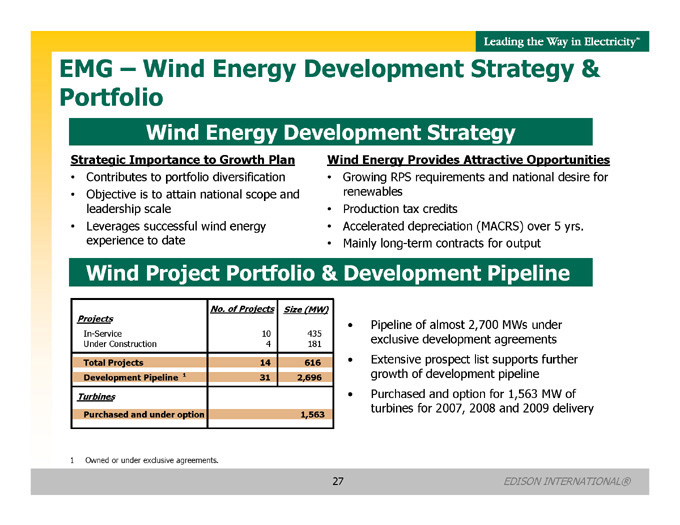
EMG – Wind Energy Development Strategy & Portfolio
Wind Energy Development Strategy
Strategic Importance to Growth Plan
Contributes to portfolio diversification
Objective is to attain national scope and leadership scale
Leverages successful wind energy experience to date
Wind Energy Provides Attractive Opportunities
Growing RPS requirements and national desire for renewables
Production tax credits
Accelerated depreciation (MACRS) over 5 yrs.
Mainly long-term contracts for output
Wind Project Portfolio & Development Pipeline
| | | | |
| | | No. of
Projects | | Size
(MW) |
Projects | | | | |
In-Service | | 10 | | 435 |
Under Construction | | 4 | | 181 |
Total Projects | | 14 | | 616 |
Development Pipeline 1 | | 31 | | 2,696 |
Turbines | | | | |
Purchased and under option | | | | 1,563 |
Pipeline of almost 2,700 MWs under exclusive development agreements Extensive prospect list supports further growth of development pipeline Purchased and option for 1,563 MW of turbines for 2007, 2008 and 2009 delivery
1 Owned or under exclusive agreements.
27 EDISON INTERNATIONAL®
Leading the Way in ElectricitySM
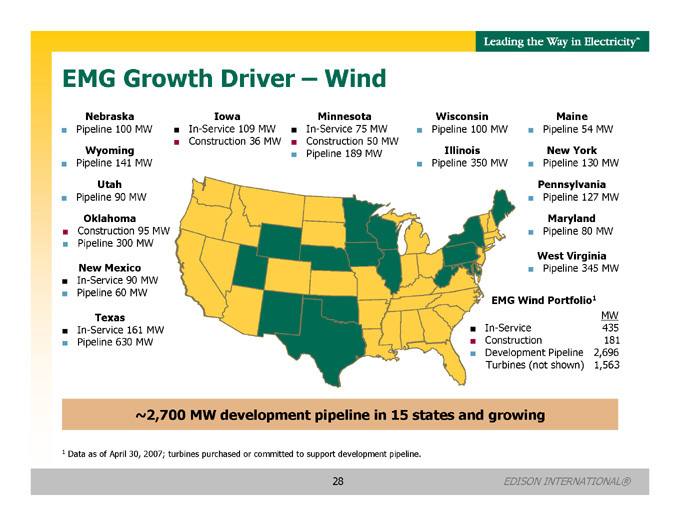
EMG Growth Driver – Wind
Nebraska
Pipeline 100 MW
Wyoming
Pipeline 141 MW
Utah
Pipeline 90 MW
Oklahoma
Construction 95 MW
Pipeline 300 MW
New Mexico
In-Service 90 MW
Pipeline 60 MW
Texas
In-Service 161 MW
Pipeline 630 MW
Iowa
In-Service 109 MW Construction 36 MW
Minnesota
In-Service 75 MW Construction 50 MW Pipeline 189 MW
Wisconsin
Pipeline 100 MW
Illinois
Pipeline 350 MW
Maine
Pipeline 54 MW
New York
Pipeline 130 MW
Pennsylvania
Pipeline 127 MW
Maryland
Pipeline 80 MW
West Virginia
Pipeline 345 MW
EMG Wind Portfolio1
| | |
| | | MW |
In-Service | | 435 |
Construction | | 181 |
Development Pipeline | | 2,696 |
Turbines (not shown) | | 1,563 |
~2,700 MW development pipeline in 15 states and growing
1 Data as of April 30, 2007; turbines purchased or committed to support development pipeline.
28 EDISON INTERNATIONAL®
Leading the Way in ElectricitySM
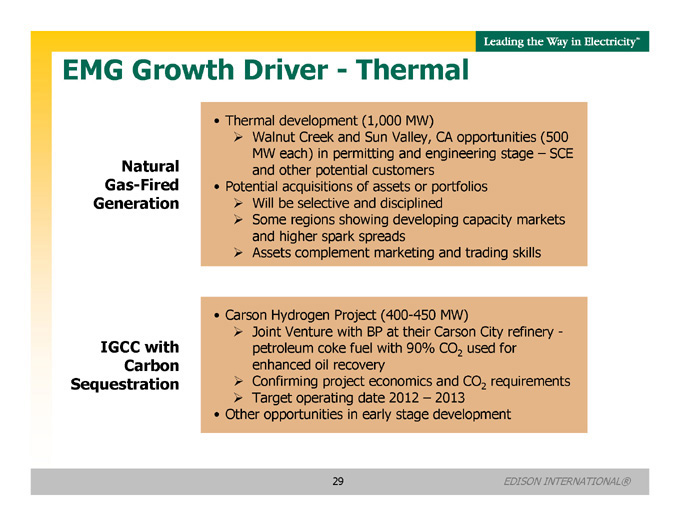
EMG Growth Driver - Thermal
Natural Gas-Fired Generation
Thermal development (1,000 MW)
Walnut Creek and Sun Valley, CA opportunities (500 MW each) in permitting and engineering stage – SCE and other potential customers Potential acquisitions of assets or portfolios
Will be selective and disciplined
Some regions showing developing capacity markets and higher spark spreads
Assets complement marketing and trading skills
IGCC with Carbon Sequestration
Carson Hydrogen Project (400-450 MW)
Joint Venture with BP at their Carson City refinery - petroleum coke fuel with 90% CO2 used for enhanced oil recovery
Confirming project economics and CO2 requirements
Target operating date 2012 – 2013
Other opportunities in early stage development
29 EDISON INTERNATIONAL®

Leading the Way in ElectricitySM
Year to Date Performance Through March 31, 2007 And Annual Performance Through December 31, 2005 & 2006
30 EDISON INTERNATIONAL®
 Leading the Way in ElectricitySM
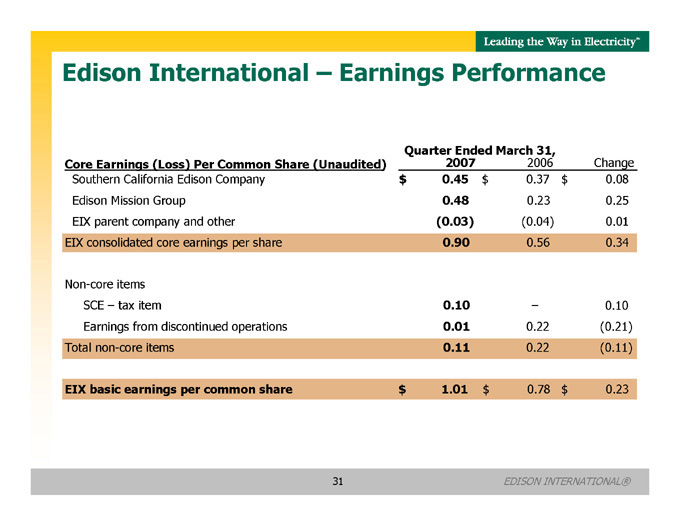
Edison International – Earnings Performance
| | | | | | |
| | | Quarter Ended March 31, | | |
Core Earnings (Loss) Per Common Share (Unaudited) | | 2007 | | 2006 | | Change |
Southern California Edison Company | | $0.45 | | $0.37 | | $0.08 |
Edison Mission Group | | 0.48 | | 0.23 | | 0.25 |
EIX parent company and other | | (0.03) | | (0.04) | | 0.01 |
EIX consolidated core earnings per share | | 0.90 | | 0.56 | | 0.34 |
Non-core items | | | | | | |
SCE – tax item | | 0.10 | | – | | 0.10 |
Earnings from discontinued operations | | 0.01 | | 0.22 | | (0.21) |
Total non-core items | | 0.11 | | 0.22 | | (0.11) |
EIX basic earnings per common share | | $1.01 | | $0.78 | | $0.23 |
31 EDISON INTERNATIONAL®
Leading the Way in ElectricitySM
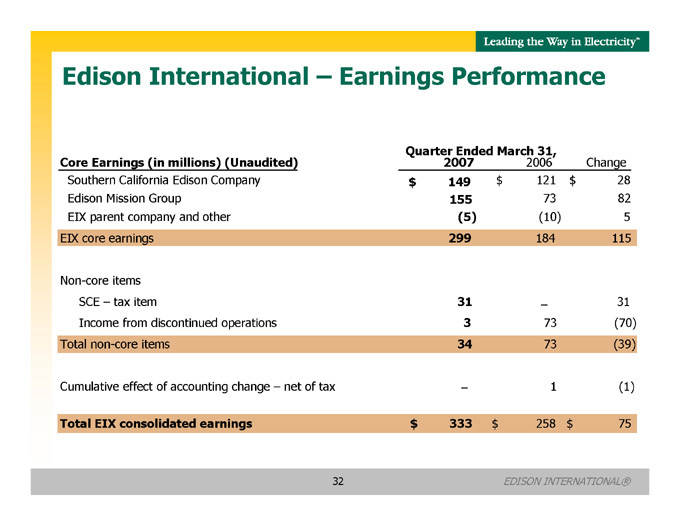
Edison International – Earnings Performance
| | | | | | |
| | | Quarter Ended March 31, | | |
Core Earnings (in millions) (Unaudited) | | 2007 | | 2006 | | Change |
Southern California Edison Company | | $149 | | $121 | | $28 |
Edison Mission Group | | 155 | | 73 | | 82 |
EIX parent company and other | | (5) | | (10) | | 5 |
EIX core earnings | | 299 | | 184 | | 115 |
Non-core items | | | | | | |
SCE – tax item | | 31 | | – | | 31 |
Income from discontinued operations | | 3 | | 73 | | (70) |
Total non-core items | | 34 | | 73 | | (39) |
Cumulative effect of accounting change – net of tax | | – | | 1 | | (1) |
Total EIX consolidated earnings | | $333 | | $258 | | $75 |
32 EDISON INTERNATIONAL®
Leading the Way in ElectricitySM
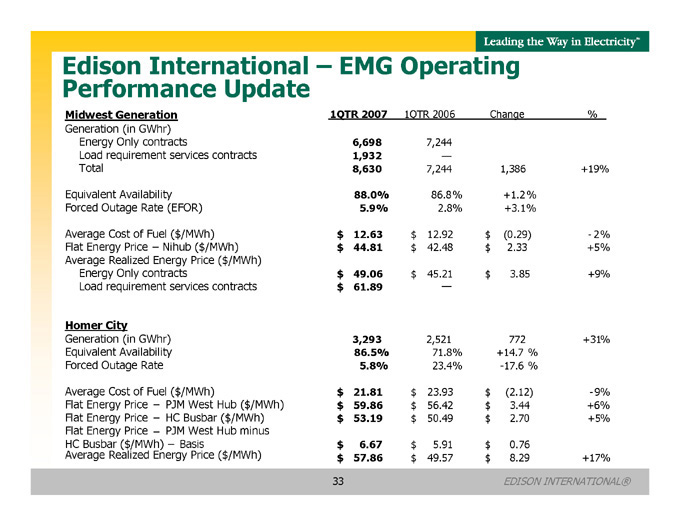
Edison International – EMG Operating Performance Update
| | | | | | | | |
Midwest Generation | | 1QTR 2007 | | 1QTR 2006 | | Change | | % |
Generation (in GWhr) | | | | | | | | |
Energy Only contracts | | 6,698 | | 7,244 | | | | |
Load requirement services contracts | | 1,932 | | — | | | | |
Total | | 8,630 | | 7,244 | | 1,386 | | +19% |
Equivalent Availability | | 88.0% | | 86.8% | | +1.2% | | |
Forced Outage Rate (EFOR) | | 5.9% | | 2.8% | | +3.1% | | |
Average Cost of Fuel ($/MWh) | | $12.63 | | $12.92 | | $(0.29) | | - 2% |
Flat Energy Price – Nihub ($/MWh) | | $44.81 | | $42.48 | | $2.33 | | +5% |
Average Realized Energy Price ($ /MWh) | | | | | | | | |
Energy Only contracts | | $49.06 | | $45.21 | | $3.85 | | +9% |
Load requirement services contracts | | $61.89 | | — | | | | |
Homer City | | | | | | | | |
Generation (in GWhr) | | 3,293 | | 2,521 | | 772 | | +31% |
Equivalent Availability | | 86.5% | | 71.8% | | +14.7% | | |
Forced Outage Rate | | 5.8% | | 23.4% | | -17.6 % | | |
Average Cost of Fuel ($/MWh) | | $21.81 | | $23.93 | | $(2.12) | | -9% |
Flat Energy Price – PJM West Hub ($/MWh) | | $59.86 | | $56.42 | | $3.44 | | +6% |
Flat Energy Price – HC Busbar ($/MWh) | | $53.19 | | $50.49 | | $2.70 | | +5% |
Flat Energy Price – PJM West Hub minus | | | | | | | | |
HC Busbar ($/MWh) – Basis | | $6.67 | | $5.91 | | $0.76 | | |
Average Realized Energy Price ($ /MWh) | | $57.86 | | $49.57 | | $8.29 | | +17% |
33 EDISON INTERNATIONAL®
Leading the Way in ElectricitySM
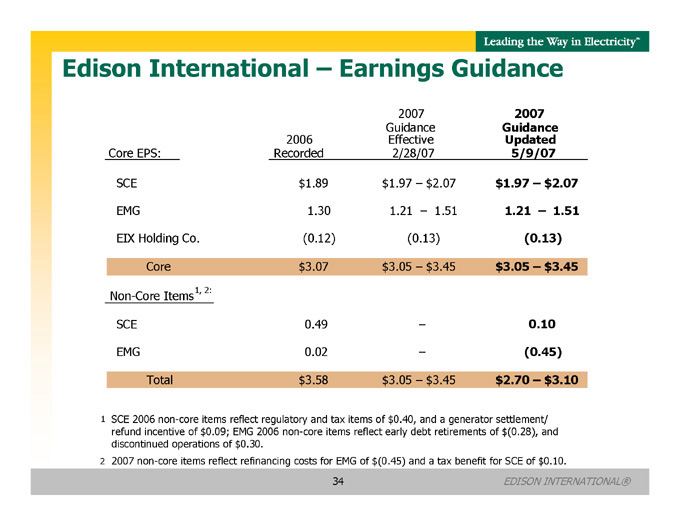
Edison International — Earnings Guidance
| | | | | | | | | | |
Core EPS: | | 2006 Recorded | | 2007 Guidance Effective 2/28/07 | | Updated | | 2007 Guidance 5/9/07 |
SCE | | $1.89 | | $1.97 – $ | | 2.07 | | $1.97 – $ | | 2.07 |
EMG | | 1.30 | | 1.21 – | | 1.51 | | 1.21 – | | 1.51 |
EIX Holding Co. | | (0.12) | | (0.13) | | (0.13) | | | | |
Core | | $3.07 | | $3.05 – $ | | 3.45 | | $3.05 – $ | | 3.45 |
Non-Core Items1, 2: | | | | | | | | | | |
SCE | | 0.49 | | – | | | | 0.10 | | |
EMG | | 0.02 | | – | | | | (0.45) | | |
Total | | $3.58 | | $3.05 – $ | | 3.45 | | $2.70 – $ | | 3.10 |
1 SCE 2006 non-core items reflect regulatory and tax items of $0.40, and a generator settlement/ refund incentive of $0.09; EMG 2006 non-core items reflect early debt retirements of $(0.28), and discontinued operations of $0.30.
2 2007 non-core items reflect refinancing costs for EMG of $(0.45) and a tax benefit for SCE of $0.10.
34 EDISON INTERNATIONAL®
Leading the Way in ElectricitySM
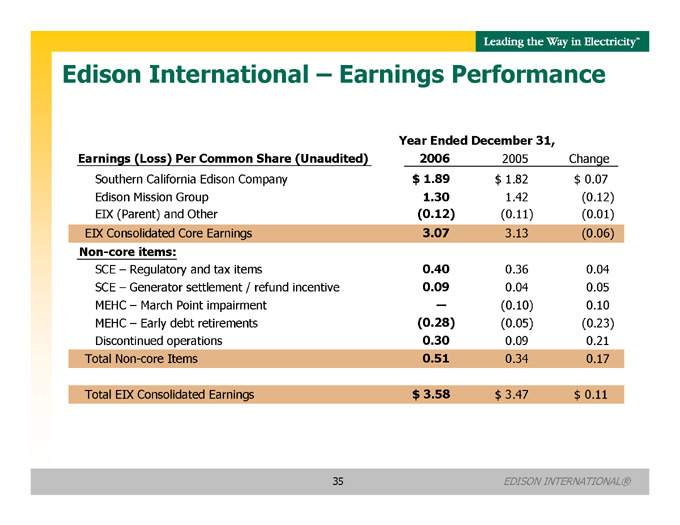
Edison International – Earnings Performance
| | | | | | |
| | | Year Ended December 31, | | | | |
Earnings (Loss) Per Common Share (Unaudited) | | 2006 | | 2005 | | Change |
Southern California Edison Company | | $1.89 | | $1.82 | | $0.07 |
Edison Mission Group | | 1.30 | | 1.42 | | (0.12) |
EIX (Parent) and Other | | (0.12) | | (0.11) | | (0.01) |
EIX Consolidated Core Earnings | | 3.07 | | 3.13 | | (0.06) |
Non-core items: | | | | | | |
SCE – Regulatory and tax items | | 0.40 | | 0.36 | | 0.04 |
SCE – Generator settlement / refund incentive | | 0.09 | | 0.04 | | 0.05 |
MEHC – March Point impairment | | — | | (0.10) | | 0.10 |
MEHC – Early debt retirements | | (0.28) | | (0.05) | | (0.23) |
Discontinued operations | | 0.30 | | 0.09 | | 0.21 |
Total Non-core Items | | 0.51 | | 0.34 | | 0.17 |
Total EIX Consolidated Earnings | | $3.58 | | $3.47 | | $0.11 |
35 EDISON INTERNATIONAL®
Leading the Way in ElectricitySM
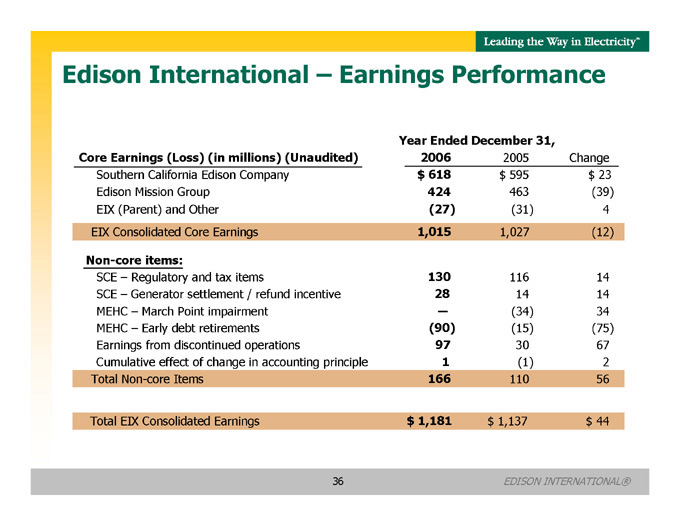
Edison International – Earnings Performance
| | | | | | |
| | | Year Ended December 31, | | | | |
Core Earnings (Loss) (in millions) (Unaudited) | | 2006 | | 2005 | | Change |
Southern California Edison Company | | $618 | | $595 | | $23 |
Edison Mission Group | | 424 | | 463 | | (39) |
EIX (Parent) and Other | | (27) | | (31) | | 4 |
EIX Consolidated Core Earnings | | 1,015 | | 1,027 | | (12) |
Non-core items: | | | | | | |
SCE – Regulatory and tax items | | 130 | | 116 | | 14 |
SCE – Generator settlement / refund incentive | | 28 | | 14 | | 14 |
MEHC – March Point impairment | | — | | (34) | | 34 |
MEHC – Early debt retirements | | (90) | | (15) | | (75) |
Earnings from discontinued operations | | 97 | | 30 | | 67 |
Cumulative effect of change in accounting principle | | 1 | | (1) | | 2 |
Total Non-core Items | | 166 | | 110 | | 56 |
Total EIX Consolidated Earnings | | $1,181 | | $1,137 | | $44 |
36 EDISON INTERNATIONAL®
Leading the Way in ElectricitySM
Appendix
37 EDISON INTERNATIONAL®
Leading the Way in ElectricitySM
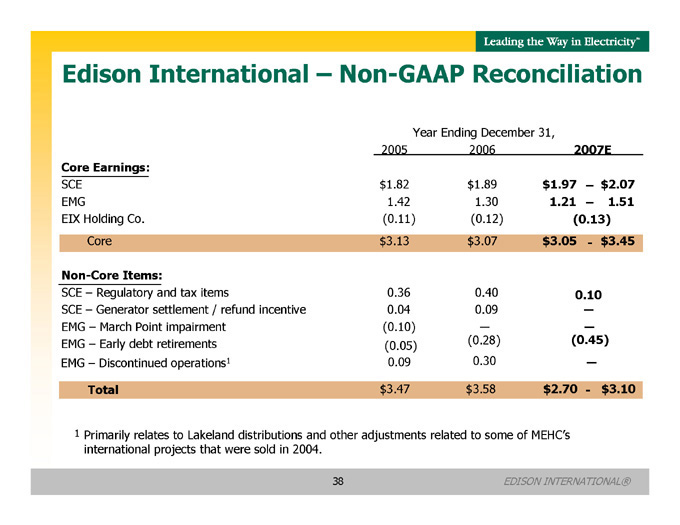
Edison International — Non-GAAP Reconciliation
| | | | | | |
| | | Year Ending December 31, | | |
| | | 2005 | | 2006 | | 2007E |
Core Earnings: | | | | | | |
SCE | | $1.82 | | $1.89 | | $1.97 –$ 2.07 |
EMG | | 1.42 | | 1.30 | | 1.21 – 1.51 |
EIX Holding Co. | | (0.11) | | (0.12) | | (0.13) |
Core | | $3.13 | | $3.07 | | $3.05 -$ 3.45 |
Non-Core Items: | | | | | | |
SCE – Regulatory and tax items | | 0.36 | | 0.40 | | 0.10 |
SCE – Generator settlement / refund incentive | | 0.04 | | 0.09 | | — |
EMG – March Point impairment | | (0.10) | | — | | — |
EMG – Early debt retirements | | (0.05) | | (0.28) | | (0.45) |
EMG – Discontinued operations1 | | 0.09 | | 0.30 | | — |
Total | | $3.47 | | $3.58 | | $2.70 -$ 3.10 |
1 Primarily relates to Lakeland distributions and other adjustments related to some of MEHC’s international projects that were sold in 2004.
38 EDISON INTERNATIONAL®
Leading the Way in ElectricitySM
Edison International — Non-GAAP Reconciliation
| | | | | | |
| | | Quarter Ended March 31, | | |
Core Earnings (Loss) Per Common Share (Unaudited) | | 2007 | | 2006 | | Change |
Southern California Edison Company | | $0.45 | | $0.37 | | $0.08 |
Edison Mission Group | | 0.48 | | 0.23 | | 0.25 |
EIX parent company and other | | (0.03) | | (0.04) | | 0.01 |
EIX consolidated core earnings per share | | 0.90 | | 0.56 | | 0.34 |
Non-core items | | | | | | |
SCE – tax item | | 0.10 | | — | | 0.10 |
Earnings from discontinued operations | | 0.01 | | 0.22 | | (0.21) |
Total non-core items | | 0.11 | | 0.22 | | (0.11) |
EIX basic earnings per common share | | $1.01 | | $0.78 | | $0.23 |
39 EDISON INTERNATIONAL®
Leading the Way in ElectricitySM
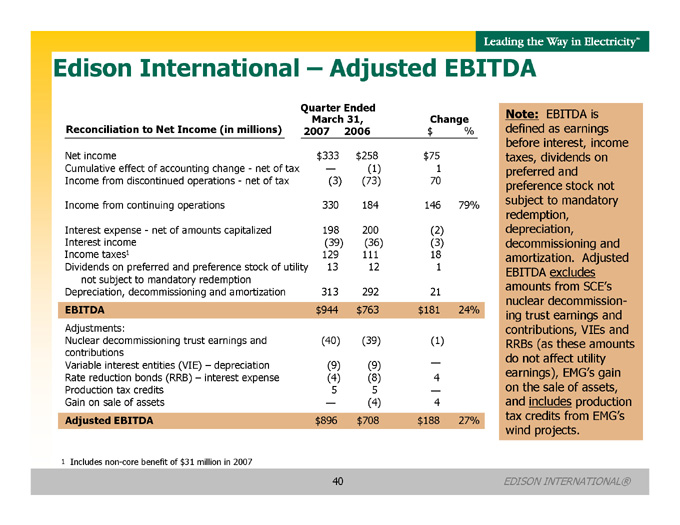
Edison International - Adjusted EBITDA
Quarter Ended March 31, 2007 2006 Change
Reconciliation to Net Income (in millions)
$ %
Net income $ 333 $ 258 $ 75
Cumulative effect of accounting change - net of tax — (1) 1
Income from discontinued operations - net of tax (3) (73) 70
Income from continuing operations 330 184 146 79%
Interest expense - net of amounts capitalized 198 200 (2)
Interest income (39) (36) (3)
Income taxes1 129 111 18
Dividends on preferred and preference stock of utility 13 12 1
not subject to mandatory redemption
Depreciation, decommissioning and amortization 313 292 21
EBITDA $ 944 $ 763 $ 181 24%
Adjustments:
Nuclear decommissioning trust earnings and (40) (39) (1)
contributions
Variable interest entities (VIE) - depreciation (9) (9) —
Rate reduction bonds (RRB) - interest expense (4) (8) 4
Production tax credits 5 5 —
Gain on sale of assets — (4) 4
Adjusted EBITDA $ 896 $ 708 $ 188 27%
1 Includes non-core benefit of $31 million in 2007
Note: EBITDA is defined as earnings before interest, income taxes, dividends on preferred and preference stock not subject to mandatory redemption, depreciation, decommissioning and amortization. Adjusted EBITDA excludes amounts from SCE’s nuclear decommissioning trust earnings and contributions, VIEs and RRBs (as these amounts do not affect utility earnings), EMG’s gain on the sale of assets, and includes production tax credits from EMG’s wind projects.
40 EDISON INTERNATIONAL®
Leading the Way in ElectricitySM
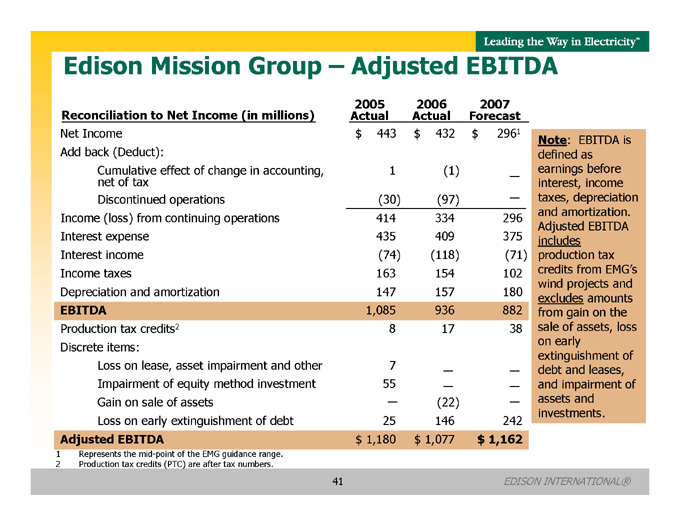
Edison Mission Group – Adjusted EBITDA
| | | | | | |
Reconciliation to Net Income (in millions) | | 2005 Actual | | 2006 Actual | | 2007 Forecast |
Net Income | | $443 | | $432 | | $2961 |
Add back (Deduct): | | | | | | |
Cumulative effect of change in accounting, | | 1 | | (1) | | — |
net of tax | | | | | | |
Discontinued operations | | (30) | | (97) | | — |
Income (loss) from continuing operations | | 414 | | 334 | | 296 |
Interest expense | | 435 | | 409 | | 375 |
Interest income | | (74) | | (118) | | (71) |
Income taxes | | 163 | | 154 | | 102 |
Depreciation and amortization | | 147 | | 157 | | 180 |
EBITDA | | 1,085 | | 936 | | 882 |
Production tax credits2 | | 8 | | 17 | | 38 |
Discrete items: | | | | | | |
Loss on lease, asset impairment and other | | 7 | | — | | — |
Impairment of equity method investment | | 55 | | — | | — |
Gain on sale of assets | | — | | (22) | | — |
Loss on early extinguishment of debt | | 25 | | 146 | | 242 |
Adjusted EBITDA | | $1,180 | | $1,077 | | $1,162 |
Note: EBITDA is defined as earnings before interest, income taxes, depreciation and amortization. Adjusted EBITDA includes production tax credits from EMG’s wind projects and excludes amounts from gain on the sale of assets, loss on early extinguishment of debt and leases, and impairment of assets and investments.
1 Represents the mid-point of the EMG guidance range.
2 Production tax credits (PTC) are after tax numbers.
41 EDISON INTERNATIONAL®
Leading the Way in ElectricitySM
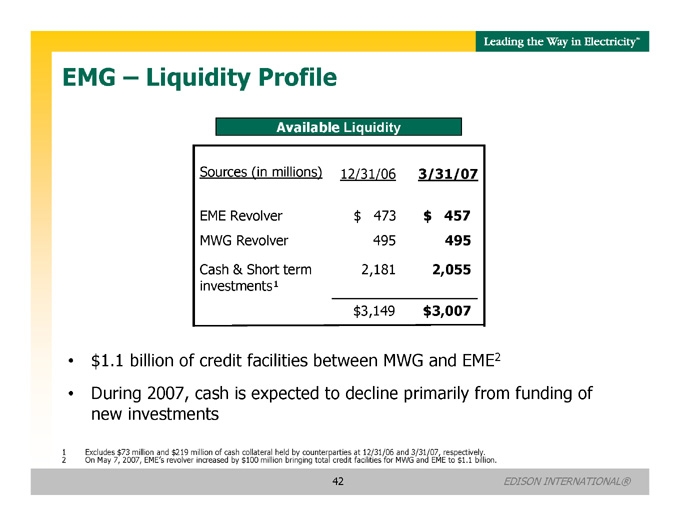
EMG – Liquidity Profile
Available Liquidity
| | | | |
Sources (in millions) | | 12/31/06 | | 3/31/07 |
EME Revolver | | $473 | | $457 |
MWG Revolver | | 495 | | 495 |
Cash & Short term | | 2,181 | | 2,055 |
investments¹ | | | | |
| | | $3,149 | | $3,007 |
$1.1 billion of credit facilities between MWG and EME2
During 2007, cash is expected to decline primarily from funding of new investments
1 Excludes $73 million and $219 million of cash collateral held by counterparties at 12/31/06 and 3/31/07, respectively.
2 On May 7, 2007, EME’s revolver increased by $100 million bringing total credit facilities for MWG and EME to $1.1 billion.
42 EDISON INTERNATIONAL®
Leading the Way in ElectricitySM
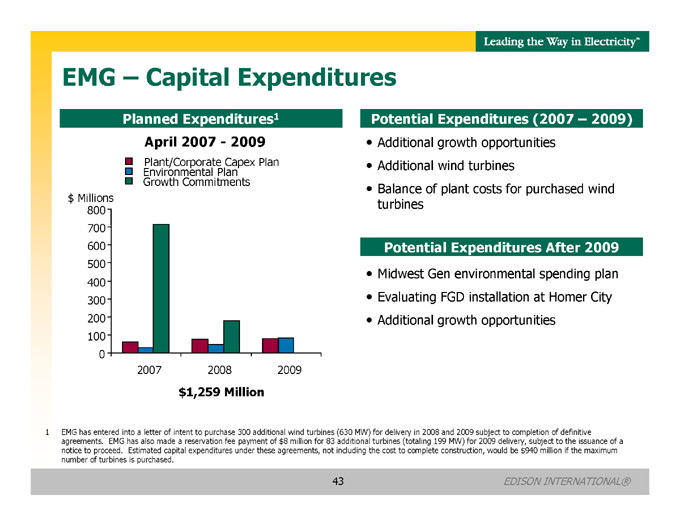
EMG – Capital Expenditures
Planned Expenditures1
April 2007 - 2009
Plant/Corporate Capex Plan Environmental Plan Growth Commitments
Potential Expenditures (2007 – 2009)
Additional growth opportunities
Additional wind turbines
Balance of plant costs for purchased wind turbines
$ Millions 800 700 600 500 400 300 200 100 0
2007 2008 2009
$1,259 Million
Potential Expenditures After 2009
Midwest Gen environmental spending plan
Evaluating FGD installation at Homer City
Additional growth opportunities
1 EMG has entered into a letter of intent to purchase 300 additional wind turbines (630 MW) for delivery in 2008 and 2009 subject to completion of definitive agreements. EMG has also made a reservation fee payment of $8 million for 83 additional turbines (totaling 199 MW) for 2009 delivery, subject to the issuance of a notice to proceed. Estimated capital expenditures under these agreements, not including the cost to complete construction, would be $940 million if the maximum number of turbines is purchased.
43 EDISON INTERNATIONAL®
Leading the Way in ElectricitySM
Edison International – 2006 Financial Highlights
Record high net income of approx. $1.2 billion or $3.58 per share vs. guidance of $3.19 per share
Core1 earnings of $3.07 per share exceeded guidance of $2.91 per share
EIX dividend increased by 7.4% to an annual rate of $1.16 per share
Growth initiatives on plan for both SCE and EMG
SCE invested $2.2 billion in capital projects in 2006
Major transmission projects progressing
Advanced Metering Infrastructure (AMI) deployment accelerated one year
EMG advanced plans to diversify and grow its generation portfolio
EMG significantly advanced development of renewable energy projects
MOU with Illinois EPA provides much greater certainty for future state environmental regulations and flexibility to comply
Maintained utility authorized equity return for 2007 at 11.6%
See appendix for non-GAAP reconciliation.
44 EDISON INTERNATIONAL®