Exhibit 99.2
[GRAPHICS APPEARS HERE]
Second Quarter 2007
Financial Teleconference
August 9, 2007
EDISON INTERNATIONAL®
[GRAPHICS APPEARS HERE]
Forward-Looking Statements
Statements contained in this presentation about future performance, including, without limitation, earnings, asset and rate base growth, load growth, capital investments, and other statements that are not purely historical, are forward-looking statements. These forward-looking statements reflect our current expectations; however, such statements involve risks and uncertainties. Actual results could differ materially from current expectations. Important factors that could cause different results are discussed under the headings “Risk Factors” and “Management’s Discussion and Analysis” in Edison International’s 2006 Form 10-K and subsequent reports filed with the Securities and Exchange Commission and are available on our website: www.edison.com. These forward-looking statements represent our expectations only as of the date of this presentation, and Edison International assumes no duty to update them to reflect new information, events or circumstances.
EDISON INTERNATIONAL®
[GRAPHICS APPEARS HERE]
Use of Non-GAAP Financial Measures
Edison International’s earnings are prepared in accordance with generally accepted accounting principles used in the United States and represent the company’s earnings as reported to the Securities and Exchange Commission. Edison International’s management uses core earnings, which exclude earnings from discontinued operations and other non-core items, internally for financial planning and for analysis of performance. Edison International also uses core earnings as the primary performance measurement when communicating with analysts and investors regarding its earnings results and outlook, as it allows them to more accurately compare the company’s ongoing performance across periods. A reconciliation of Non-GAAP information to GAAP information is included either on the slide where the information appears or on another slide referenced in the presentation.
EDISON INTERNATIONAL®
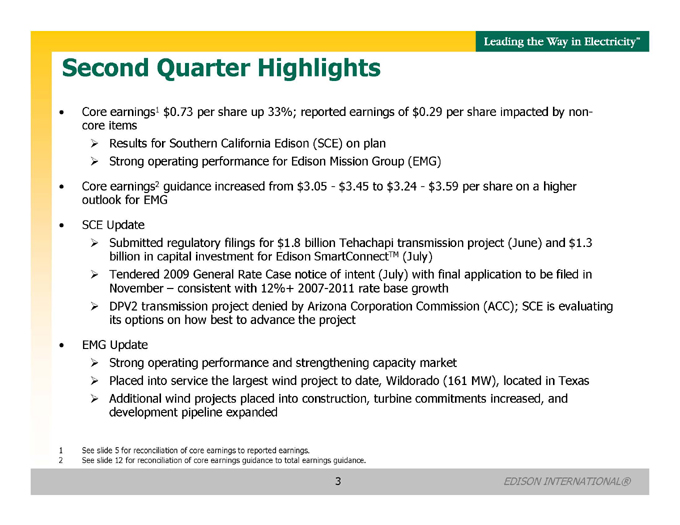
Second Quarter Highlights
Core earnings1 $0.73 per share up 33%; reported earnings of $0.29 per share impacted by non-core items
Results for Southern California Edison (SCE) on plan
Strong operating performance for Edison Mission Group (EMG)
Core earnings2 guidance increased from $3.05 - $3.45 to $3.24 - $3.59 per share on a higher outlook for EMG
SCE Update
Submitted regulatory filings for $1.8 billion Tehachapi transmission project (June) and $1.3 billion in capital investment for Edison SmartConnectTM (July)
Tendered 2009 General Rate Case notice of intent (July) with final application to be filed in November – consistent with 12%+ 2007-2011 rate base growth
DPV2 transmission project denied by Arizona Corporation Commission (ACC); SCE is evaluating its options on how best to advance the project
EMG Update
Strong operating performance and strengthening capacity market
Placed into service the largest wind project to date, Wildorado (161 MW), located in Texas
Additional wind projects placed into construction, turbine commitments increased, and development pipeline expanded
1 See slide 5 for reconciliation of core earnings to reported earnings.
2 See slide 12 for reconciliation of core earnings guidance to total earnings guidance.
3

[GRAPHICS APPEARS HERE]
Second Quarter Earnings Summary
GAAP
Net Income
($ millions)
$93
2Q 07
$177
2Q 06
Basic EPS
$0.29
2Q 07
$0.54
2Q 06
Core1
Net Income
($ millions)
$239
2Q 07
$180
2Q 06
EPS
$0.73
2Q 07
$0.55
2Q 06
1 |
| See slide 5 for reconciliation of core earnings to reported earnings. Core earnings is defined as GAAP earnings less income from discontinued operations and other non-core items. |
EDISON INTERNATIONAL®
[GRAPHICS APPEARS HERE]
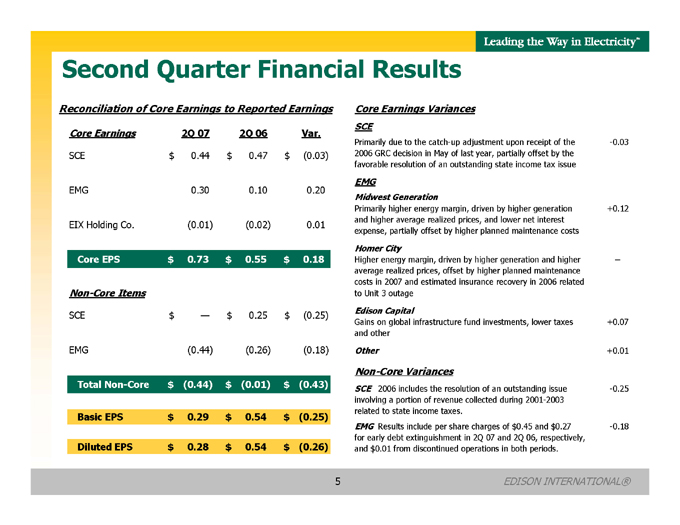
Second Quarter Financial Results
Reconciliation of Core Earnings to Reported Earnings
Core Earnings |
| 2Q 07 |
|
| 2Q 06 |
|
| Var. |
| |||
SCE | $ | 0.44 |
| $ | 0.47 |
| $ | (0.03 | ) | |||
EMG |
| 0.30 |
|
| 0.10 |
|
| 0.20 |
| |||
EIX Holding Co. |
| (0.01 | ) |
| (0.02 | ) |
| 0.01 |
|
Core EPS | $ |
|
| 0.73 |
| $ |
|
| 0.55 |
| $ |
|
| 0.18 |
| ||||||
Non-Core Items | |||||||||||||||||||||
SCE | $ | — |
| $ | 0.25 |
| $ | (0.25 | ) | ||||||||||||
EMG |
| (0.44 | ) |
| (0.26 | ) |
| (0.18 | ) | ||||||||||||
Total Non-Core | $ | (0.44 | ) | $ | (0.01 | ) | $ | (0.43 | ) | ||||||||||||
Basic EPS | $ | 0.29 |
| $ | 0.54 |
| $ | (0.25 | ) | ||||||||||||
Diluted EPS | $ | 0.28 |
| $ | 0.54 |
| $ | (0.26 | ) |
Core Earnings Variances | ||
SCE | ||
Primarily due to the catch-up adjustment upon receipt of the 2006 GRC decision in May of last year, partially offset by the favorable resolution of an outstanding state income tax issue | -0.03 | |
EMG | ||
Midwest Generation | ||
Primarily higher energy margin, driven by higher generation and higher average realized prices, and lower net interest expense, partially offset by higher planned maintenance costs | +0.12 | |
Homer City | ||
Higher energy margin, driven by higher generation and higher | – | |
average realized prices, offset by higher planned maintenance costs in 2007 and estimated insurance recovery in 2006 related to Unit 3 outage | ||
Edison Capital | ||
Gains on global infrastructure fund investments, lower taxes | +0.07 | |
and other | ||
Other | +0.01 |
Non-Core Variances | ||
SCE 2006 includes the resolution of an outstanding issue involving a portion of revenue collected during 2001-2003 related to state income taxes. | -0.25 | |
EMG Results include per share charges of $0.45 and $0.27 for early debt extinguishment in 2Q 07 and 2Q 06, respectively,and $0.01 from discontinued operations in both periods. | -0.18 | |
EDISON INTERNATIONAL®
[GRAPHICS APPEARS HERE]
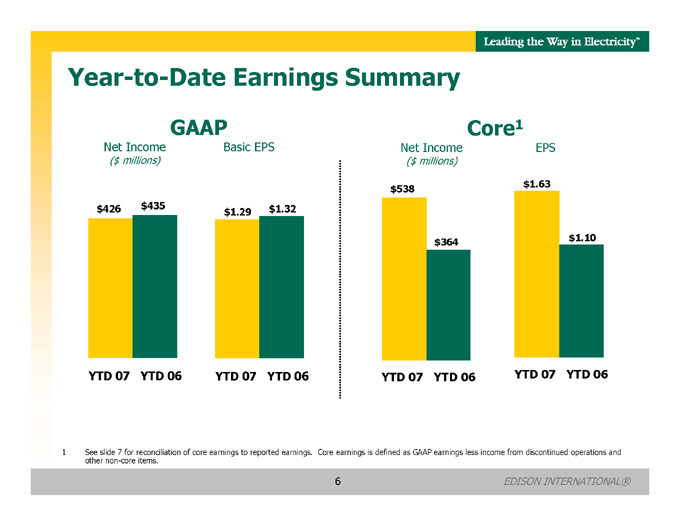
Year-to-Date Earnings Summary
GAAP
Net Income
($ millions)
$426
YTD 07
$435
YTD 06
Basic EPS
$1.29
YTD 07
$1.32
YTD 06
Core1
Net Income EPS
($ millions)
$538
YTD 07
$364
YTD 06
$1.63
YTD 07
$1.10
YTD 06
1 |
| See slide 7 for reconciliation of core earnings to reported earnings. Core earnings is defined as GAAP earnings less income from discontinued operations and other non-core items. |
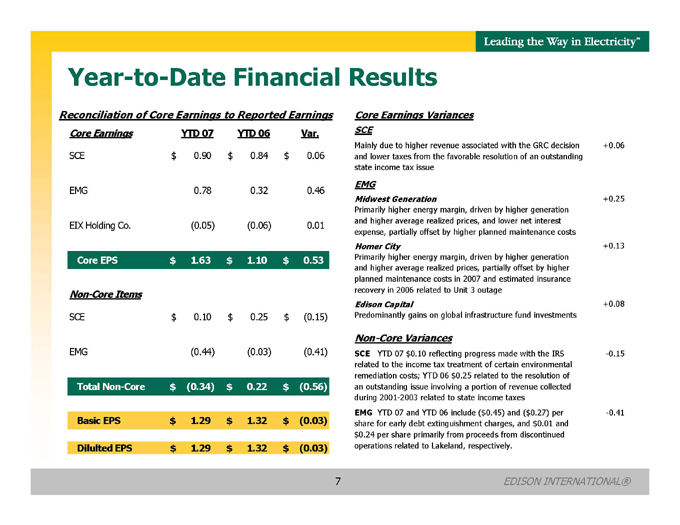
Year-to-Date Financial Results
Reconciliation of Core Earnings to Reported Earnings
Core Earnings |
| YTD 07 |
|
| YTD 06 |
|
| Var. |
| |||
SCE | $ | 0.90 |
| $ | 0.84 |
| $ | 0.06 |
| |||
EMG |
| 0.78 |
|
| 0.32 |
|
| 0.46 |
| |||
EIX Holding Co. |
| (0.05 | ) |
| (0.06 | ) |
| 0.01 |
| |||
Core EPS | $ | 1.63 |
| $ | 1.10 |
| $ | 0.53 |
| |||
Non-Core Items | ||||||||||||
SCE | $ | 0.10 |
| $ | 0.25 |
| $ | (0.15 | ) | |||
EMG |
| (0.44 | ) |
| (0.03 | ) |
| (0.41 | ) | |||
Total Non-Core | $ | (0.34 | ) | $ | 0.22 |
| $ | (0.56 | ) | |||
Basic EPS | $ | 1.29 |
| $ | 1.32 |
| $ | (0.03 | ) | |||
Dilulted EPS | $ | 1.29 |
| $ | 1.32 |
| $ | (0.03 | ) |
Core Earnings Variances | ||
SCE | ||
Mainly due to higher revenue associated with the GRC decision and lower taxes from the favorable resolution of an outstanding state income tax issue | +0.06 | |
EMG | ||
Midwest Generation | +0.25 | |
Primarily higher energy margin, driven by higher generation and higher average realized prices, and lower net interest expense, partially offset by higher planned maintenance costs | ||
Homer City | +0.13 | |
Primarily higher energy margin, driven by higher generation and higher average realized prices, partially offset by higher planned maintenance costs in 2007 and estimated insurance recovery in 2006 related to Unit 3 outage | ||
Edison Capital | +0.08 | |
Predominantly gains on global infrastructure fund investments | ||
Non-Core Variances | ||
SCE YTD 07 $ 0.10 reflecting progress made with the IRS related to the income tax treatment of certain environmental remediation costs; YTD 06 $ 0.25 related to the resolution of an outstanding issue involving a portion of revenue collected during 2001-2003 related to state income taxes | -0.15 | |
EMG YTD 07 and YTD 06 include ($0.45) and ($0.27) per share for early debt extinguishment charges, and $0.01 and $ 0.24 per share primarily from proceeds from discontinued operations related to Lakeland, respectively. | -0.41 |
7
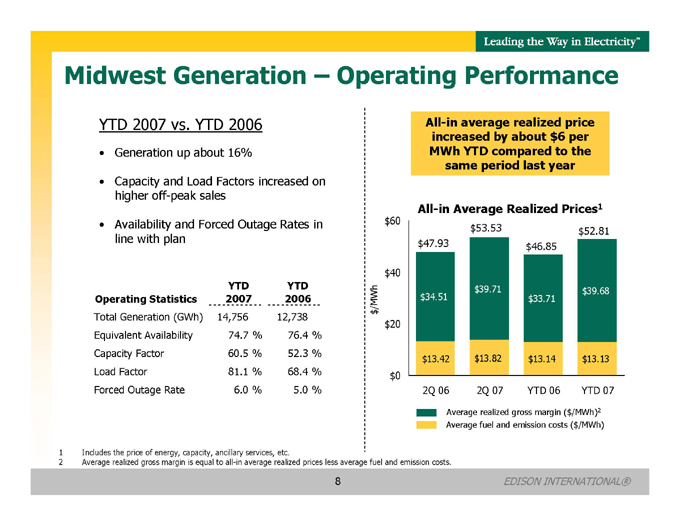
Midwest Generation – Operating Performance
YTD 2007 vs. YTD 2006
• Generation up about 16%
• Capacity and Load Factors increased on higher off-peak sales
• Availability and Forced Outage Rates in line with plan
Operating Statistics | YTD 2007 |
| YTD 2006 |
| ||
Total Generation (GWh) | 14,756 |
| 12,738 |
| ||
Equivalent Availability | 74.7 | % | 76.4 | % | ||
Capacity Factor | 60.5 | % | 52.3 | % | ||
Load Factor | 81.1 | % | 68.4 | % | ||
Forced Outage Rate | 6.0 | % | 5.0 | % |
All-in average realized price increased by about $6 per MWh YTD compared to the same period last year
All-in Average Realized Prices1
$60 | ||||||||||
$53.53 | $52.81 | |||||||||
$47.93 | $46.85 | |||||||||
$40 | ||||||||||
$39.71 | $39.68 | |||||||||
$34.51 | $33.71 | |||||||||
$/MWh | ||||||||||
$20 | ||||||||||
$13.42 | $13.82 | $13.14 | $13.13 | |||||||
$0 | ||||||||||
2Q | 2Q | YTD | YTD |
Average realized gross margin ($/MWh)2 Average fuel and emission costs ($/MWh)
1 Includes the price of energy, capacity, ancillary services, etc.
2 Average realized gross margin is equal to all-in average realized prices less average fuel and emission costs.
8
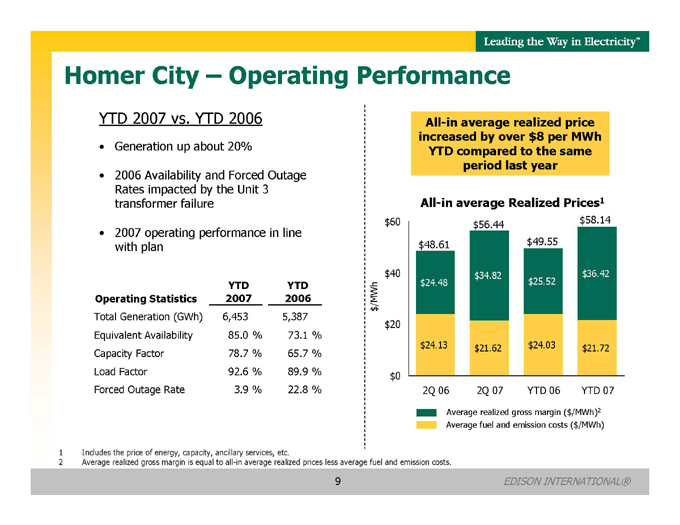
Homer City – Operating Performance
YTD 2007 vs. YTD 2006
• Generation up about 20%
• 2006 Availability and Forced Outage Rates impacted by the Unit 3 transformer failure
• 2007 operating performance in line with plan
Operating Statistics | YTD 2007 |
| YTD 2006 |
| ||
Total Generation (GWh) | 6,453 |
| 5,387 |
| ||
Equivalent Availability | 85.0 | % | 73.1 | % | ||
Capacity Factor | 78.7 | % | 65.7 | % | ||
Load Factor | 92.6 | % | 89.9 | % | ||
Forced Outage Rate | 3.9 | % | 22.8 | % |
All-in average realized price increased by over $8 per MWh YTD compared to the same period last year
All-in average Realized Prices1
$ | 60 | $ | 56.44 | $ | 58.14 | ||||||||||
$ | 48.61 | $ | 49.55 | ||||||||||||
$ | 40 | $ | 34.82 | $ | 36.42 | ||||||||||
$ | 24.48 | $ | 25.52 | ||||||||||||
$/MWh | |||||||||||||||
$ | 20 | ||||||||||||||
$ | 24.13 | $ | 21.62 | $ | 24.03 | $ | 21.72 | ||||||||
$ | 0 | ||||||||||||||
| 2Q 06 |
| 2Q 07 |
| YTD06 |
| YTD07 |
Average realized gross margin ($/MWh)2 Average fuel and emission costs ($/MWh)
1 Includes the price of energy, capacity, ancillary services, etc.
2 Average realized gross margin is equal to all-in average realized prices less average fuel and emission costs.
9
[GRAPHICS APPEARS HERE]
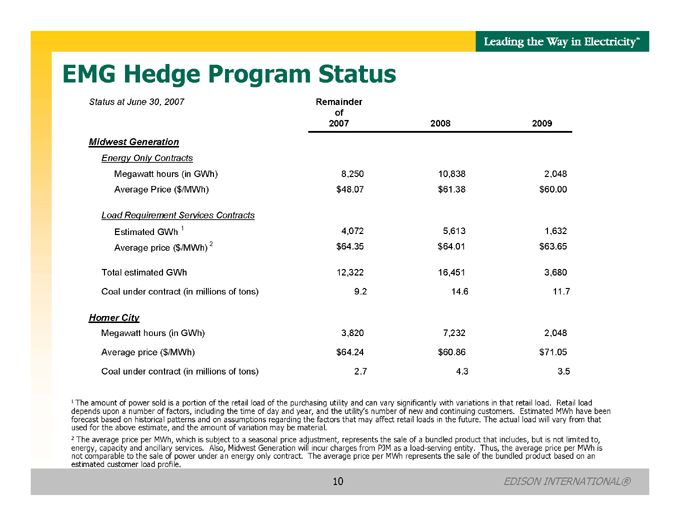
EMG Hedge Program Status
Status at June 30, 2007 |
| Remainder | |||||||||
| of | ||||||||||
| 2007 |
| 2008 |
| 2009 | ||||||
Midwest Generation | |||||||||||
Energy Only Contracts | |||||||||||
Megawatt hours (in GWh) |
| 8,250 |
| 10,838 |
| 2,048 | |||||
Average Price ($/MWh) | $ | 48.07 | $ | 61.38 | $ | 60.00 | |||||
Load Requirement Services Contracts | |||||||||||
Estimated GWh1 |
| 4,072 |
| 5,613 |
| 1,632 | |||||
Average price ($/MWh) 2 | $ | 64.35 | $ | 64.01 | $ | 63.65 | |||||
Total estimated GWh |
| 12,322 |
| 16,451 |
| 3,680 | |||||
Coal under contract (in millions of tons) |
| 9.2 |
| 14.6 |
| 11.7 | |||||
Homer City | |||||||||||
Megawatt hours (in GWh) |
| 3,820 |
| 7,232 |
| 2,048 | |||||
Average price ($/MWh) | $ | 64.24 | $ | 60.86 | $ | 71.05 | |||||
Coal under contract (in millions of tons) |
| 2.7 |
| 4.3 |
| 3.5 | |||||
1 |
| The amount of power sold is a portion of the retail load of the purchasing utility and can vary significantly with variations in that retail load. Retail load depends upon a number of factors, including the time of day and year, and the utility’s number of new and continuing customers. Estimated MWh have been forecast based on historical patterns and on assumptions regarding the factors that may affect retail loads in the future. The actual load will vary from that used for the above estimate, and the amount of variation may be material. |
2 |
| The average price per MWh, which is subject to a seasonal price adjustment, represents the sale of a bundled product that includes, but is not limited to, energy, capacity and ancillary services. Also, Midwest Generation will incur charges from PJM as a load-serving entity. Thus, the average price per MWh is not comparable to the sale of power under an energy only contract. The average price per MWh represents the sale of the bundled product based on an estimated customer load profile. |
EDISON INTERNATIONAL®
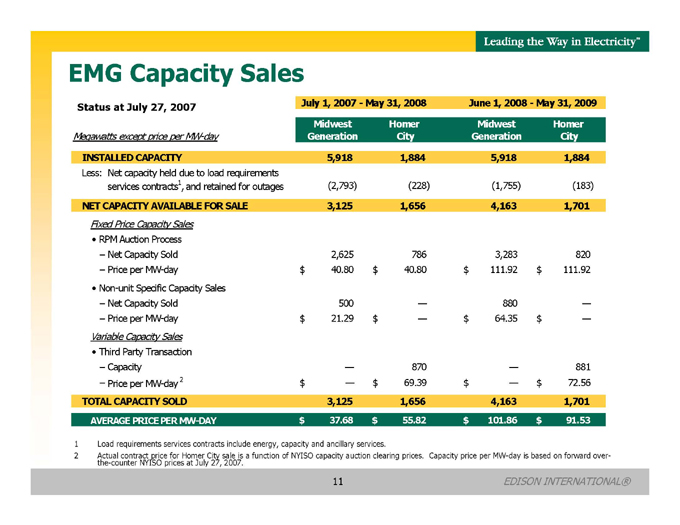
EMG Capacity Sales
Status at July 27, 2007 | | July 1, 2007 - | | | June 1, 2008 - | | ||||||||||
Megawatts except price per MW-day | | Midwest | | | Homer | | | Midwest | | | Homer | | ||||
INSTALLED CAPACITY |
| 5,918 |
|
| 1,884 |
|
| 5,918 |
|
| 1,884 |
| ||||
Less: Net capacity held due to load requirements services contracts1, and retained for outages |
| (2,793 | ) |
| (228 | ) |
| (1,755 | ) |
| (183 | ) | ||||
NET CAPACITY AVAILABLE FOR SALE |
| 3,125 |
|
| 1,656 |
|
| 4,163 |
|
| 1,701 |
| ||||
Fixed Price Capacity Sales | ||||||||||||||||
• RPM Auction Process | ||||||||||||||||
– Net Capacity Sold |
| 2,625 |
|
| 786 |
|
| 3,283 |
|
| 820 |
| ||||
– Price per MW-day | $ | 40.80 |
| $ | 40.80 |
| $ | 111.92 |
| $ | 111.92 |
| ||||
• Non-unit Specific Capacity Sales | ||||||||||||||||
– Net Capacity Sold |
| 500 |
|
| — |
|
| 880 |
|
| — |
| ||||
– Price per MW-day | $ | 21.29 |
| $ | — |
| $ | 64.35 |
| $ | — |
| ||||
Variable Capacity Sales | ||||||||||||||||
• Third Party Transaction | ||||||||||||||||
– Capacity |
| — |
|
| 870 |
|
| — |
|
| 881 |
| ||||
– Price per MW-day 2 | $ | — |
| $ | 69.39 |
| $ | — |
| $ | 72.56 |
| ||||
TOTAL CAPACITY SOLD |
| 3,125 |
|
| 1,656 |
|
| 4,163 |
|
| 1,701 |
| ||||
AVERAGE PRICE PER MW-DAY | $ | 37.68 |
| $ | 55.82 |
| $ | 101.86 |
| $ | 91.53 |
| ||||
1 Load requirements services contracts include energy, capacity and ancillary services.
2 Actual contract price for Homer City sale is a function of NYISO capacity auction clearing prices. Capacity price per MW-day is based on forward over-the-counter NYISO prices at July 27, 2007.
11
[GRAPHICS APPEARS HERE]
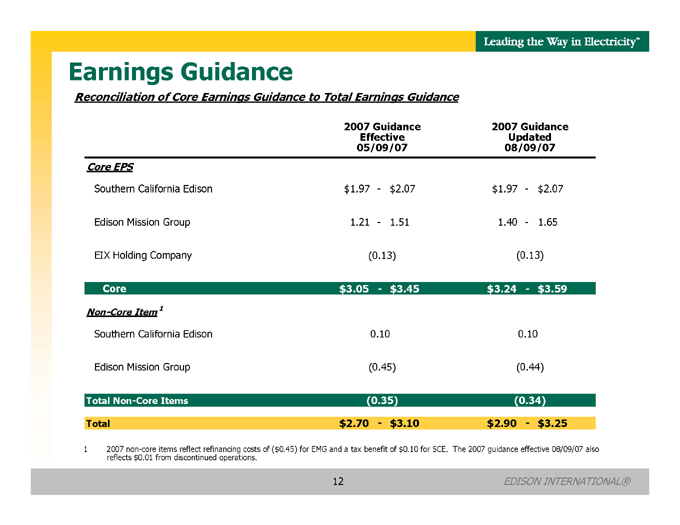
Earnings Guidance
Reconciliation of Core Earnings Guidance to Total Earnings Guidance
2007 | 2007 Guidance | |||||||||||||||||
| Effective |
|
| Updated | ||||||||||||||
| 05/09/07 |
|
| 08/09/07 | ||||||||||||||
Core EPS | ||||||||||||||||||
Southern California Edison | $ |
| 1.97 - $ |
|
| 2.07 | $ |
| 1.97 - $ |
|
| 2.07 | ||||||
Edison Mission Group |
| 1.21 - |
| 1.51 |
| 1.40 - |
| 1.65 | ||||||||||
EIX Holding Company |
| (0.13 | ) |
| (0.13 | ) | ||||||||||||
Core | $ |
| 3.05 - $ |
|
| 3.45 | $ |
| 3.24 - $ |
|
| 3.59 | ||||||
Non-Core Item1 | ||||||||||||||||||
Southern California Edison |
| 0.10 |
|
| 0.10 |
| ||||||||||||
Edison Mission Group |
| (0.45 | ) |
| (0.44 | ) | ||||||||||||
Total Non-Core Items |
| (0.35 | ) |
| (0.34 | ) | ||||||||||||
Total | $ |
| 2.70 - $ |
|
| 3.10 | $ |
| 2.90 - $ |
|
| 3.25 | ||||||
1 |
| 2007 non-core items reflect refinancing costs of ($0.45) for EMG and a tax benefit of $0.10 for SCE. The 2007 guidance effective 08/09/07 also reflects $0.01 from discontinued operations. |
EDISON INTERNATIONAL®
[GRAPHICS APPEARS HERE]
Appendix
EDISON INTERNATIONAL®
[GRAPHICS APPEARS HERE]
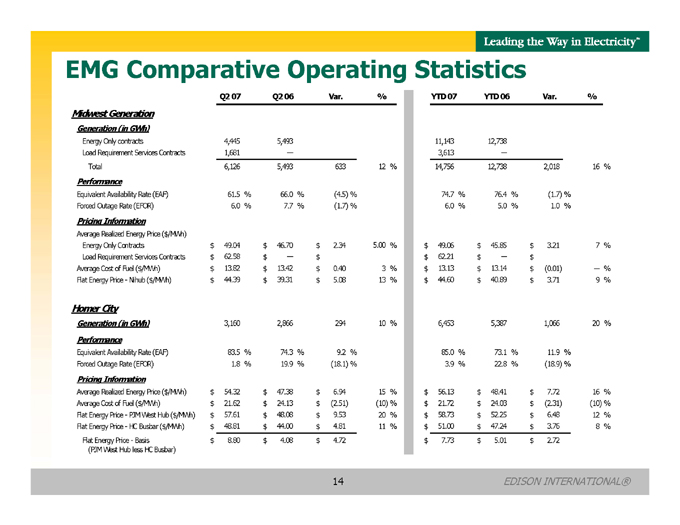
EMG Comparative Operating Statistics
| Q2 07 |
|
| Q2 06 |
|
| Var. |
| % |
|
| YTD 07 |
|
| YTD 06 |
|
| Var. |
| % |
| |||||||||
Midwest Generation | ||||||||||||||||||||||||||||||
Generation (in GWh) | ||||||||||||||||||||||||||||||
Energy Only contracts |
| 4,445 |
|
| 5,493 |
|
| 11,143 |
|
| 12,738 |
| ||||||||||||||||||
Load Requirement Services Contracts |
| 1,681 |
|
| — |
|
| 3,613 |
|
| — |
| ||||||||||||||||||
Total |
| 6,126 |
|
| 5,493 |
|
| 633 |
| 12 | % |
| 14,756 |
|
| 12,738 |
|
| 2,018 |
| 16 | % | ||||||||
Performance | ||||||||||||||||||||||||||||||
Equivalent Availability Rate (EAF) |
| 61.5 | % |
| 66.0 | % |
| (4.5 | )% |
| 74.7 | % |
| 76.4 | % |
| (1.7 | )% | ||||||||||||
Forced Outage Rate (EFOR) |
| 6.0 | % |
| 7.7 | % |
| (1.7 | )% |
| 6.0 | % |
| 5.0 | % |
| 1.0 | % | ||||||||||||
Pricing Information | ||||||||||||||||||||||||||||||
Average Realized Energy Price ($/MWh) | ||||||||||||||||||||||||||||||
Energy Only Contracts | $ | 49.04 |
| $ | 46.70 |
| $ | 2.34 |
| 5.00 | % | $ | 49.06 |
| $ | 45.85 |
| $ | 3.21 |
| 7 | % | ||||||||
Load Requirement Services Contracts | $ | 62.58 |
| $ | — |
| $ |
|
| $ | 62.21 |
| $ | — |
| $ |
|
| ||||||||||||
Average Cost of Fuel ($/MWh) | $ | 13.82 |
| $ | 13.42 |
| $ | 0.40 |
| 3 | % | $ | 13.13 |
| $ | 13.14 |
| $ | (0.01 | ) | — % |
| ||||||||
Flat Energy Price-Nihub ($/MWh) | $ | 44.39 |
| $ | 39.31 |
| $ | 5.08 |
| 13 | % | $ | 44.60 |
| $ | 40.89 |
| $ | 3.71 |
| 9 | % | ||||||||
Homer City | ||||||||||||||||||||||||||||||
Generation (in GWh) |
| 3,160 |
|
| 2,866 |
|
| 294 |
| 10 | % |
| 6,453 |
|
| 5,387 |
|
| 1,066 |
| 20 | % | ||||||||
Performance | ||||||||||||||||||||||||||||||
Equivalent Availability Rate (EAF) |
| 83.5 | % |
| 74.3 | % |
| 9.2 | % |
| 85.0 | % |
| 73.1 | % |
| 11.9 | % | ||||||||||||
Forced Outage Rate (EFOR) |
| 1.8 | % |
| 19.9 | % |
| (18.1 | )% |
| 3.9 | % |
| 22.8 | % |
| (18.9 | )% | ||||||||||||
Pricing Information | ||||||||||||||||||||||||||||||
Average Realized Energy Price ($/MWh) | $ | 54.32 |
| $ | 47.38 |
| $ | 6.94 |
| 15 | % | $ | 56.13 |
| $ | 48.41 |
| $ | 7.72 |
| 16 | % | ||||||||
Average Cost of Fuel ($/MWh) | $ | 21.62 |
| $ | 24.13 |
| $ | (2.51 | ) | (10 | )% | $ | 21.72 |
| $ | 24.03 |
| $ | (2.31 | ) | (10 | )% | ||||||||
Flat Energy Price-PJM West Hub ($/MWh) | $ | 57.61 |
| $ | 48.08 |
| $ | 9.53 |
| 20 | % | $ | 58.73 |
| $ | 52.25 |
| $ | 6.48 |
| 12 | % | ||||||||
Flat Energy Price-HC Busbar ($/MWh) | $ | 48.81 |
| $ | 44.00 |
| $ | 4.81 |
| 11 | % | $ | 51.00 |
| $ | 47.24 |
| $ | 3.76 |
| 8 | % | ||||||||
Flat Energy Price-Basis | $ | 8.80 |
| $ | 4.08 |
| $ | 4.72 |
| $ | 7.73 |
| $ | 5.01 |
| $ | 2.72 |
| ||||||||||||
(PJM West Hub less HC Busbar) |
EDISON INTERNATIONAL®
EDISON INTERNATIONAL® 15
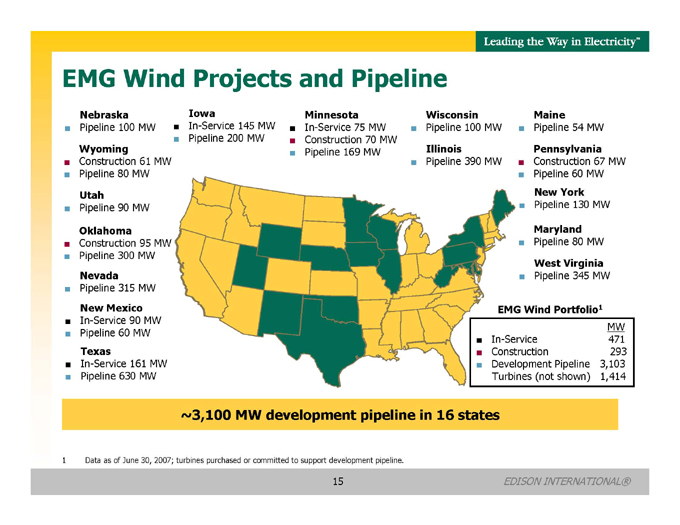
EMG Wind Projects and Pipeline
~3,100 MW development pipeline in 16 states
Oklahoma
Construction 95 MW
Pipeline 300 MW
Texas
In-Service 161 MW
Pipeline 630 MW
New Mexico
In-Service 90 MW
Pipeline 60 MW
MW
In-Service 471
Construction 293
Development Pipeline 3,103
Turbines (not shown) 1,414
EMG Wind Portfolio1
Nebraska
Pipeline 100 MW
Wyoming
Construction 61 MW
Pipeline 80 MW
Utah
Pipeline 90 MW
Nevada
Pipeline 315 MW
Iowa
In-Service 145 MW
Pipeline 200 MW
Wisconsin
Pipeline 100 MW
Illinois
Pipeline 390 MW
New York
Pipeline 130 MW
Maine
Pipeline 54 MW
Maryland
Pipeline 80 MW
West Virginia
Pipeline 345 MW
Minnesota
In-Service 75 MW
Construction 70 MW
Pipeline 169 MW Pennsylvania
Construction 67 MW
Pipeline 60 MW
1 Data as of June 30, 2007; turbines purchased or committed to support development pipeline.
15
[GRAPHICS APPEARS HERE]
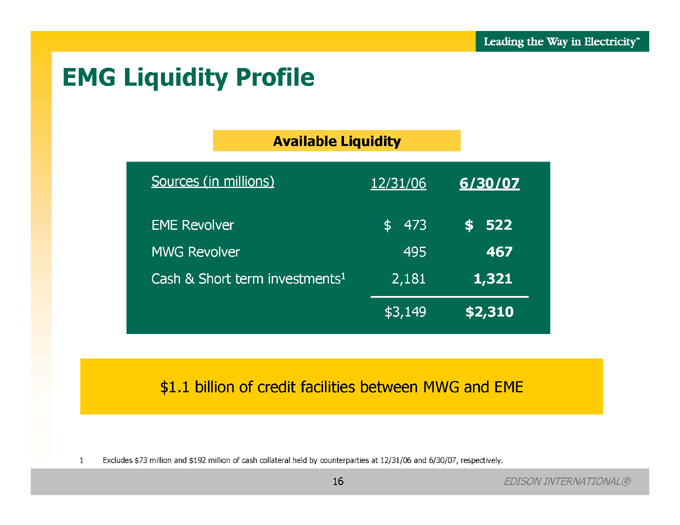
EMG Liquidity Profile
Available Liquidity
Sources (in millions) |
| 12/31/06 |
| 6/30/07 | ||
EME Revolver | $ | 473 | $ | 522 | ||
MWG Revolver |
| 495 |
| 467 | ||
Cash & Short term investments1 |
| 2,181 |
| 1,321 | ||
$ | 3,149 | $ | 2,310 |
$1.1 billion of credit facilities between MWG and EME
1 |
| Excludes $73 million and $192 million of cash collateral held by counterparties at 12/31/06 and 6/30/07, respectively. |
EDISON INTERNATIONAL®