Exhibit 99.1
Business Update
September-October 2007
September 11, 2007 EDISON INTERNATIONAL®
Forward-Looking Statements
Statements contained in this presentation about future performance, including, without limitation, earnings, asset and rate base growth, load growth, capital investments, and other statements that are not purely historical, are forward-looking statements. These forward-looking statements reflect our current expectations; however, such statements involve risks and uncertainties. Actual results could differ materially from current expectations. Important factors that could cause different results are discussed under the headings “Risk Factors” and “Management’s Discussion and Analysis” in Edison International’s 2006 Form 10-K and subsequent reports filed with the Securities and Exchange Commission and available on our website: www.edison.com. These forward-looking statements represent our expectations only as of the date of this presentation, and Edison International assumes no duty to update them to reflect new information, events or circumstances.
September 11, 2007 1 EDISON INTERNATIONAL®
Strategic Overview
September 11, 2007 2 EDISON INTERNATIONAL®
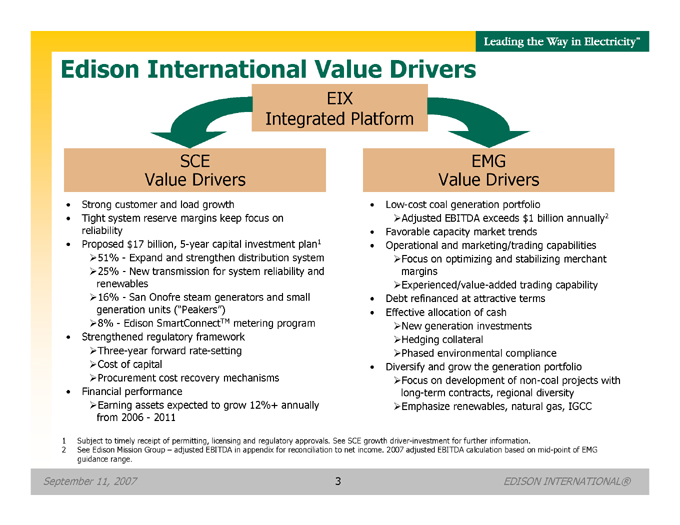
Edison International Value Drivers
EIX Integrated Platform
SCE Value Drivers
Strong customer and load growth
Tight system reserve margins keep focus on reliability
Proposed $17 billion, 5-year capital investment plan1
51%—Expand and strengthen distribution system
25%—New transmission for system reliability and renewables
16%—San Onofre steam generators and small generation units (“Peakers”)
8%—Edison SmartConnectTM metering program
Strengthened regulatory framework
Three-year forward rate-setting
Cost of capital
Procurement cost recovery mechanisms
Financial performance
Earning assets expected to grow 12%+ annually from 2006—2011
EMG Value Drivers
Low-cost coal generation portfolio
Adjusted EBITDA exceeds $1 billion annually2
Favorable capacity market trends
Operational and marketing/trading capabilities
Focus on optimizing and stabilizing merchant margins
Experienced/value-added trading capability
Debt refinanced at attractive terms
Effective allocation of cash
New generation investments
Hedging collateral
Phased environmental compliance
Diversify and grow the generation portfolio
Focus on development of non-coal projects with long-term contracts, regional diversity
Emphasize renewables, natural gas, IGCC
1 Subject to timely receipt of permitting, licensing and regulatory approvals. See SCE growth driver-investment for further information.
2 See Edison Mission Group – adjusted EBITDA in appendix for reconciliation to net income. 2007 adjusted EBITDA calculation based on mid-point of EMG guidance range.
September 11, 2007 3 EDISON INTERNATIONAL®
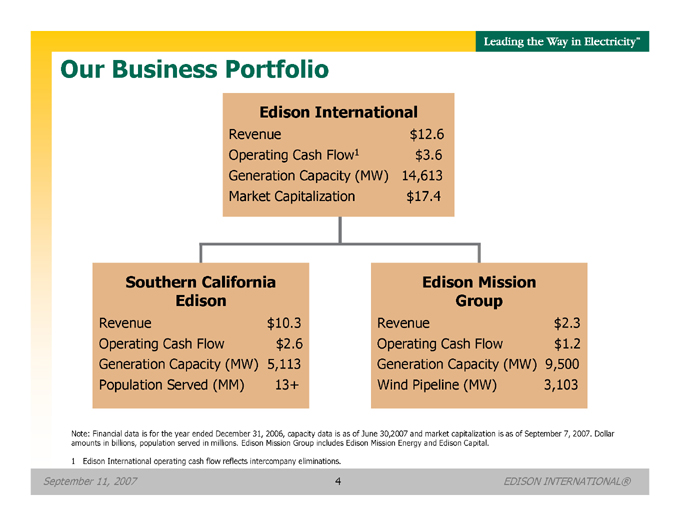
Our Business Portfolio
Edison International
Revenue $12.6 Operating Cash Flow1 $3.6 Generation Capacity (MW) 14,613 Market Capitalization $17.4
Southern California Edison
Revenue $10.3 Operating Cash Flow $2.6 Generation Capacity (MW) 5,113 Population Served (MM) 13+
Edison Mission Group
Revenue $2.3 Operating Cash Flow $1.2 Generation Capacity (MW) 9,500 Wind Pipeline (MW) 3,103
Note: Financial data is for the year ended December 31, 2006, capacity data is as of June 30, 2007 and market capitalization is as of September 7, 2007. Dollar amounts in billions, population served in millions. Edison Mission Group includes Edison Mission Energy and Edison Capital.
1 | | Edison International operating cash flow reflects intercompany eliminations. |
September 11, 2007 4 EDISON INTERNATIONAL®
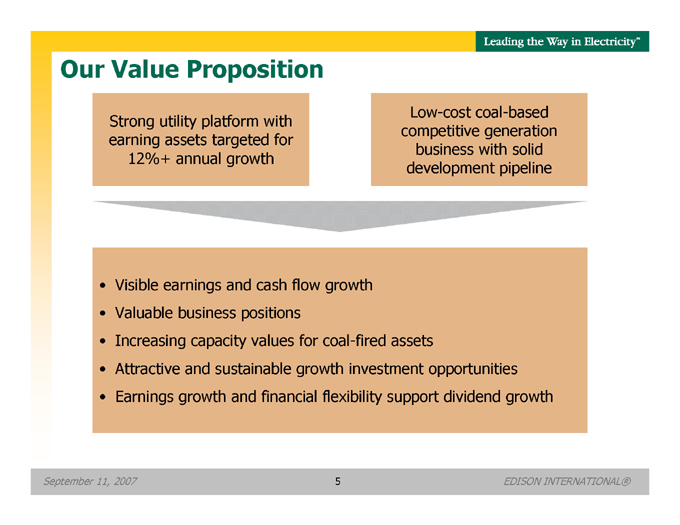
Our Value Proposition
Strong utility platform with earning assets targeted for 12%+ annual growth
Low-cost coal-based competitive generation business with solid development pipeline
Visible earnings and cash flow growth
Valuable business positions
Increasing capacity values for coal-fired assets
Attractive and sustainable growth investment opportunities
Earnings growth and financial flexibility support dividend growth
September 11, 2007 5 EDISON INTERNATIONAL®
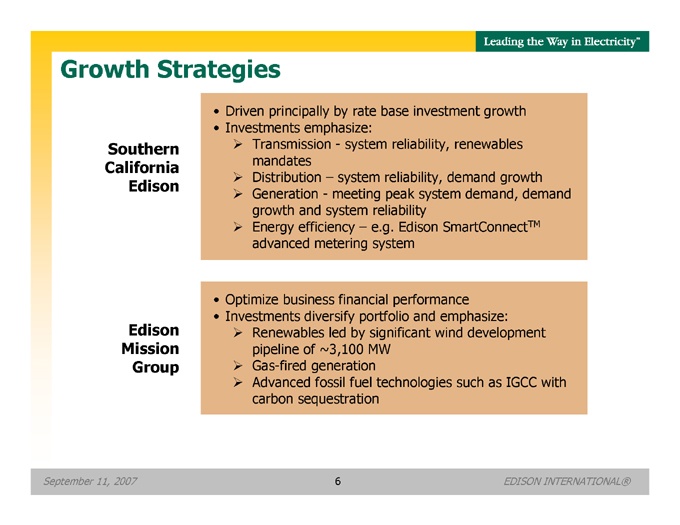
Growth Strategies
Southern California Edison
Driven principally by rate base investment growth
Investments emphasize:
Transmission—system reliability, renewables mandates
Distribution – system reliability, demand growth
Generation—meeting peak system demand, demand growth and system reliability
Energy efficiency – e.g. Edison SmartConnectTM advanced metering system
Edison Mission Group
Optimize business financial performance
Investments diversify portfolio and emphasize:
Renewables led by significant wind development pipeline of ~3,100 MW
Gas-fired generation
Advanced fossil fuel technologies such as IGCC with carbon sequestration
September 11, 2007 6 EDISON INTERNATIONAL®
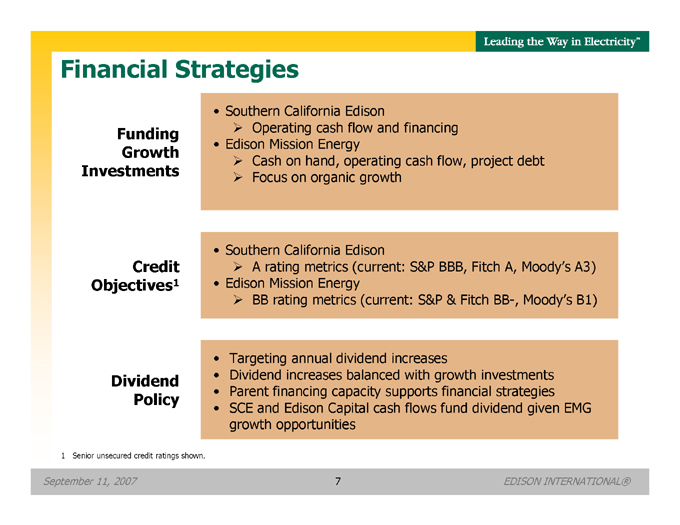
Financial Strategies
Funding Growth Investments
Southern California Edison
Operating cash flow and financing
Edison Mission Energy
Cash on hand, operating cash flow, project debt
Focus on organic growth
Credit Objectives1
Southern California Edison
A rating metrics (current: S&P BBB, Fitch A, Moody’s A3)
Edison Mission Energy
BB rating metrics (current: S&P & Fitch BB-, Moody’s B1)
Dividend Policy
Targeting annual dividend increases
Dividend increases balanced with growth investments
Parent financing capacity supports financial strategies
SCE and Edison Capital cash flows fund dividend given EMG growth opportunities
1 | | Senior unsecured credit ratings shown. |
September 11, 2007 7 EDISON INTERNATIONAL®
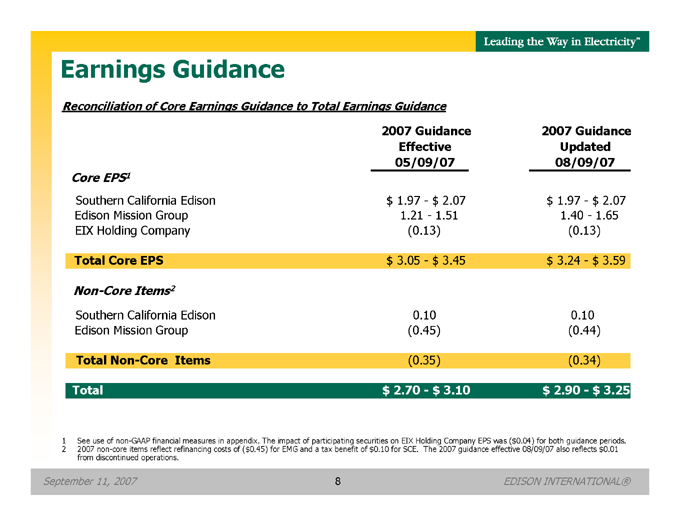
Earnings Guidance
Reconciliation of Core Earnings Guidance to Total Earnings Guidance
2007 Guidance 2007 Guidance
Effective Updated
05/09/07 08/09/07
Core EPS1
Southern California Edison $ 1.97—$ 2.07 $ 1.97—$ 2.07
Edison Mission Group 1.21— 1.51 1.40— 1.65
EIX Holding Company (0.13) (0.13)
Total Core EPS $ 3.05—$ 3.45 $ 3.24—$ 3.59
Non-Core Items 2
Southern California Edison 0.10 0.10
Edison Mission Group (0.45) (0.44)
Total Non-Core Items (0.35) (0.34)
Total $ 2.70—$ 3.10 $ 2.90—$ 3.25
1 See use of non-GAAP financial measures in appendix. The impact of participating securities on EIX Holding Company EPS was ($0.04) for both guidance periods.
2 2007 non-core items reflect refinancing costs of ($0.45) for EMG and a tax benefit of $0.10 for SCE. The 2007 guidance effective 08/09/07 also reflects $0.01 from discontinued operations.
September 11, 2007 8 EDISON INTERNATIONAL®

Southern California Edison (SCE)
An Investor-Owned Electric Utility
September 11, 2007 9 EDISON INTERNATIONAL®
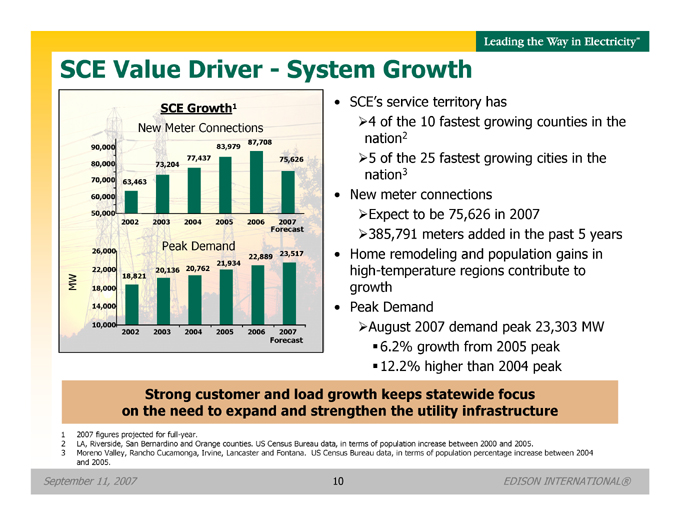
SCE Value Driver—System Growth
SCE Growth1
New Meter Connections
87,708
90,000 83,979
77,437 75,626
80,000 73,204
70,000 63,463
60,000
50,000
2002 2003 2004 2005 2006 2007
Forecast
26,000 Peak Demand
22,889 23,517
21,934
22,000 20,136 20,762
18,821
MW 18,000
14,000
10,000
2002 2003 2004 2005 2006 2007
Forecast
SCE’s service territory has
4 | | of the 10 fastest growing counties in the nation2 |
5 | | of the 25 fastest growing cities in the nation3 New meter connections |
Expect to be 75,626 in 2007
385,791 meters added in the past 5 years Home remodeling and population gains in high-temperature regions contribute to growth Peak Demand
August 2007 demand peak 23,303 MW 6.2% growth from 2005 peak 12.2% higher than 2004 peak
Strong customer and load growth keeps statewide focus on the need to expand and strengthen the utility infrastructure
1 | | 2007 figures projected for full-year. |
2 LA, Riverside, San Bernardino and Orange counties. US Census Bureau data, in terms of population increase between 2000 and 2005.
3 Moreno Valley, Rancho Cucamonga, Irvine, Lancaster and Fontana. US Census Bureau data, in terms of population percentage increase between 2004 and 2005.
September 11, 2007 10 EDISON INTERNATIONAL®

SCE Value Driver—Reliability
State law mandates that SCE serve 20% of its customers’ electricity needs with renewable energy by 2010
SCE’s current renewable portfolio (2006 data)
Renewable resources ~13 billion kWh
Represents ~17% of customer power deliveries
SCE’s 2010 renewable resources target ~16 billion kWh
Completed four renewable power solicitations to date; 2007 solicitation to be finalized by 2Q08
SCE – the nation’s leading renewable energy purchaser in 2006
Agreement with Alta Windpower Development LLC
Secures at least 1,500 MW of power, more than doubling SCE’s wind portfolio
The wind project, when completed, will be twice the size of the largest wind project in the U.S.
Projects to be built in Tehachapi, California
Expanded Geothermal Agreement with Calpine
SCE expanded agreement to purchase 225 MW of geothermal energy for 10 years
SCE entered into a new agreement for 714 MW of non-renewable capacity for 2008 – 2011
SCE signs largest wind energy contract in U.S. history & expands geothermal agreement
September 11, 2007 11 EDISON INTERNATIONAL®
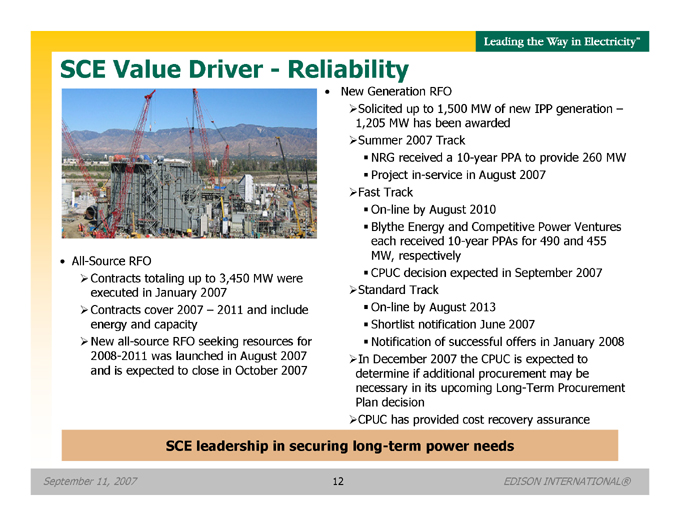
SCE Value Driver—Reliability
All-Source RFO
Contracts totaling up to 3,450 MW were executed in January 2007
Contracts cover 2007 – 2011 and include energy and capacity
New all-source RFO seeking resources for 2008-2011 was launched in August 2007 and is expected to close in October 2007
New Generation RFO
Solicited up to 1,500 MW of new IPP generation –1,205 MW has been awarded
Summer 2007 Track
NRG received a 10-year PPA to provide 260 MW Project in-service in August 2007
Fast Track
On-line by August 2010
Blythe Energy and Competitive Power Ventures each received 10-year PPAs for 490 and 455 MW, respectively CPUC decision expected in September 2007
Standard Track
On-line by August 2013 Shortlist notification June 2007
Notification of successful offers in January 2008
In December 2007 the CPUC is expected to determine if additional procurement may be necessary in its upcoming Long-Term Procurement Plan decision
CPUC has provided cost recovery assurance
SCE leadership in securing long-term power needs
September 11, 2007 12 EDISON INTERNATIONAL®
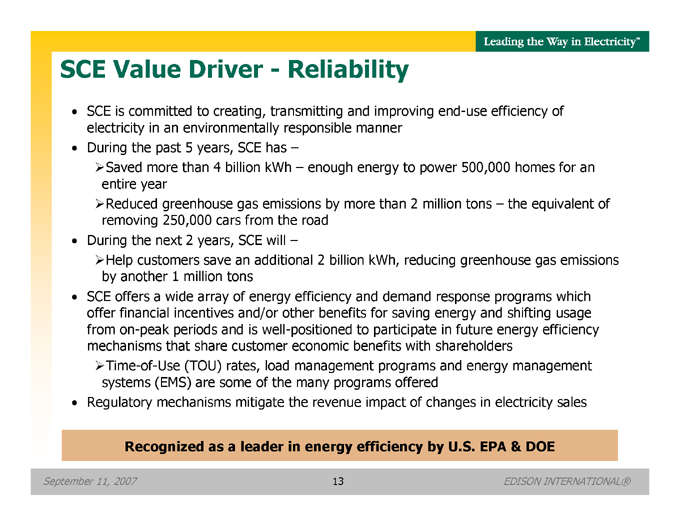
SCE Value Driver—Reliability
SCE is committed to creating, transmitting and improving end-use efficiency of electricity in an environmentally responsible manner
During the past 5 years, SCE has –
Saved more than 4 billion kWh – enough energy to power 500,000 homes for an entire year
Reduced greenhouse gas emissions by more than 2 million tons – the equivalent of removing 250,000 cars from the road
During the next 2 years, SCE will –
Help customers save an additional 2 billion kWh, reducing greenhouse gas emissions by another 1 million tons
SCE offers a wide array of energy efficiency and demand response programs which offer financial incentives and/or other benefits for saving energy and shifting usage from on-peak periods and is well-positioned to participate in future energy efficiency mechanisms that share customer economic benefits with shareholders
Time-of-Use (TOU) rates, load management programs and energy management systems (EMS) are some of the many programs offered
Regulatory mechanisms mitigate the revenue impact of changes in electricity sales
Recognized as a leader in energy efficiency by U.S. EPA & DOE
September 11, 2007 13 EDISON INTERNATIONAL®
SCE Growth Driver—Investment
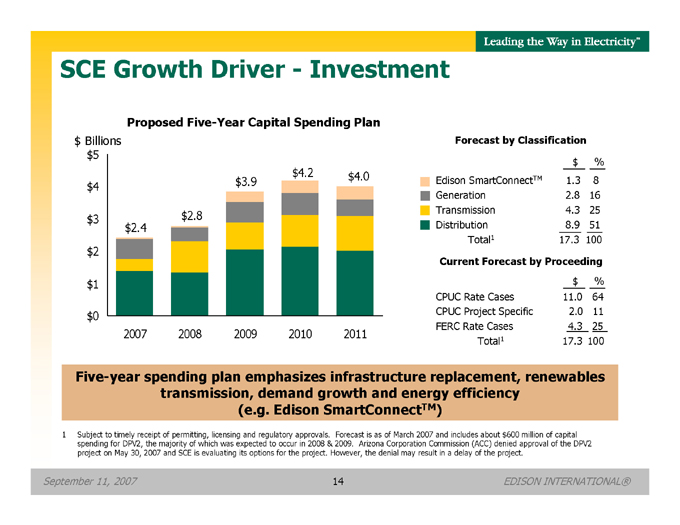
Proposed Five-Year Capital Spending Plan
$ Billions
$ 5
$ 4.2 $ 4.0
$ 4 $ 3.9
$ 3 $ 2.8
$ 2.4
$ 2
$ 1
$ 0
2007 2008 2009 2010 2011
Forecast by Classification
$ %
Edison SmartConnectTM 1.3 8
Generation 2.8 16
Transmission 4.3 25
Distribution 8.9 51
Total1 17.3 100
Current Forecast by Proceeding
$ %
CPUC Rate Cases 11.0 64
CPUC Project Specific 2.0 11
FERC Rate Cases 4.3 25
Total1 17.3 100
Five-year spending plan emphasizes infrastructure replacement, renewables transmission, demand growth and energy efficiency (e.g. Edison SmartConnectTM)
1 Subject to timely receipt of permitting, licensing and regulatory approvals. Forecast is as of March 2007 and includes about $600 million of capital spending for DPV2, the majority of which was expected to occur in 2008 & 2009. Arizona Corporation Commission (ACC) denied approval of the DPV2 project on May 30, 2007 and SCE is evaluating its options for the project. However, the denial may result in a delay of the project.
September 11, 2007 14 EDISON INTERNATIONAL®
SCE Growth Driver—Investment
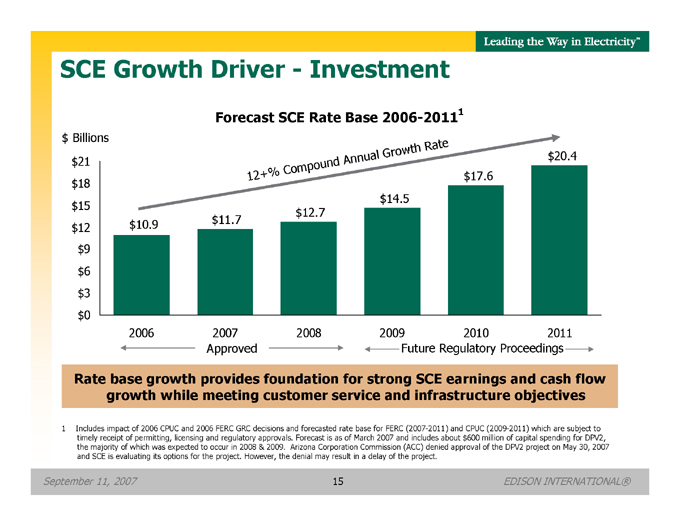
Forecast SCE Rate Base 2006-20111
$ Billions
$ 20.4
$ 21
$ 17.6
$ 18
$ 14.5
$ 15
$ 12.7
$ 10.9 $ 11.7
$ 12
$ 9
$ 6
$ 3
$ 0
1 2 + % COMPOUND ANNUAL GROWTH RATE
2006 2007 2008 2009 2010 2011
Approved Future Regulatory Proceedings
Rate base growth provides foundation for strong SCE earnings and cash flow growth while meeting customer service and infrastructure objectives
1 Includes impact of 2006 CPUC and 2006 FERC GRC decisions and forecasted rate base for FERC (2007-2011) and CPUC (2009-2011) which are subject to timely receipt of permitting, licensing and regulatory approvals. Forecast is as of March 2007 and includes about $600 million of capital spending for DPV2, the majority of which was expected to occur in 2008 & 2009. Arizona Corporation Commission (ACC) denied approval of the DPV2 project on May 30, 2007 and SCE is evaluating its options for the project. However, the denial may result in a delay of the project.
September 11, 2007 15 EDISON INTERNATIONAL®
SCE Value Driver—Capital Investment
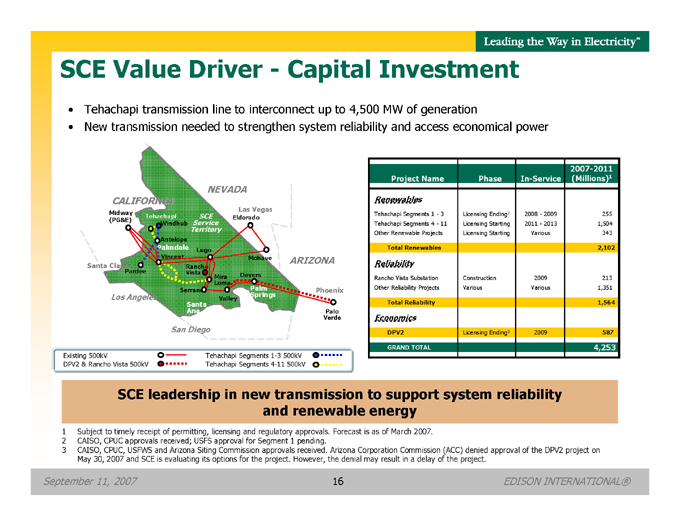
Tehachapi transmission line to interconnect up to 4,500 MW of generation
New transmission needed to strengthen system reliability and access economical power
NEVADA CALIFORNIA
Las Vegas
Midway
Tehachapi SCE Eldorado
(PG&E) Service
Windhub
Territory
Antelope
Palmdale Lugo
Vincent Mohave ARIZONA
Santa Clarita Rancho Pardee Vista
Mira Devers Loma
Serrano Palm Phoenix
Los Angeles Springs
Valley
Santa
Ana Palo Verde
San Diego
2007-2011
Project Name Phase In-Service (Millions)1
Renewables
Tehachapi Segments 1—3 Licensing Ending2 2008—2009 255
Tehachapi Segments 4—11 Licensing Starting 2011—2013 1,504
Other Renewable Projects Licensing Starting Various 343
Total Renewables 2,102
Reliability
Rancho Vista Substation Construction 2009 213
Other Reliability Projects Various Various 1,351
Total Reliability 1,564
Economics
DPV2 Licensing Ending3 2009 587
GRAND TOTAL 4,253
Existing 500kV Tehachapi Segments 1-3 500kV DPV2 & Rancho Vista 500kV Tehachapi Segments 4-11 500kV
SCE leadership in new transmission to support system reliability and renewable energy
1 | | Subject to timely receipt of permitting, licensing and regulatory approvals. Forecast is as of March 2007. |
2 | | CAISO, CPUC approvals received; USFS approval for Segment 1 pending. |
3 CAISO, CPUC, USFWS and Arizona Siting Commission approvals received. Arizona Corporation Commission (ACC) denied approval of the DPV2 project on May 30, 2007 and SCE is evaluating its options for the project. However, the denial may result in a delay of the project.
September 11, 2007 16 EDISON INTERNATIONAL®
SCE Value Driver—Capital Investment
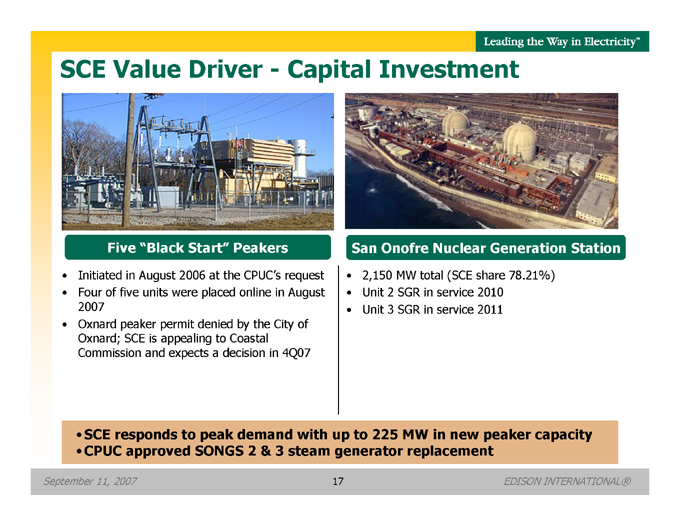
Five “Black Start” Peakers
Initiated in August 2006 at the CPUC’s request
Four of five units were placed online in August 2007
Oxnard peaker permit denied by the City of Oxnard; SCE is appealing to Coastal Commission and expects a decision in 4Q07
San Onofre Nuclear Generation Station
2,150 MW total (SCE share 78.21%)
Unit 2 SGR in service 2010
Unit 3 SGR in service 2011
SCE responds to peak demand with up to 225 MW in new peaker capacity CPUC approved SONGS 2 & 3 steam generator replacement
September 11, 2007 17 EDISON INTERNATIONAL®
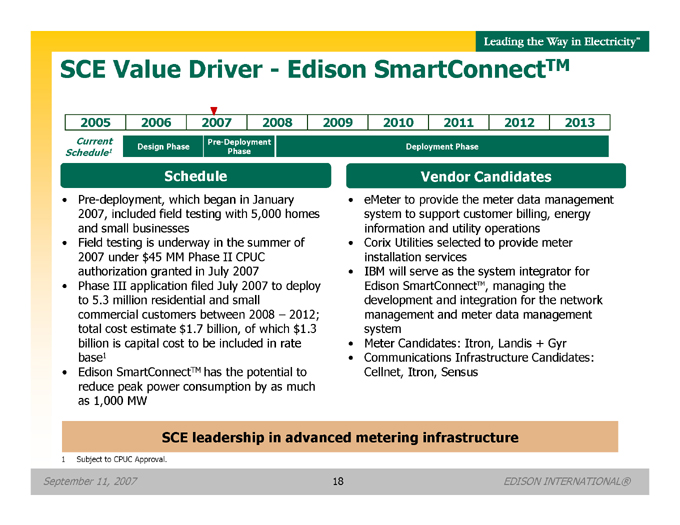
SCE Value Driver—Edison SmartConnectTM
2005 2006 2007 2008 2009 2010 2011 2012 2013
Current Schedule1 Pre-Deployment Phase
Design Phase Deployment Phase
Schedule
Pre-deployment, which began in January 2007, included field testing with 5,000 homes and small businesses
Field testing is underway in the summer of 2007 under $45 MM Phase II CPUC authorization granted in July 2007
Phase III application filed July 2007 to deploy to 5.3 million residential and small commercial customers between 2008 – 2012; total cost estimate $1.7 billion, of which $1.3 billion is capital cost to be included in rate base1
Edison SmartConnectTM has the potential to reduce peak power consumption by as much as 1,000 MW
Vendor Candidates
eMeter to provide the meter data management system to support customer billing, energy information and utility operations
Corix Utilities selected to provide meter installation services
IBM will serve as the system integrator for Edison SmartConnectTM, managing the development and integration for the network management and meter data management system
Meter Candidates: Itron, Landis + Gyr
Communications Infrastructure Candidates: Cellnet, Itron, Sensus
SCE leadership in advanced metering infrastructure
1 | | Subject to CPUC Approval. |
September 11, 2007 18 EDISON INTERNATIONAL®
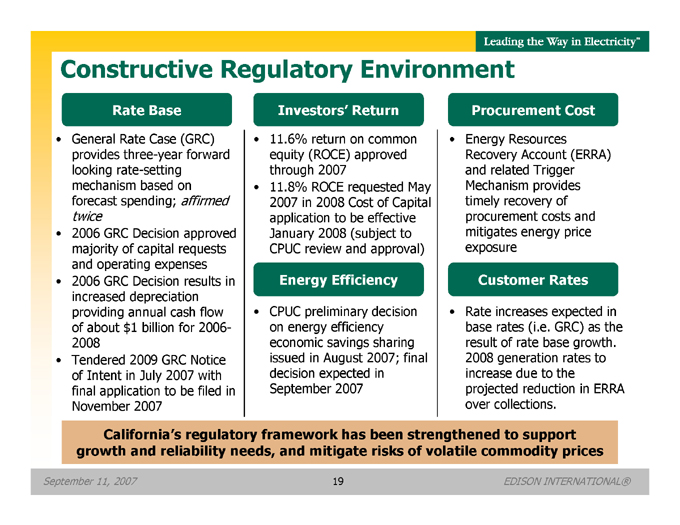
Constructive Regulatory Environment
Rate Base
General Rate Case (GRC) provides three-year forward looking rate-setting mechanism based on forecast spending; affirmed twice
2006 GRC Decision approved majority of capital requests and operating expenses
2006 GRC Decision results in increased depreciation providing annual cash flow of about $1 billion for 2006-2008
Tendered 2009 GRC Notice of Intent in July 2007 with final application to be filed in November 2007
Investors’ Return
11.6% return on common equity (ROCE) approved through 2007
11.8% ROCE requested May 2007 in 2008 Cost of Capital application to be effective January 2008 (subject to CPUC review and approval)
Energy Efficiency
CPUC preliminary decision on energy efficiency economic savings sharing issued in August 2007; final decision expected in September 2007
Procurement Cost
Energy Resources Recovery Account (ERRA) and related Trigger Mechanism provides timely recovery of procurement costs and mitigates energy price exposure
Customer Rates
Rate increases expected in base rates (i.e. GRC) as the result of rate base growth. 2008 generation rates to increase due to the projected reduction in ERRA over collections.
California’s regulatory framework has been strengthened to support growth and reliability needs, and mitigate risks of volatile commodity prices
September 11, 2007 19 EDISON INTERNATIONAL®
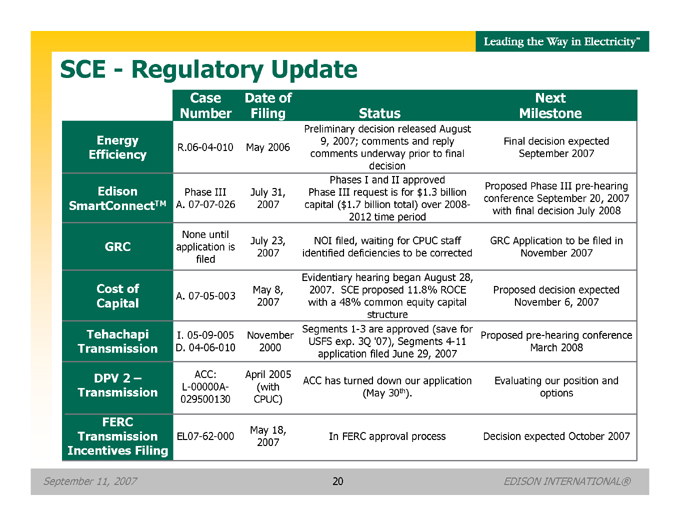
Case Date of Next
Number Filing Status Milestone
Preliminary decision released August
Energy 9, 2007; comments and reply Final decision expected
R.06-04-010 May 2006
Efficiency comments underway prior to final September 2007
decision
Phases I and II approved
Edison Proposed Phase III pre-hearing
Phase III July 31, Phase III request is for $1.3 billion
conference September 20, 2007
SmartConnectTM A. 07-07-026 2007 capital ($1.7 billion total) over 2008-
with final decision July 2008
2012 time period
None until
July 23, NOI filed, waiting for CPUC staff GRC Application to be filed in
GRC application is
2007 identified deficiencies to be corrected November 2007
filed
Evidentiary hearing began August 28,
Cost of May 8, 2007. SCE proposed 11.8% ROCE Proposed decision expected
A. 07-05-003
Capital 2007 with a 48% common equity capital November 6, 2007
structure
Tehachapi Segments 1-3 are approved (save for
I. 05-09-005 November Proposed pre-hearing conference
USFS exp. 3Q ‘07), Segments 4-11
Transmission D. 04-06-010 2000 March 2008
application filed June 29, 2007
DPV 2 – ACC: April 2005
ACC has turned down our application Evaluating our position and
L-00000A- (with
Transmission (May 30th). options
029500130 CPUC)
FERC
May 18,
Transmission EL07-62-000 In FERC approval process Decision expected October 2007
2007
Incentives Filing
SCE—Regulatory Update
September 11, 2007 20 EDISON INTERNATIONAL®
Edison Mission Group (EMG)
A Competitive Power Generation Company
September 11, 2007 21 EDISON INTERNATIONAL®
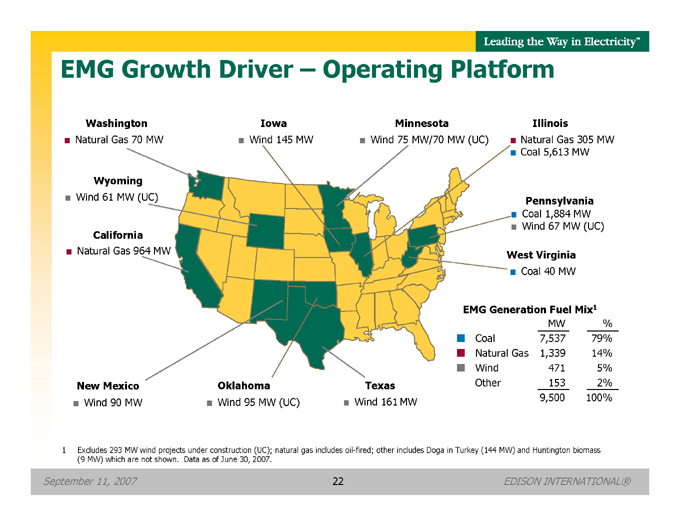
EMG Growth Driver – Operating Platform
Washington Iowa Minnesota Illinois
Natural Gas 70 MW Wind 145 MW Wind 75 MW/70 MW (UC) Natural Gas 305 MW
Coal 5,613 MW
Wyoming
Wind 61 MW (UC) Pennsylvania
Coal 1,884 MW
Wind 67 MW (UC)
California
Natural Gas 964 MW West Virginia
Coal 40 MW
New Mexico Oklahoma Texas
Wind 90 MW Wind 95 MW (UC) Wind 161 MW
EMG Generation Fuel Mix1
MW
%
Coal
7,537
79%
Natural Gas
1,339
14%
Wind
471
5%
Other
153
2%
9,500
100%
1 Excludes 293 MW wind projects under construction (UC); natural gas includes oil-fired; other includes Doga in Turkey (144 MW) and Huntington biomass (9 MW) which are not shown. Data as of June 30, 2007.
September 11, 2007 22 EDISON INTERNATIONAL®

EMG—Key Value Drivers
Low-cost coal generation driver for strong adjusted EBITDA
EMG adjusted EBITDA in excess of $1 billion for last two years, also forecasted for 20071
Strong operational and marketing/trading capabilities
Effective management of fuel, transportation, and emissions to protect gross margins
More efficient and expanding market/hedging opportunities
Experienced/value adding trading business
Long-term environmental plan for Midwest Generation
Financial flexibility with simplified capital structure
EMG liquidy2 – $2.3 billion as of June 30, 2007
Recent financing eliminates near-term maturities and high interest rate notes
Expanding capital expenditures – $1.9 billion estimated through 2009
Expansion and diversification goals
Larger scale and operational efficiencies
Greater diversification of generation technology and fuel type
Bias towards development, contract vs. merchant, low emission technologies
Focus areas – renewables, natural gas, IGCC
1 See Edison Mission Group – adjusted EBITDA in appendix for reconciliation to net income; 2007 adjusted EBITDA calculation based on mid-point of EMG guidance range.
2 | | See EMG liquidity profile. |
September 11, 2007 23 EDISON INTERNATIONAL®
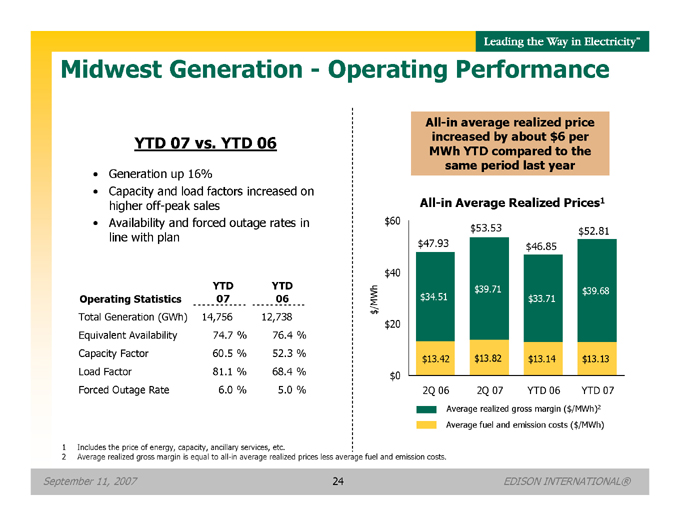
Midwest Generation—Operating Performance
YTD 07 vs. YTD 06
Generation up 16%
Capacity and load factors increased on higher off-peak sales
Availability and forced outage rates in line with plan
YTD YTD
Operating Statistics 07 06
Total Generation (GWh) 14,756 12,738
Equivalent Availability 74.7 % 76.4 %
Capacity Factor 60.5 % 52.3 %
Load Factor 81.1 % 68.4 %
Forced Outage Rate 6.0 % 5.0 %
All-in average realized price increased by about $6 per MWh YTD compared to the same period last year
All-in Average Realized Prices1
$60 $53.53 $52.81 $47.93 $46.85 $40 $39.71 $39.68 /MWh $34.51 $33.71 $ $20
$13.42 $13.82 $13.14 $13.13 $0 2Q 06 2Q 07 YTD 06 YTD 07
Average realized gross margin ($/MWh)2 Average fuel and emission costs ($/MWh)
1 | | Includes the price of energy, capacity, ancillary services, etc. |
2 | | Average realized gross margin is equal to all-in average realized prices less average fuel and emission costs. |
September 11, 2007 24 EDISON INTERNATIONAL®
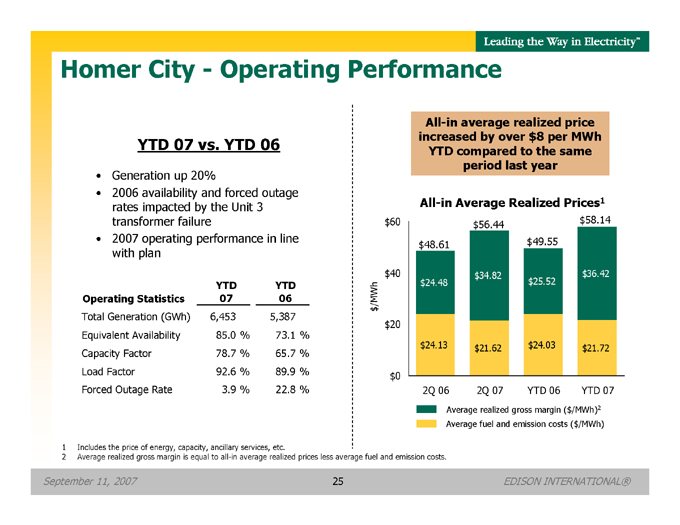
Homer City—Operating Performance
YTD 07 vs. YTD 06
Generation up 20%
2006 availability and forced outage rates impacted by the Unit 3 transformer failure
2007 operating performance in line with plan
YTD YTD
Operating Statistics 07 06
Total Generation (GWh) 6,453 5,387
Equivalent Availability 85.0 % 73.1 %
Capacity Factor 78.7 % 65.7 %
Load Factor 92.6 % 89.9 %
Forced Outage Rate 3.9 % 22.8 %
All-in average realized price increased by over $8 per MWh YTD compared to the same period last year
All-in Average Realized Prices1
$ 60 $ 56.44 $ 58.14
$ 48.61 $ 49.55
$ 40 $ 34.82 $ 36.42
$ 24.48 $ 25.52
/MWh
$
$ 20
$ 24.13 $ 21.62 $ 24.03 $ 21.72
$ 0
2Q 06 2Q 07 YTD 06 YTD 07
Average realized gross margin ($/MWh)2
Average fuel and emission costs ($/MWh)
1 | | Includes the price of energy, capacity, ancillary services, etc. |
2 | | Average realized gross margin is equal to all-in average realized prices less average fuel and emission costs. |
September 11, 2007 25 EDISON INTERNATIONAL®
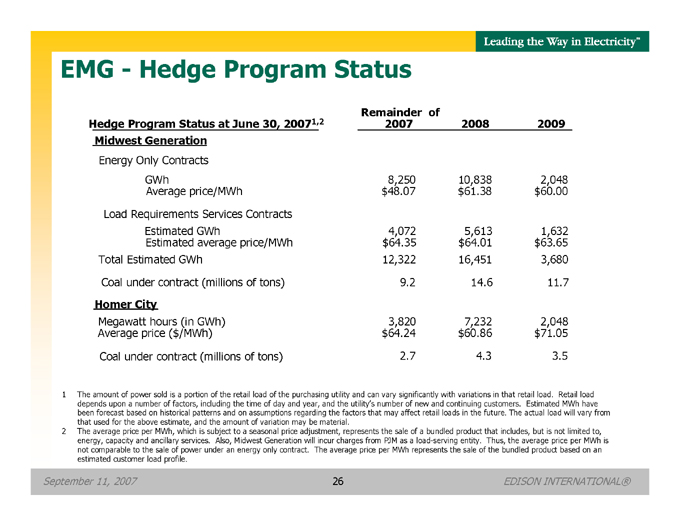
EMG—Hedge Program Status
Remainder of
Hedge Program Status at June 30, 20071,2 2007 2008 2009
Midwest Generation
Energy Only Contracts
GWh 8,250 10,838 2,048
Average price/MWh $ 48.07 $ 61.38 $ 60.00
Load Requirements Services Contracts
Estimated GWh 4,072 5,613 1,632
Estimated average price/MWh $ 64.35 $ 64.01 $ 63.65
Total Estimated GWh 12,322 16,451 3,680
Coal under contract (millions of tons) 9.2 14.6 11.7
Homer City
Megawatt hours (in GWh) 3,820 7,232 2,048
Average price ($/MWh) $ 64.24 $ 60.86 $ 71.05
Coal under contract (millions of tons) 2.7 4.3 3.5
1 The amount of power sold is a portion of the retail load of the purchasing utility and can vary significantly with variations in that retail load. Retail load depends upon a number of factors, including the time of day and year, and the utility’s number of new and continuing customers. Estimated MWh have been forecast based on historical patterns and on assumptions regarding the factors that may affect retail loads in the future. The actual load will vary from that used for the above estimate, and the amount of variation may be material.
2 The average price per MWh, which is subject to a seasonal price adjustment, represents the sale of a bundled product that includes, but is not limited to, energy, capacity and ancillary services. Also, Midwest Generation will incur charges from PJM as a load-serving entity. Thus, the average price per MWh is not comparable to the sale of power under an energy only contract. The average price per MWh represents the sale of the bundled product based on an estimated customer load profile.
September 11, 2007 26 EDISON INTERNATIONAL®
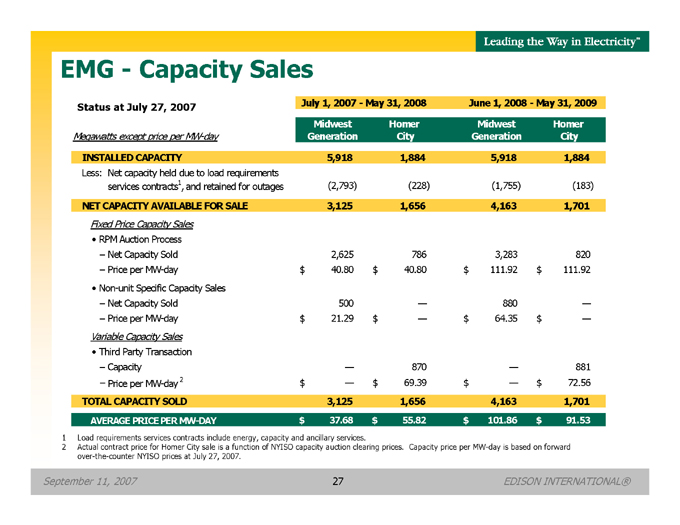
EMG—Capacity Sales
Status at July 27, 2007 July 1, 2007—May 31, 2008 June 1, 2008—May 31, 2009
Midwest Homer Midwest Homer
Megawatts except price per MW-day Generation City Generation City
INSTALLED CAPACITY 5,918 1,884 5,918 1,884
Less: Net capacity held due to load requirements
services contracts1, and retained for outages (2,793) (228) (1,755) (183)
NET CAPACITY AVAILABLE FOR SALE 3,125 1,656 4,163 1,701
Fixed Price Capacity Sales
RPM Auction Process
– Net Capacity Sold 2,625 786 3,283 820
– Price per MW-day $ 40.80 $ 40.80 $ 111.92 $ 111.92
Non-unit Specific Capacity Sales
– Net Capacity Sold 500 — 880 —
– Price per MW-day $ 21.29 $ — $ 64.35 $ —
Variable Capacity Sales
Third Party Transaction
– Capacity — 870 — 881
– Price per MW-day 2 $ — $ 69.39 $ — $ 72.56
TOTAL CAPACITY SOLD 3,125 1,656 4,163 1,701
AVERAGE PRICE PER MW-DAY $ 37.68 $ 55.82 $ 101.86 $ 91.53
1 | | Load requirements services contracts include energy, capacity and ancillary services. |
2 Actual contract price for Homer City sale is a function of NYISO capacity auction clearing prices. Capacity price per MW-day is based on forward over-the-counter NYISO prices at July 27, 2007.
September 11, 2007 27 EDISON INTERNATIONAL®
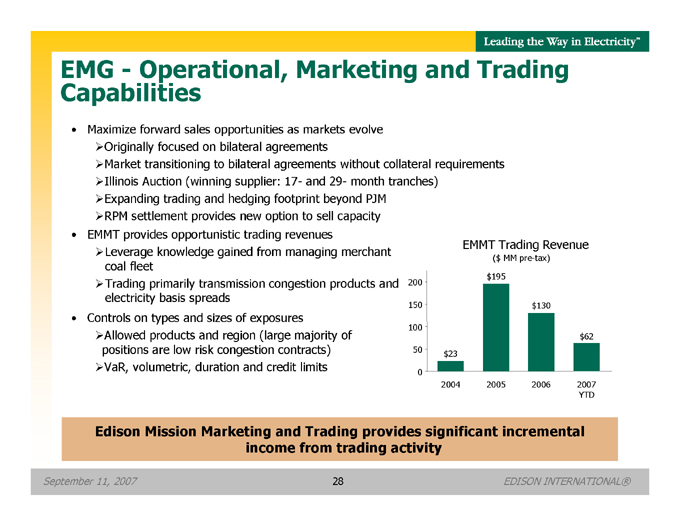
EMG—Operational, Marketing and Trading Capabilities
Maximize forward sales opportunities as markets evolve
Originally focused on bilateral agreements
Market transitioning to bilateral agreements without collateral requirements
Illinois Auction (winning supplier: 17- and 29- month tranches)
Expanding trading and hedging footprint beyond PJM
RPM settlement provides new option to sell capacity
EMMT provides opportunistic trading revenues
Leverage knowledge gained from managing merchant coal fleet
Trading primarily transmission congestion products and electricity basis spreads
Controls on types and sizes of exposures
Allowed products and region (large majority of positions are low risk congestion contracts)
VaR, volumetric, duration and credit limits
EMMT Trading Revenue
($ MM pre-tax)
$ 195
200
150 $ 130
100
$ 62
50 $ 23
0
2004 2005 2006 2007
YTD
Edison Mission Marketing and Trading provides significant incremental income from trading activity
September 11, 2007 28 EDISON INTERNATIONAL®
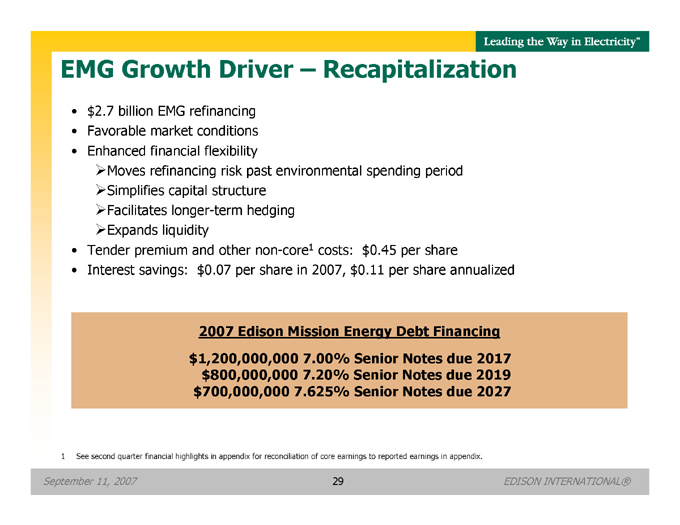
EMG Growth Driver – Recapitalization
$ 2.7 billion EMG refinancing
Favorable market conditions
Enhanced financial flexibility
Moves refinancing risk past environmental spending period
Simplifies capital structure
Facilitates longer-term hedging
Expands liquidity
Tender premium and other non-core1 costs: $0.45 per share
Interest savings: $0.07 per share in 2007, $0.11 per share annualized
2007 Edison Mission Energy Debt Financing $1,200,000,000 7.00% Senior Notes due 2017 $800,000,000 7.20% Senior Notes due 2019 $700,000,000 7.625% Senior Notes due 2027
1 See second quarter financial highlights in appendix for reconciliation of core earnings to reported earnings in appendix.
September 11, 2007 29 EDISON INTERNATIONAL®
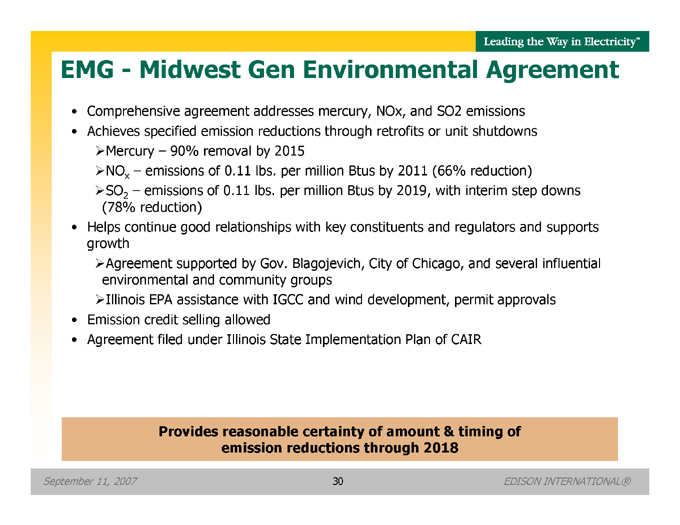
EMG—Midwest Gen Environmental Agreement
Comprehensive agreement addresses mercury, NOx, and SO2 emissions
Achieves specified emission reductions through retrofits or unit shutdowns
Mercury – 90% removal by 2015
NOx – emissions of 0.11 lbs. per million Btus by 2011 (66% reduction)
SO2 – emissions of 0.11 lbs. per million Btus by 2019, with interim step downs
(78% reduction)
Helps continue good relationships with key constituents and regulators and supports growth
Agreement supported by Gov. Blagojevich, City of Chicago, and several influential environmental and community groups
Illinois EPA assistance with IGCC and wind development, permit approvals
Emission credit selling allowed
Agreement filed under Illinois State Implementation Plan of CAIR
Provides reasonable certainty of amount & timing of emission reductions through 2018
September 11, 2007 30 EDISON INTERNATIONAL®
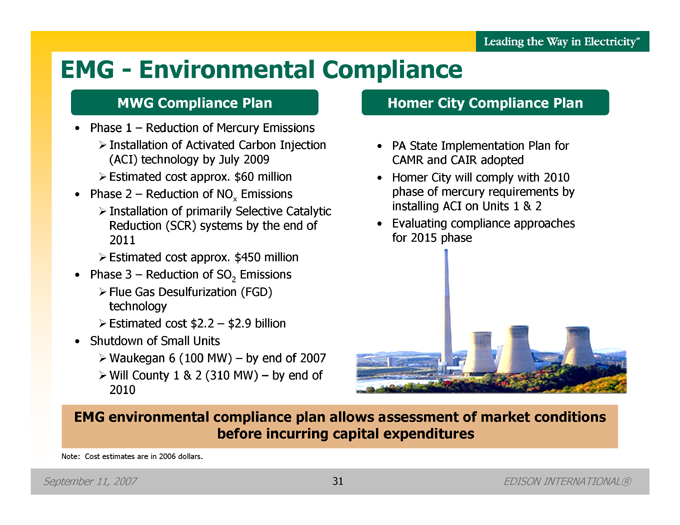
EMG—Environmental Compliance
MWG Compliance Plan
Phase 1 – Reduction of Mercury Emissions
Installation of Activated Carbon Injection (ACI) technology by July 2009
Estimated cost approx. $60 million
Phase 2 – Reduction of NOx Emissions
Installation of primarily Selective Catalytic Reduction (SCR) systems by the end of 2011
Estimated cost approx. $450 million
Phase 3 – Reduction of SO2 Emissions
Flue Gas Desulfurization (FGD) technology
Estimated cost $2.2 – $2.9 billion
Shutdown of Small Units
Waukegan 6 (100 MW) – by end of 2007
Will County 1 & 2 (310 MW) – by end of 2010
Homer City Compliance Plan
PA State Implementation Plan for CAMR and CAIR adopted
Homer City will comply with 2010 phase of mercury requirements by installing ACI on Units 1 & 2
Evaluating compliance approaches for 2015 phase
EMG environmental compliance plan allows assessment of market conditions before incurring capital expenditures
Note: Cost estimates are in 2006 dollars.
September 11, 2007 31 EDISON INTERNATIONAL®
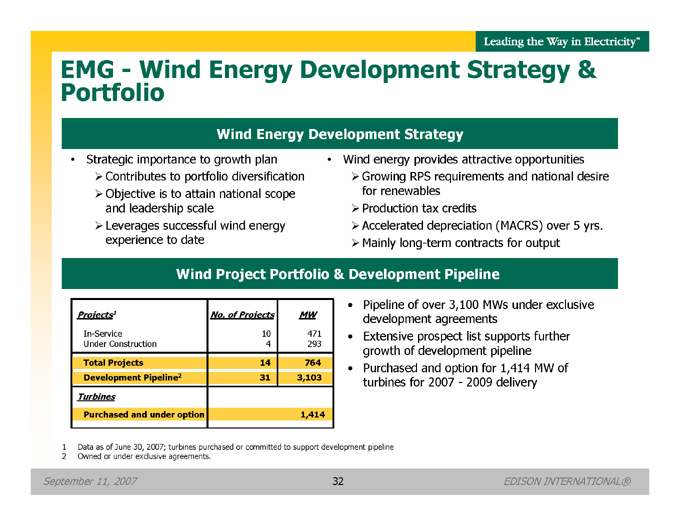
EMG—Wind Energy Development Strategy & Portfolio
Wind Energy Development Strategy
Strategic importance to growth plan
Contributes to portfolio diversification
Objective is to attain national scope and leadership scale
Leverages successful wind energy experience to date
Wind energy provides attractive opportunities
Growing RPS requirements and national desire for renewables
Production tax credits
Accelerated depreciation (MACRS) over 5 yrs.
Mainly long-term contracts for output
Wind Project Portfolio & Development Pipeline
Projects1 No. of Projects MW
In-Service 10 471
Under Construction 4 293
Total Projects 14 764
Development Pipeline2 31 3,103
Turbines
Purchased and under option 1,414
1 | | Data as of June 30, 2007; turbines purchased or committed to support development pipeline |
2 | | Owned or under exclusive agreements. |
Pipeline of over 3,100 MWs under exclusive development agreements Extensive prospect list supports further growth of development pipeline Purchased and option for 1,414 MW of turbines for 2007—2009 delivery
September 11, 2007 32 EDISON INTERNATIONAL®
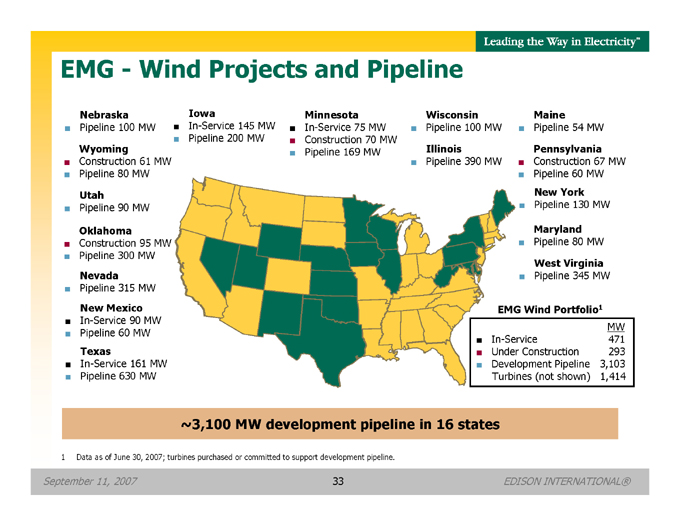
EMG—Wind Projects and Pipeline
Nebraska Iowa Minnesota Wisconsin Maine
Pipeline 100 MW In-Service 145 MW In-Service 75 MW Pipeline 100 MW Pipeline 54 MW
Pipeline 200 MW Construction 70 MW
Wyoming Pipeline 169 MW Illinois Pennsylvania
Construction 61 MW Pipeline 390 MW Construction 67 MW
Pipeline 80 MW Pipeline 60 MW
Utah New York
Pipeline 90 MW Pipeline 130 MW
Oklahoma Maryland
Construction 95 MW Pipeline 80 MW
Pipeline 300 MW
West Virginia
Nevada Pipeline 345 MW
Pipeline 315 MW
New Mexico
In-Service 90 MW
Pipeline 60 MW
Texas
In-Service 161 MW
Pipeline 630 MW
EMG Wind Portfolio 1
MW
In-Service 471
Under Construction 293
Development Pipeline 3,103
Turbines (not shown) 1,414
~3,100 MW development pipeline in 16 states
1 | | Data as of June 30, 2007; turbines purchased or committed to support development pipeline. |
September 11, 2007 33 EDISON INTERNATIONAL®
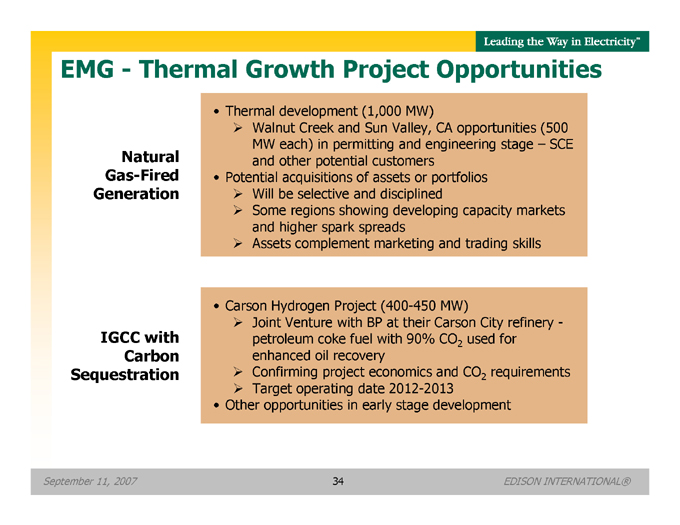
EMG—Thermal Growth Project Opportunities
Natural Gas-Fired Generation
Thermal development (1,000 MW)
Walnut Creek and Sun Valley, CA opportunities (500 MW each) in permitting and engineering stage – SCE and other potential customers
Potential acquisitions of assets or portfolios
Will be selective and disciplined
Some regions showing developing capacity markets and higher spark spreads
Assets complement marketing and trading skills
IGCC with Carbon Sequestration
Carson Hydrogen Project (400-450 MW)
Joint Venture with BP at their Carson City refinery -
petroleum coke fuel with 90% CO2 used for
enhanced oil recovery
Confirming project economics and CO2 requirements
Target operating date 2012-2013
Other opportunities in early stage development
September 11, 2007 34 EDISON INTERNATIONAL®
Appendix
September 11, 2007 35 EDISON INTERNATIONAL®

What’s New Since Our August Update
Strategic Overview
Expanded strategic overview of our business portfolio, value proposition, growth and financial strategies (see pages 2-8)
SCE
New peak demand set August 2007 (see page 10)
SCE Regulatory Update (see page 20)
Appendix
EMG Second Quarter and Year-to-Date Adjusted EBITDA (see pages 41-42)
September 11, 2007 36 EDISON INTERNATIONAL®
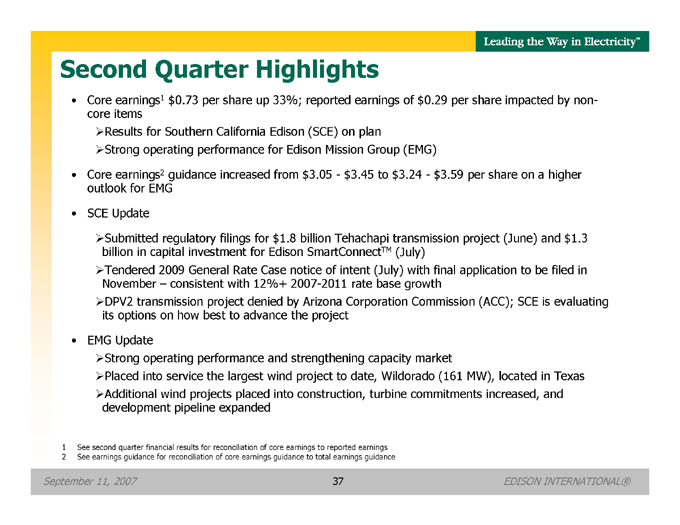
Second Quarter Highlights
Core earnings1 $0.73 per share up 33%; reported earnings of $0.29 per share impacted by non-core items
Results for Southern California Edison (SCE) on plan
Strong operating performance for Edison Mission Group (EMG)
Core earnings2 guidance increased from $3.05—$3.45 to $3.24—$3.59 per share on a higher outlook for EMG
SCE Update
Submitted regulatory filings for $1.8 billion Tehachapi transmission project (June) and $1.3 billion in capital investment for Edison SmartConnectTM (July)
Tendered 2009 General Rate Case notice of intent (July) with final application to be filed in November – consistent with 12%+ 2007-2011 rate base growth
DPV2 transmission project denied by Arizona Corporation Commission (ACC); SCE is evaluating its options on how best to advance the project
EMG Update
Strong operating performance and strengthening capacity market
Placed into service the largest wind project to date, Wildorado (161 MW), located in Texas
Additional wind projects placed into construction, turbine commitments increased, and development pipeline expanded
1 | | See second quarter financial results for reconciliation of core earnings to reported earnings |
2 | | See earnings guidance for reconciliation of core earnings guidance to total earnings guidance |
September 11, 2007 37 EDISON INTERNATIONAL®
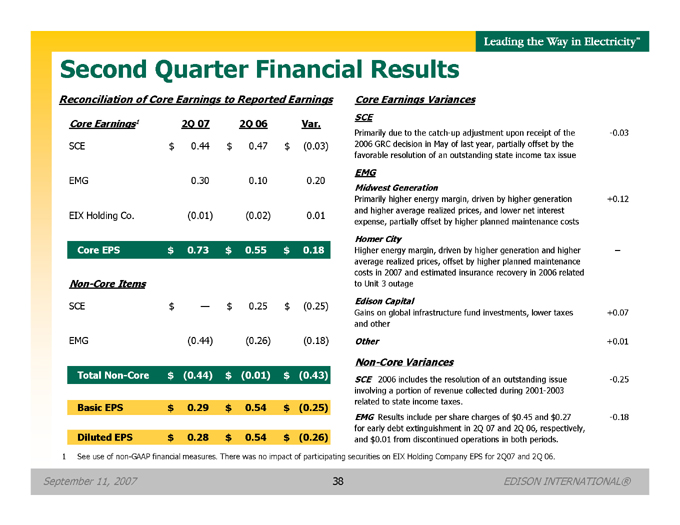
Second Quarter Financial Results
Reconciliation of Core Earnings to Reported Earnings
Core Earnings1 2Q 07 2Q 06 Var.
SCE $ 0.44 $ 0.47 $ (0.03)
EMG 0.30 0.10 0.20
EIX Holding Co. (0.01) (0.02) 0.01
Core EPS $ 0.73 $ 0.55 $ 0.18
Non-Core Items
SCE $ — $ 0.25 $ (0.25)
EMG (0.44) (0.26) (0.18)
Total Non-Core $ (0.44) $ (0.01) $ (0.43)
Basic EPS $ 0.29 $ 0.54 $ (0.25)
Diluted EPS $ 0.28 $ 0.54 $ (0.26)
Core Earnings Variances
SCE
Primarily due to the catch-up adjustment upon receipt of the -0.03
2006 GRC decision in May of last year, partially offset by the
favorable resolution of an outstanding state income tax issue
EMG
Midwest Generation
Primarily higher energy margin, driven by higher generation +0.12
and higher average realized prices, and lower net interest
expense, partially offset by higher planned maintenance costs
Homer City
Higher energy margin, driven by higher generation and higher –
average realized prices, offset by higher planned maintenance
costs in 2007 and estimated insurance recovery in 2006 related
to Unit 3 outage
Edison Capital
Gains on global infrastructure fund investments, lower taxes +0.07
and other
Other +0.01
Non-Core Variances
SCE 2006 includes the resolution of an outstanding issue -0.25
involving a portion of revenue collected during 2001-2003
related to state income taxes.
EMG Results include per share charges of $0.45 and $0.27 -0.18
for early debt extinguishment in 2Q 07 and 2Q 06, respectively,
and $0.01 from discontinued operations in both periods.
1 See use of non-GAAP financial measures. There was no impact of participating securities on EIX Holding Company EPS for 2Q07 and 2Q 06.
September 11, 2007 38 EDISON INTERNATIONAL®
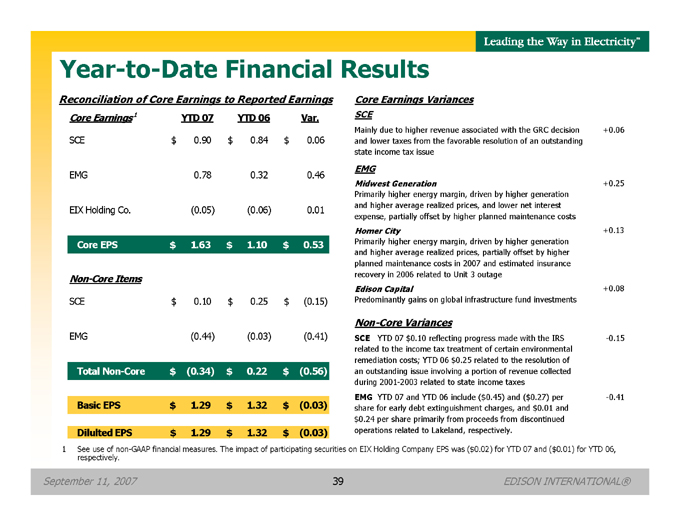
Year-to-Date Financial Results
Reconciliation of Core Earnings to Reported Earnings
Core Earnings1 YTD 07 YTD 06 Var.
SCE $ 0.90 $ 0.84 $ 0.06
EMG 0.78 0.32 0.46
EIX Holding Co. (0.05) (0.06) 0.01
Core EPS $ 1.63 $ 1.10 $ 0.53
Non-Core Items
SCE $ 0.10 $ 0.25 $ (0.15)
EMG (0.44) (0.03) (0.41)
Total Non-Core $ (0.34) $ 0.22 $ (0.56)
Basic EPS $ 1.29 $ 1.32 $ (0.03)
Dilulted EPS $ 1.29 $ 1.32 $ (0.03)
Core Earnings Variances
SCE
Mainly due to higher revenue associated with the GRC decision +0.06
and lower taxes from the favorable resolution of an outstanding
state income tax issue
EMG
Midwest Generation +0.25
Primarily higher energy margin, driven by higher generation
and higher average realized prices, and lower net interest
expense, partially offset by higher planned maintenance costs
Homer City +0.13
Primarily higher energy margin, driven by higher generation
and higher average realized prices, partially offset by higher
planned maintenance costs in 2007 and estimated insurance
recovery in 2006 related to Unit 3 outage
Edison Capital +0.08
Predominantly gains on global infrastructure fund investments
Non-Core Variances
SCE YTD 07 $ 0.10 reflecting progress made with the IRS -0.15
related to the income tax treatment of certain environmental
remediation costs; YTD 06 $ 0.25 related to the resolution of
an outstanding issue involving a portion of revenue collected
during 2001-2003 related to state income taxes
EMG YTD 07 and YTD 06 include ($0.45) and ($0.27) per -0.41
share for early debt extinguishment charges, and $0.01 and
$ 0.24 per share primarily from proceeds from discontinued
operations related to Lakeland, respectively.
1 See use of non-GAAP financial measures. The impact of participating securities on EIX Holding Company EPS was ($0.02) for YTD 07 and ($0.01) for YTD 06, respectively.
September 11, 2007 39 EDISON INTERNATIONAL®
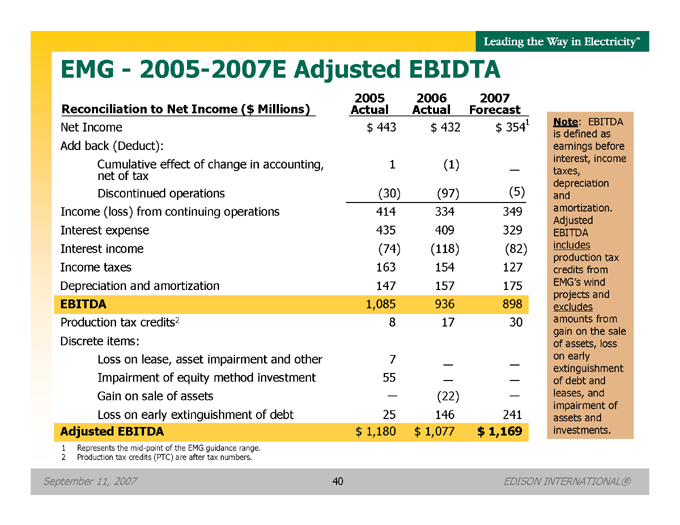
EMG—2005-2007E Adjusted EBIDTA
2005 2006 2007
Reconciliation to Net Income ($ Millions) Actual Actual Forecast
Net Income $ 443 $ 432 $ 3541
Add back (Deduct):
Cumulative effect of change in accounting, 1 (1) —
net of tax
Discontinued operations (30) (97) (5)
Income (loss) from continuing operations 414 334 349
Interest expense 435 409 329
Interest income (74) (118) (82)
Income taxes 163 154 1 27
Depreciation and amortization 147 157 175
EBITDA 1,085 936 898
Production tax credits2 8 17 30
Discrete items:
Loss on lease, asset impairment and other 7 — —
Impairment of equity method investment 55 — —
Gain on sale of assets — (22) —
Loss on early extinguishment of debt 25 146 241
Adjusted EBITDA $1,180 $1,077 $ 1,169
Note: EBITDA is defined as earnings before interest, income taxes, depreciation and amortization. Adjusted EBITDA includes production tax credits from EMG’s wind projects and excludes amounts from gain on the sale of assets, loss on early extinguishment of debt and leases, and impairment of assets and investments.
1 | | Represents the mid-point of the EMG guidance range. |
2 | | Production tax credits (PTC) are after tax numbers. |
September 11, 2007 40 EDISON INTERNATIONAL®
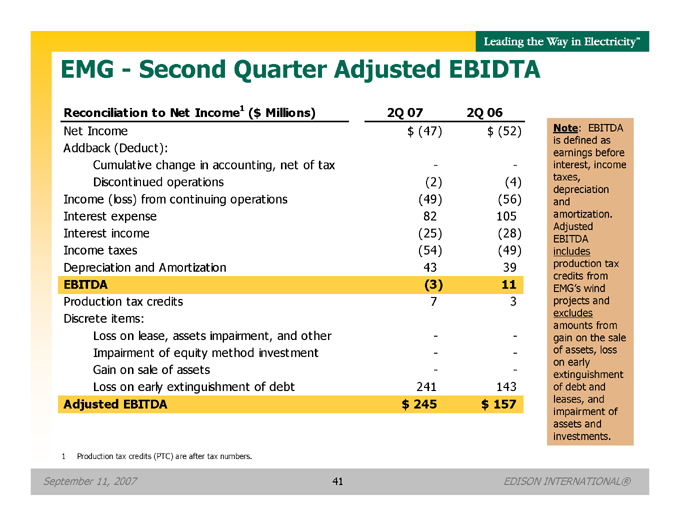
EMG—Second Quarter Adjusted EBIDTA
Reconciliation to Net Income1 ($ Millions) 2Q 07 2Q 06
Net Income $(47) $ (52)
Addback (Deduct):
Cumulative change in accounting, net of tax — -
Discontinued operations (2) (4)
Income (loss) from continuing operations (49) (56)
Interest expense 82 105
Interest income (25) (28)
Income taxes (54) (49)
Depreciation and Amortization 43 39
EBITDA (3) 11
Production tax credits 7 3
Discrete items:
Loss on lease, assets impairment, and other — -
Impairment of equity method investment — -
Gain on sale of assets — -
Loss on early extinguishment of debt 241 143
Adjusted EBITDA $245 $157
Note: EBITDA is defined as earnings before interest, income taxes, depreciation and amortization. Adjusted EBITDA includes production tax credits from EMG’s wind projects and excludes amounts from gain on the sale of assets, loss on early extinguishment of debt and leases, and impairment of assets and investments.
1 | | Production tax credits (PTC) are after tax numbers. |
September 11, 2007 41 EDISON INTERNATIONAL®
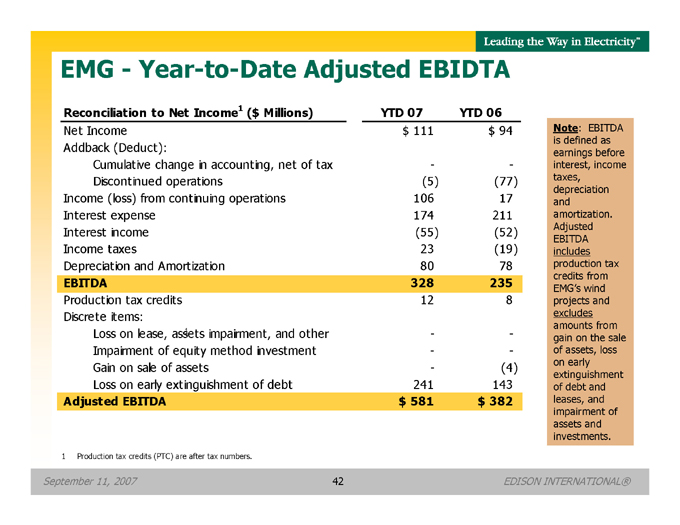
EMG—Year-to-Date Adjusted EBIDTA
Reconciliation to Net Income1 ($ Millions) YTD 07 YTD 06
Net Income $ 111 $ 94
Addback (Deduct):
Cumulative change in accounting, net of tax — -
Discontinued operations (5) (77)
Income (loss) from continuing operations 106 17
Interest expense 174 211
Interest income (55) (52)
Income taxes 23 (19)
Depreciation and Amortization 80 78
EBITDA 328 235
Production tax credits 1 2 8
Discrete items:
1 | | Loss on lease, assets impairment, and other — - |
Impairment of equity method investment — -
Gain on sale of assets - (4)
Loss on early extinguishment of debt 241 143
Adjusted EBITDA $ 581 $ 382
Note: EBITDA is defined as earnings before interest, income taxes, depreciation and amortization. Adjusted EBITDA includes production tax credits from EMG’s wind projects and excludes amounts from gain on the sale of assets, loss on early extinguishment of debt and leases, and impairment of assets and investments.
1 | | Production tax credits (PTC) are after tax numbers. |
September 11, 2007 42 EDISON INTERNATIONAL®
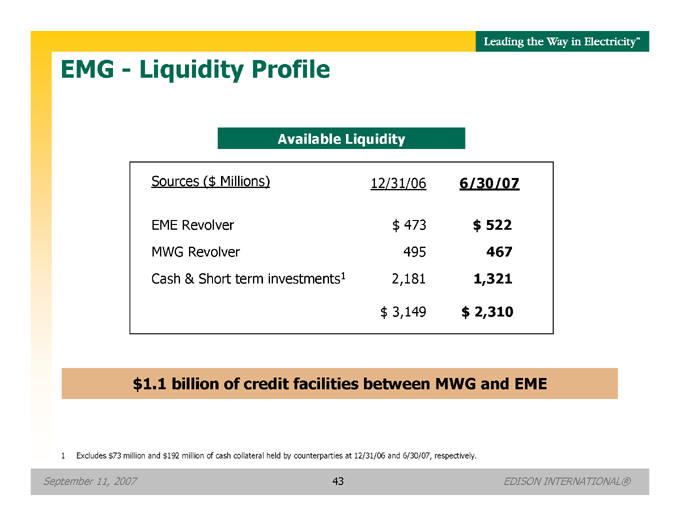
EMG—Liquidity Profile
Available Liquidity
Sources ($ Millions) 12/31/06 6/30/07
EME Revolver $ 473 $ 522
MWG Revolver 495 467
Cash & Short term investments1 2,181 1,321
$ 3,149 $ 2,310
$1.1 billion of credit facilities between MWG and EME
1 Excludes $73 million and $192 million of cash collateral held by counterparties at 12/31/06 and 6/30/07, respectively.
September 11, 2007 43 EDISON INTERNATIONAL®
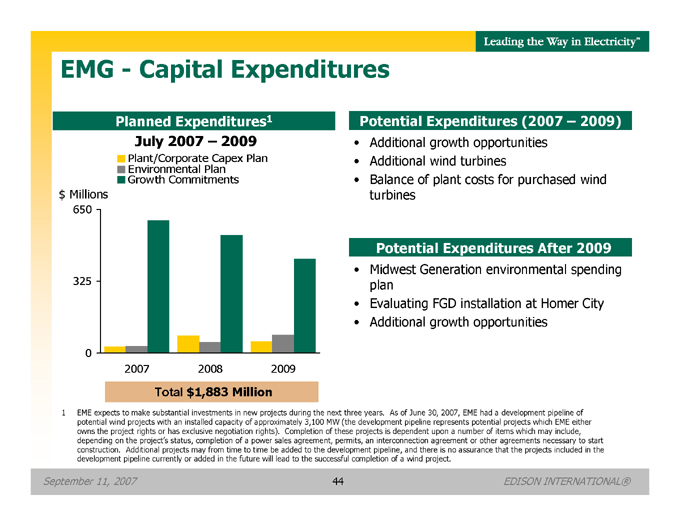
EMG—Capital Expenditures
Planned Expenditures1
July 2007 – 2009
Plant/Corporate Capex Plan Environmental Plan Growth Commitments
$ Millions
650
325
0
2007 2008 2009
Total $1,883 Million
1 EME expects to make substantial investments in new projects during the next three years. As of June 30, 2007, EME had a development pipeline of potential wind projects with an installed capacity of approximately 3,100 MW (the development pipeline represents potential projects which EME either owns the project rights or has exclusive negotiation rights). Completion of these projects is dependent upon a number of items which may include, depending on the project’s status, completion of a power sales agreement, permits, an interconnection agreement or other agreements necessary to start construction. Additional projects may from time to time be added to the development pipeline, and there is no assurance that the projects included in the development pipeline currently or added in the future will lead to the successful completion of a wind project.
Potential Expenditures (2007 – 2009)
Additional growth opportunities
Additional wind turbines
Balance of plant costs for purchased wind turbines
Potential Expenditures After 2009
Midwest Generation environmental spending plan
Evaluating FGD installation at Homer City
Additional growth opportunities
September 11, 2007 44 EDISON INTERNATIONAL®
Use of Non-GAAP Financial Measures
Edison International’s earnings are prepared in accordance with generally accepted accounting principles used in the United States and represent the company’s earnings as reported to the Securities and Exchange Commission. Our management uses core earnings and EPS by principal operating subsidiary internally for financial planning and for analysis of performance. We also use core earnings and EPS by principal operating subsidiary as primary performance measurements when communicating with analysts and investors regarding our earnings results and outlook, as it allows us to more accurately compare the company’s ongoing performance across periods. Core earnings exclude earnings from discontinued operations and other non-core items. EPS by principal operating subsidiary is based on the principal operating subsidiary net income and the weighted average outstanding common shares held by Edison International. The impact of participating securities (vested stock options that earn dividend equivalents that may participate in undistributed earnings with common stock) for each principal operating subsidiary is not material to each principal operatingsubsidiary’s EPS and is therefore reflected in the results of the Edison International holding company, which we refer to as EIX Holding Company in this presentation. A reconciliation of Non-GAAP information to GAAP information, including the impact of participating securities for each principal operating subsidiary is included either on the slide where the information appears or on another slide referenced in the presentation.
September 11, 2007 45 EDISON INTERNATIONAL®