Third Quarter 2007 Financial Teleconference
November 2, 2007
EDISON INTERNATIONAL®
Forward-Looking Statements
Statements contained in this presentation about future performance, including, without limitation, earnings, asset and rate base growth, load growth, capital investments, and other statements that are not purely historical, are forward-looking statements. These forward-looking statements reflect our current expectations; however, such statements involve risks and uncertainties. Actual results could differ materially from current expectations. Important factors that could cause different results are discussed under the headings “Risk Factors” and “Management’s Discussion and Analysis” in Edison International’s 2006 Form 10-K and subsequent reports filed with the Securities and Exchange Commission and available on our website: www.edisoninvestor.com. These forward-looking statements represent our expectations only as of the date of this presentation, and Edison International assumes no duty to update them to reflect new information, events or circumstances.
EDISON INTERNATIONAL®
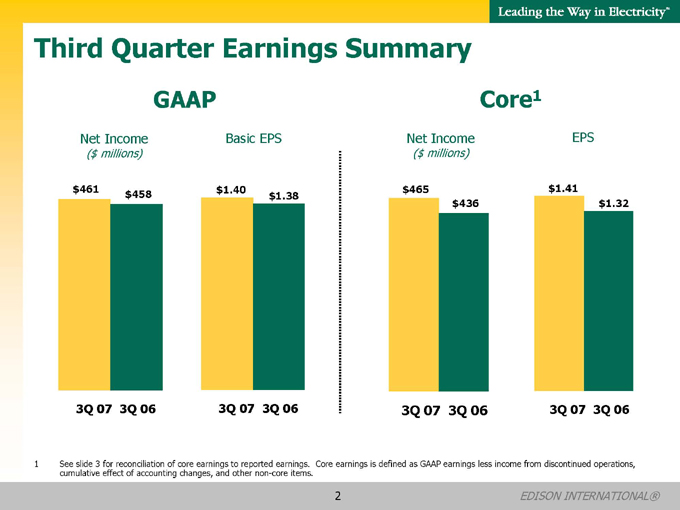
Third Quarter Earnings Summary
GAAP
Net Income
($ millions) $461 $458
Basic EPS
$1.40 $1.38
3Q 07 3Q 06
3Q 07 3Q 06
Core1
Net Income
($ millions)
EPS
$465 $436 $1.41 $1.32
3Q 07 3Q 06
3Q 07 3Q 06
1 See slide 3 for reconciliation of core earnings to reported earnings. Core earnings is defined as GAAP earnings less income from discontinued operations, cumulative effect of accounting changes, and other non-core items.
EDISON INTERNATIONAL®
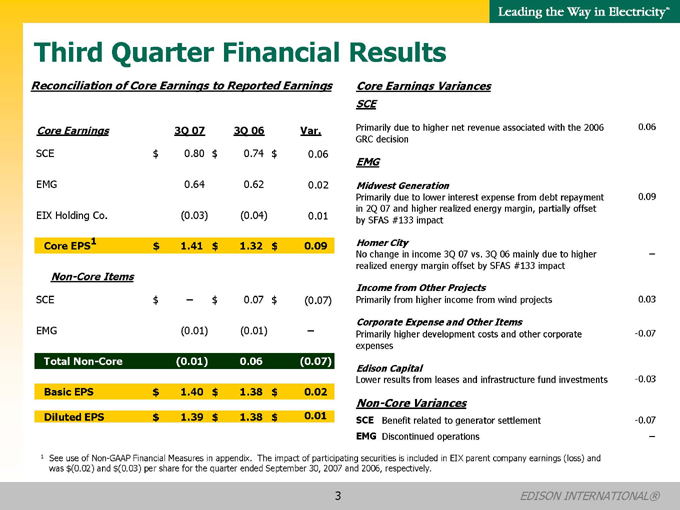
Third Quarter Financial Results
Reconciliation of Core Earnings to Reported Earnings
Core Earnings 3Q 07 3Q 06 Var.
SCE $ 0.80 $ 0.74 $ 0.06
EMG 0.64 0.62 0.02
EIX Holding Co.(0.03)(0.04) 0.01
Core EPS1 $ 1.41 $ 1.32 $ 0.09
Non-Core Items
SCE $ – $ 0.07 $ (0.07)
EMG(0.01)(0.01) –
Total Non-Core(0.01) 0.06(0.07)
Basic EPS $ 1.40 $ 1.38 $ 0.02
Diluted EPS $ 1.39 $ 1.38 $ 0.01
Core Earnings Variances
SCE
Primarily due to higher net revenue associated with the 2006 GRC decision 0.06
EMG
Midwest Generation
Primarily due to lower interest expense from debt repayment in 2Q 07 and higher realized energy margin, partially offset by SFAS #133 impact 0.09
Homer City
No change in income 3Q 07 vs. 3Q 06 mainly due to higher realized energy margin offset by SFAS #133 impact –
Income from Other Projects
Primarily from higher income from wind projects 0.03
Corporate Expense and Other Items
Primarily higher development costs and other corporate expenses -0.07
Edison Capital
Lower results from leases and infrastructure fund investments -0.03
Non-Core Variances
SCE Benefit related to generator settlement -0.07
EMG Discontinued operations –
1 See use of Non-GAAP Financial Measures in appendix. The impact of participating securities is included in EIX parent company earnings (loss) and was $(0.02) and $(0.03) per share for the quarter ended September 30, 2007 and 2006, respectively.
EDISON INTERNATIONAL®
EDISON INTERNATIONAL®
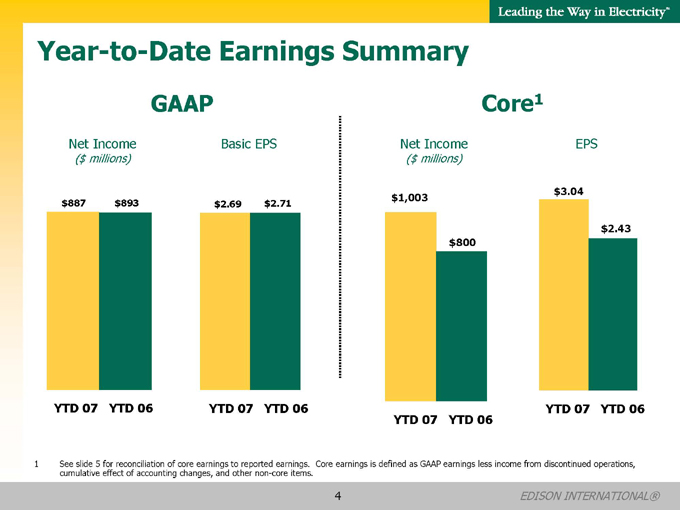
Year-to-Date Earnings Summary
GAAP
Net Income
($ millions) $887 $893
YTD 07 YTD 06
Basic EPS
YTD 07 YTD 06
Core1
Net Income
($ millions) $1,003 $800
YTD 07 YTD 06
EPS
$3.04 $2.43
YTD 07 YTD 06
1 See slide 5 for reconciliation of core earnings to reported earnings. Core earnings is defined as GAAP earnings less income from discontinued operations, cumulative effect of accounting changes, and other non-core items.

Year-to-Date Financial Results
Reconciliation of Core Earnings to Reported Earnings
Core Earnings YTD 07 YTD 06 Var.
SCE $ 1.70 $ 1.58 $ 0.12
EMG 1.41 0.95 0.46
EIX Holding Co.(0.07)(0.10) 0.03
Core EPS1 $ 3.04 $ 2.43 $ 0.61
Non-Core Items
SCE $ 0.10 $ 0.32 $ (0.22)
EMG(0.45)(0.04)(0.41)
Total Non-Core(0.35) 0.28(0.63)
Basic EPS $ 2.69 $ 2.71 $ (0.02)
Diluted EPS $ 2.67 $ 2.71 $ (0.04)
Core Earnings Variances
SCE
Primarily due to higher net revenue associated with the 2006 GRC decision and lower income taxes 0.12
EMG
Midwest Generation
Mainly higher realized energy margin (driven by higher generation and higher average realized prices) partially offset by SFAS #133 impact, and lower interest expense 0.34
Homer City
Primarily higher realized energy margin (driven by higher generation and higher average realized energy prices), which includes higher capacity revenue resulting from the PJM RPM auction, partially offset by SFAS #133 impact 0.12
Income from Other Projects
Higher income from wind and gas-fired projects 0.08
Edison Capital
Gains on global infrastructure fund investments and higher interest income
0.04
Corporate Expense and Other Items
Higher development costs and other corporate expenses and higher net interest/other expense (Mirant income and gain on sale of 25% interest in San Juan Mesa recorded in 06) -0.12
Non-Core Variances
SCE YTD 07: $ 0.10 reflects progress made with the IRS related to the income tax treatment of certain environmental remediation costs; YTD 06: $ 0.25 relates to the resolution of an outstanding issue involving a portion of revenue collected during 2001—2003 related to state income taxes and $0.07 reflects generator settlement. -0.22
EMG YTD 07 and YTD 06 include ($0.45) and ($0.27) per share for early debt extinguishment charges; $0.01 and $ 0.26 per share from proceeds from discontinued operations related to Lakeland; and ( $0.01) and ($0.03) per share from other discontinued operations, respectively. -0.41
1 See use of Non-GAAP Financial Measures in appendix. The impact of participating securities is included in EIX parent company earnings (loss) and was $(0.03) per share for year-to-date September 30, 2007 and 2006.
EDISON INTERNATIONAL®
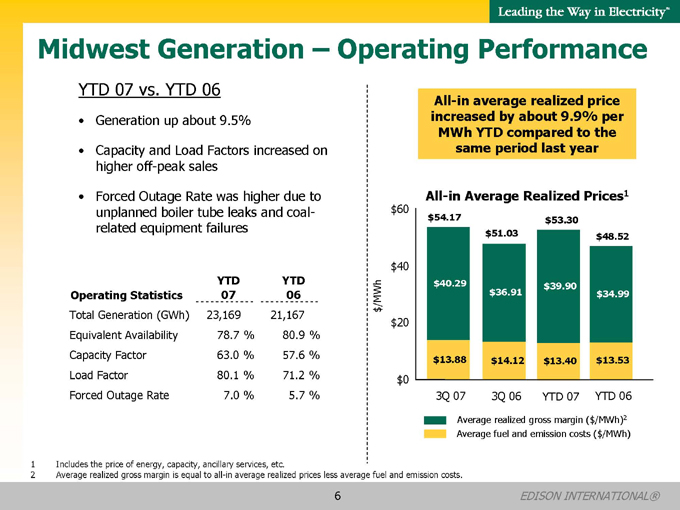
Midwest Generation – Operating Performance
YTD 07 vs. YTD 06
Generation up about 9.5%
Capacity and Load Factors increased on higher off-peak sales
Forced Outage Rate was higher due to unplanned boiler tube leaks and coal-related equipment failures
YTD YTD
Operating Statistics 07 06
Total Generation (GWh) 23,169 21,167
Equivalent Availability 78.7 % 80.9 %
Capacity Factor 63.0 % 57.6 %
Load Factor 80.1 % 71.2 %
Forced Outage Rate 7.0 % 5.7 %
1 | | Includes the price of energy, capacity, ancillary services, etc. |
2 | | Average realized gross margin is equal to all-in average realized prices less average fuel and emission costs. |
All-in average realized price increased by about 9.9% per MWh YTD compared to the same period last year
All-in Average Realized Prices1 $/MWh $60 $40 $20 $0
3Q 07 3Q 06 YTD 07 YTD 06 $54.17 $51.03 $53.30 $48.52 $40.29 $36.91 $39.90 $34.99 $13.88 $14.12 $13.40 $13.53
Average realized gross margin ($/MWh)2 Average fuel and emission costs ($/MWh)
EDISON INTERNATIONAL®
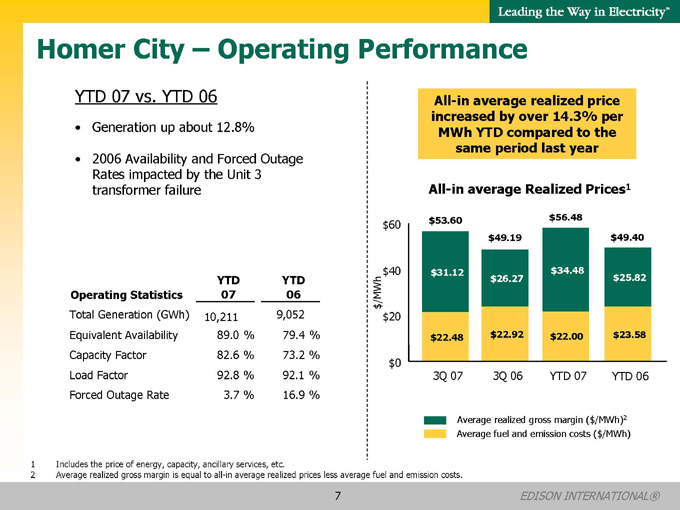
Homer City – Operating Performance
YTD 07 vs. YTD 06
Generation up about 12.8%
2006 Availability and Forced Outage Rates impacted by the Unit 3 transformer failure
YTD YTD
Operating Statistics 07 06
Total Generation (GWh) 10,211 9,052
Equivalent Availability 89.0 % 79.4 %
Capacity Factor 82.6 % 73.2 %
Load Factor 92.8 % 92.1 %
Forced Outage Rate 3.7 % 16.9 %
1 | | Includes the price of energy, capacity, ancillary services, etc. |
2 | | Average realized gross margin is equal to all-in average realized prices less average fuel and emission costs. |
All-in average realized price increased by over 14.3% per MWh YTD compared to the same period last year
All-in average Realized Prices1 $/MWh $60 $40 $20 $0
3Q 07 3Q 06 YTD 07 YTD 06 $22.48 $22.92 $22.00 $23.58 $53.60 $49.19 $56.48 $49.40 $31.12 $26.27 $34.48 $25.82
Average realized gross margin ($/MWh)2 Average fuel and emission costs ($/MWh)
EDISON INTERNATIONAL®
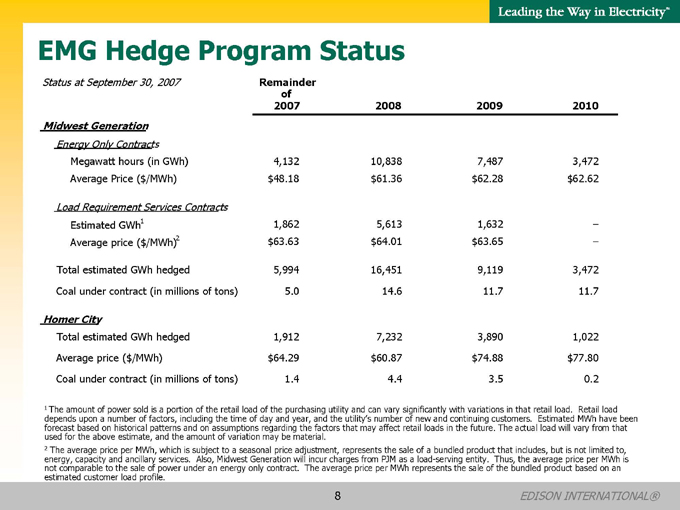
EMG Hedge Program Status
Status at September 30, 2007 Remainder of 2007 2008 2009 2010
Midwest Generation
Energy Only Contracts
Megawatt hours (in GWh) 4,132 10,838 7,487 3,472
Average Price ($/MWh) $ 48.18 $ 61.36 $ 62.28 $ 62.62
Load Requirement Services Contracts
Estimated GWh1 1,862 5,613 1,632 –
Average price ($/MWh) 2 $ 63.63 $ 64.01 $ 63.65 –
Total estimated GWh hedged 5,994 16,451 9,119 3,472
Coal under contract (in millions of tons) 5.0 14.6 11.7 11.7
Homer City
Total estimated GWh hedged 1,912 7,232 3,890 1,022
Average price ($ /MWh) $ 64.29 $ 60.87 $ 74.88 $ 77.80
Coal under contract (in millions of tons) 1.4 4.4 3.5 0.2
1 The amount of power sold is a portion of the retail load of the purchasing utility and can vary significantly with variations in that retail load. Retail load depends upon a number of factors, including the time of day and year, and the utility’s number of new and continuing customers. Estimated MWh have been forecast based on historical patterns and on assumptions regarding the factors that may affect retail loads in the future. The actual load will vary from that used for the above estimate, and the amount of variation may be material.
2 The average price per MWh, which is subject to a seasonal price adjustment, represents the sale of a bundled product that includes, but is not limited to, energy, capacity and ancillary services. Also, Midwest Generation will incur charges from PJM as a load-serving entity. Thus, the average price per MWh is not comparable to the sale of power under an energy only contract. The average price per MWh represents the sale of the bundled product based on an estimated customer load profile.
EDISON INTERNATIONAL®
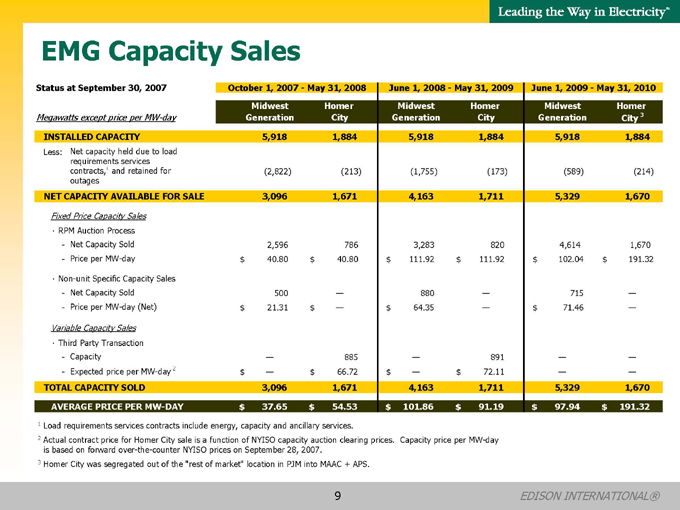
EMG Capacity Sales
Status at September 30, 2007 October 1, 2007—May 31, 2008 June 1, 2008—May 31, 2009 June 1, 2009—May 31, 2010
Megawatts except price per MW-day Midwest Generation Homer City Midwest Generation Homer City Midwest Generation Homer City 3
INSTALLED CAPACITY 5,918 1,884 5,918 1,884 5,918 1,884
Less: Net capacity held due to load requirements services contracts,1 and retained for outages(2,822)(213)(1,755)(173)(589)(214)
NET CAPACITY AVAILABLE FOR SALE 3,096 1,671 4,163 1,711 5,329 1,670
Fixed Price Capacity Sales
· RPM Auction Process
—Net Capacity Sold 2,596 786 3,283 820 4,614 1,670
- Price per MW-day $ 40.80 $ 40.80 $ 111.92 $ 111.92 $ 102.04 $ 191.32
· Non-unit Specific Capacity Sales
—Net Capacity Sold 500 — 880 — 715 —
- Price per MW-day (Net) $ 21.31 $ — $ 64.35 — $ 71.46 —
Variable Capacity Sales
· Third Party Transaction
—Capacity — 885 — 891 — —
- Expected price per MW-day 2 $ — $ 66.72 $ — $ 72.11 — —
TOTAL CAPACITY SOLD 3,096 1,671 4,163 1,711 5,329 1,670
AVERAGE PRICE PER MW-DAY $ 37.65 $ 54.53 $ 101.86 $ 91.19 $ 97.94 $ 191.32
1 | | Load requirements services contracts include energy, capacity and ancillary services. |
2 Actual contract price for Homer City sale is a function of NYISO capacity auction clearing prices. Capacity price per MW-day is based on forward over-the-counter NYISO prices on September 28, 2007.
3 | | Homer City was segregated out of the “rest of market” location in PJM into MAAC + APS. |
9
EDISON INTERNATIONAL®
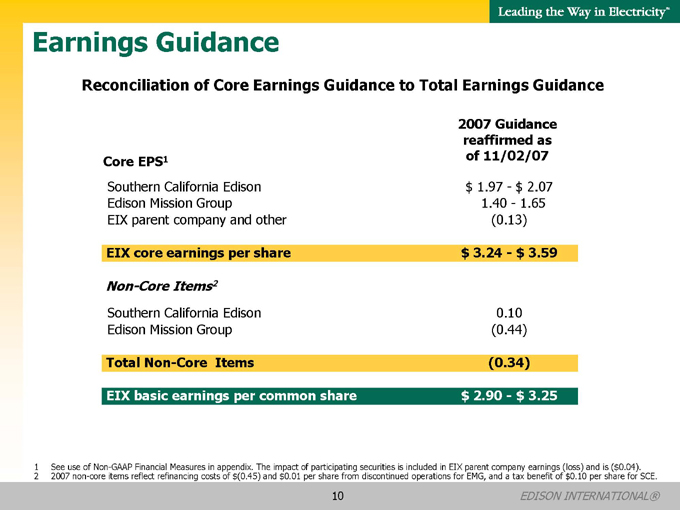
Earnings Guidance
Reconciliation of Core Earnings Guidance to Total Earnings Guidance
2007 Guidance
reaffirmed as
Core EPS1 of 11/02/07
Southern California Edison $ 1.97—$ 2.07
Edison Mission Group 1.40—1.65
EIX parent company and other(0.13)
EIX core earnings per share $ 3.24—$ 3.59
Non-Core Items2
Southern California Edison 0.10
Edison Mission Group(0.44)
Total Non-Core Items(0.34)
EIX basic earnings per common share $ 2.90—$ 3.25
1 See use of Non-GAAP Financial Measures in appendix. The impact of participating securities is included in EIX parent company earnings (loss) and is ($0.04).
2 2007 non-core items reflect refinancing costs of $(0.45) and $0.01 per share from discontinued operations for EMG, and a tax benefit of $0.10 per share for SCE.
10
EDISON INTERNATIONAL®
Appendix
11
EDISON INTERNATIONAL®
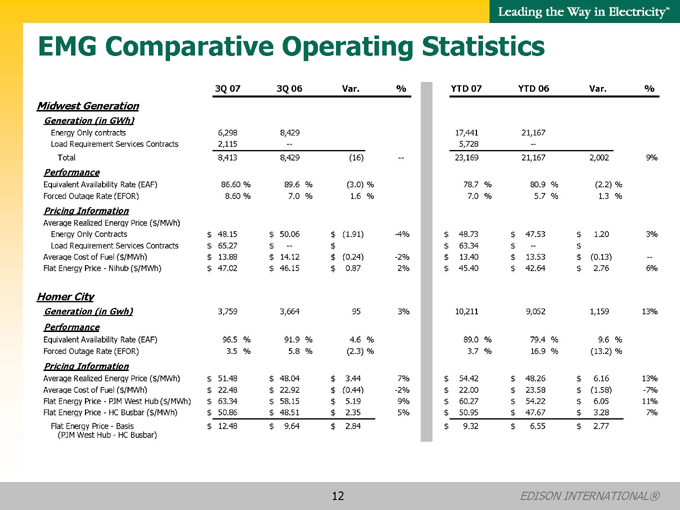
EMG Comparative Operating Statistics
3Q 07 3Q 06 Var.% YTD 07 YTD 06 Var.%
Midwest Generation
Generation (in GWh)
Energy Only contracts 6,298 8,429 17,441 21,167
Load Requirement Services Contracts 2,115 — 5,728 —
Total 8,413 8,429(16) — 23,169 21,167 2,002 9%
Performance
Equivalent Availability Rate (EAF) 86.60 % 89.6 %(3.0) % 78.7 % 80.9 %(2.2) %
Forced Outage Rate (EFOR) 8.60 % 7.0 % 1.6 % 7.0 % 5.7 % 1.3 %
Pricing Information
Average Realized Energy Price ($/MWh)
Energy Only Contracts $ 48.15 $ 50.06 $ (1.91) -4% $ 48.73 $ 47.53 $ 1.20 3%
Load Requirement Services Contracts $ 65.27 $ — $ $ 63.34 $ — $
Average Cost of Fuel ($/MWh) $ 13.88 $ 14.12 $ (0.24) -2% $ 13.40 $ 13.53 $ (0.13) —
Flat Energy Price—Nihub ($/MWh) $ 47.02 $ 46.15 $ 0.87 2% $ 45.40 $ 42.64 $ 2.76 6%
Homer City
Generation (in Gwh) 3,759 3,664 95 3% 10,211 9,052 1,159 13%
Performance
Equivalent Availability Rate (EAF) 96.5 % 91.9 % 4.6 % 89.0 % 79.4 % 9.6 %
Forced Outage Rate (EFOR) 3.5 % 5.8 %(2.3) % 3.7 % 16.9 %(13.2) %
Pricing Information
Average Realized Energy Price ($/MWh) $ 51.48 $ 48.04 $ 3.44 7% $ 54.42 $ 48.26 $ 6.16 13%
Average Cost of Fuel ($/MWh) $ 22.48 $ 22.92 $ (0.44) -2% $ 22.00 $ 23.58 $ (1.58) -7%
Flat Energy Price—PJM West Hub ($/MWh) $ 63.34 $ 58.15 $ 5.19 9% $ 60.27 $ 54.22 $ 6.05 11%
Flat Energy Price—HC Busbar ($/MWh) $ 50.86 $ 48.51 $ 2.35 5% $ 50.95 $ 47.67 $ 3.28 7%
Flat Energy Price—Basis $ 12.48 $ 9.64 $ 2.84 $ 9.32 $ 6.55 $ 2.77
(PJM West Hub—HC Busbar)
12
EDISON INTERNATIONAL®
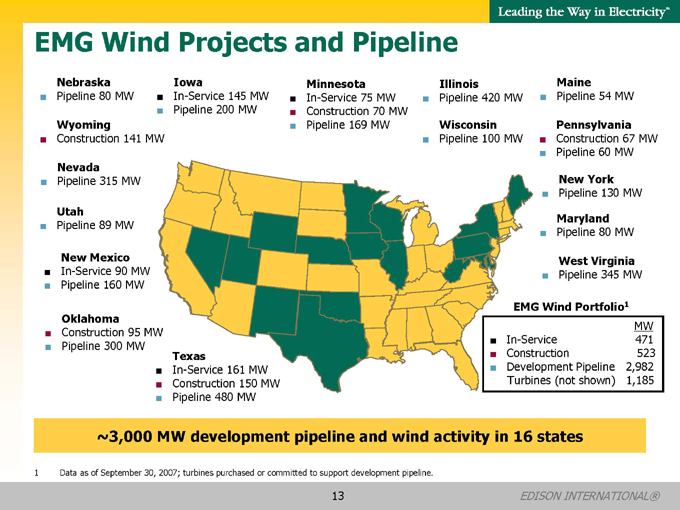
EMG Wind Projects and Pipeline
Nebraska
Pipeline 80 MW
Wyoming
Construction 141 MW
Nevada
Pipeline 315 MW
Utah
Pipeline 89 MW
New Mexico
In-Service 90 MW Pipeline 160 MW
Oklahoma
Construction 95 MW Pipeline 300 MW
Iowa
In-Service 145 MW Pipeline 200 MW
Minnesota
In-Service 75 MW Construction 70 MW Pipeline 169 MW
Illinois
Pipeline 420 MW
Wisconsin
Pipeline 100 MW
Maine
Pipeline 54 MW
Pennsylvania
Construction 67 MW Pipeline 60 MW
New York
Pipeline 130 MW
Maryland
Pipeline 80 MW
West Virginia
Pipeline 345 MW
Texas
In-Service 161 MW Construction 150 MW Pipeline 480 MW
EMG Wind Portfolio1
MW
In-Service 471
Construction 523
Development Pipeline 2,982
Turbines (not shown) 1,185
~3,000 MW development pipeline and wind activity in 16 states
1 | | Data as of September 30, 2007; turbines purchased or committed to support development pipeline. |
13
EDISON INTERNATIONAL®
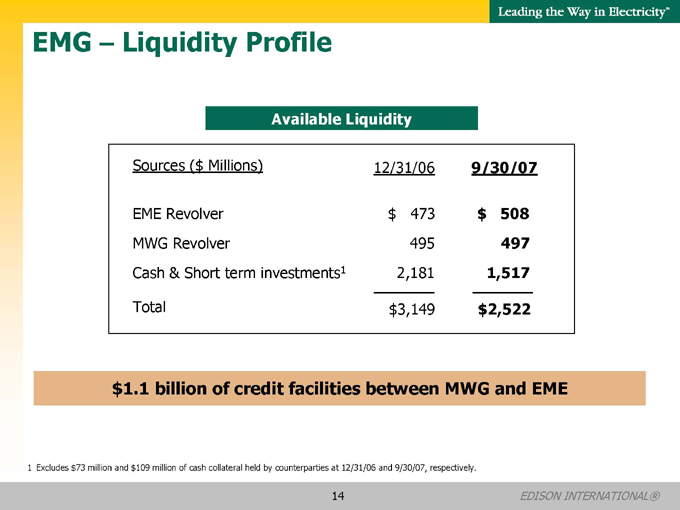
EMG – Liquidity Profile
Available Liquidity
Sources ($ Millions) 12/31/06 9/30/07
EME Revolver $ 473 $ 508
MWG Revolver 495 497
Cash & Short term investments1 2,181 1,517
Total $ 3,149 $ 2,522
$1.1 billion of credit facilities between MWG and EME
1 Excludes $73 million and $109 million of cash collateral held by counterparties at 12/31/06 and 9/30/07, respectively.
14
EDISON INTERNATIONAL®

Use of Non-GAAP Financial Measures
Edison International’s earnings are prepared in accordance with generally accepted accounting principles used in the United States and represent the company’s earnings as reported to the Securities and Exchange Commission. Our management uses core earnings and EPS by principal operating subsidiary internally for financial planning and for analysis of performance. We also use core earnings and EPS by principal operating subsidiary as primary performance measurements when communicating with analysts and investors regarding our earnings results and outlook, as it allows us to more accurately compare the company’s ongoing performance across periods. Core earnings exclude discontinued operations and other non-core items and are reconciled to basic earnings per common share.
EPS by principal operating subsidiary is based on the principal operating subsidiary net income and Edison International’s weighted average outstanding common shares. The impact of participating securities (vested stock options that earn dividend equivalents that may participate in undistributed earnings with common stock) for each principal operating subsidiary is not material to each principal operating subsidiary’s EPS and is therefore reflected in the results of the Edison International holding company, which we refer to as EIX parent company. EPS and core EPS by principal operating subsidiary are reconciled to basic earnings per common share.
A reconciliation of Non-GAAP information to GAAP information, including the impact of participating securities, is included either on the slide where the information appears or on another slide referenced in the presentation.
15
EDISON INTERNATIONAL®