Exhibit 99.2
Leading the Way in Electricity SM
42nd EEI Financial Conference November 6, 2007
John Bryson, Chairman, Chief Executive Officer and President
EDISON INTERNATIONAL®
Leading the Way in Electricity SM
Forward-Looking Statements
Statements contained in this presentation about future performance, including, without limitation, earnings, asset and rate base growth, load growth, capital investments, and other statements that are not purely historical, are forward-looking statements. These forward-looking statements reflect our current expectations; however, such statements involve risks and uncertainties. Actual results could differ materially from current expectations. Important factors that could cause different results are discussed under the headings “Risk Factors” and “Management’s Discussion and Analysis” in Edison International’s 2006 Form 10-K and subsequent reports filed with the Securities and Exchange Commission and available on our website: www.edisoninvestor.com. These forward-looking statements represent our expectations only as of the date of this presentation, and Edison International assumes no duty to update them to reflect new information, events or circumstances.
42nd EEI Financial Conference 1
EDISON INTERNATIONAL®
Leading the Way in Electricity SM
Use of Non-GAAP Financial Measures
Edison International’s earnings are prepared in accordance with generally accepted accounting principles used in the United States and represent the company’s earnings as reported to the Securities and Exchange Commission. Our management uses core earnings and EPS by principal operating subsidiary internally for financial planning and for analysis of performance. We also use core earnings and EPS by principal operating subsidiary as primary performance measurements when communicating with analysts and investors regarding our earnings results and outlook, as it allows us to more accurately compare the company’s ongoing performance across periods. Core earnings exclude discontinued operations and other non-core items and are reconciled to basic earnings per common share.
EPS by principal operating subsidiary is based on the principal operating subsidiary net income and Edison International’s weighted average outstanding common shares. The impact of participating securities (vested stock options that earn dividend equivalents that may participate in undistributed earnings with common stock) for each principal operating subsidiary is not material to each principal operating subsidiary’s EPS and is therefore reflected in the results of the Edison International holding company, which we refer to as EIX parent company. EPS and core EPS by principal operating subsidiary are reconciled to basic earnings per common share.
A reconciliation of Non-GAAP information to GAAP information, including the impact of participating securities, is included either on the slide where the information appears or on another slide referenced in the presentation.
42nd EEI Financial Conference 2
EDISON INTERNATIONAL®
Leading the Way in Electricity SM
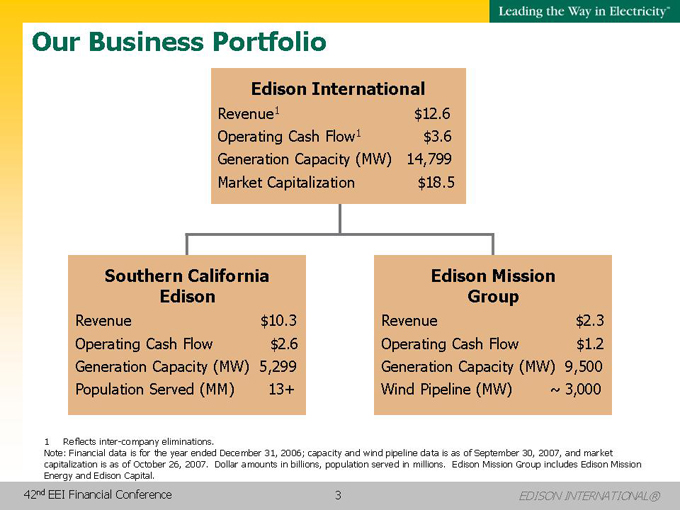
Our Business Portfolio
Edison International
Revenue1 | $12.6 | ||
Operating Cash Flow1 | $ | 3.6 | |
Generation Capacity (MW) |
| 14,799 | |
Market Capitalization | $ | 18.5 | |
Southern California Edison
Revenue | $ 10.3 | ||
Operating Cash Flow | $ | 2.6 | |
Generation Capacity (MW) |
| 5,299 | |
Population Served (MM) |
| 13+ | |
Edison Mission Group
Revenue | $ 2.3 | ||
Operating Cash Flow | $ | 1.2 | |
Generation Capacity (MW) |
| 9,500 | |
Wind Pipeline (MW) |
| 3,000 | |
1 |
| Reflects inter-company eliminations. |
Note: Financial data is for the year ended December 31, 2006; capacity and wind pipeline data is as of September 30, 2007, and market capitalization is as of October 26, 2007. Dollar amounts in billions, population served in millions. Edison Mission Group includes Edison Mission Energy and Edison Capital.
42nd EEI Financial Conference 3
EDISON INTERNATIONAL®
Leading the Way in Electricity SM
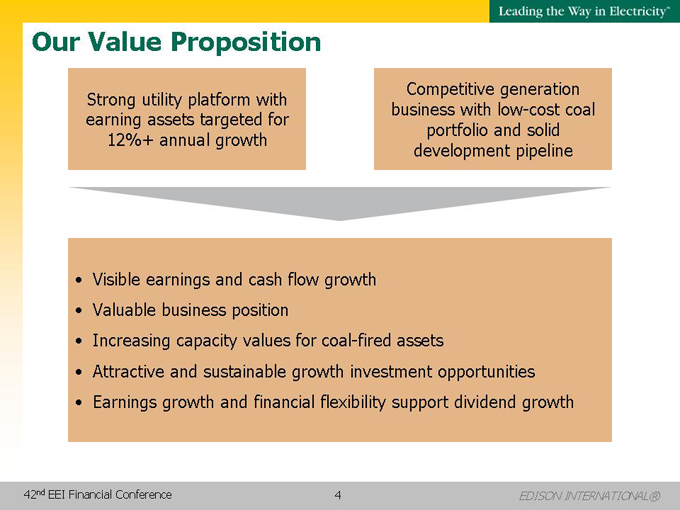
Our Value Proposition
Strong utility platform with earning assets targeted for 12%+ annual growth
Competitive generation business with low-cost coal portfolio and solid development pipeline
Visible earnings and cash flow growth
Valuable business position
Increasing capacity values for coal-fired assets
Attractive and sustainable growth investment opportunities
Earnings growth and financial flexibility support dividend growth
42nd EEI Financial Conference 4
EDISON INTERNATIONAL®
Leading the Way in Electricity SM
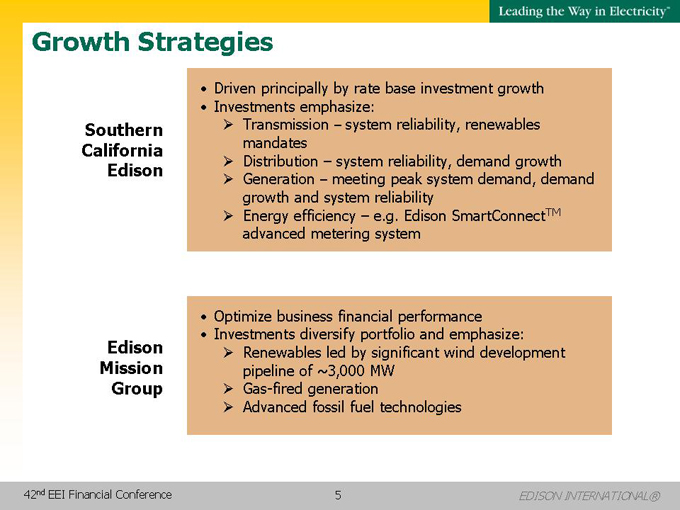
Growth Strategies
Southern California Edison
Driven principally by rate base investment growth
Investments emphasize:
Transmission – system reliability, renewables mandates
Distribution – system reliability, demand growth
Generation – meeting peak system demand, demand growth and system reliability
Energy efficiency – e.g. Edison SmartConnectTM advanced metering system
Edison Mission Group
Optimize business financial performance
Investments diversify portfolio and emphasize:
Renewables led by significant wind development pipeline of ~3,000 MW
Gas-fired generation
Advanced fossil fuel technologies
42nd EEI Financial Conference 5
EDISON INTERNATIONAL®
Leading the Way in Electricity SM
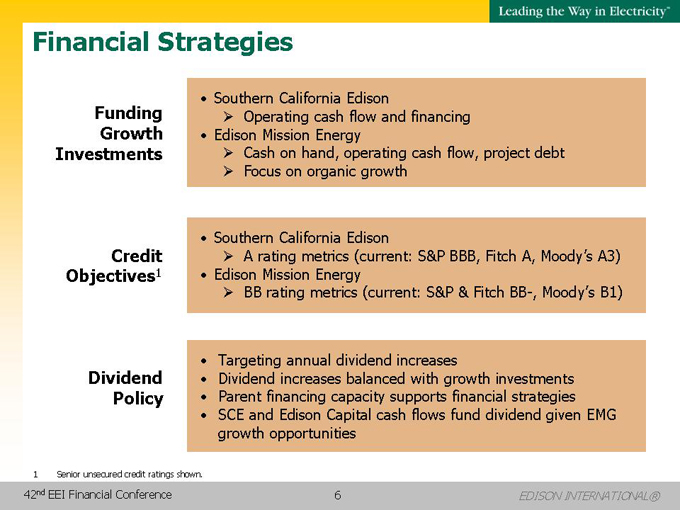
Financial Strategies
Funding Growth Investments
Southern California Edison
Operating cash flow and financing
Edison Mission Energy
Cash on hand, operating cash flow, project debt
Focus on organic growth
Credit Objectives1
Southern California Edison
A rating metrics (current: S&P BBB, Fitch A, Moody’s A3)
Edison Mission Energy
BB rating metrics (current: S&P & Fitch BB-, Moody’s B1)
Dividend Policy
Targeting annual dividend increases
Dividend increases balanced with growth investments
Parent financing capacity supports financial strategies
SCE and Edison Capital cash flows fund dividend given EMG growth opportunities
1 |
| Senior unsecured credit ratings shown. |
42nd EEI Financial Conference 6
EDISON INTERNATIONAL®
Leading the Way in Electricity SM
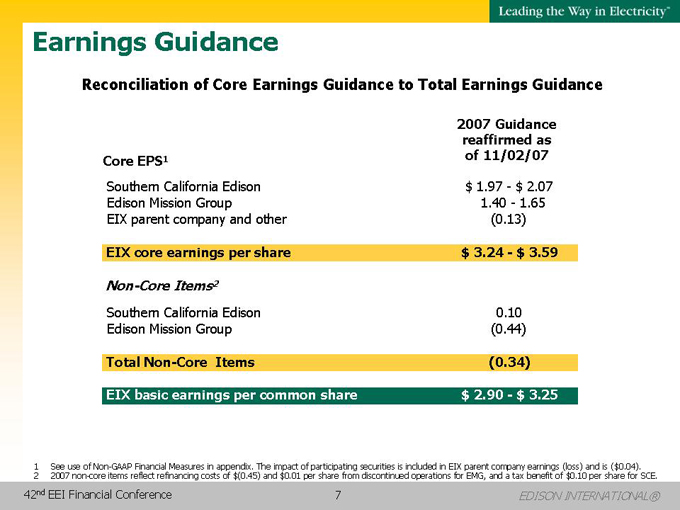
Earnings Guidance
Reconciliation of Core Earnings Guidance to Total Earnings Guidance
2007 | ||||
Core EPS1 | | of | | |
Southern California Edison | $ | 1.97 - $ | | |
Edison Mission Group | | 1.40 - | | |
EIX parent company and other |
| (0.13 | ) | |
EIX core earnings per share | $ | 3.24 - $ | | |
Non-Core Items 2 | ||||
Southern California Edison |
| 0.10 |
| |
Edison Mission Group |
| (0.44 | ) | |
Total Non-Core Items |
| (0.34 | ) | |
EIX basic earnings per common share | $ | 2.90 - $ | | |
1 See use of Non-GAAP Financial Measures in appendix. The impact of participating securities is included in EIX parent company earnings (loss) and is ($0.04).
2 2007 non-core items reflect refinancing costs of $(0.45) and $0.01 per share from discontinued operations for EMG, and a tax benefit of $0.10 per share for SCE.
42nd EEI Financial Conference 7
EDISON INTERNATIONAL®
Leading the Way in Electricity SM
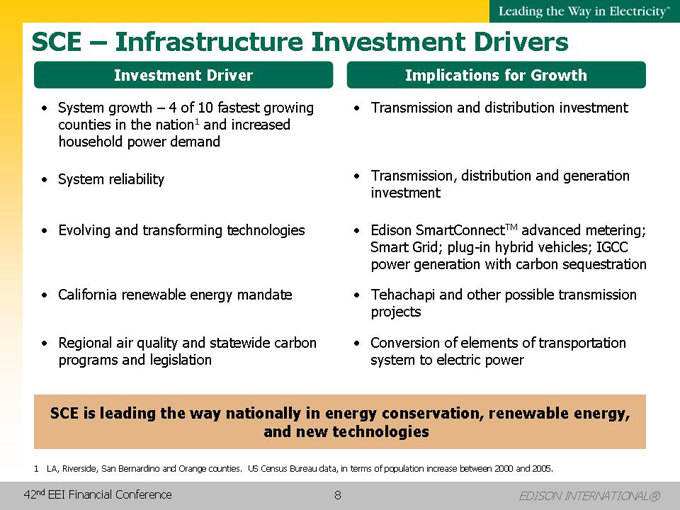
SCE – Infrastructure Investment Drivers
Investment Driver
System growth – 4 of 10 fastest growing counties in the nation1 and increased household power demand
System reliability
Evolving and transforming technologies
California renewable energy mandate
Regional air quality and statewide carbon programs and legislation
Implications for Growth
Transmission and distribution investment
Transmission, distribution and generation investment
Edison SmartConnectTM advanced metering; Smart Grid; plug-in hybrid vehicles; IGCC power generation with carbon sequestration
Tehachapi and other possible transmission projects
Conversion of elements of transportation system to electric power
SCE is leading the way nationally in energy conservation, renewable energy, and new technologies
1 LA, Riverside, San Bernardino and Orange counties. US Census Bureau data, in terms of population increase between 2000 and 2005.
42nd EEI Financial Conference 8
EDISON INTERNATIONAL®
Leading the Way in Electricity SM
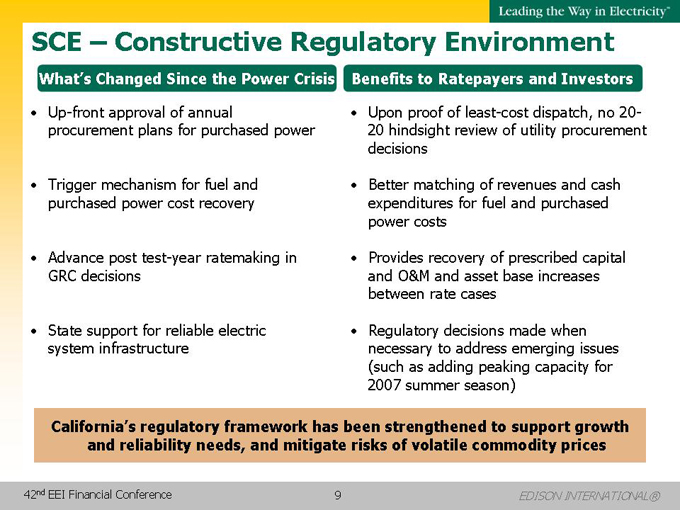
SCE – Constructive Regulatory Environment
What’s Changed Since the Power Crisis
Up-front approval of annual procurement plans for purchased power
Trigger mechanism for fuel and purchased power cost recovery
Advance post test-year ratemaking in GRC decisions
State support for reliable electric system infrastructure
Benefits to Ratepayers and Investors
Upon proof of least-cost dispatch, no 20-20 hindsight review of utility procurement decisions
Better matching of revenues and cash expenditures for fuel and purchased power costs
Provides recovery of prescribed capital and O&M and asset base increases between rate cases
Regulatory decisions made when necessary to address emerging issues (such as adding peaking capacity for 2007 summer season)
California’s regulatory framework has been strengthened to support growth and reliability needs, and mitigate risks of volatile commodity prices
42nd EEI Financial Conference 9
EDISON INTERNATIONAL®
Leading the Way in Electricity SM
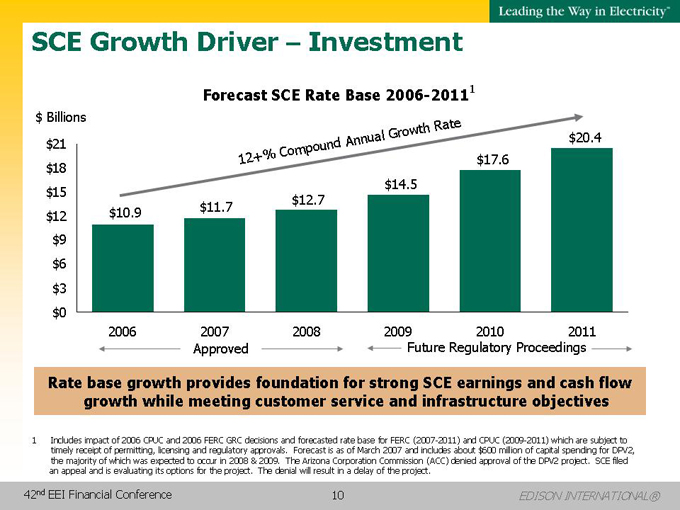
SCE Growth Driver – Investment
Forecast SCE Rate Base 2006-2011 1
$ Billions
$21 $18 $15 $12 $9 $6 $3 $0
2006 2007 2008
Approved
2009 2010 2011
Future Regulatory Proceedings
12+ % Compound Annual Growth Rate
$10.9 $11.7 $12.7 $14.5 $17.6 $20.4
Rate base growth provides foundation for strong SCE earnings and cash flow growth while meeting customer service and infrastructure objectives
1 Includes impact of 2006 CPUC and 2006 FERC GRC decisions and forecasted rate base for FERC (2007-2011) and CPUC (2009-2011) which are subject to timely receipt of permitting, licensing and regulatory approvals. Forecast is as of March 2007 and includes about $600 million of capital spending for DPV2, the majority of which was expected to occur in 2008 & 2009. The Arizona Corporation Commission (ACC) denied approval of the DPV2 project. SCE filed an appeal and is evaluating its options for the project. The denial will result in a delay of the project.
42nd EEI Financial Conference 10
EDISON INTERNATIONAL®
Leading the Way in Electricity SM
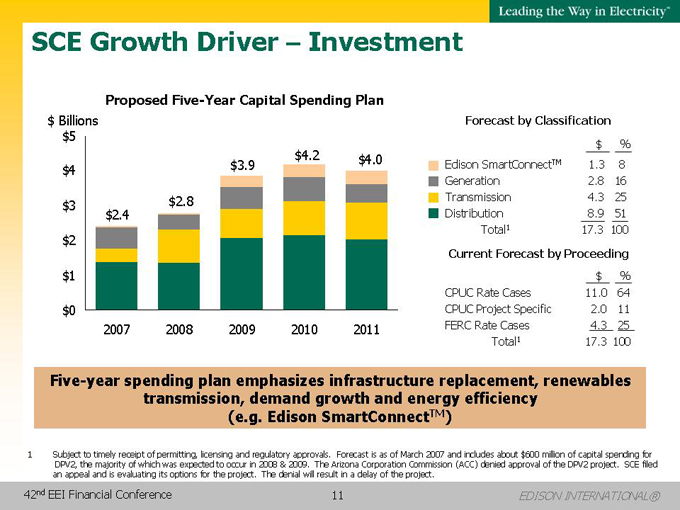
SCE Growth Driver – Investment
Proposed Five-Year Capital Spending Plan
$ Billions
$5 $4 $3 $2 $1 $0
2007 2008 2009 2010 2011
$2.4 $2.8 $3.9 $4.2 $4.0
Forecast by Classification
$ | % | |||
Edison SmartConnectTM | 1.3 | 8 | ||
Generation | 2.8 | 16 | ||
Transmission | 4.3 | 25 | ||
Distribution | 8.9 | 51 | ||
Total1 | 17.3 | 100 |
Current Forecast by Proceeding
$ | % | |||
CPUC Rate Cases | 11.0 | 64 | ||
CPUC Project Specific | 2.0 | 11 | ||
FERC Rate Cases | 4.3 | 25 | ||
Total1 | 17.3 | 100 |
Five-year spending plan emphasizes infrastructure replacement, renewables transmission, demand growth and energy efficiency (e.g. Edison SmartConnectTM)
1 Subject to timely receipt of permitting, licensing and regulatory approvals. Forecast is as of March 2007 and includes about $600 million of capital spending for DPV2, the majority of which was expected to occur in 2008 & 2009. The Arizona Corporation Commission (ACC) denied approval of the DPV2 project. SCE filed an appeal and is evaluating its options for the project. The denial will result in a delay of the project.
42nd EEI Financial Conference 11
EDISON INTERNATIONAL®
Leading the Way in Electricity SM
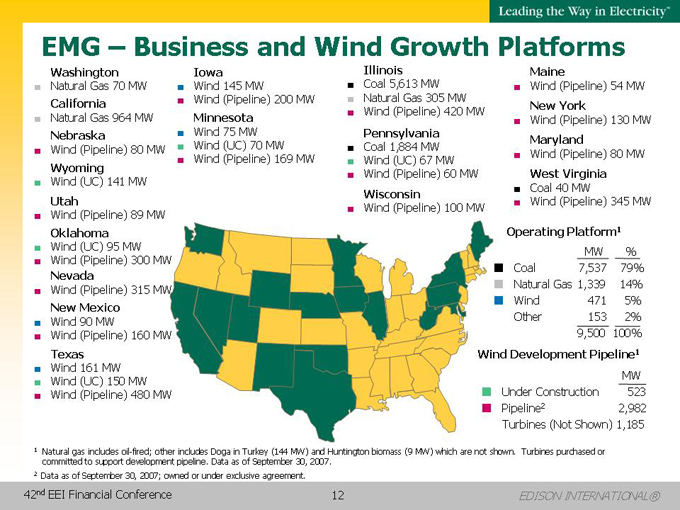
EMG – Business and Wind Growth Platforms
Washington
Natural Gas 70 MW
California
Natural Gas 964 MW
Nebraska
Wind (Pipeline) 80 MW
Wyoming
Wind (UC) 141 MW
Utah
Wind (Pipeline) 89 MW
Oklahoma
Wind (UC) 95 MW
Wind (Pipeline) 300 MW
Nevada
Wind (Pipeline) 315 MW
New Mexico
Wind 90 MW
Wind (Pipeline) 160 MW
Texas
Wind 161 MW
Wind (UC) 150 MW
Wind (Pipeline) 480 MW
Iowa
Wind 145 MW
Wind (Pipeline) 200 MW
Minnesota
Wind 75 MW Wind (UC) 70 MW Wind (Pipeline) 169 MW
Illinois
Coal 5,613 MW Natural Gas 305 MW Wind (Pipeline) 420 MW
Pennsylvania
Coal 1,884 MW Wind (UC) 67 MW Wind (Pipeline) 60 MW
Wisconsin
Wind (Pipeline) 100 MW
Maine
Wind (Pipeline) 54 MW
New York
Wind (Pipeline) 130 MW
Maryland
Wind (Pipeline) 80 MW
West Virginia
Coal 40 MW
Wind (Pipeline) 345 MW
Operating Platform1
MW | % | ||||
Coal | 7,537 | 79 | % | ||
Natural Gas | 1,339 | 14 | % | ||
Wind | 471 | 5 | % | ||
Other | 153 | 2 | % | ||
9,500 | 100 | % |
Wind Development Pipeline1
MW | ||
Under Construction | 523 | |
Pipeline2 | 2,982 | |
Turbines (Not Shown) | 1,185 |
1 Natural gas includes oil-fired; other includes Doga in Turkey (144 MW) and Huntington biomass (9 MW) which are not shown. Turbines purchased or committed to support development pipeline. Data as of September 30, 2007.
2 |
| Data as of September 30, 2007; owned or under exclusive agreement. |
42nd EEI Financial Conference 12
EDISON INTERNATIONAL®
Leading the Way in Electricity SM
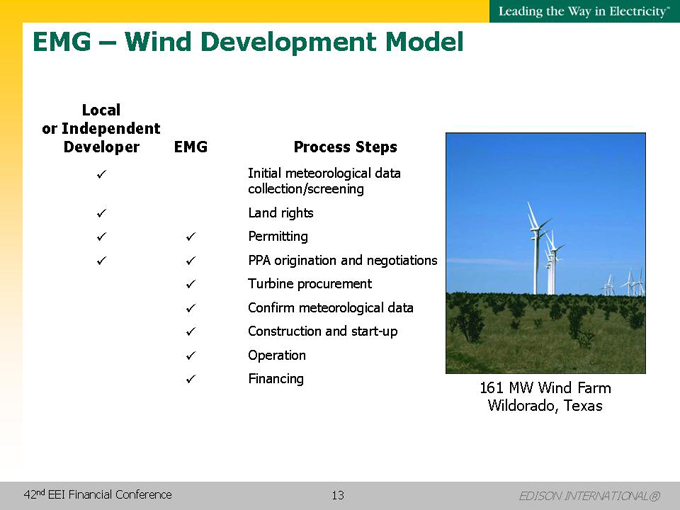
EMG – Wind Development Model
Local or Independent Developer
EMG
Process Steps
Initial meteorological data collection/screening
Land rights
Permitting
PPA origination and negotiations
Turbine procurement
Confirm meteorological data
Construction and start-up
Operation
Financing
161 MW Wind Farm Wildorado, Texas
42nd EEI Financial Conference 13
EDISON INTERNATIONAL®

Leading the Way in Electricity SM
EMG – Thermal Growth Project Opportunities
Natural Gas-Fired Generation
Thermal development (1,000 MW)
Walnut Creek and Sun Valley, CA opportunities (500 MW each) in permitting and engineering stage – SCE and other potential customers
Potential acquisitions of assets or portfolios
Will be selective and disciplined
Some regions showing developing capacity markets and higher spark spreads
Assets complement marketing and trading skills
IGCC with Carbon Sequestration
Carson Hydrogen Project (400-450 MW)
Joint Venture with BP at their Carson City refinery –
petroleum coke fuel with 90% CO2 used for
enhanced oil recovery
Confirming project economics and CO2 requirements
Other opportunities in early stage development
42nd EEI Financial Conference 14
EDISON INTERNATIONAL®
Leading the Way in Electricity SM
Our Shareholder Value Proposition
Attractive business portfolio and growth opportunities
Southern California Edison
Demonstrated need for utility infrastructure investments
Among the best domestic electric utility growth platforms
Edison Mission Group
Favorable market conditions for unregulated generation portfolio
Strong growth pipeline led by wind investments and clean fossil fuel technologies
Commitment to long-term shareholder value creation
Incentive compensation and stock ownership guidelines consistent with shareholder interests
Edison people committed to excellence in safety and customer service
42nd EEI Financial Conference 15
EDISON INTERNATIONAL®
Leading the Way in Electricity SM
Leading the Way in ElectricitySM
42nd EEI Financial Conference 16
EDISON INTERNATIONAL®