Exhibit 99.2
Leading the Way in ElectricitySM
First Quarter 2008
Financial Teleconference
May 8, 2008
EDISON INTERNATIONAL®
Leading the Way in ElectricitySM
Forward-Looking Statements
Statements contained in this presentation about future performance, including, without limitation, earnings, asset and rate base growth, load growth, capital investments, and other statements that are not purely historical, are forward-looking statements. These forward-looking statements reflect our current expectations; however, such statements involve risks and uncertainties. Actual results could differ materially from current expectations. Important factors that could cause different results are discussed under the headings “Risk Factors” and “Management’s Discussion and Analysis” in Edison International’s 2007 Form 10-K and other reports filed with the Securities and Exchange Commission are available on our website: www.edisoninvestor.com. These forward-looking statements represent our expectations only as of the date of this presentation, and Edison International assumes no duty to update them to reflect new information, events or circumstances.
EDISON INTERNATIONAL®
1
Leading the Way in ElectricitySM
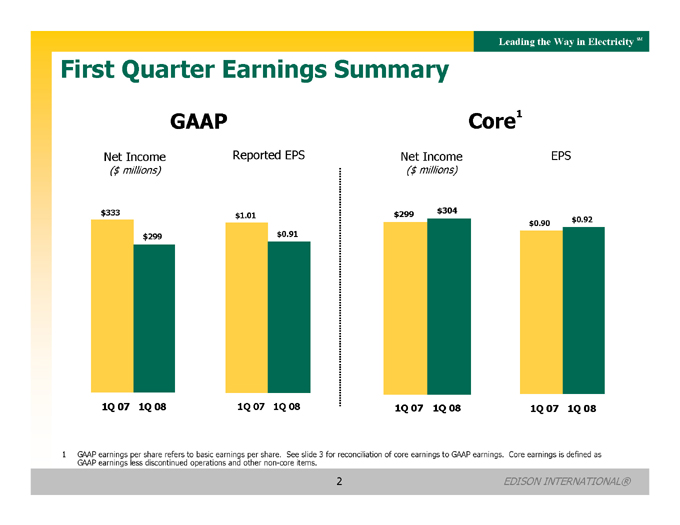
First Quarter Earnings Summary
GAAP
Net Income
($ millions)
Reported EPS
$333
$299
$1.01
$0.91
1Q 07 1Q 08
1Q 07 1Q 08
Core1
Net Income
($ millions)
EPS
$299
$304
$0.90
$0.92
1Q 07 1Q 08
1Q 07 1Q 08
1 GAAP earnings per share refers to basic earnings per share. See slide 3 for reconciliation of core earnings to GAAP earnings. Core earnings is defined as GAAP earnings less discontinued operations and other non-core items.
EDISON INTERNATIONAL®
2
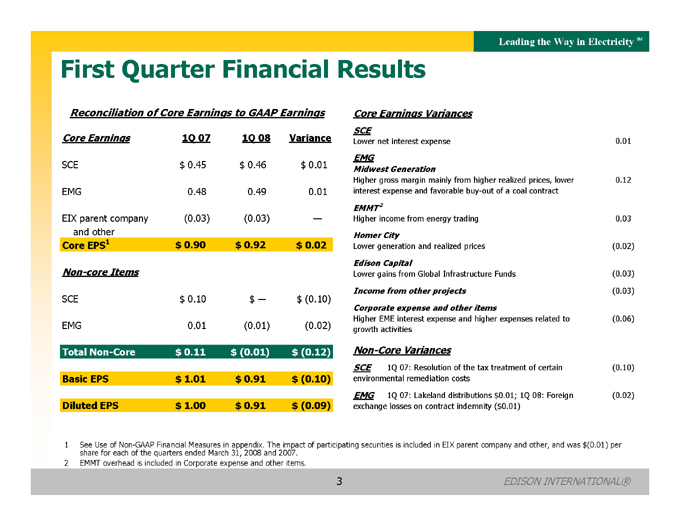
Leading the Way in ElectricitySM First Quarter Financial Results Reconciliation of Core Earnings to GAAP Earnings
Core Earnings 1Q 07 1Q 08 Variance
SCE $ 0.45 $ 0.46 $ 0.01
EMG 0.48 0.49 0.01
EIX parent company (0.03) (0.03) —and other
Core EPS1 $ 0.90 $ 0.92 $ 0.02
Non-core Items
SCE $ 0.10 $ — $ (0.10)
EMG 0.01 (0.01) (0.02)
Total Non-Core $ 0.11 $ (0.01) $ (0.12)
Basic EPS $ 1.01 $ 0.91 $ (0.10)
Diluted EPS $ 1.00 $ 0.91 $ (0.09)
Core Earnings Variances
SCE
Lower net interest expense 0.01
EMG
Midwest Generation
Higher gross margin mainly from higher realized prices, lower 0.12 interest expense and favorable buy-out of a coal contract
EMMT2
Higher income from energy trading 0.03
Homer City
Lower generation and realized prices (0.02)
Edison Capital
Lower gains from Global Infrastructure Funds (0.03)
Income from other projects (0.03) Corporate expense and other items
Higher EME interest expense and higher expenses related to (0.06) growth activities
Non-Core Variances
SCE 1Q 07: Resolution of the tax treatment of certain (0.10) environmental remediation costs EMG 1Q 07: Lakeland distributions $0.01; 1Q 08: Foreign (0.02) exchange losses on contract indemnity ($0.01)
1 See Use of Non-GAAP Financial Measures in appendix. The impact of participating securities is included in EIX parent company and other, and was $(0.01) per share for each of the quarters ended March 31, 2008 and 2007.
2 | | EMMT overhead is included in Corporate expense and other items. |
EDISON INTERNATIONAL®
3
Leading the Way in Electricity SM
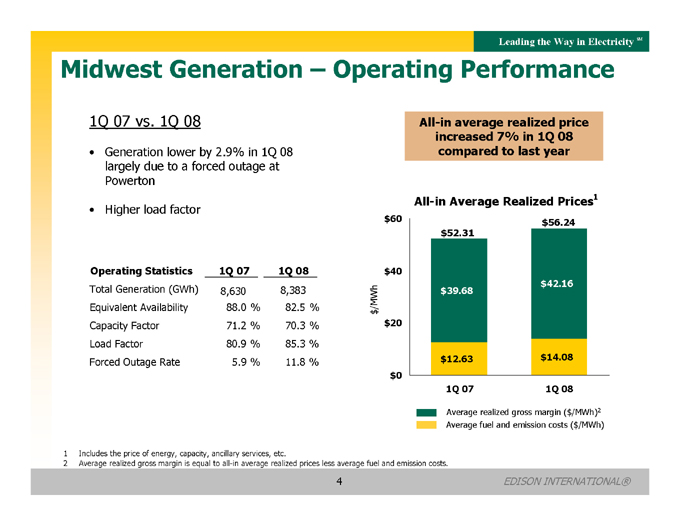
Midwest Generation – Operating Performance
1Q 07 vs. 1Q 08
• Generation lower by 2.9% in 1Q 08 largely due to a forced outage at Powerton
• Higher load factor
Operating Statistics 1Q 07 1Q 08
Total Generation (GWh) 8,630 8,383
Equivalent Availability 88.0 % 82.5 %
Capacity Factor 71.2 % 70.3 %
Load Factor 80.9 % 85.3 %
Forced Outage Rate 5.9 % 11.8 %
All-in average realized price increased 7% in 1Q 08 compared to last year
All-in Average Realized Prices1
$/MWh
$60
$40
$20
$0
$52.31
$39.68
$12.63
$56.24
$42.16
$14.08
1Q 07 1Q 08
Average realized gross margin ($/MWh)2 Average fuel and emission costs ($/MWh)
1 | | Includes the price of energy, capacity, ancillary services, etc. |
2 | | Average realized gross margin is equal to all-in average realized prices less average fuel and emission costs. |
EDISON INTERNATIONAL®
4
Leading the Way in ElectricitySM
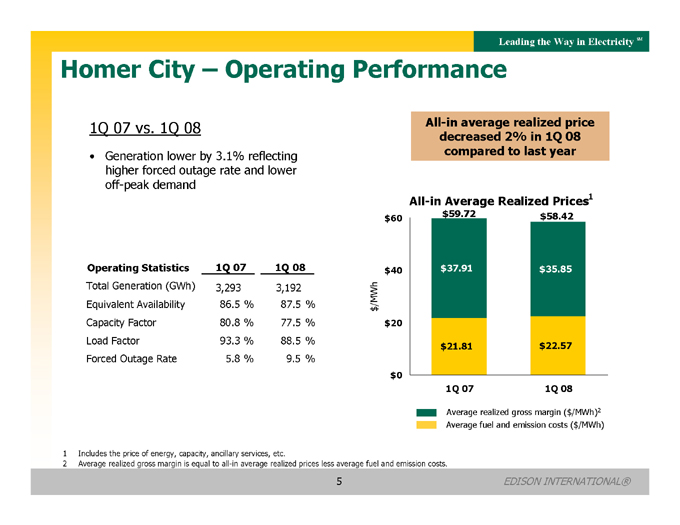
Homer City – Operating Performance
1Q 07 vs. 1Q 08
• Generation lower by 3.1% reflecting higher forced outage rate and lower off-peak demand
Operating Statistics 1Q 07 1Q 08
Total Generation (GWh) 3,293 3,192
Equivalent Availability 86.5 % 87.5 %
Capacity Factor 80.8 % 77.5 %
Load Factor 93.3 % 88.5 %
Forced Outage Rate 5.8 % 9.5 %
All-in average realized price decreased 2% in 1Q 08 compared to last year
All-in Average Realized Prices1
$/MWh
$0
$20
$40
$60
$21.81
$37.91
$59.72
$22.57
$35.85
$58.42
1Q 07 1Q 08
Average realized gross margin ($/MWh)2 Average fuel and emission costs ($/MWh)2
1 | | Includes the price of energy, capacity, ancillary services, etc. |
2 | | Average realized gross margin is equal to all-in average realized prices less average fuel and emission costs. |
EDISON INTERNATIONAL®
5
Leading the Way in ElectricitySM
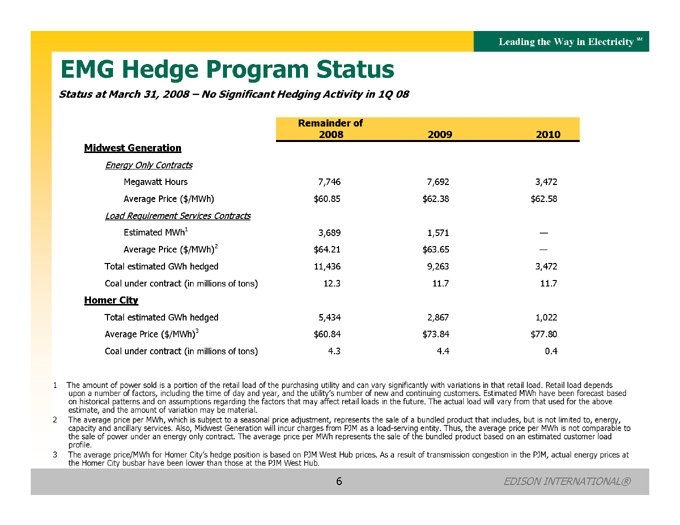
EMG Hedge Program Status
Status at March 31, 2008 – No Significant Hedging Activity in 1Q 08
Energy Only Contracts
Remainder of
2008 2009 2010
Midwest Generation
Megawatt Hours 7,746 7,692 3,472
Average Price ($/MWh) $ 60.85 $ 62.38 $ 62.58
Load Requirement Services Contracts
Estimated MWh1 3,689 1,571 —
Average Price ($/MWh)2 $ 64.21 $ 63.65 —
Total estimated GWh hedged 11,436 9,263 3,472
Coal under contract (in millions of tons) 12.3 11.7 11.7
Homer City
Total estimated GWh hedged 5,434 2,867 1,022
Average Price ($/MWh)3 $ 60.84 $ 73.84 $ 77.80
Coal under contract (in millions of tons) 4.3 4.4 0.4
1 The amount of power sold is a portion of the retail load of the purchasing utility and can vary significantly with variations in that retail load. Retail load depends upon a number of factors, including the time of day and year, and the utility’s number of new and continuing customers. Estimated MWh have been forecast based on historical patterns and on assumptions regarding the factors that may affect retail loads in the future. The actual load will vary from that used for the above estimate, and the amount of variation may be material.
2 The average price per MWh, which is subject to a seasonal price adjustment, represents the sale of a bundled product that includes, but is not limited to, energy, capacity and ancillary services. Also, Midwest Generation will incur charges from PJM as a load-serving entity. Thus, the average price per MWh is not comparable to the sale of power under an energy only contract. The average price per MWh represents the sale of the bundled product based on an estimated customer load profile.
3 The average price/MWh for Homer City’s hedge position is based on PJM West Hub prices. As a result of transmission congestion in the PJM, actual energy prices at the Homer City busbar have been lower than those at the PJM West Hub.
EDISON INTERNATIONAL®
6
Leading the Way in Electricity SM
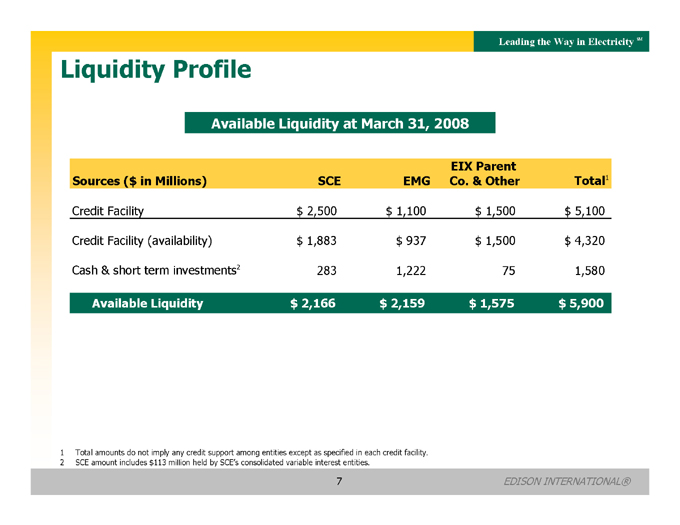
Liquidity Profile
Available Liquidity at March 31, 2008
EIX Parent
Sources ($ in Millions) SCE EMG Co. & Other Total1
Credit Facility $ 2,500 $ 1,100 $ 1,500 $ 5,100
Credit Facility (availability) $ 1,883 $ 937 $ 1,500 $ 4,320
Cash & short term investments2 283 1,222 75 1,580
Available Liquidity $ 2,166 $ 2,159 $ 1,575 $ 5,900
1 | | Total amounts do not imply any credit support among entities except as specified in each credit facility. |
2 | | SCE amount includes $113 million held by SCE’s consolidated variable interest entities. |
EDISON INTERNATIONAL®
7
Leading the Way in Electricity SM
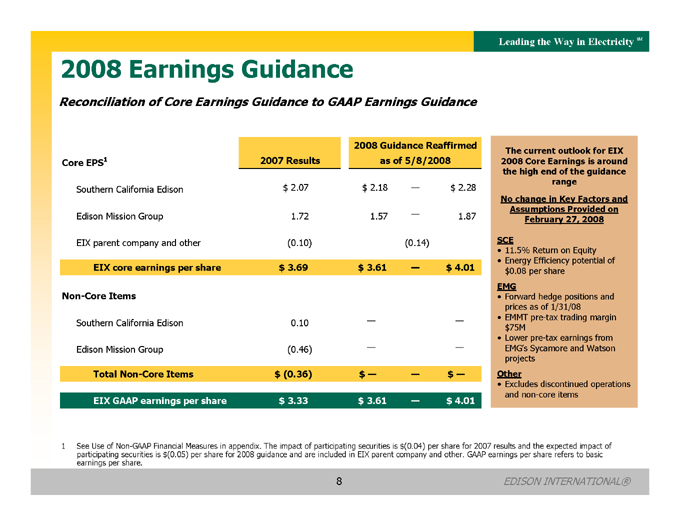
2008 Earnings Guidance
Reconciliation of Core Earnings Guidance to GAAP Earnings Guidance
2008 Guidance Reaffirmed
Core EPS1 2007 Results as of 5/8/2008
Southern California Edison $ 2.07 $ 2.18 — $ 2.28
Edison Mission Group 1.72 1.57 — 1.87
EIX parent company and other (0.10) (0.14)
EIX core earnings per share $ 3.69 $ 3.61 — $ 4.01
Non-Core Items
Southern California Edison 0.10 — —
Edison Mission Group (0.46) — —
Total Non-Core Items $ (0.36) $ — — $ —
EIX GAAP earnings per share $ 3.33 $ 3.61 — $ 4.01
The current outlook for EIX
2008 Core Earnings is around
the high end of the guidance range No change in Key Factors and
Assumptions Provided on February 27, 2008 SCE
11.5% Return on Equity Energy Efficiency potential of $0.08 per share EMG
Forward hedge positions and
prices as of 1/31/08
EMMT pre-tax trading margin
$75M
Lower pre-tax earnings from
EMG’s Sycamore and Watson
projects
Other
Excludes discontinued operations
and non-core items
1 See Use of Non-GAAP Financial Measures in appendix. The impact of participating securities is $(0.04) per share for 2007 results and the expected impact of participating securities is $(0.05) per share for 2008 guidance and are included in EIX parent company and other. GAAP earnings per share refers to basic earnings per share.
EDISON INTERNATIONAL®
8

Leading the Way in ElectricitySM
Appendix
EDISON INTERNATIONAL®
9
Leading the Way in ElectricitySM
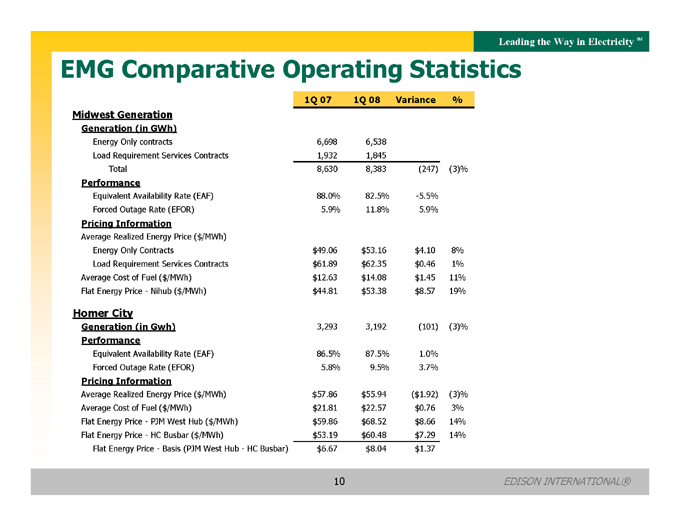
EMG Comparative Operating Statistics
1Q 07 1Q 08 Variance %
Midwest Generation
Generation (in GWh)
Energy Only contracts 6,698 6,538
Load Requirement Services Contracts 1,932 1,845
Total 8,630 8,383 (247) (3)%
Performance
Equivalent Availability Rate (EAF) 88.0% 82.5% -5.5%
Forced Outage Rate (EFOR) 5.9% 11.8% 5.9%
Pricing Information
Average Realized Energy Price ($/MWh)
Energy Only Contracts $ 49.06 $ 53.16 $ 4.10 8%
Load Requirement Services Contracts $ 61.89 $ 62.35 $ 0.46 1%
Average Cost of Fuel ($/MWh) $ 12.63 $ 14.08 $ 1.45 11%
Flat Energy Price - Nihub ($/MWh) $ 44.81 $ 53.38 $ 8.57 19%
Homer City
Generation (in Gwh) 3,293 3,192 (101) (3)%
Performance
Equivalent Availability Rate (EAF) 86.5% 87.5% 1.0%
Forced Outage Rate (EFOR) 5.8% 9.5% 3.7%
Pricing Information
Average Realized Energy Price ($/MWh) $ 57.86 $ 55.94 ($ 1.92) (3)%
Average Cost of Fuel ($/MWh) $ 21.81 $ 22.57 $ 0.76 3%
Flat Energy Price - PJM West Hub ($/MWh) $ 59.86 $ 68.52 $ 8.66 14%
Flat Energy Price - HC Busbar ($/MWh) $ 53.19 $ 60.48 $ 7.29 14%
Flat Energy Price - Basis (PJM West Hub - HC Busbar) $6.67 $8.04 $ 1.37
EDISON INTERNATIONAL®
10
Leading the Way in ElectricitySM
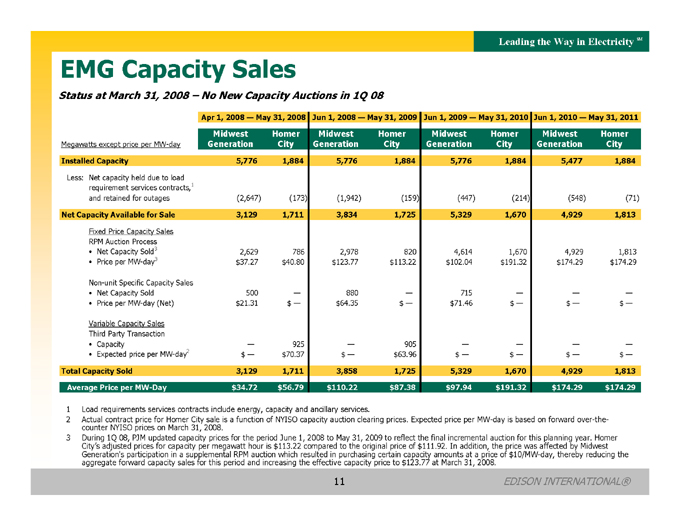
EMG Capacity Sales
Status at March 31, 2008 – No New Capacity Auctions in 1Q 08
Apr 1, 2008 — May 31, 2008 Jun 1, 2008 — May 31, 2009 Jun 1, 2009 — May 31, 2010 Jun 1, 2010 — May 31, 2011
Midwest Homer Midwest Homer Midwest Homer Midwest Homer Megawatts except price per MW-day Generation City Generation City Generation City Generation City
Installed Capacity 5,776 1,884 5,776 1,884 5,776 1,884 5,477 1,884
Less: Net capacity held due to load requirement services contracts,1 and retained for outages (2,647) (173) (1,942) (159) (447) (214) (548) (71)
Net Capacity Available for Sale 3,129 1,711 3,834 1,725 5,329 1,670 4,929 1,813
Fixed Price Capacity Sales RPM Auction Process
• Net Capacity Sold3 2,629 786 2,978 820 4,614 1,670 4,929 1,813
• Price per MW-day3 $37.27 $40.80 $123.77 $113.22 $102.04 $191.32 $174.29 $174.29
Non-unit Specific Capacity Sales
• Net Capacity Sold 500 — 880 — 715 — — —
• Price per MW-day (Net) $21.31 $ — $64.35 $ — $71.46 $ — $ — $ —
Variable Capacity Sales Third Party Transaction
• Capacity — 925 — 905 — — — —
• Expected price per MW-day2 $ — $70.37 $ — $63.96 $ — $ — $ — $ —
Total Capacity Sold 3,129 1,711 3,858 1,725 5,329 1,670 4,929 1,813
Average Price per MW-Day $34.72 $56.79 $110.22 $87.38 $97.94 $191.32 $174.29 $174.29
1 Load requirements services contracts include energy, capacity and ancillary services.
2 Actual contract price for Homer City sale is a function of NYISO capacity auction clearing prices. Expected price per MW-day is based on forward over-the-counter NYISO prices on March 31, 2008.
3 During 1Q 08, PJM updated capacity prices for the period June 1, 2008 to May 31, 2009 to reflect the final incremental auction for this planning year. Homer City’s adjusted prices for capacity per megawatt hour is $113.22 compared to the original price of $111.92. In addition, the price was affected by Midwest Generation’s participation in a supplemental RPM auction which resulted in purchasing certain capacity amounts at a price of $10/MW-day, thereby reducing the aggregate forward capacity sales for this period and increasing the effective capacity price to $123.77 at March 31, 2008.
EDISON INTERNATIONAL®
11
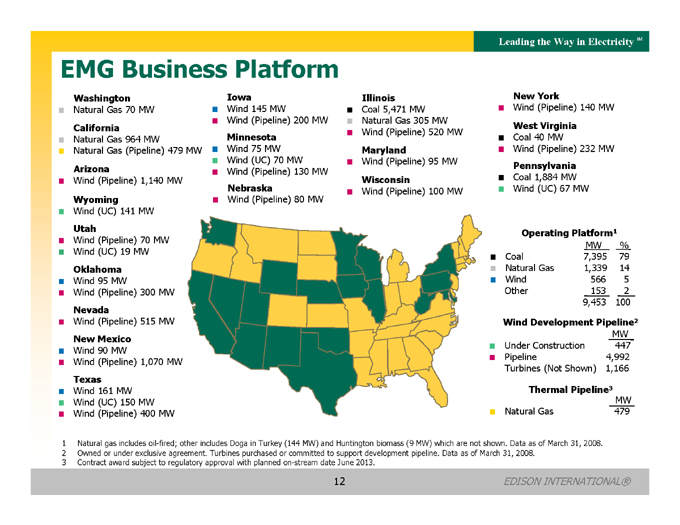
Leading the Way in ElectricitySM EMG Business Platform
Washington Natural Gas 70 MW California
Natural Gas 964 MW Natural Gas (Pipeline) 479 MW Arizona Wind (Pipeline) 1,140 MW
Wyoming Wind (UC) 141 MW Utah Wind (Pipeline) 70 MW
Wind (UC) 19 MW Oklahoma Wind 95 MW
Wind (Pipeline) 300 MW Nevada Wind (Pipeline) 515 MW
New Mexico Wind 90 MW Wind (Pipeline) 1,070 MW Texas Wind 161 MW
Wind (UC) 150 MW
Wind (Pipeline) 400 MW
Iowa Wind 145 MW Wind (Pipeline) 200 MW
Minnesota Wind 75 MW
Wind (UC) 70 MW
Wind (Pipeline) 130 MW Nebraska Wind (Pipeline) 80 MW Illinois
Coal 5,471 MW
Natural Gas 305 MW Wind (Pipeline) 520 MW Maryland
Wind (Pipeline) 95 MW Wisconsin
Wind (Pipeline) 100 MW
New York Wind (Pipeline) 140 MW West Virginia Coal 40 MW
Wind (Pipeline) 232 MW Pennsylvania Coal 1,884 MW
Wind (UC) 67 MW
Operating Platform1 MW % Coal 7,395 79
Natural Gas 1,339 14
Wind 566 5 Other 153 2 9,453 100
Wind Development Pipeline2 MW
Under Construction 447
Pipeline 4,992 Turbines (Not Shown) 1,166 Thermal Pipeline3
MW
Natural Gas 479
1 Natural gas includes oil-fired; other includes Doga in Turkey (144 MW) and Huntington biomass (9 MW) which are not shown. Data as of March 31, 2008.
2 Owned or under exclusive agreement. Turbines purchased or committed to support development pipeline. Data as of March 31, 2008.
3 Contract award subject to regulatory approval with planned on-stream date June 2013.
EDISON INTERNATIONAL®
12
Leading the Way in ElectricitySM
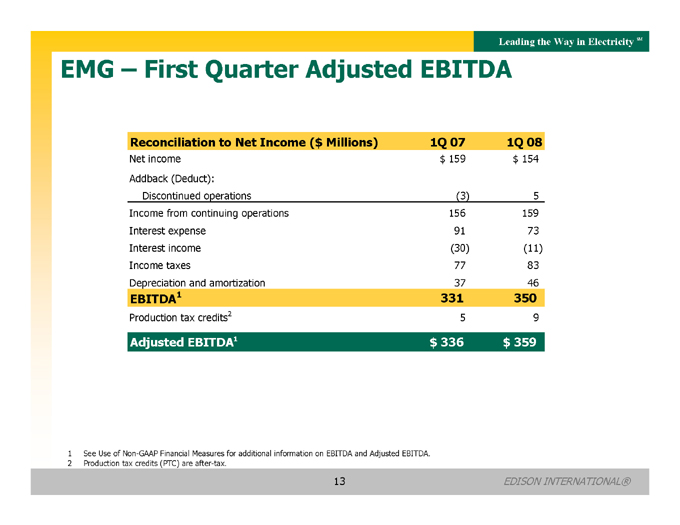
EMG – First Quarter Adjusted EBITDA
Reconciliation to Net Income ($ Millions) 1Q 07 1Q 08
Net income $ 159 $ 154
Addback (Deduct):
Discontinued operations (3) 5
Income from continuing operations 156 159
Interest expense 91 73
Interest income (30) (11)
Income taxes 77 83
Depreciation and amortization 37 46
EBITDA1 331 350
Production tax credits2 5 9
Adjusted EBITDA1 $ 336 $ 359
1 | | See Use of Non-GAAP Financial Measures for additional information on EBITDA and Adjusted EBITDA. |
2 | | Production tax credits (PTC) are after-tax. |
EDISON INTERNATIONAL®
13
Leading the Way in ElectricitySM
Use of Non-GAAP Financial Measures
Edison International’s earnings are prepared in accordance with generally accepted accounting principles used in the United States and represent the company’s earnings as reported to the Securities and Exchange Commission. Our management uses core earnings and EPS by principal operating subsidiary internally for financial planning and for analysis of performance. We also use core earnings and EPS by principal operating subsidiary as primary performance measurements when communicating with analysts and investors regarding our earnings results and outlook, as it allows us to more accurately compare the company’s ongoing performance across periods. Core earnings exclude discontinued operations and other non-core items and are reconciled to basic earnings per common share.
EPS by principal operating subsidiary is based on the principal operating subsidiary net income and Edison International’s weighted average outstanding common shares. The impact of participating securities (vested stock options that earn dividend equivalents that may participate in undistributed earnings with common stock) for each principal operating subsidiary is not material to each principal operating subsidiary’s EPS and is therefore reflected in the results of the Edison International holding company, which we refer to as EIX parent company. EPS and core EPS by principal operating subsidiary are reconciled to basic earnings per common share.
EBITDA is defined as earnings before interest, income taxes, depreciation and amortization. Adjusted EBITDA includes production tax credits from EMG’s wind projects and excludes amounts from gain on the sale of assets, loss on early extinguishment of debt and leases, and impairment of assets and investments. Our management uses Adjusted EBITDA as an important financial measure for evaluating EMG.
A reconciliation of Non-GAAP information to GAAP information, including the impact of participating securities, is included either on the slide where the information appears or on another slide referenced in the presentation.
EDISON INTERNATIONAL®
14