Exhibit 99.1
Leading the Way in Electricity SM
Business Update
May-June 2008
May 23, 2008
EDISON INTERNATIONAL®
Leading the Way in Electricity SM
Forward-Looking Statements
Statements contained in this presentation about future performance, including, without limitation, earnings, asset and rate base growth, load growth, capital investments, and other statements that are not purely historical, are forward-looking statements. These forward-looking statements reflect our current expectations; however, such statements involve risks and uncertainties. Actual results could differ materially from current expectations. Important factors that could cause different results are discussed under the headings “Risk Factors” and “Management’s Discussion and Analysis” in Edison International’s 2007 Form 10-K and other reports filed with the Securities and Exchange Commission are available on our website: www.edisoninvestor.com. These forward-looking statements represent our expectations only as of the date of this presentation, and Edison International assumes no duty to update them to reflect new information, events or circumstances.
May 23, 2008
1
EDISON INTERNATIONAL®
Leading the Way in Electricity SM
What’s New Since Our April Update
Updated Information
• 1Q 2008 results and forward looking forecasts as appropriate
• Regulatory matters (p. 19, 33)
Additional Topics
• Renewable transmission planning (p. 20)
• Electronic technology solutions to meet the climate change challenge (p. 21)
• Shareholder value proposition (p. 31)
May 23, 2008
2
EDISON INTERNATIONAL®

Leading the Way in Electricity SM
Strategic Overview
May 23, 2008
3
EDISON INTERNATIONAL®
Leading the Way in Electricity SM
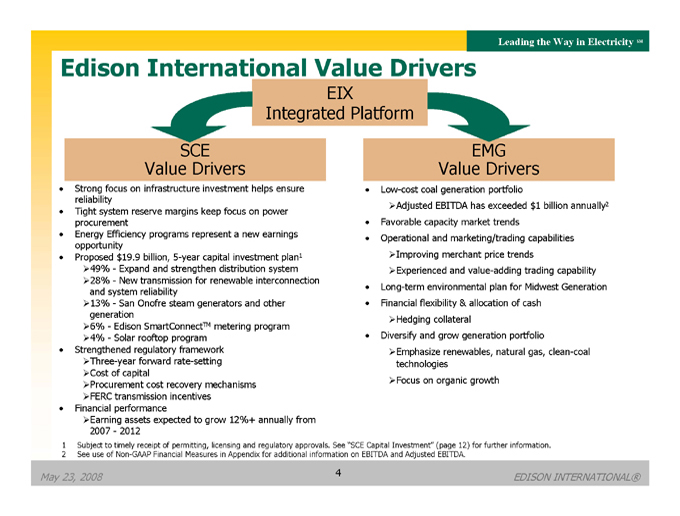
Edison International Value Drivers
EIX Integrated Platform
SCE Value Drivers
Strong focus on infrastructure investment helps ensure reliability Tight system reserve margins keep focus on power procurement Energy Efficiency programs represent a new earnings opportunity Proposed $19.9 billion, 5-year capital investment plan1
49%—Expand and strengthen distribution system
28%—New transmission for renewable interconnection and system reliability
13%—San Onofre steam generators and other generation
6%—Edison SmartConnectTM metering program
4%—Solar rooftop program Strengthened regulatory framework
Three-year forward rate-setting
Cost of capital
Procurement cost recovery mechanisms
FERC transmission incentives Financial performance
Earning assets expected to grow 12%+ annually from 2007—2012
EMG Value Drivers
Low-cost coal generation portfolio
Adjusted EBITDA has exceeded $1 billion annually2 Favorable capacity market trends Operational and marketing/trading capabilities
Improving merchant price trends
Experienced and value-adding trading capability Long-term environmental plan for Midwest Generation Financial flexibility & allocation of cash
Hedging collateral
Diversify and grow generation portfolio
Emphasize renewables, natural gas, clean-coal technologies
Focus on organic growth
1 Subject to timely receipt of permitting, licensing and regulatory approvals. See “SCE Capital Investment” (page 12) for further information.
2 See use of Non-GAAP Financial Measures in Appendix for additional information on EBITDA and Adjusted EBITDA.
May 23, 2008
4
EDISON INTERNATIONAL®
Leading the Way in Electricity SM
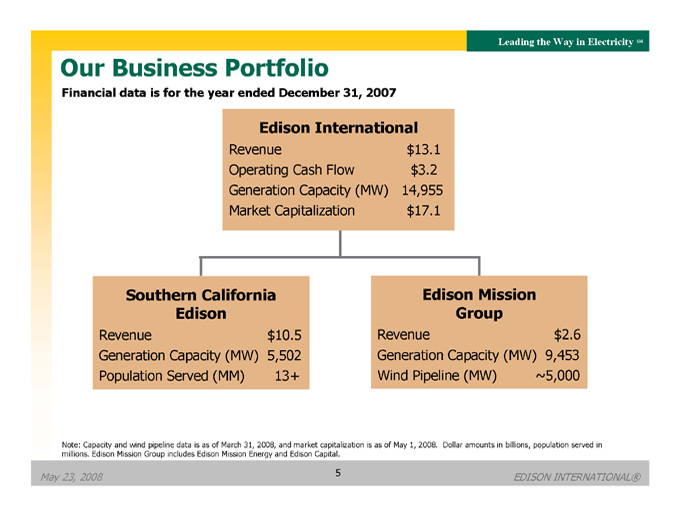
Our Business Portfolio
Financial data is for the year ended December 31, 2007
Edison International
Revenue $13.1 Operating Cash Flow $3.2 Generation Capacity (MW) 14,955 Market Capitalization $17.1
Southern California Edison
Revenue $10.5 Generation Capacity (MW) 5,502 Population Served (MM) 13+
Edison Mission Group
Revenue $2.6 Generation Capacity (MW) 9,453 Wind Pipeline (MW) ~5,000
Note: Capacity and wind pipeline data is as of March 31, 2008, and market capitalization is as of May 1, 2008. Dollar amounts in billions, population served in millions. Edison Mission Group includes Edison Mission Energy and Edison Capital.
May 23, 2008
5
EDISON INTERNATIONAL®
Leading the Way in Electricity SM
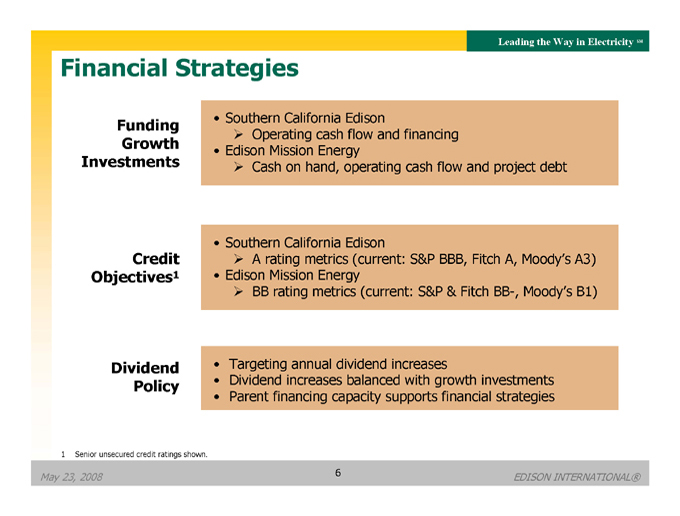
Financial Strategies
Funding Growth Investments
Southern California Edison
Operating cash flow and financing
Edison Mission Energy
Cash on hand, operating cash flow and project debt
Credit Objectives1
Southern California Edison
A rating metrics (current: S&P BBB, Fitch A, Moody’s A3)
Edison Mission Energy
BB rating metrics (current: S&P & Fitch BB-, Moody’s B1)
Dividend Policy
Targeting annual dividend increases
Dividend increases balanced with growth investments Parent financing capacity supports financial strategies
1 Senior unsecured credit ratings shown.
May 23, 2008
6
EDISON INTERNATIONAL®
Leading the Way in Electricity SM
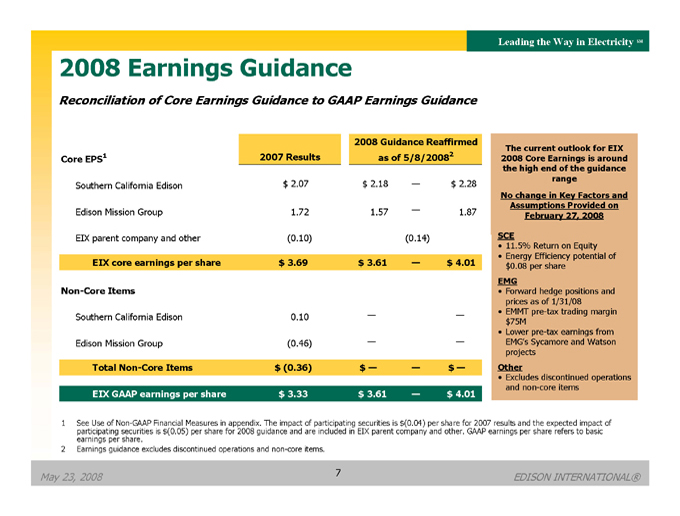
2008 Earnings Guidance
Reconciliation of Core Earnings Guidance to GAAP Earnings Guidance
2008 Guidance Reaffirmed Core EPS1 2007 Results as of 5/8/20082
Southern California Edison $ 2.07 $ 2.18 — $ 2.28 Edison Mission Group 1.72 1.57 — 1.87 EIX parent company and other (0.10) (0.14)
EIX core earnings per share $ 3.69 $ 3.61 — $ 4.01
Non-Core Items
Southern California Edison 0.10 — —
Edison Mission Group (0.46) — —
Total Non-Core Items $ (0.36) $ — — $ —
EIX GAAP earnings per share $ 3.33 $ 3.61 — $ 4.01
The current outlook for EIX 2008 Core Earnings is around the high end of the guidance range No change in Key Factors and Assumptions Provided on February 27, 2008
SCE
11.5% Return on Equity
Energy Efficiency potential of $0.08 per share
EMG
Forward hedge positions and prices as of 1/31/08
EMMT pre-tax trading margin $75M
Lower pre-tax earnings from EMG’s Sycamore and Watson projects
Other
• Excludes discontinued operations and non-core items
1 See Use of Non-GAAP Financial Measures in appendix. The impact of participating securities is $(0.04) per share for 2007 results and the expected impact of participating securities is $(0.05) per share for 2008 guidance and are included in EIX parent company and other. GAAP earnings per share refers to basic earnings per share.
2 Earnings guidance excludes discontinued operations and non-core items.
May 23, 2008
7
EDISON INTERNATIONAL®
Leading the Way in Electricity SM
Southern California Edison (SCE)
An Investor-Owned Electric Utility
May 23, 2008
8
EDISON INTERNATIONAL®
Leading the Way in Electricity SM
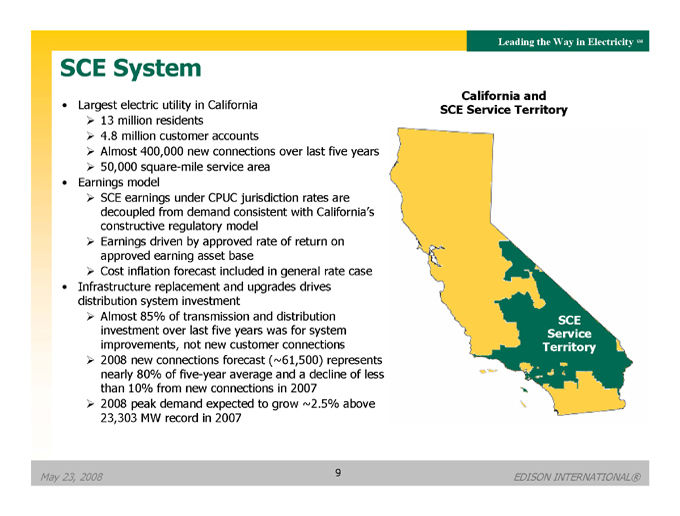
SCE System
Largest electric utility in California
13 million residents
4.8 million customer accounts
Almost 400,000 new connections over last five years
50,000 square-mile service area
Earnings model
SCE earnings under CPUC jurisdiction rates are decoupled from demand consistent with California’s constructive regulatory model
Earnings driven by approved rate of return on approved earning asset base
Cost inflation forecast included in general rate case
Infrastructure replacement and upgrades drives distribution system investment
Almost 85% of transmission and distribution investment over last five years was for system improvements, not new customer connections
2008 new connections forecast (~61,500) represents nearly 80% of five-year average and a decline of less than 10% from new connections in 2007
2008 peak demand expected to grow ~2.5% above 23,303 MW record in 2007
California and SCE Service Territory
SCE Service Territory
May 23, 2008
9
EDISON INTERNATIONAL®
Leading the Way in Electricity SM
SCE Long-Term Resource Objectives
SCE Distribution System Supply and Demand Balance (MW)
Power Resource Needs
Supply Objectives
New Renewables
Other Projects Underway
1,874
830
4,176
1,339
319
Increased
Demand
Requirement1
Potential
Retirements
Anticipated
New
Generation
New Demand-
Side Resources
Potential Need
by 20152
System
Reliability
Price
Stability
Environmental
Considerations
Balance Objectives
• Energy efficiency
• Demand response
• Renewable resources
• Distributed generation
• Clean fossil fuel generation
Load growth, retirements, and renewable mandates drive power resource needs
• ~6,700 MW new resources required
• ~1,350 MW new generation contracts awarded March 2008
1 Relative to 2007; data as of February 2008, includes planning reserve margin (PRM) of 15%. Source: 2006 SCE Long-Term Procurement Plan Final Decision; CEC November Load Forecast.
2 This number is without DPV2.
May 23, 2008
10
EDISON INTERNATIONAL®
Leading the Way in Electricity SM
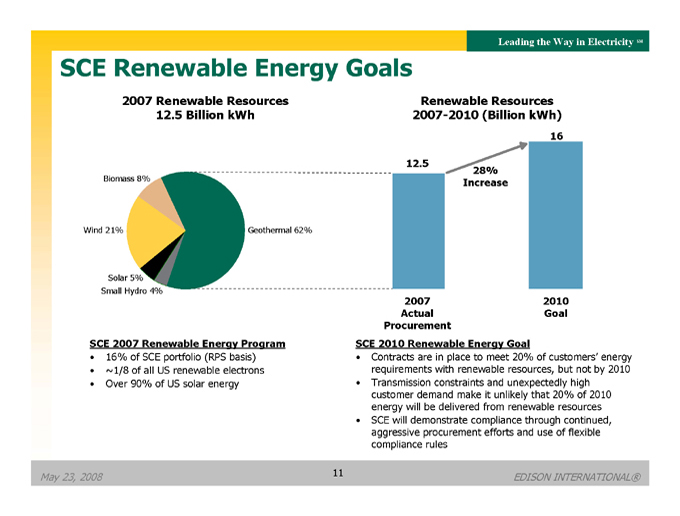
SCE Renewable Energy Goals
2007 Renewable Resources 12.5 Billion kWh
Biomass 8%
Wind 21%
Geothermal 62%
Solar 5% Small Hydro 4%
SCE 2007 Renewable Energy Program
• 16% of SCE portfolio (RPS basis)
• ~1/8 of all US renewable electrons
• Over 90% of US solar energy
Renewable Resources 2007-2010 (Billion kWh)
12.5
2007 Actual Procurement
28% Increase
16 2010 Goal
SCE 2010 Renewable Energy Goal
• Contracts are in place to meet 20% of customers’ energy requirements with renewable resources, but not by 2010
• Transmission constraints and unexpectedly high customer demand make it unlikely that 20% of 2010 energy will be delivered from renewable resources
• SCE will demonstrate compliance through continued, aggressive procurement efforts and use of flexible compliance rules
May 23, 2008
11
EDISON INTERNATIONAL®
Leading the Way in Electricity SM
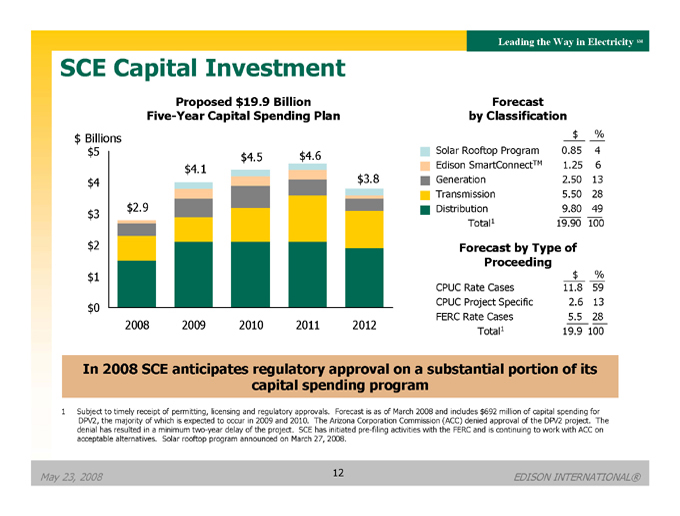
SCE Capital Investment
Proposed $19.9 Billion Five-Year Capital Spending Plan
$ Billions
$5
$4
$3
$2
$1
$0 $2.9
$4.1
$4.5
$4.6
$3.8
2008
2009
2010
2011
2012
Forecast by Classification
$ % Solar Rooftop Program 0.85 4
Edison SmartConnectTM 1.25 6
Generation 2.50 13
Transmission 5.50 28
Distribution 9.80 49 Total1 19.90 100
Forecast by Type of Proceeding
$ % CPUC Rate Cases 11.8 59
CPUC Project Specific 2.6 13
FERC Rate Cases 5.5 28
Total1 19.9 100
In 2008 SCE anticipates regulatory approval on a substantial portion of its capital spending program
1 Subject to timely receipt of permitting, licensing and regulatory approvals. Forecast is as of March 2008 and includes $692 million of capital spending for DPV2, the majority of which is expected to occur in 2009 and 2010. The Arizona Corporation Commission (ACC) denied approval of the DPV2 project. The denial has resulted in a minimum two-year delay of the project. SCE has initiated pre-filing activities with the FERC and is continuing to work with ACC on acceptable alternatives. Solar rooftop program announced on March 27, 2008.
May 23, 2008
12
EDISON INTERNATIONAL®
Leading the Way in Electricity SM
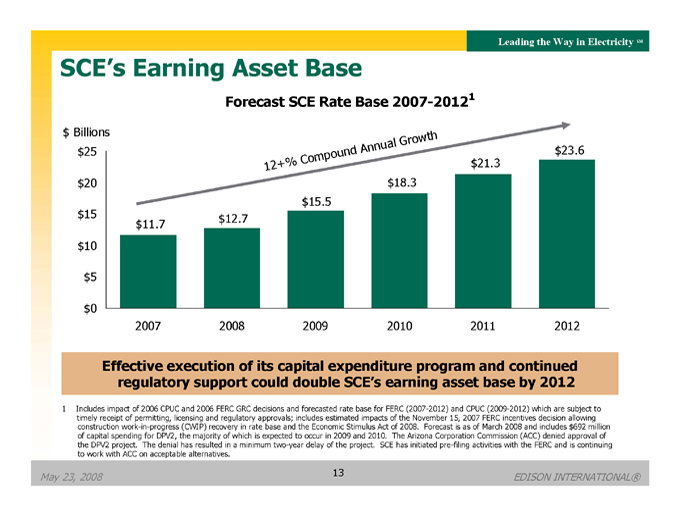
SCE’s Earning Asset Base
Forecast SCE Rate Base 2007-20121
$ Billions
$25
$20
$15
$10
$5
$0
12+% Compound Annual Growth
$11.7
$12.7
$15.5
$18.3
$21.3
$23.6
2007
2008
2009
2010
2011
2012
Effective execution of its capital expenditure program and continued regulatory support could double SCE’s earning asset base by 2012
1 Includes impact of 2006 CPUC and 2006 FERC GRC decisions and forecasted rate base for FERC (2007-2012) and CPUC (2009-2012) which are subject to timely receipt of permitting, licensing and regulatory approvals; includes estimated impacts of the November 15, 2007 FERC incentives decision allowing construction work-in-progress (CWIP) recovery in rate base and the Economic Stimulus Act of 2008. Forecast is as of March 2008 and includes $692 million of capital spending for DPV2, the majority of which is expected to occur in 2009 and 2010. The Arizona Corporation Commission (ACC) denied approval of the DPV2 project. The denial has resulted in a minimum two-year delay of the project. SCE has initiated pre-filing activities with the FERC and is continuing to work with ACC on acceptable alternatives.
May 23, 2008
13
EDISON INTERNATIONAL®
Leading the Way in Electricity SM
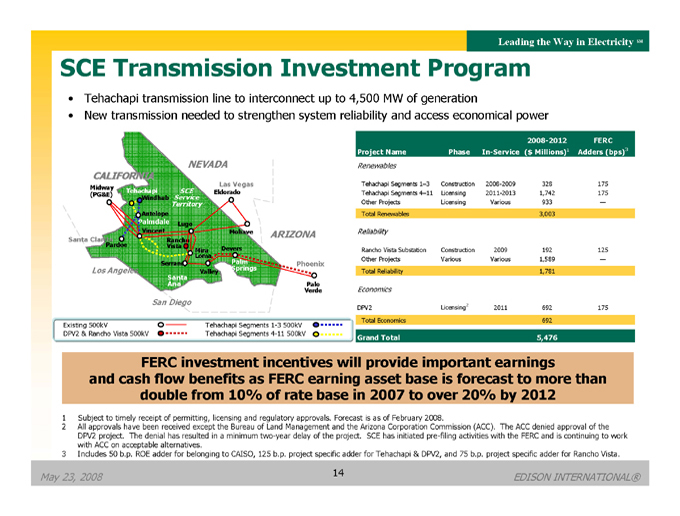
SCE Transmission Investment Program
• Tehachapi transmission line to interconnect up to 4,500 MW of generation
• New transmission needed to strengthen system reliability and access economical power
NEVADA CALIFORNIA
Las Vegas
Midway
Tehachapi SCE Eldorado
(PG&E) Service
Windhub
Territory
Antelope
Palmdale Lugo
Vincent Mohave ARIZONA
Santa Clarita Rancho Pardee Vista
Mira Devers Loma
Serrano Palm Phoenix
Los Angeles Springs
Valley
Santa
Ana Palo Verde
Existing 500kV Tehachapi Segments 1-3 500kV DPV2 & Rancho Vista 500kV Tehachapi Segments 4-11 500kV
2008-2012 FERC
Project Name Phase In-Service ($ Millions)1 Adders (bps)3
Renewables
Tehachapi Segments 1–3 Construction 2008-2009 328 175
Tehachapi Segments 4–11 Licensing 2011-2013 1,742 175
Other Projects Licensing Various 933 —
Total Renewables 3,003
Reliability
Rancho Vista Substation Construction 2009 192 125
Other Projects Various Various 1,589 —
Total Reliability 1,781
Economics
DPV2 Licensing2 2011 692 175
Total Economics 692
Grand Total 5,476
FERC investment incentives will provide important earnings and cash flow benefits as FERC earning asset base is forecast to more than double from 10% of rate base in 2007 to over 20% by 2012
1 Subject to timely receipt of permitting, licensing and regulatory approvals. Forecast is as of February 2008.
2 All approvals have been received except the Bureau of Land Management and the Arizona Corporation Commission (ACC). The ACC denied approval of the DPV2 project. The denial has resulted in a minimum two-year delay of the project. SCE has initiated pre-filing activities with the FERC and is continuing to work with ACC on acceptable alternatives.
3 Includes 50 b.p. ROE adder for belonging to CAISO, 125 b.p. project specific adder for Tehachapi & DPV2, and 75 b.p. project specific adder for Rancho Vista.
May 23, 2008
14
EDISON INTERNATIONAL®
Leading the Way in Electricity SM
SCE Edison SmartConnectTM Program
Phase III Meter Installation Timeline
Cumulative Capital Spending & Meter Installations
2008 2009 2010 2011 2012
$100 M $450 M $800 M $1,100 M $1,245 M
– 1.4 M 3.0 M 4.6 M 5.3 M
Highlights
• Phase III application filed July 2007 to deploy
to 5.3 million residential and small commercial
customers between 2008 – 2012
• Estimated total project cost is $1.7 billion, of
which approximately $ 1.25 billion is capital
cost to be included in rate base 1
• SmartConnectTM combines the efforts of IBM,
Itron and eMeter to manage system
integration, meter technology and data
management, respectively
• Edison SmartConnectTM has the potential to
reduce peak power consumption by as much
as 1,000 MW and reduce GHG emissions by
365,000 metric tons per year
Integrate Homes with the Utility Circuit
Integrate Smart Appliances with the Home
SCE leadership in advanced metering infrastructure
1 Subject to CPUC approval.
May 23, 2008
15
EDISON INTERNATIONAL®
Leading the Way in Electricity SM
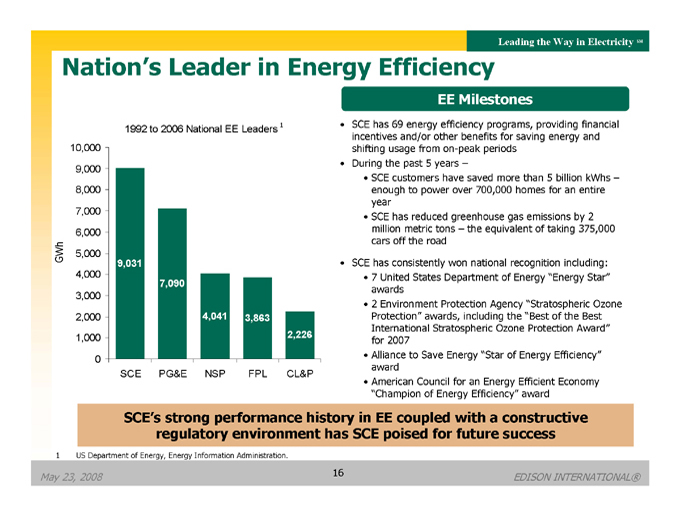
Nation’s Leader in Energy Efficiency
1992 to 2006 National EE Leaders 1
10,000
9,000 8,000 7,000 6,000 5,000 4,000 3,000 2,000 1,000 0
9,031
7,090
4,041
3,863
2,226
SCE
PG&E
NSP
FPL
EE Milestones
• SCE has 69 energy efficiency programs, providing financial incentives and/or other benefits for saving energy and shifting usage from on-peak periods
• During the past 5 years –
• SCE customers have saved more than 5 billion kWhs –enough to power over 700,000 homes for an entire year
• SCE has reduced greenhouse gas emissions by 2 million metric tons – the equivalent of taking 375,000 cars off the road
• SCE has consistently won national recognition including:
• 7 United States Department of Energy “Energy Star” awards
• 2 Environment Protection Agency “Stratospheric Ozone Protection” awards, including the “Best of the Best International Stratospheric Ozone Protection Award” for 2007
• Alliance to Save Energy “Star of Energy Efficiency” award
• American Council for an Energy Efficient Economy “Champion of Energy Efficiency” award
SCE’s strong performance history in EE coupled with a constructive regulatory environment has SCE poised for future success
1 US Department of Energy, Energy Information Administration.
May 23, 2008
16
EDISON INTERNATIONAL®
Leading the Way in Electricity SM
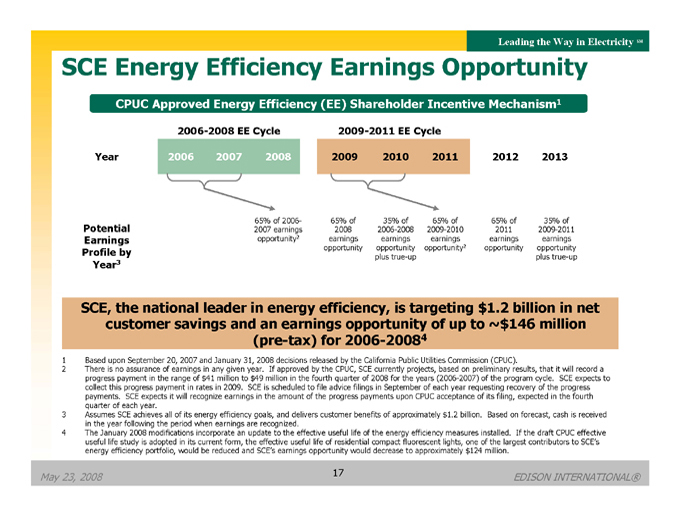
SCE Energy Efficiency Earnings Opportunity
CPUC Approved Energy Efficiency (EE) Shareholder Incentive Mechanism1
Year Potential Earnings Profile by Year3 2006-2008 EE Cycle 2006 2007 2008 2009-2011 EE Cycle
2009
2010
2011
2012
2013
65% of 2006- 65% of 35% of 65% of 65% of 35% of 2007 earnings 2008 2006-2008 2009-2010 2011 2009-2011 opportunity2 earnings earnings earnings earnings earnings opportunity opportunity opportunity2 opportunity opportunity plus true-up plus true-up
SCE, the national leader in energy efficiency, is targeting $1.2 billion in net customer savings and an earnings opportunity of up to ~$146 million (pre-tax) for 2006-20084
1 Based upon September 20, 2007 and January 31, 2008 decisions released by the California Public Utilities Commission (CPUC).
2 There is no assurance of earnings in any given year. If approved by the CPUC, SCE currently projects, based on preliminary results, that it will record a progress payment in the range of $41 million to $49 million in the fourth quarter of 2008 for the years (2006-2007) of the program cycle. SCE expects to collect this progress payment in rates in 2009. SCE is scheduled to file advice filings in September of each year requesting recovery of the progress payments. SCE expects it will recognize earnings in the amount of the progress payments upon CPUC acceptance of its filing, expected in the fourth quarter of each year.
3 Assumes SCE achieves all of its energy efficiency goals, and delivers customer benefits of approximately $1.2 billion. Based on forecast, cash is received in the year following the period when earnings are recognized.
4 The January 2008 modifications incorporate an update to the effective useful life of the energy efficiency measures installed. If the draft CPUC effective useful life study is adopted in its current form, the effective useful life of residential compact fluorescent lights, one of the largest contributors to SCE’s energy efficiency portfolio, would be reduced and SCE’s earnings opportunity would decrease to approximately $124 million.
May 23, 2008
17
EDISON INTERNATIONAL®

Leading the Way in Electricity SM
SCE Solar Rooftop Program
• Install 250 MW of solar photovoltaic generation on leased commercial rooftops
– 1-2 MW average installations target significant cost economies of scale
– May seek future authority to expand to 500 MW program
•$ 875 million capital spending program1
– 100 b.p. premium for utility-owned renewable generation (SCE’s CPUC-approved return on equity is 11.5% for 2008)
• SCE has requested authority to recover costs incurred during regulatory approval process to facilitate a 2008 program launch
• Operating costs would be recovered through a balancing account with after-the-fact reasonableness review until included in base rates as part of general rate cases
SCE’s proposed rooftop solar program will help advance California public policy and help build scale for the large rooftop photovoltaic solar market
1 Subject to CPUC approval. Direct capital forecast in 2008 dollars (2008-2013).
May 23, 2008
18
EDISON INTERNATIONAL®
Leading the Way in Electricity SM
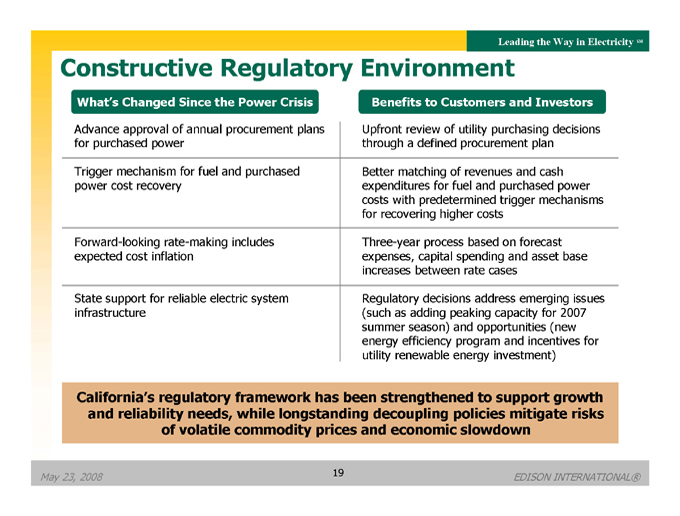
Constructive Regulatory Environment
What’s Changed Since the Power Crisis
Advance approval of annual procurement plans for purchased power
Trigger mechanism for fuel and purchased power cost recovery
Forward-looking rate-making includes expected cost inflation
State support for reliable electric system infrastructure
Benefits to Customers and Investors
Upfront review of utility purchasing decisions through a defined procurement plan
Better matching of revenues and cash expenditures for fuel and purchased power costs with predetermined trigger mechanisms for recovering higher costs
Three-year process based on forecast expenses, capital spending and asset base increases between rate cases
Regulatory decisions address emerging issues (such as adding peaking capacity for 2007 summer season) and opportunities (new energy efficiency program and incentives for utility renewable energy investment)
California’s regulatory framework has been strengthened to support growth and reliability needs, while longstanding decoupling policies mitigate risks of volatile commodity prices and economic slowdown
May 23, 2008
19
EDISON INTERNATIONAL®
Leading the Way in Electricity SM
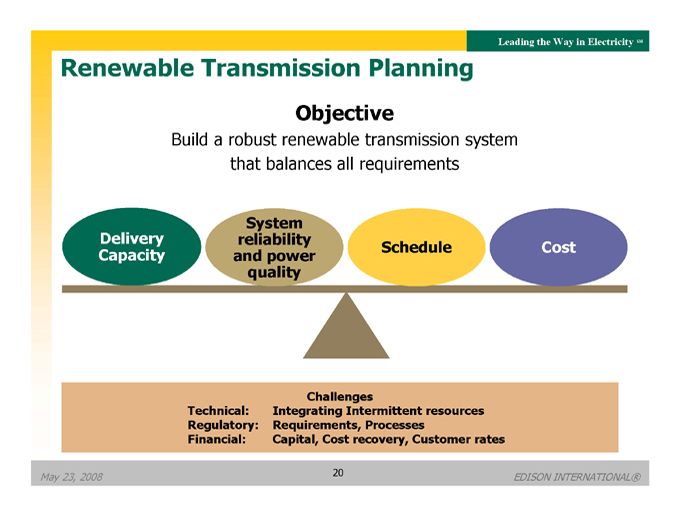
Renewable Transmission Planning
Objective
Build a robust renewable transmission system that balances all requirements
Delivery Capacity
System reliability and power quality
Schedule
Cost
Challenges
Technical: Integrating Intermittent resources Regulatory: Requirements, Processes Financial: Capital, Cost recovery, Customer rates
May 23, 2008
EDISON INTERNATIONAL®
20
Leading the Way in Electricity SM
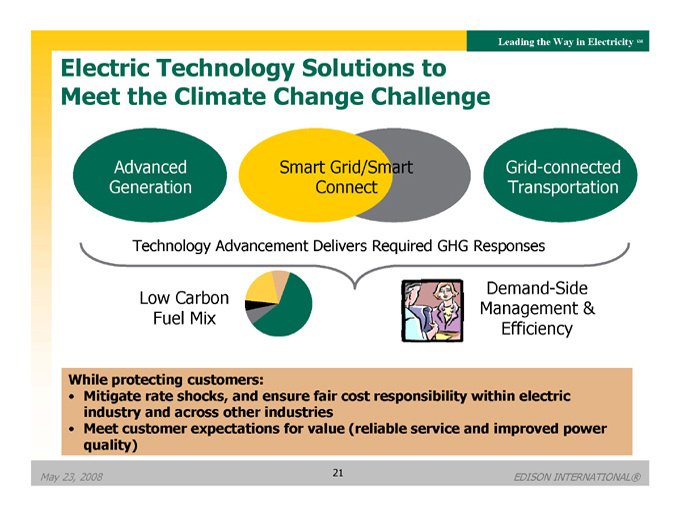
Electric Technology Solutions to Meet the Climate Change Challenge
Advanced Generation
Smart Grid/Smart Connect
Grid-connected Transportation
Technology Advancement Delivers Required GHG Responses
Low Carbon Fuel Mix
Demand-Side Management & Efficiency
While protecting customers:
• Mitigate rate shocks, and ensure fair cost responsibility within electric industry and across other industries
• Meet customer expectations for value (reliable service and improved power quality)
May 23, 2008
EDISON INTERNATIONAL®
21
Leading the Way in Electricity SM
Edison Mission Group (EMG)
A Competitive Power Generation Company
May 23, 2008
EDISON INTERNATIONAL®
22
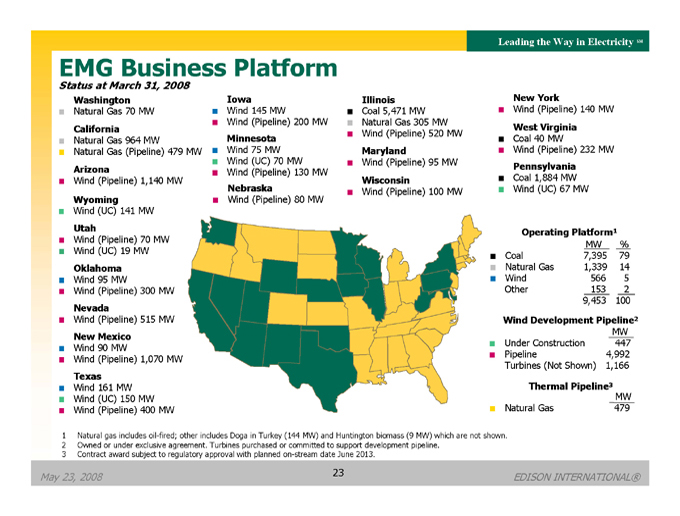
Leading the Way in Electricity SM EMG Business Platform
Status at March 31, 2008 Washington
Natural Gas 70 MW California
Natural Gas 964 MW
Natural Gas (Pipeline) 479 MW Arizona
Wind (Pipeline) 1,140 MW Wyoming
Wind (UC) 141 MW Utah
Wind (Pipeline) 70 MW Wind (UC) 19 MW Oklahoma
Wind 95 MW
Wind (Pipeline) 300 MW Nevada
Wind (Pipeline) 515 MW New Mexico
Wind 90 MW
Wind (Pipeline) 1,070 MW Texas
Wind 161 MW Wind (UC) 150 MW Wind (Pipeline) 400 MW Iowa
Wind 145 MW
Wind (Pipeline) 200 MW Minnesota
Wind 75 MW Wind (UC) 70 MW Wind (Pipeline) 130 MW Nebraska
Wind (Pipeline) 80 MW Illinois
Coal 5,471 MW Natural Gas 305 MW Wind (Pipeline) 520 MW Maryland
Wind (Pipeline) 95 MW Wisconsin
Wind (Pipeline) 100 MW New York
Wind (Pipeline) 140 MW West Virginia Coal 40 MW
Wind (Pipeline) 232 MW Pennsylvania Coal 1,884 MW Wind (UC) 67 MW
Operating Platform1 MW % Coal 7,395 79 Natural Gas 1,339 14 Wind 566 5 Other 153 2 9,453 100
Wind Development Pipeline2 MW Under Construction 447 Pipeline 4,992 Turbines (Not Shown) 1,166 Thermal Pipeline3
MW Natural Gas 479
1 Natural gas includes oil-fired; other includes Doga in Turkey (144 MW) and Huntington biomass (9 MW) which are not shown.
2 Owned or under exclusive agreement. Turbines purchased or committed to support development pipeline.
3 Contract award subject to regulatory approval with planned on-stream date June 2013.
May 23, 2008
EDISON INTERNATIONAL®
23
Leading the Way in Electricity SM
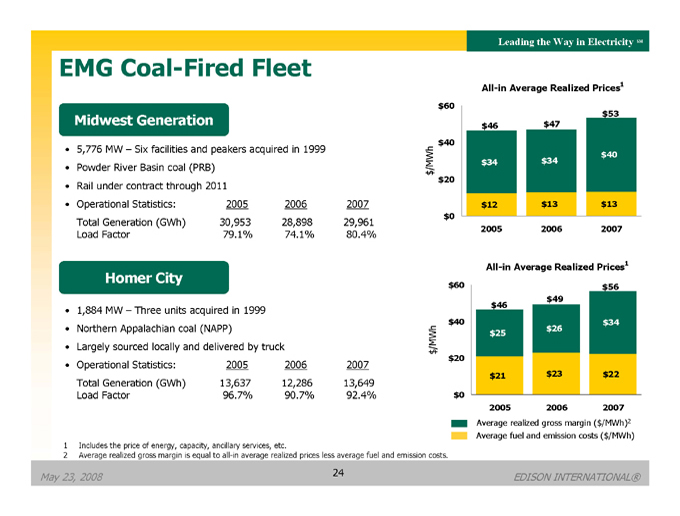
EMG Coal-Fired Fleet
Midwest Generation
5,776 MW – Six facilities and peakers acquired in 1999 Powder River Basin coal (PRB) Rail under contract through 2011
Operational Statistics: 2005 2006 2007 Total Generation (GWh) 30,953 28,898 29,961 Load Factor 79.1% 74.1% 80.4%
Homer City
• 1,884 MW – Three units acquired in 1999
• Northern Appalachian coal (NAPP)
• Largely sourced locally and delivered by truck
• Operational Statistics: 2005 2006 2007 Total Generation (GWh) 13,637 12,286 13,649 Load Factor 96.7% 90.7% 92.4%
All-in Average Realized Prices1
$/MWh $60 $40 $20 $0 $46 $34 $12 $47 $34 $13 $53 $40 $13
2005 2006 2007
All-in Average Realized Prices1
$/MWh $60 $40 $20 $0 $46 $25 $21 $49 $26 $23 $56 $34 $22
2005 2006 2007
Average realized gross margin ($/MWh)2 Average fuel and emission costs ($/MWh)
1 Includes the price of energy, capacity, ancillary services, etc.
2 Average realized gross margin is equal to all-in average realized prices less average fuel and emission costs.
May 23, 2008
24
EDISON INTERNATIONAL®
Leading the Way in Electricity SM
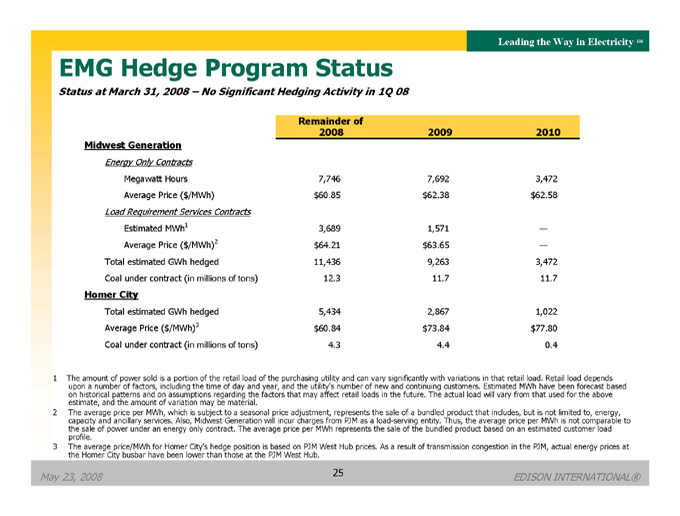
EMG Hedge Program Status
Status at March 31, 2008 – No Significant Hedging Activity in 1Q 08
Remainder of
2008 2009 2010
Midwest Generation
Energy Only Contracts
Megawatt Hours 7,746 7,692 3,472
Average Price ($/MWh) $ 60.85 $ 62.38 $ 62.58
Load Requirement Services Contracts
Estimated MWh1 3,689 1,571 —
Average Price ($/MWh)2 $ 64.21 $ 63.65 —
Total estimated GWh hedged 11,436 9,263 3,472
Coal under contract (in millions of tons) 12.3 11.7 11.7
Homer City
Total estimated GWh hedged 5,434 2,867 1,022
Average Price ($ /MWh)3 $ 60.84 $ 73.84 $ 77.80
Coal under contract ( in millions of tons) 4.3 4.4 0.4
1 The amount of power sold is a portion of the retail load of the purchasing utility and can vary significantly with variations in that retail load. Retail load depends upon a number of factors, including the time of day and year, and the utility’s number of new and continuing customers. Estimated MWh have been forecast based on historical patterns and on assumptions regarding the factors that may affect retail loads in the future. The actual load will vary from that used for the above estimate, and the amount of variation may be material.
2 The average price per MWh, which is subject to a seasonal price adjustment, represents the sale of a bundled product that includes, but is not limited to, energy, capacity and ancillary services. Also, Midwest Generation will incur charges from PJM as a load-serving entity. Thus, the average price per MWh is not comparable to the sale of power under an energy only contract. The average price per MWh represents the sale of the bundled product based on an estimated customer load profile.
3 The average price/MWh for Homer City’s hedge position is based on PJM West Hub prices. As a result of transmission congestion in the PJM, actual energy prices at the Homer City busbar have been lower than those at the PJM West Hub.
May 23, 2008
EDISON INTERNATIONAL®
25
Leading the Way in Electricity SM
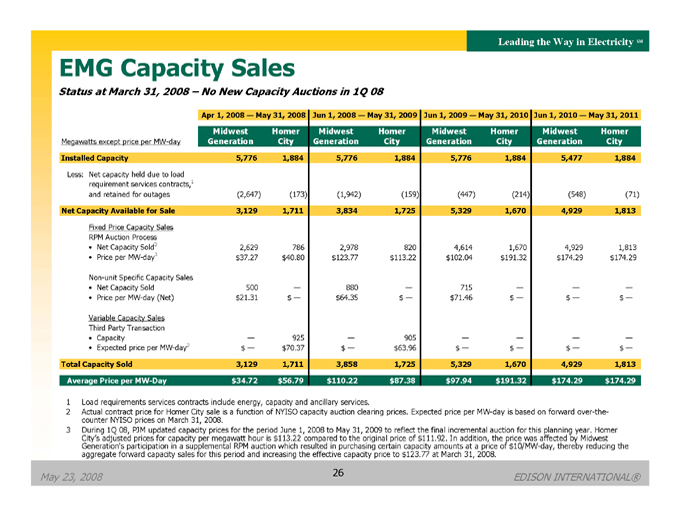
EMG Capacity Sales
Status at March 31, 2008 – No New Capacity Auctions in 1Q 08
Apr 1, 2008 — May 31, 2008 Jun 1, 2008 — May 31, 2009 Jun 1, 2009 — May 31, 2010 Jun 1, 2010 — May 31, 2011
Midwest Homer Midwest Homer Midwest Homer Midwest Homer
Megawatts except price per MW-day Generation City Generation City Generation City Generation City
Installed Capacity 5,776 1,884 5,776 1,884 5,776 1,884 5,477 1,884
Less: Net capacity held due to load requirement services contracts,1
and retained for outages (2,647) (173) (1,942) (159) (447) (214) (548) (71)
Net Capacity Available for Sale 3,129 1,711 3,834 1,725 5,329 1,670 4,929 1,813
Fixed Price Capacity Sales RPM Auction Process
• Net Capacity Sold3 2,629 786 2,978 820 4,614 1,670 4,929 1,813
• Price per MW-day3 $ 37.27 $ 40.80 $ 123.77 $ 113.22 $ 102.04 $ 191.32 $ 174.29 $ 174.29
Non-unit Specific Capacity Sales
• Net Capacity Sold 500 — 880 — 715 — — —
• Price per MW-day (Net) $ 21.31 $ — $ 64.35 $ — $ 71.46 $ — $ — $ —
Variable Capacity Sales Third Party Transaction
• Capacity — 925 — 905 — — — —
• Expected price per MW-day2 $ — $ 70.37 $ — $ 63.96 $ — $ — $ — $ —
Total Capacity Sold 3,129 1,711 3,858 1,725 5,329 1,670 4,929 1,813
Average Price per MW-Day $ 34.72 $ 56.79 $ 110.22 $ 87.38 $ 97.94 $ 191.32 $ 174.29 $ 174.29
1 Load requirements services contracts include energy, capacity and ancillary services.
2 Actual contract price for Homer City sale is a function of NYISO capacity auction clearing prices. Expected price per MW-day is based on forward over-the-counter NYISO prices on March 31, 2008.
3 During 1Q 08, PJM updated capacity prices for the period June 1, 2008 to May 31, 2009 to reflect the final incremental auction for this planning year. Homer City’s adjusted prices for capacity per megawatt hour is $113.22 compared to the original price of $111.92. In addition, the price was affected by Midwest Generation’s participation in a supplemental RPM auction which resulted in purchasing certain capacity amounts at a price of $10/MW-day, thereby reducing the aggregate forward capacity sales for this period and increasing the effective capacity price to $123.77 at March 31, 2008.
May 23, 2008
EDISON INTERNATIONAL®
26
Leading the Way in Electricity SM
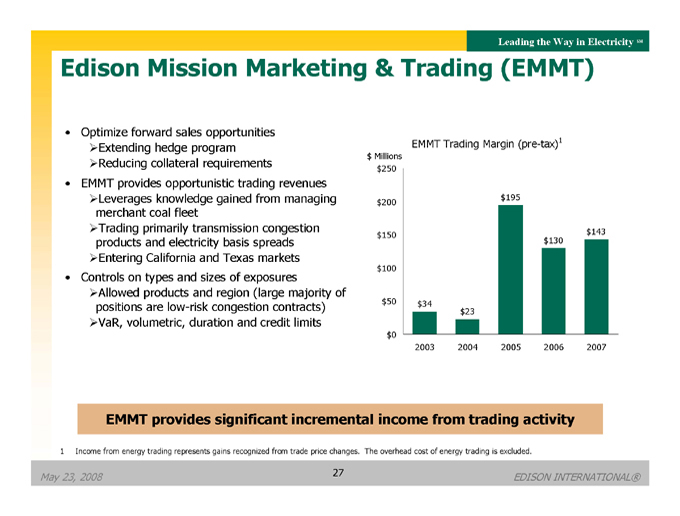
Edison Mission Marketing & Trading (EMMT)
• Optimize forward sales opportunities
Extending hedge program
Reducing collateral requirements
• EMMT provides opportunistic trading revenues
Leverages knowledge gained from managing merchant coal fleet
Trading primarily transmission congestion products and electricity basis spreads
Entering California and Texas markets
• Controls on types and sizes of exposures
Allowed products and region (large majority of positions are low-risk congestion contracts)
VaR, volumetric, duration and credit limits
EMMT Trading Margin (pre-tax)1
$ Millions
$250 $200 $150 $100 $50 $0 $34 $23 $195 $130 $143
2003 2004 2005 2006 2007
EMMT provides significant incremental income from trading activity
1 Income from energy trading represents gains recognized from trade price changes. The overhead cost of energy trading is excluded. May 23, 2008
EDISON INTERNATIONAL®
27
Leading the Way in Electricity SM
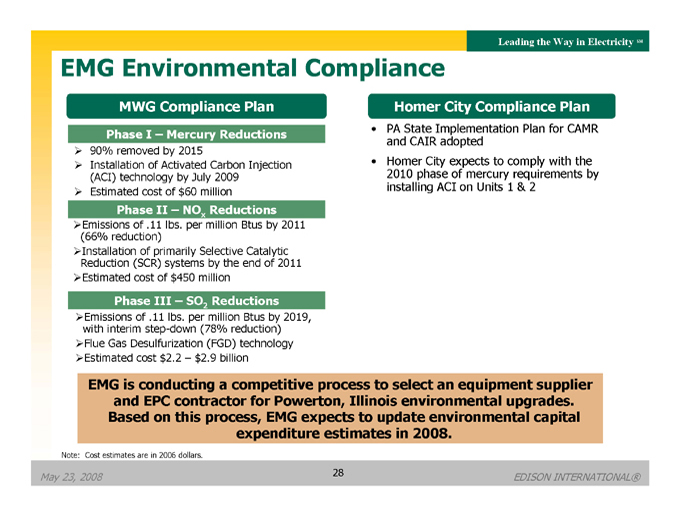
EMG Environmental Compliance
MWG Compliance Plan
Phase I – Mercury Reductions
90% removed by 2015
Installation of Activated Carbon Injection (ACI) technology by July 2009
Estimated cost of $60 million
Phase II – NOx Reductions
Emissions of .11 lbs. per million Btus by 2011 (66% reduction)
Installation of primarily Selective Catalytic Reduction (SCR) systems by the end of 2011
Estimated cost of $450 million
Phase III – SO2 Reductions
Emissions of .11 lbs. per million Btus by 2019, with interim step-down (78% reduction)
Flue Gas Desulfurization (FGD) technology
Estimated cost $2.2 – $2.9 billion
Homer City Compliance Plan
PA State Implementation Plan for CAMR and CAIR adopted Homer City expects to comply with the 2010 phase of mercury requirements by installing ACI on Units 1 & 2
EMG is conducting a competitive process to select an equipment supplier and EPC contractor for Powerton, Illinois environmental upgrades.
Based on this process, EMG expects to update environmental capital expenditure estimates in 2008.
Note: Cost estimates are in 2006 dollars.
May 23, 2008
EDISON INTERNATIONAL®
28
Leading the Way in Electricity SM
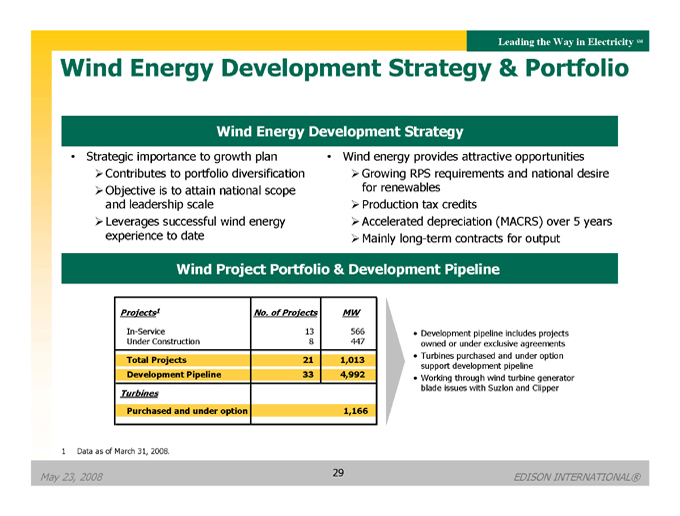
Wind Energy Development Strategy & Portfolio
Wind Energy Development Strategy
• Strategic importance to growth plan
Contributes to portfolio diversification
Objective is to attain national scope and leadership scale
Leverages successful wind energy experience to date
Wind energy provides attractive opportunities
Growing RPS requirements and national desire for renewables
Production tax credits
Accelerated depreciation (MACRS) over 5 years
Mainly long-term contracts for output
Wind Project Portfolio & Development Pipeline
Projects1 No. of Projects MW
In-Service 13 566
Under Construction 8 447
Total Projects 21 1,013
Development Pipeline 33 4,992
Turbines
Purchased and under option 1,166
• Development pipeline includes projects owned or under exclusive agreements
• Turbines purchased and under option support development pipeline
• Working through wind turbine generator blade issues with Suzlon and Clipper
1 Data as of March 31, 2008.
May 23, 2008
EDISON INTERNATIONAL®
29
Leading the Way in Electricity SM
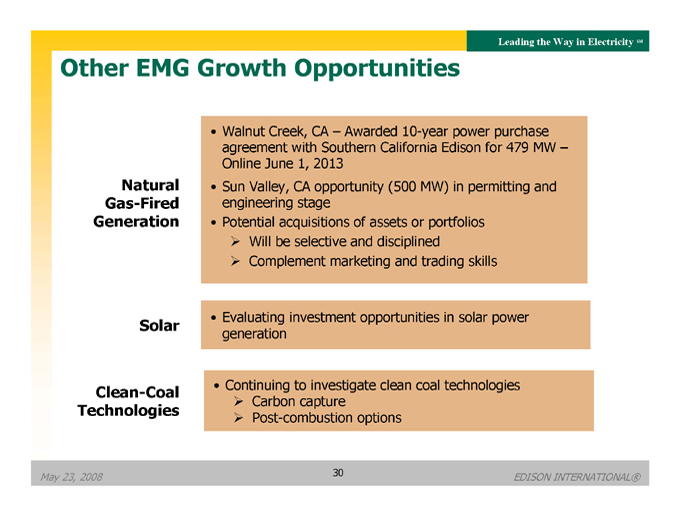
Other EMG Growth Opportunities
Natural Gas-Fired Generation
• Walnut Creek, CA – Awarded 10-year power purchase agreement with Southern California Edison for 479 MW – Online June 1, 2013
Sun Valley, CA opportunity (500 MW) in permitting and engineering stage
Potential acquisitions of assets or portfolios
Will be selective and disciplined
Complement marketing and trading skills
Solar
Evaluating investment opportunities in solar power generation
Clean-Coal Technologies
Continuing to investigate clean coal technologies
Carbon capture
Post-combustion options
May 23, 2008
30
EDISON INTERNATIONAL®

Leading the Way in Electricity SM
Our Shareholder Value Proposition
• Attractive business portfolio and growth opportunities
• Southern California Edison
Demonstrated need for utility infrastructure investments
Among the best domestic electric utility growth platforms
Leadership in environmental and alternative energy programs (energy efficiency, renewable energy, advanced technologies)
• Edison Mission Group
Favorable market conditions for unregulated generation portfolio
Strong growth pipeline led by renewable investments
• Commitment to long-term shareholder value creation
• Incentive compensation and stock ownership guidelines consistent with shareholder interests
• Edison people committed to excellence in safety and customer service
May 23, 2008
EDISON INTERNATIONAL®
31
Leading the Way in Electricity SM
Appendix
May 23, 2008
32
EDISON INTERNATIONAL®
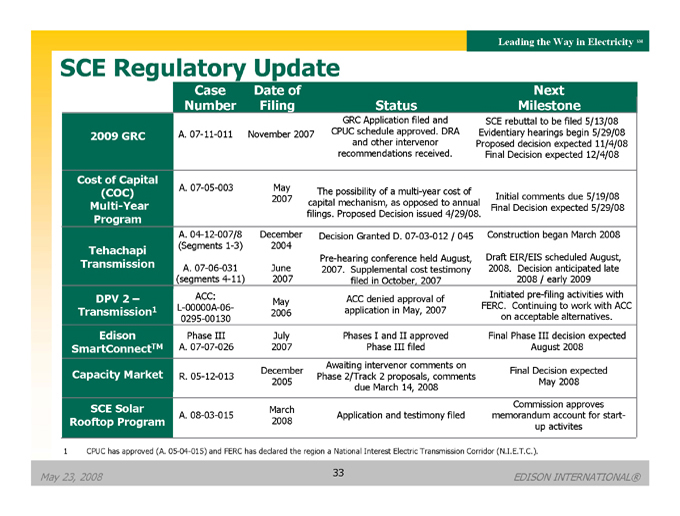
Leading the Way in Electricity SM SCE Regulatory Update Case Date of Next Number Filing Status Milestone
GRC Application filed and SCE rebuttal to be filed 5/13/08
2009 GRC A. 07-11-011 November 2007 CPUC schedule approved. DRA Evidentiary hearings begin 5/29/08
and other intervenor Proposed decision expected 11/4/08
recommendations received. Final Decision expected 12/4/08 Cost of Capital
(COC) A. 07-05-003 May The possibility of a multi-year cost of 2007 Initial comments due 5/19/08
Multi-Year capital mechanism, as opposed to annual Final Decision expected 5/29/08
Program filings. Proposed Decision issued 4/29/08.
A. 04-12-007/8 December Decision Granted D. 07-03-012 / 045 Construction began March 2008
Tehachapi (Segments 1-3) 2004 Pre-hearing conference held August, Draft EIR/EIS scheduled August,
Transmission A. 07-06-031 June 2008. Decision anticipated late 2007. Supplemental cost testimony
(segments 4-11) 2007 filed in October, 2007 2008 / early 2009
DPV 2 – ACC: ACC denied approval of Initiated pre-filing activities with May FERC. Continuing to work with ACC
Transmission1 L-00000A-06- application in May, 2007 2006 on acceptable alternatives. 0295-00130
Edison Phase III July Phases I and II approved Final Phase III decision expected
SmartConnectTM A. 07-07-026 2007 Phase III filed August 2008 Awaiting intervenor comments on
Capacity Market December Final Decision expected
R. 05-12-013 Phase 2/Track 2 proposals, comments 2005 May 2008 due March 14, 2008
SCE Solar Commission approves
March
A. 08-03-015 Application and testimony filed memorandum account for start-
Rooftop Program 2008
up activites
1 CPUC has approved (A. 05-04-015) and FERC has declared the region a National Interest Electric Transmission Corridor (N.I.E.T.C.).
May 23, 2008
33
EDISON INTERNATIONAL®
Leading the Way in Electricity SM
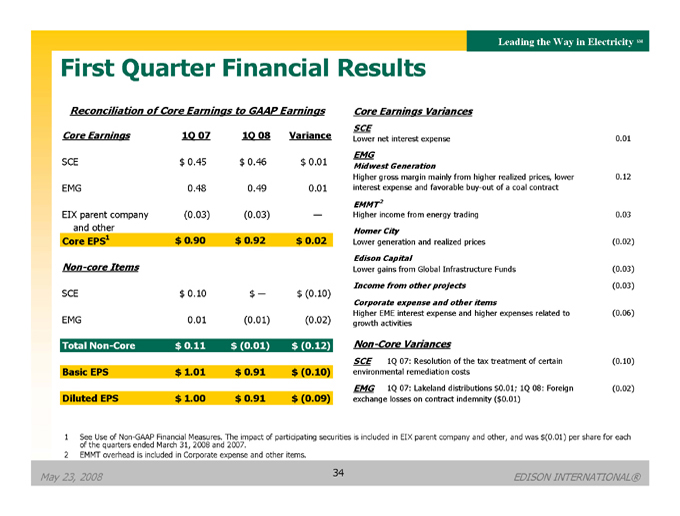
First Quarter Financial Results
Reconciliation of Core Earnings to GAAP Earnings
Core Earnings 1Q 07 1Q 08 Variance
SCE $ 0.45 $ 0.46 $ 0.01
EMG 0.48 0.49 0.01
EIX parent company (0.03) (0.03) — and other
Core EPS1 $ 0.90 $ 0.92 $ 0.02
Non-core Items
SCE $ 0.10 $ — $ (0.10)
EMG 0.01 (0.01) (0.02)
Total Non-Core $ 0.11 $ (0.01) $ (0.12)
Basic EPS $ 1.01 $ 0.91 $ (0.10)
Diluted EPS $ 1.00 $ 0.91 $ (0.09)
Core Earnings Variances SCE
Lower net interest expense 0.01 EMG
Midwest Generation
Higher gross margin mainly from higher realized prices, lower 0.12
interest expense and favorable buy-out of a coal contract EMMT2
Higher income from energy trading 0.03 Homer City
Lower generation and realized prices (0.02) Edison Capital
Lower gains from Global Infrastructure Funds (0.03)
Income from other projects (0.03) Corporate expense and other items
Higher EME interest expense and higher expenses related to (0.06) growth activities Non-Core Variances
SCE 1Q 07: Resolution of the tax treatment of certain (0.10)
environmental remediation costs
EMG 1Q 07: Lakeland distributions $ 0.01; 1Q 08: Foreign (0.02)
exchange losses on contract indemnity ($ 0.01)
1 See Use of Non-GAAP Financial Measures. The impact of participating securities is included in EIX parent company and other, and was $(0.01) per share for each of the quarters ended March 31, 2008 and 2007.
2 EMMT overhead is included in Corporate expense and other items.
May 23, 2008
EDISON INTERNATIONAL®
34
Leading the Way in Electricity SM
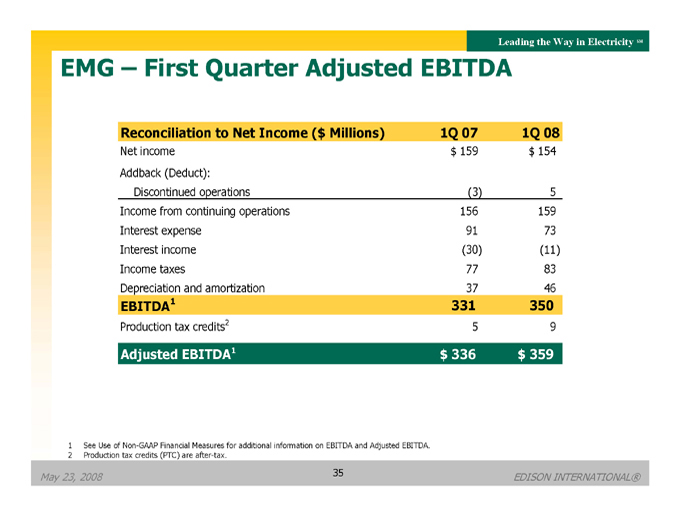
EMG – First Quarter Adjusted EBITDA
Reconciliation to Net Income ($Millions) 1Q 07 1Q 08
Net income $159 $154
Addback (Deduct):
Discontinued operations (3) 5
Income from continuing operations 156 159
Interest expense 91 73
Interest income (30) (11)
Income taxes 77 83
Depreciation and amortization 37 46
EBITDA1 331 350
Production tax credits2 5 9
Adjusted EBITDA1 $336 $359
1 See Use of Non-GAAP Financial Measures for additional information on EBITDA and Adjusted EBITDA.
2 Production tax credits (PTC) are after-tax.
May 23, 2008
35
EDISON INTERNATIONAL®
Leading the Way in Electricity SM
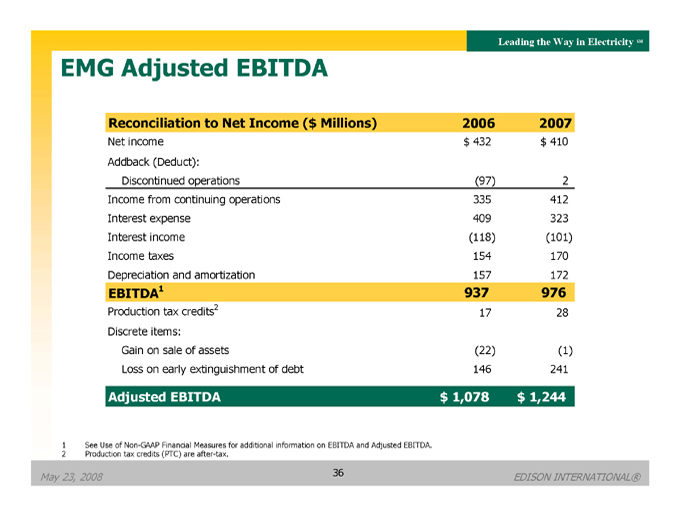
EMG Adjusted EBITDA
Reconciliation to Net Income ($Millions) 2006 2007
Net income $432 $410
Addback (Deduct):
Discontinued operations (97) 2
Income from continuing operations 335 412
Interest expense 409 323
Interest income (118) (101)
Income taxes 154 170
Depreciation and amortization 157 172
EBITDA1 937 976
Production tax credits2 17 28
Discrete items:
Gain on sale of assets (22) (1)
Loss on early extinguishment of debt 146 241
Adjusted EBITDA $1,078 $1,244
1 See Use of Non-GAAP Financial Measures for additional information on EBITDA and Adjusted EBITDA.
2 Production tax credits (PTC) are after-tax.
May 23, 2008
36
EDISON INTERNATIONAL®
Leading the Way in Electricity SM
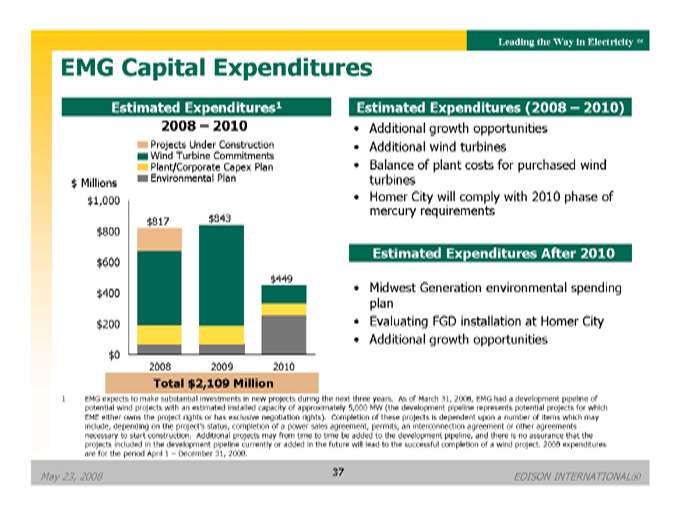
EMG Capital Expenditures
Estimated Expenditures1 2008 – 2010
Projects Under Construction Wind Turbine Commitments Plant/Corporate Capex Plan Environmental Plan
$ Millions $1,000 $800 $600 $400 $200 $0 $817 $843 $449
2008 2009 2010
Total $2,109 Million
Estimated Expenditures (2008 – 2010)
• Additional growth opportunities
• Additional wind turbines
• Balance of plant costs for purchased wind turbines
• Homer City will comply with 2010 phase of mercury requirements
Estimated Expenditures After 2010
• Midwest Generation environmental spending plan
• Evaluating FGD installation at Homer City
• Additional growth opportunities
1 EMG expects to make substantial investments in new projects during the next three years. As of March 31, 2008, EMG had a development pipeline of potential wind projects with an estimated installed capacity of approximately 5,000 MW (the development pipeline represents potential projects for which EME either owns the project rights or has exclusive negotiation rights). Completion of these projects is dependent upon a number of items which may include, depending on the project’s status, completion of a power sales agreement, permits, an interconnection agreement or other agreements necessary to start construction. Additional projects may from time to time be added to the development pipeline, and there is no assurance that the projects included in the development pipeline currently or added in the future will lead to the successful completion of a wind project. 2008 expenditures are for the period April 1 – December 31, 2008.
May 23, 2008
37
EDISON INTERNATIONAL®
Leading the Way in Electricity SM
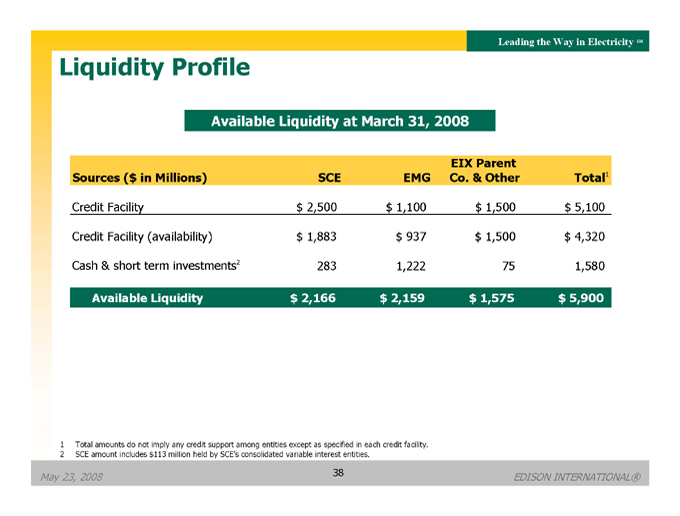
Liquidity Profile
Available Liquidity at March 31, 2008
EIX Parent
Sources ($ in Millions) SCE EMG Co. & Other Total1
Credit Facility $2,500 $1,100 $1,500 $5,100
Credit Facility (availability) $ 1,883 $ 937 $ 1,500 $ 4,320
Cash & short term investments2 283 1,222 75 1,580
Available Liquidity $2,166 $2,159 $1,575 $5,900
1 Total amounts do not imply any credit support among entities except as specified in each credit facility.
2 SCE amount includes $113 million held by SCE’s consolidated variable interest entities.
May 23, 2008
38
EDISON INTERNATIONAL®
Leading the Way in Electricity SM
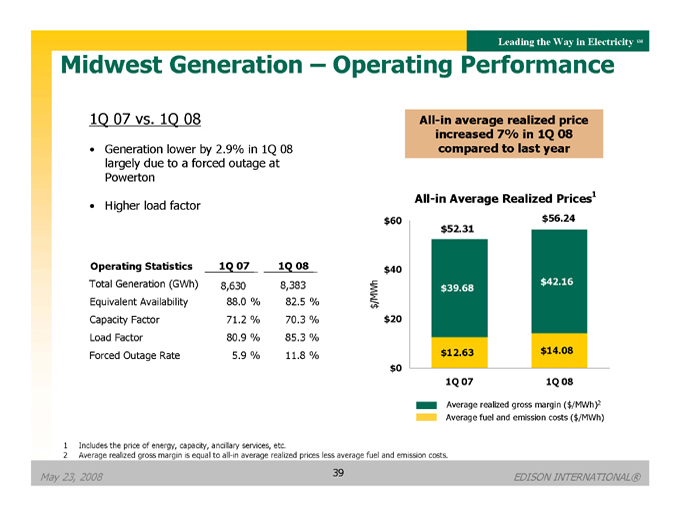
Midwest Generation – Operating Performance
1Q 07 vs. 1Q 08
Generation lower by 2.9% in 1Q 08 largely due to a forced outage at Powerton
Higher load factor
Operating Statistics 1Q 07 1Q 08
Total Generation (GWh) 8,630 8,383 Equivalent Availability 88.0% 82.5% Capacity Factor 71.2% 70.3% Load Factor 80.9% 85.3% Forced Outage Rate 5.9% 11.8%
All-in average realized price increased 7% in 1Q 08 compared to last year
All-in Average Realized Prices1
/MWh $ $20 $60 $40 $0 $52.31 $39.68 $12.63 $56.24 $42.16 $14.08
1Q 08 1Q 07
Average realized gross margin ($/MWh)2 Average fuel and emission costs ($/MWh)
1 Includes the price of energy, capacity, ancillary services, etc.
2 Average realized gross margin is equal to all-in average realized prices less average fuel and emission costs.
May 23, 2008
39
EDISON INTERNATIONAL®
Leading the Way in Electricity SM
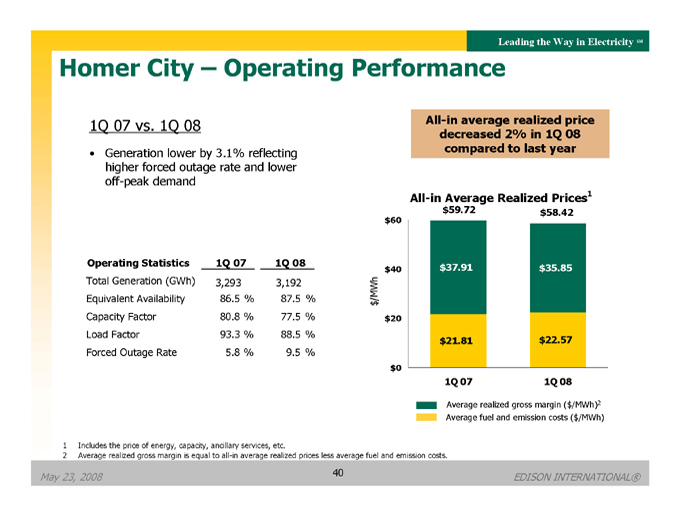
Homer City – Operating Performance
1Q 07 vs. 1Q 08
• Generation lower by 3.1% reflecting higher forced outage rate and lower off-peak demand
Operating Statistics 1Q 07 1Q 08
Total Generation (GWh) 3,293 3,192 Equivalent Availability 86.5% 87.5% Capacity Factor 80.8% 77.5% Load Factor 93.3% 88.5% Forced Outage Rate 5.8% 9.5%
All-in average realized price decreased 2% in 1Q 08 compared to last year
All-in Average Realized Prices1
$/MWh
$60 $40 $20 $0 $59.72 $37.91 $21.81 1Q 07
$58.42 $35.85 $22.57 1Q 08
Average realized gross margin ($/MWh)2 Average fuel and emission costs ($/MWh)
1 Includes the price of energy, capacity, ancillary services, etc.
2 Average realized gross margin is equal to all-in average realized prices less average fuel and emission costs.
May 23, 2008
40
EDISON INTERNATIONAL®
Leading the Way in Electricity SM
Use of Non-GAAP Financial Measures
Edison International’s earnings are prepared in accordance with generally accepted accounting principles used in the United States and represent the company’s earnings as reported to the Securities and Exchange Commission. Our management uses core earnings and EPS by principal operating subsidiary internally for financial planning and for analysis of performance. We also use core earnings and EPS by principal operating subsidiary as primary performance measurements when communicating with analysts and investors regarding our earnings results and outlook, as it allows us to more accurately compare the company’s ongoing performance across periods. Core earnings exclude discontinued operations and other non-core items and are reconciled to basic earnings per common share.
EPS by principal operating subsidiary is based on the principal operating subsidiary net income and Edison International’s weighted average outstanding common shares. The impact of participating securities (vested stock options that earn dividend equivalents that may participate in undistributed earnings with common stock) for each principal operating subsidiary is not material to each principal operating subsidiary’s EPS and is therefore reflected in the results of the Edison International holding company, which we refer to as EIX parent company. EPS and core EPS by principal operating subsidiary are reconciled to basic earnings per common share.
EBITDA is defined as earnings before interest, income taxes, depreciation and amortization. Adjusted EBITDA includes production tax credits from EMG’s wind projects and excludes amounts from gain on the sale of assets, loss on early extinguishment of debt and leases, and impairment of assets and investments. Our management uses Adjusted EBITDA as an important financial measure for evaluating EMG.
A reconciliation of Non-GAAP information to GAAP information, including the impact of participating securities, is included either on the slide where the information appears or on another slide referenced in the presentation.
May 23, 2008
41
EDISON INTERNATIONAL®