Exhibit 99.1
Leading the Way in Electricity SM
Business Update
September 2008
August 29, 2008
EDISON INTERNATIONAL®

Forward-Looking Statements
Statements contained in this presentation about future performance, including, without limitation, earnings, asset and rate base growth, load growth, capital investments, and other statements that are not purely historical, are forward-looking statements. These forward-looking statements reflect our current expectations; however, such statements involve risks and uncertainties. Actual results could differ materially from current expectations. Important factors that could cause different results are discussed under the headings “Risk Factors” and “Management’s Discussion and Analysis” in Edison International’s 2007 Form 10-K and other reports filed with the Securities and Exchange Commission are available on our website: www.edisoninvestor.com. These forward-looking statements represent our expectations only as of the date of this presentation, and Edison International assumes no duty to update them to reflect new information, events or circumstances.
Leading the Way in Electricity SM
August 29, 2008
EDISON INTERNATIONAL®
Leading the Way in Electricity SM
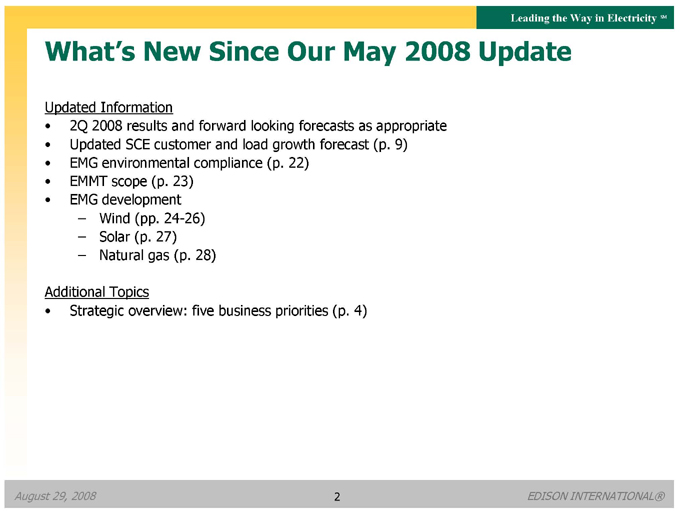
What’s New Since Our May 2008 Update
Updated Information
2Q 2008 results and forward looking forecasts as appropriate
Updated SCE customer and load growth forecast (p. 9)
EMG environmental compliance (p. 22)
EMMT scope (p. 23)
EMG development
– Wind (pp. 24-26)
– Solar (p. 27)
– Natural gas (p. 28)
Additional Topics
Strategic overview: five business priorities (p. 4)
August 29, 2008
EDISON INTERNATIONAL®

Leading the Way in Electricity SM
Strategic Overview
August 29, 2008
EDISON INTERNATIONAL®
Leading the Way in Electricity SM
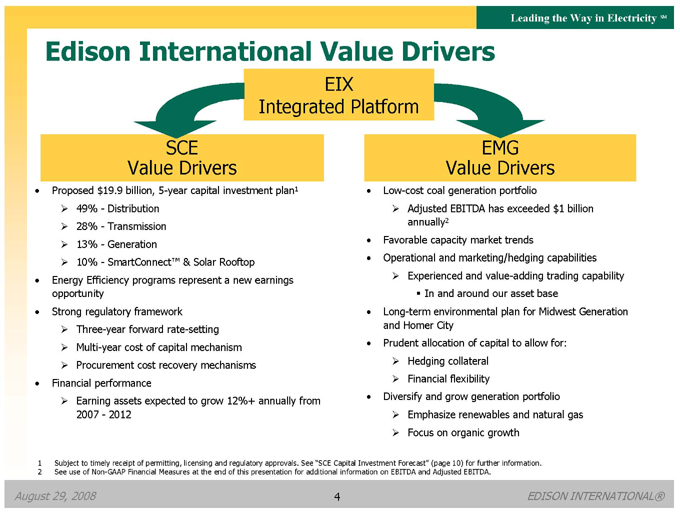
Edison International Value Drivers
EIX Integrated Platform
SCE Value Drivers
Proposed $19.9 billion, 5-year capital investment plan1
49%—Distribution
28%—Transmission
13%—Generation
10%—SmartConnect™ & Solar Rooftop
Energy Efficiency programs represent a new earnings opportunity
Strong regulatory framework
Three-year forward rate-setting
Multi-year cost of capital mechanism
Procurement cost recovery mechanisms
Financial performance
Earning assets expected to grow 12%+ annually from 2007—2012
EMG Value Drivers
Low-cost coal generation portfolio
Adjusted EBITDA has exceeded $1 billion annually2
Favorable capacity market trends
Operational and marketing/hedging capabilities
Experienced and value-adding trading ? capability In and around our asset base
Long-term environmental plan for Midwest Generation and Homer City
Prudent allocation of capital to allow for:
Hedging collateral
Financial flexibility
Diversify and grow generation portfolio
Emphasize renewables and natural gas
Focus on organic growth
1 Subject to timely receipt of permitting, licensing and regulatory approvals. See “SCE Capital Investment Forecast” (page 10) for further information.
2 See use of Non-GAAP Financial Measures at the end of this presentation for additional information on EBITDA and Adjusted EBITDA.
August 29, 2008
EDISON INTERNATIONAL®
Leading the Way in Electricity SM
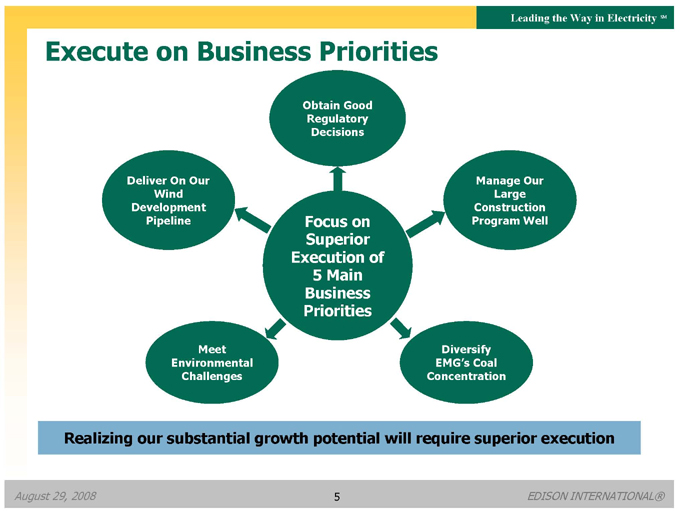
Execute on Business Priorities
Focus on Superior Execution of
5 | | Main Business Priorities |
Obtain Good Regulatory Decisions
Manage Our Large Construction Program Well
Diversify EMG’s Coal Concentration
Meet Environmental Challenges
Deliver On Our Wind Development Pipeline
Realizing our substantial growth potential will require superior execution
August 29, 2008
EDISON INTERNATIONAL®
Leading the Way in Electricity SM
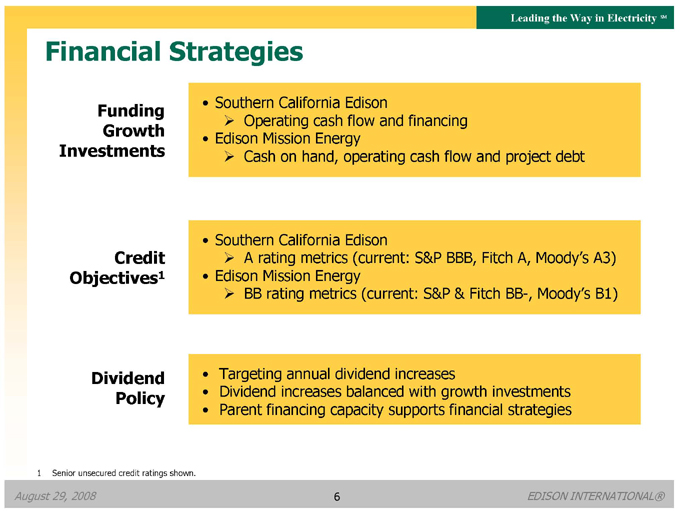
Financial Strategies
Funding Growth Investments
Southern California Edison
Operating cash flow and financing
Edison Mission Energy
Cash on hand, operating cash flow and project debt
Credit
Objectives1
Southern California Edison
A rating metrics (current: S&P BBB, Fitch A, Moody’s A3)
Edison Mission Energy
BB rating metrics (current: S&P & Fitch BB-, Moody’s B1)
Dividend
Policy
Targeting annual dividend increases
Dividend increases balanced with growth investments
Parent financing capacity supports financial strategies
1 | | Senior unsecured credit ratings shown. |
August 29, 2008
EDISON INTERNATIONAL®
Leading the Way in Electricity SM
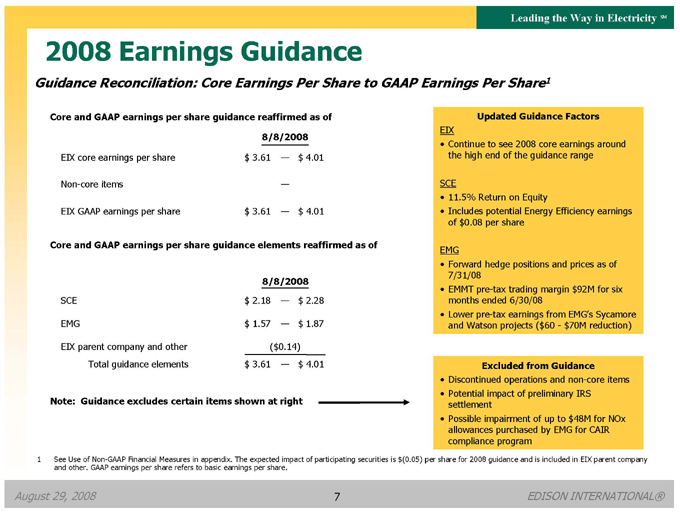
2008 Earnings Guidance
Guidance Reconciliation: Core Earnings Per Share to GAAP Earnings Per Share1
Core and GAAP earnings per share guidance reaffirmed as of
8/8/2008
EIX core earnings per share $ 3.61 — $ 4.01
Non-core items —
EIX GAAP earnings per share $ 3.61 — $ 4.01
Core and GAAP earnings per share guidance elements reaffirmed as of
8/8/2008
SCE $ 2.18 — $ 2.28
EMG $ 1.57 — $ 1.87
EIX parent company and other ($0.14)
Total guidance elements $ 3.61 — $ 4.01
Note: Guidance excludes certain items shown at right
Updated Guidance Factors
EIX
Continue to see 2008 core earnings around the high end of the guidance range
SCE
11.5% Return on Equity
Includes potential Energy Efficiency earnings of $0.08 per share
EMG
Forward hedge positions and prices as of 7/31/08
EMMT pre-tax trading margin $92M for six months ended 6/30/08
Lower pre-tax earnings from EMG’s Sycamore and Watson projects ($60—$70M reduction)
Excluded from Guidance
Discontinued operations and non-core items
Potential impact of preliminary IRS settlement
Possible impairment of up to $48M for NOx allowances purchased by EMG for CAIR compliance program
1 See Use of Non-GAAP Financial Measures in appendix. The expected impact of participating securities is $(0.05) per share for 2008 guidance and is included in EIX parent company and other. GAAP earnings per share refers to basic earnings per share.
August 29, 2008
EDISON INTERNATIONAL®

Leading the Way in Electricity SM
Southern California Edison (SCE)
An Investor-Owned Electric Utility
August 29, 2008
EDISON INTERNATIONAL®
Leading the Way in Electricity SM
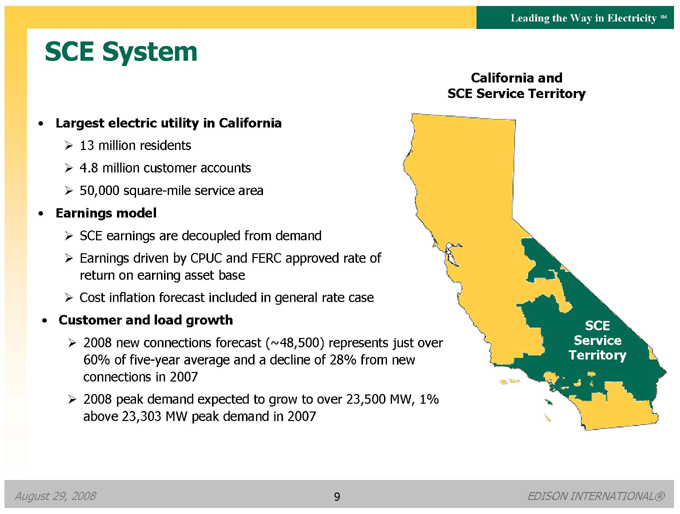
SCE System
Largest electric utility in California
13 million residents
4.8 million customer accounts
50,000 square-mile service area
Earnings model
SCE earnings are decoupled from demand
Earnings driven by CPUC and FERC approved rate of return on earning asset base
Cost inflation forecast included in general rate case
Customer and load growth
2008 new connections forecast (~48,500) represents just over 60% of five-year average and a decline of 28% from new connections in 2007
2008 peak demand expected to grow to over 23,500 MW, 1% above 23,303 MW peak demand in 2007
California and SCE Service Territory
SCE Service Territory
August 29, 2008
EDISON INTERNATIONAL®
9
Leading the Way in Electricity SM
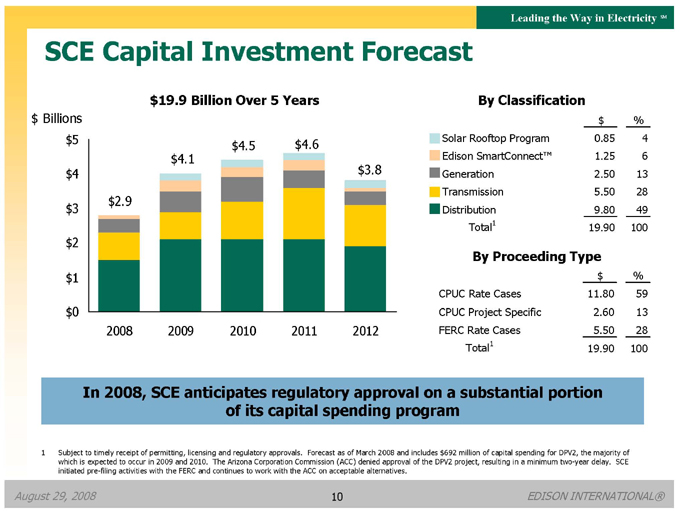
SCE Capital Investment Forecast
$19.9 Billion Over 5 Years
$ Billions $5
$4 $3 $2 $1 $0
$2.9
$4.1
$4.5
$4.6
$3.8
2008 2009 2010 2011 2012
By Classification
$ %
Solar Rooftop Program 0.85 4
Edison SmartConnect™ 1.25 6
Generation 2.50 13
Transmission 5.50 28
Distribution 9.80 49
Total1 19.90 100
By Proceeding Type
$ %
CPUC Rate Cases 11.80 59
CPUC Project Specific 2.60 13
FERC Rate Cases 5.50 28
Total1 19.90 100
In 2008, SCE anticipates regulatory approval on a substantial portion of its capital spending program
1 Subject to timely receipt of permitting, licensing and regulatory approvals. Forecast as of March 2008 and includes $692 million of capital spending for DPV2, the majority of which is expected to occur in 2009 and 2010. The Arizona Corporation Commission (ACC) denied approval of the DPV2 project, resulting in a minimum two-year delay. SCE initiated pre-filing activities with the FERC and continues to work with the ACC on acceptable alternatives.
August 29, 2008
EDISON INTERNATIONAL®
10
Leading the Way in Electricity SM
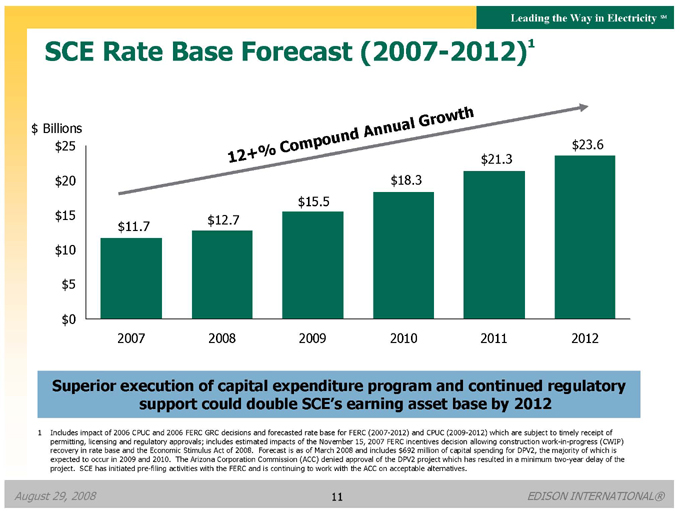
SCE Rate Base Forecast (2007-2012)1
$ Billions $25
$20 $15 $10 $5 $0
1 | | 2 + % Compound Annual Growth |
$11.7
$12.7
$15.5
$18.3
$21.3
$23.6
2007 2008 2009 2010 2011 2012
Superior execution of capital expenditure program and continued regulatory support could double SCE’s earning asset base by 2012
1 Includes impact of 2006 CPUC and 2006 FERC GRC decisions and forecasted rate base for FERC (2007-2012) and CPUC (2009-2012) which are subject to timely receipt of permitting, licensing and regulatory approvals; includes estimated impacts of the November 15, 2007 FERC incentives decision allowing construction work-in-progress (CWIP) recovery in rate base and the Economic Stimulus Act of 2008. Forecast is as of March 2008 and includes $692 million of capital spending for DPV2, the majority of which is expected to occur in 2009 and 2010. The Arizona Corporation Commission (ACC) denied approval of the DPV2 project which has resulted in a minimum two-year delay of the project. SCE has initiated pre-filing activities with the FERC and is continuing to work with the ACC on acceptable alternatives.
August 29, 2008
EDISON INTERNATIONAL®
11
Leading the Way in Electricity SM
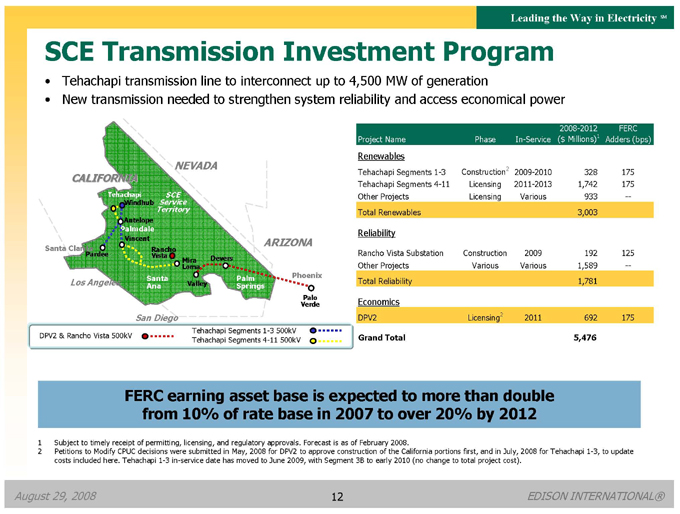
SCE Transmission Investment Program
Tehachapi transmission line to interconnect up to 4,500 MW of generation
New transmission needed to strengthen system reliability and access economical power
NEVADA CALIFORNIA
Tehachapi Service SCE
Windhub
Territory
Antelope Palmdale
Vincent ARIZONA Santa Clarita Pardee RanchoVista Mira Loma Devers Phoenix Los Angeles Santa Ana Valley Palm Springs Verde Palo
San Diego
Tehachapi Segments 1-3 500kV DPV2 & Rancho Vista 500kV
Tehachapi Segments 4-11 500kV
2008-2012 FERC
Project Name Phase In-Service ($ Millions)1 Adders (bps)
Renewables
Tehachapi Segments 1-3 Construction2 2009-2010 328 175
Tehachapi Segments 4-11 Licensing 2011-2013 1,742 175
Other Projects Licensing Various 933 —
Total Renewables 3,003
Reliability
Rancho Vista Substation Construction 2009 192 125
Other Projects Various Various 1,589 —
Total Reliability 1,781
Economics
DPV2 Licensing2 2011 692 175
Grand Total 5,476
FERC earning asset base is expected to more than double from 10% of rate base in 2007 to over 20% by 2012
1 | | Subject to timely receipt of permitting, licensing, and regulatory approvals. Forecast is as of February 2008. |
2 Petitions to Modify CPUC decisions were submitted in May, 2008 for DPV2 to approve construction of the California portions first, and in July, 2008 for Tehachapi 1-3, to update costs included here. Tehachapi 1-3 in-service date has moved to June 2009, with Segment 3B to early 2010 (no change to total project cost).
August 29, 2008
EDISON INTERNATIONAL®
12
Leading the Way in Electricity SM
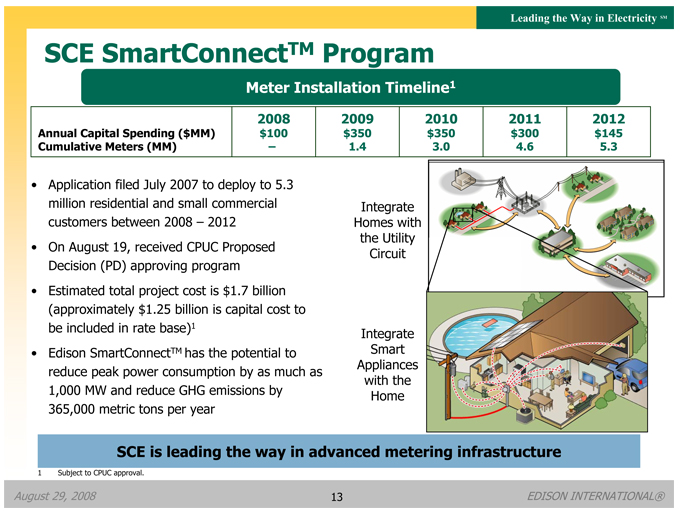
SCE SmartConnectTM Program
Meter Installation Timeline1
2008 2009 2010 2011 2012
Annual Capital Spending ($MM) $100 $350 $350 $300 $145
Cumulative Meters (MM) – 1.4 3.0 4.6 5.3
Application filed July 2007 to deploy to 5.3 million residential and small commercial customers between 2008 – 2012
On August 19, received CPUC Proposed Decision (PD) approving program
Estimated total project cost is $1.7 billion (approximately $1.25 billion is capital cost to be included in rate base)1
Edison SmartConnectTM has the potential to reduce peak power consumption by as much as 1,000 MW and reduce GHG emissions by 365,000 metric tons per year
Integrate Homes with the Utility Circuit
Integrate Smart Appliances with the Home
SCE is leading the way in advanced metering infrastructure
1 | | Subject to CPUC approval. |
August 29, 2008
EDISON INTERNATIONAL®
13
Leading the Way in Electricity SM
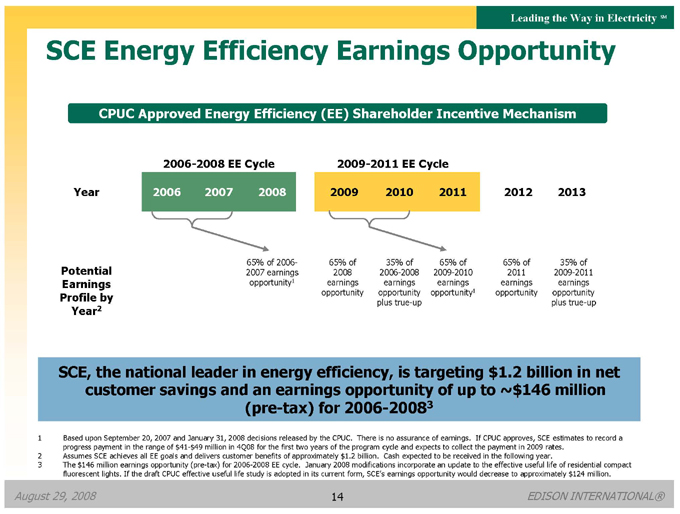
SCE Energy Efficiency Earnings Opportunity
CPUC Approved Energy Efficiency (EE) Shareholder Incentive Mechanism
2006-2008 EE Cycle
Year 2006 2007 2008
2009-2011 EE Cycle
2009 2010 2011 2012 2013
Potential Earnings Profile by Year2
65% of 2006-2007 earnings opportunity1
65% of 2008 earnings opportunity
35% of 2006-2008 earnings opportunity plus true-up
65% of 2009-2010 earnings opportunity1
65% of 2011 earnings opportunity
35% of 2009-2011 earnings opportunity plus true-up
SCE, the national leader in energy efficiency, is targeting $1.2 billion in net customer savings and an earnings opportunity of up to ~$146 million (pre-tax) for 2006-20083
1 Based upon September 20, 2007 and January 31, 2008 decisions released by the CPUC. There is no assurance of earnings. If CPUC approves, SCE estimates to record a progress payment in the range of $41-$49 million in 4Q08 for the first two years of the program cycle and expects to collect the payment in 2009 rates.
2 Assumes SCE achieves all EE goals and delivers customer benefits of approximately $1.2 billion. Cash expected to be received in the following year.
3 The $146 million earnings opportunity (pre-tax) for 2006-2008 EE cycle. January 2008 modifications incorporate an update to the effective useful life of residential compact fluorescent lights. If the draft CPUC effective useful life study is adopted in its current form, SCE’s earnings opportunity would decrease to approximately $124 million.
August 29, 2008
EDISON INTERNATIONAL®
14

Leading the Way in Electricity SM
SCE Solar Rooftop Program
Install 250 MW of thin-film solar photovoltaic (PV) generation on commercial rooftops
– 1-2 MW average project size
– $875 million 1 capital spending program
Initial 2 MW start-up in Fontana
– Expected operational September 2008
– First Solar awarded PV contract
SCE requested authority to recover costs incurred during regulatory approval process to facilitate 2008 program launch
SCE’s proposed rooftop solar program will help advance California public policy and help build scale for the large rooftop photovoltaic solar market
1 | | Subject to CPUC approval. Direct capital forecast in 2008 dollars (2008-2013). |
August 29, 2008
EDISON INTERNATIONAL®
15
Leading the Way in Electricity SM
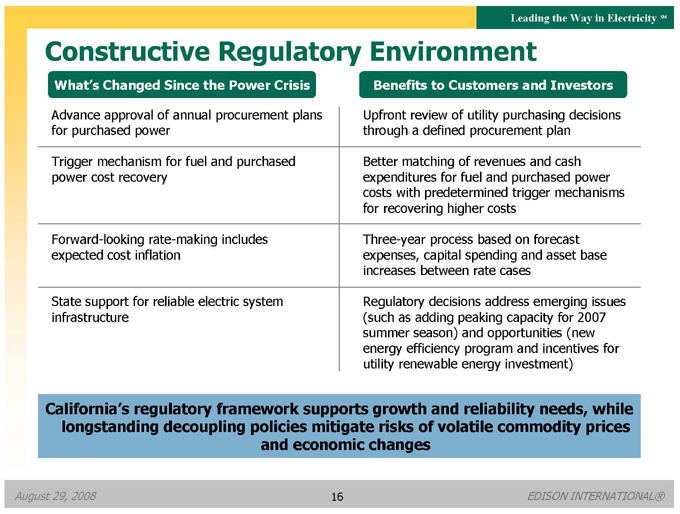
Constructive Regulatory Environment
What’s Changed Since the Power Crisis
Advance approval of annual procurement plans for purchased power
Trigger mechanism for fuel and purchased power cost recovery
Forward-looking rate-making includes expected cost inflation
State support for reliable electric system infrastructure
Benefits to Customers and Investors
Upfront review of utility purchasing decisions through a defined procurement plan
Better matching of revenues and cash expenditures for fuel and purchased power costs with predetermined trigger mechanisms for recovering higher costs
Three-year process based on forecast expenses, capital spending and asset base increases between rate cases
Regulatory decisions address emerging issues (such as adding peaking capacity for 2007 summer season) and opportunities (new energy efficiency program and incentives for utility renewable energy investment)
California’s regulatory framework supports growth and reliability needs, while longstanding decoupling policies mitigate risks of volatile commodity prices and economic changes
August 29, 2008
EDISON INTERNATIONAL®
16
Leading the Way in Electricity SM
Edison Mission Group (EMG)
A Competitive Power Generation Company
August 29, 2008
EDISON INTERNATIONAL®
17
Leading the Way in Electricity SM
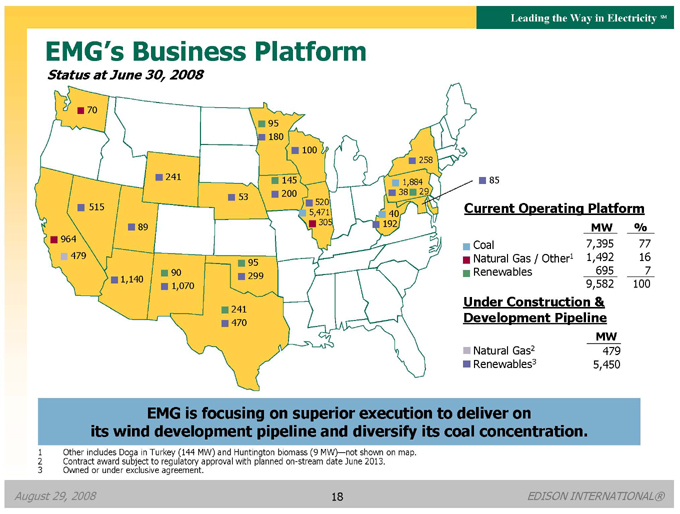
EMG’s Business Platform
Status at June 30, 2008
70
95 180 100
258 241 145 1,884 200 38 29 53 515 520 5,471 40
89 305 192 964 479 95
90 299 1,140 1,070
241 470
85
Current Operating Platform
MW %
Coal 7,395 77
Natural Gas / Other1 1,492 16
Renewables 695 7
9,582 100
Under Construction & Development Pipeline
MW
Natural Gas2 479 Renewables3 5,450
EMG is focusing on superior execution to deliver on its wind development pipeline and diversify its coal concentration.
1 | | Other includes Doga in Turkey (144 MW) and Huntington biomass (9 MW)—not shown on map. |
2 | | Contract award subject to regulatory approval with planned on-stream date June 2013. |
3 | | Owned or under exclusive agreement. |
August 29, 2008
EDISON INTERNATIONAL®
18
Leading the Way in Electricity SM
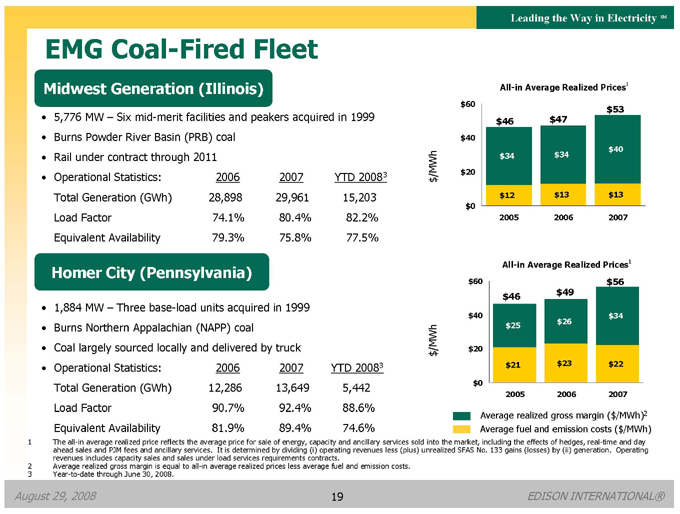
EMG Coal-Fired Fleet
Midwest Generation (Illinois)
5,776 MW – Six mid-merit facilities and peakers acquired in 1999
Burns Powder River Basin (PRB) coal
Rail under contract through 2011
Operational Statistics: 2006 2007 YTD 20083
Total Generation (GWh) 28,898 29,961 15,203
Load Factor 74.1% 80.4% 82.2%
Equivalent Availability 79.3% 75.8% 77.5%
Homer City (Pennsylvania)
1,884 MW – Three base-load units acquired in 1999
Burns Northern Appalachian (NAPP) coal
Coal largely sourced locally and delivered by truck
Operational Statistics: 2006 2007 YTD 20083
Total Generation (GWh) 12,286 13,649 5,442
Load Factor 90.7% 92.4% 88.6%
Equivalent Availability 81.9% 89.4% 74.6%
All-in Average Realized Prices1 $60 $53
$46 $47 $40 $40
$34 $34
$/MWh $20
$12 $13 $13 $0 2005 2006 2007
All-in Average Realized Prices1
$60 $56
$46 $49
$40 $34 $26
$/MWh $25
$20
$21 $23 $22 $0 2005 2006 2007
Average realized gross margin ($/MWh)2 Average fuel and emission costs ($/MWh)
1 The all-in average realized price reflects the average price for sale of energy, capacity and ancillary services sold into the market, including the effects of hedges, real-time and day ahead sales and PJM fees and ancillary services. It is determined by dividing (i) operating revenues less (plus) unrealized SFAS No. 133 gains (losses) by (ii) generation. Operating revenues includes capacity sales and sales under load services requirements contracts.
2 | | Average realized gross margin is equal to all-in average realized prices less average fuel and emission costs. |
3 | | Year-to-date through June 30, 2008. |
August 29, 2008
EDISON INTERNATIONAL®
19
Leading the Way in Electricity SM
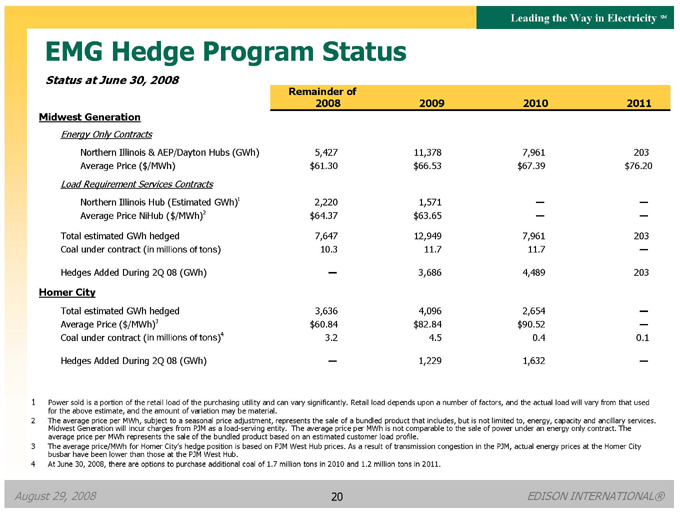
EMG Hedge Program Status
Status at June 30, 2008
Remainder of
2008 2009 2010 2011
Midwest Generation
Energy Only Contracts
Northern Illinois & AEP/Dayton Hubs (GWh) 5,427 11,378 7,961 203
Average Price ($/MWh) $61.30 $66.53 $67.39 $76.20
Load Requirement Services Contracts
Northern Illinois Hub (Estimated GWh)1 2,220 1,571 — —
Average Price NiHub ($/MWh)2 $64.37 $63.65 — —
Total estimated GWh hedged 7,647 12,949 7,961 203
Coal under contract (in millions of tons) 10.3 11.7 11.7 —
Hedges Added During 2Q 08 (GWh) — 3,686 4,489 203
Homer City
Total estimated GWh hedged 3,636 4,096 2,654 —
Average Price ($/MWh)3 $60.84 $82.84 $90.52 —
Coal under contract (in millions of tons)4 3.2 4.5 0.4 0.1
Hedges Added During 2Q 08 (GWh) — 1,229 1,632 —
1 Power sold is a portion of the retail load of the purchasing utility and can vary significantly. Retail load depends upon a number of factors, and the actual load will vary from that used for the above estimate, and the amount of variation may be material.
2 The average price per MWh, subject to a seasonal price adjustment, represents the sale of a bundled product that includes, but is not limited to, energy, capacity and ancillary services. Midwest Generation will incur charges from PJM as a load-serving entity. The average price per MWh is not comparable to the sale of power under an energy only contract. The average price per MWh represents the sale of the bundled product based on an estimated customer load profile.
3 The average price/MWh for Homer City’s hedge position is based on PJM West Hub prices. As a result of transmission congestion in the PJM, actual energy prices at the Homer City busbar have been lower than those at the PJM West Hub.
4 At June 30, 2008, there are options to purchase additional coal of 1.7 million tons in 2010 and 1.2 million tons in 2011.
August 29, 2008
EDISON INTERNATIONAL®
20
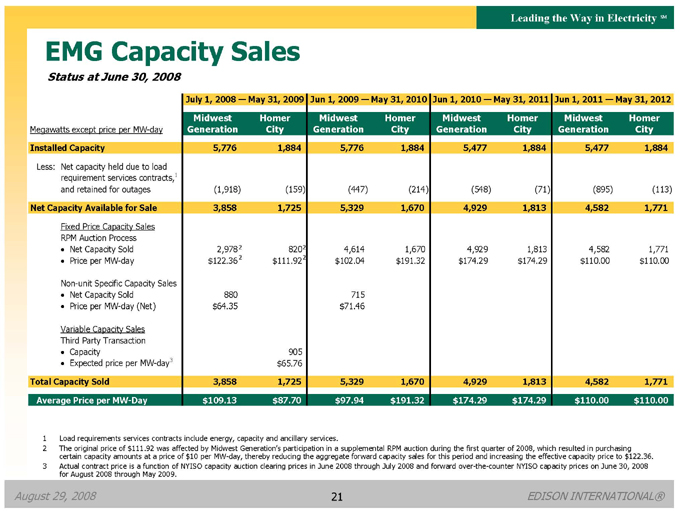
Leading the Way in Electricity SM
EMG Capacity Sales
Status at June 30, 2008
July 1, 2008 — May 31, 2009 Jun 1, 2009 — May 31, 2010 Jun 1, 2010 — May 31, 2011 Jun 1, 2011 — May 31, 2012
Midwest Homer Midwest Homer Midwest Homer Midwest Homer
Megawatts except price per MW-day Generation City Generation City Generation City Generation City
Installed Capacity 5,776 1,884 5,776 1,884 5,477 1,884 5,477 1,884
Less: Net capacity held due to load
requirement services contracts,1
and retained for outages (1,918) (159) (447) (214) (548) (71) (895) (113)
Net Capacity Available for Sale 3,858 1,725 5,329 1,670 4,929 1,813 4,582 1,771
Fixed Price Capacity Sales
RPM Auction Process
Net Capacity Sold 2,978 2 820 2 4,614 1,670 4,929 1,813 4,582 1,771
Price per MW-day $122.36 2 $111.92 2 $102.04 $191.32 $174.29 $174.29 $110.00 $110.00
Non-unit Specific Capacity Sales
Net Capacity Sold 880 715
Price per MW-day (Net) $64.35 $71.46
Variable Capacity Sales
Third Party Transaction
Capacity 905
Expected price per MW-day3 $65.76
Total Capacity Sold 3,858 1,725 5,329 1,670 4,929 1,813 4,582 1,771
Average Price per MW-Day $109.13 $87.70 $97.94 $191.32 $174.29 $174.29 $110.00 $110.00
1 | | Load requirements services contracts include energy, capacity and ancillary services. |
2 The original price of $111.92 was affected by Midwest Generation’s participation in a supplemental RPM auction during the first quarter of 2008, which resulted in purchasing certain capacity amounts at a price of $10 per MW-day, thereby reducing the aggregate forward capacity sales for this period and increasing the effective capacity price to $122.36.
3 Actual contract price is a function of NYISO capacity auction clearing prices in June 2008 through July 2008 and forward over-the-counter NYISO capacity prices on June 30, 2008 for August 2008 through May 2009.
August 29, 2008
EDISON INTERNATIONAL®
21
Leading the Way in Electricity SM
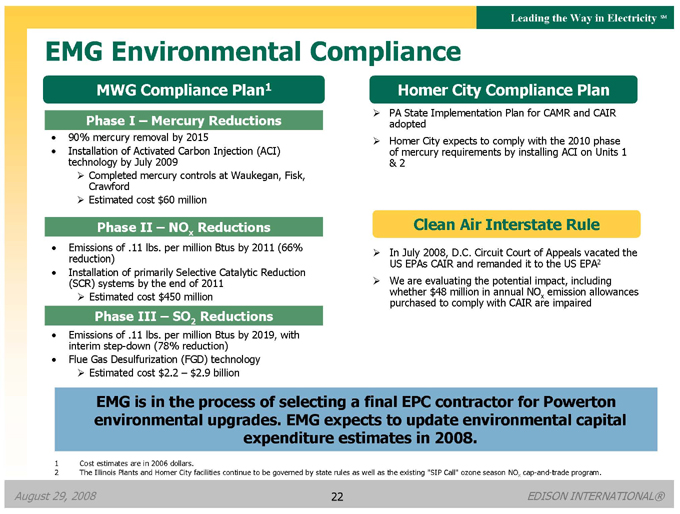
EMG Environmental Compliance
MWG Compliance Plan1
Phase I – Mercury Reductions
90% mercury removal by 2015
Installation of Activated Carbon Injection (ACI) technology by July 2009
Completed mercury controls at Waukegan, Fisk, Crawford
Estimated cost $60 million
Phase II – NOx Reductions
Emissions of .11 lbs. per million Btus by 2011 (66% reduction)
Installation of primarily Selective Catalytic Reduction (SCR) systems by the end of 2011
Estimated cost $450 million
Phase III – SO2 Reductions
Emissions of .11 lbs. per million Btus by 2019, with interim step-down (78% reduction)
Flue Gas Desulfurization (FGD) technology
Estimated cost $2.2 – $2.9 billion
Homer City Compliance Plan
PA State Implementation Plan for CAMR and CAIR adopted
Homer City expects to comply with the 2010 phase of mercury requirements by installing ACI on Units 1
& 2
Clean Air Interstate Rule
In July 2008, D.C. Circuit Court of Appeals vacated the US EPAs CAIR and remanded it to the US EPA2
We are evaluating the potential impact, including whether $48 million in annual NOx emission allowances purchased to comply with CAIR are impaired
EMG is in the process of selecting a final EPC contractor for Powerton environmental upgrades. EMG expects to update environmental capital expenditure estimates in 2008.
1 | | Cost estimates are in 2006 dollars. |
2 The Illinois Plants and Homer City facilities continue to be governed by state rules as well as the existing “SIP Call” ozone season NOx cap-and-trade program.
August 29, 2008
EDISON INTERNATIONAL®
22
Leading the Way in Electricity SM
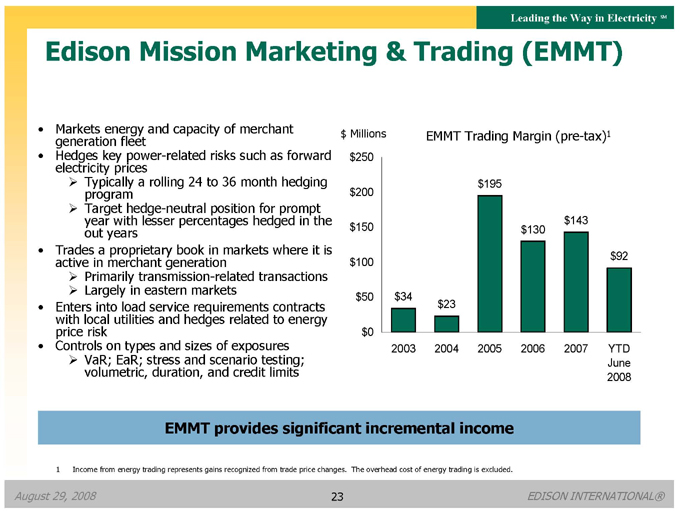
Edison Mission Marketing & Trading (EMMT)
Markets energy and capacity of merchant generation fleet
Hedges key power-related risks such as forward electricity prices
Typically a rolling 24 to 36 month hedging program
Target hedge-neutral position for prompt year with lesser percentages hedged in the out years
Trades a proprietary book in markets where it is active in merchant generation
Primarily transmission-related transactions
Largely in eastern markets
Enters into load service requirements contracts with local utilities and hedges related to energy price risk
Controls on types and sizes of exposures
VaR; EaR; stress and scenario testing; volumetric, duration, and credit limits
EMMT Trading Margin (pre-tax)1
$ Millions $250
$200 $150 $100 $50 $0
$195
$143 $130
$92
$34 $23
2003 2004 2005 2006 2007 YTD June 2008
EMMT provides significant incremental income
1 Income from energy trading represents gains recognized from trade price changes. The overhead cost of energy trading is excluded.
August 29, 2008
EDISON INTERNATIONAL®
23
Leading the Way in Electricity SM
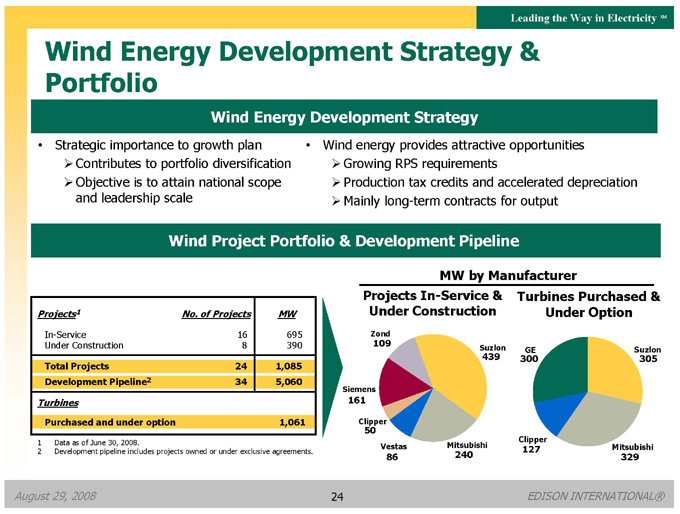
Wind Energy Development Strategy & Portfolio
Wind Energy Development Strategy
Strategic importance to growth plan
Contributes to portfolio diversification
Objective is to attain national scope and leadership scale
Wind energy provides attractive opportunities
Growing RPS requirements
Production tax credits and accelerated depreciation
Mainly long-term contracts for output
Wind Project Portfolio & Development Pipeline
Projects1 No. of Projects MW
In-Service 16 695
Under Construction 8 390
Total Projects 24 1,085
Development Pipeline2 34 5,060
Turbines
Purchased and under option 1,061
1 | | Data as of June 30, 2008. |
2 | | Development pipeline includes projects owned or under exclusive agreements. |
MW by Manufacturer
Projects In-Service & Under Construction
Zond 109
Suzlon 439
Siemens 161
Clipper 50
Vestas Mitsubishi
86 240
Turbines Purchased & Under Option
300 GE Suzlon 305
Clipper Mitsubishi 127 329
August 29, 2008
EDISON INTERNATIONAL®
24
Leading the Way in Electricity SM
EMG Diversifying With Wind
Arizona
Pipeline 1,140 MW
Wyoming
Construction 141 MW
Pipeline 100 MW
Utah
Construction 19 MW
Pipeline 70 MW
Oklahoma
Operating 95 MW
Construction 19 MW
Pipeline 280 MW
Nevada
Pipeline 515 MW
New Mexico
Operating 90 MW
Pipeline 1,070 MW
Texas
Operating 241 MW
Construction 70 MW
Pipeline 400 MW
Iowa
Operating 145 MW
Pipeline 200 MW
Minnesota
Operating 95 MW
Construction 50 MW
Pipeline 130 MW
Nebraska
Construction 53 MW
Illinois
Pipeline 520 MW
Maryland
Pipeline 85 MW
Wisconsin
Pipeline 100 MW
New York
Pipeline 258 MW
West Virginia
Pipeline 192 MW
Pennsylvania
Operating 29 MW
Construction 38 MW
EMG Wind Portfolio1
MW
Operating 695
Construction 390
1,085
Pipeline 5,060
Turbines (not shown) 1,061
1 | | Owned or under exclusive agreement at June 30, 2008. Turbines purchased or committed to support development pipeline. |
August 29, 2008
EDISON INTERNATIONAL®
25
Leading the Way in Electricity SM
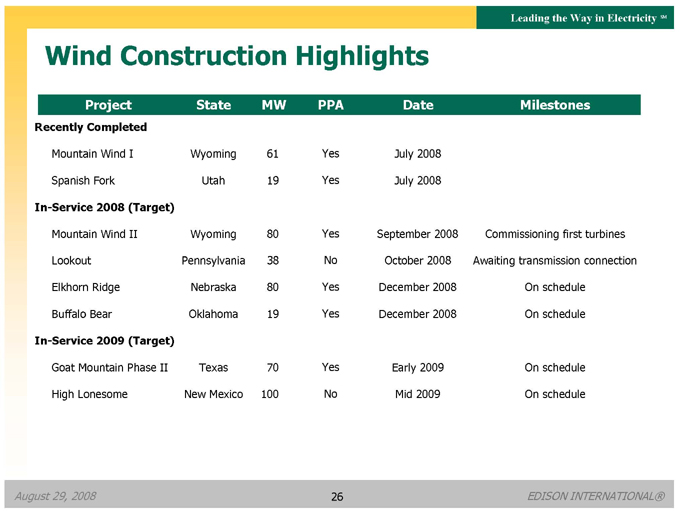
Wind Construction Highlights
Project State MW PPA Date Milestones
Recently Completed
Mountain Wind I Wyoming 61 Yes July 2008
Spanish Fork Utah 19 Yes July 2008
In-Service 2008 (Target)
Mountain Wind II Wyoming 80 Yes September 2008 Commissioning first turbines
Lookout Pennsylvania 38 No October 2008 Awaiting transmission connection
Elkhorn Ridge Nebraska 80 Yes December 2008 On schedule
Buffalo Bear Oklahoma 19 Yes December 2008 On schedule
In-Service 2009 (Target)
Goat Mountain Phase II Texas 70 Yes Early 2009 On schedule
High Lonesome New Mexico 100 No Mid 2009 On schedule
August 29, 2008
EDISON INTERNATIONAL®
26
Leading the Way in Electricity SM
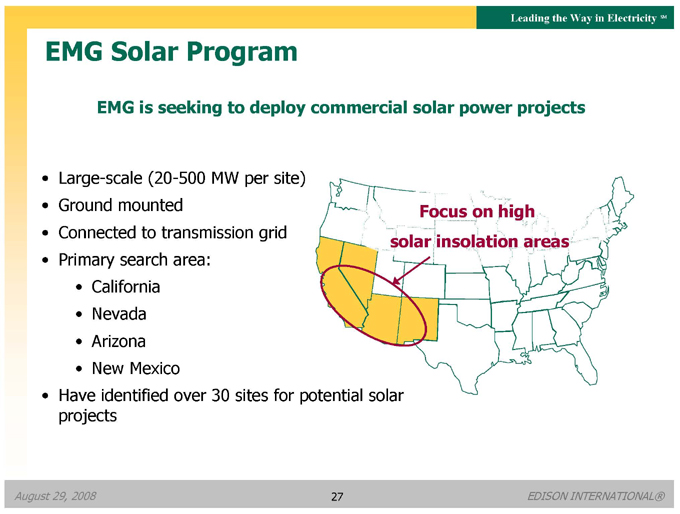
EMG Solar Program
EMG is seeking to deploy commercial solar power projects
Large-scale (20-500 MW per site)
Ground mounted
Connected to transmission grid
Primary search area:
California
Nevada
Arizona
New Mexico
Have identified over 30 sites for potential solar projects
Focus on high solar insolation areas
August 29, 2008
EDISON INTERNATIONAL®
27
Leading the Way in Electricity SM
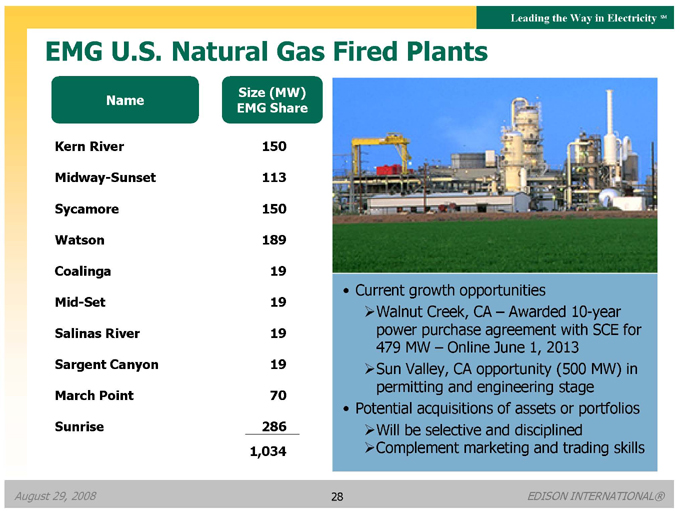
EMG U.S. Natural Gas Fired Plants
Size (MW)
Name EMG Share
Kern River 150
Midway-Sunset 113
Sycamore 150
Watson 189
Coalinga 19
Mid-Set 19
Salinas River 19
Sargent Canyon 19
March Point 70
Sunrise 286
1,034
Current growth opportunities
Walnut Creek, CA – Awarded 10-year power purchase agreement with SCE for 479 MW – Online June 1, 2013
Sun Valley, CA opportunity (500 MW) in permitting and engineering stage
Potential acquisitions of assets or portfolios
Will be selective and disciplined
Complement marketing and trading skills
August 29, 2008
EDISON INTERNATIONAL®
28
Leading the Way in Electricity SM
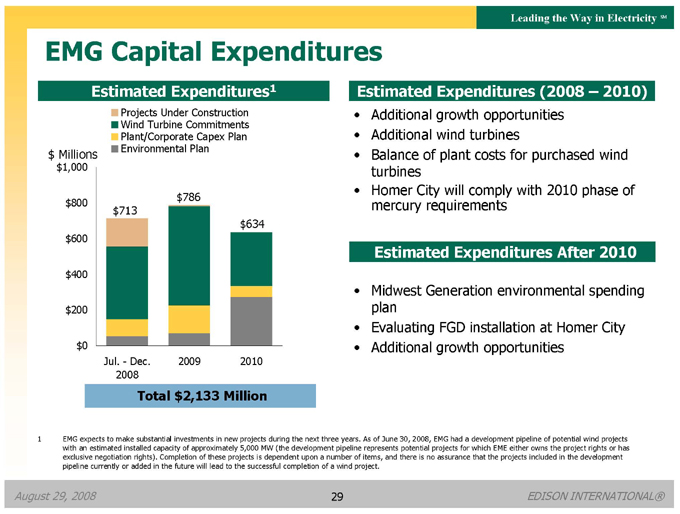
EMG Capital Expenditures
Estimated Expenditures1
Projects Under Construction Wind Turbine Commitments Plant/Corporate Capex Plan $ Millions Environmental Plan $1,000
$786 $800 $713 $634 $600
$400
$200
$0
Jul.—Dec. 2009 2010 2008
Total $2,133 Million
Estimated Expenditures (2008 – 2010)
Additional growth opportunities
Additional wind turbines
Balance of plant costs for purchased wind turbines
Homer City will comply with 2010 phase of mercury requirements
Estimated Expenditures After 2010
Midwest Generation environmental spending plan
Evaluating FGD installation at Homer City
Additional growth opportunities
1 EMG expects to make substantial investments in new projects during the next three years. As of June 30, 2008, EMG had a development pipeline of potential wind projects with an estimated installed capacity of approximately 5,000 MW (the development pipeline represents potential projects for which EME either owns the project rights or has exclusive negotiation rights). Completion of these projects is dependent upon a number of items, and there is no assurance that the projects included in the development pipeline currently or added in the future will lead to the successful completion of a wind project.
August 29, 2008
EDISON INTERNATIONAL®
29
Leading the Way in Electricity SM
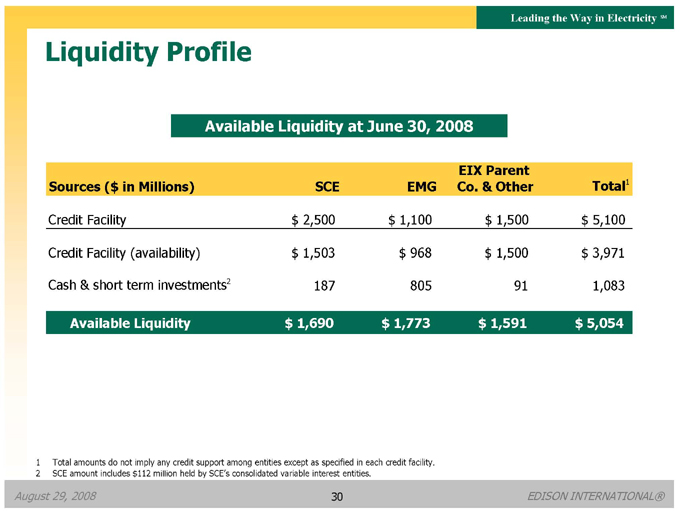
Liquidity Profile
Available Liquidity at June 30, 2008
EIX Parent
Sources ($ in Millions) SCE EMG Co. & Other Total1
Credit Facility $ 2,500 $ 1,100 $ 1,500 $ 5,100
Credit Facility (availability) $ 1,503 $ 968 $ 1,500 $ 3,971
Cash & short term investments2 187 805 91 1,083
Available Liquidity $ 1,690 $ 1,773 $ 1,591 $ 5,054
1 | | Total amounts do not imply any credit support among entities except as specified in each credit facility. |
2 | | SCE amount includes $112 million held by SCE’s consolidated variable interest entities. |
August 29, 2008
EDISON INTERNATIONAL®
30

Leading the Way in Electricity SM
Our Shareholder Value Proposition
Attractive business portfolio and growth opportunities
Southern California Edison
Demonstrated need for utility infrastructure investments
Among the best domestic electric utility growth platforms
Leadership in environmental and alternative energy programs (energy efficiency, renewable energy, advanced technologies)
Edison Mission Group
Favorable market conditions for unregulated generation portfolio
Strong growth pipeline led by renewable investments
Commitment to long-term shareholder value creation
Incentive compensation and stock ownership guidelines consistent with shareholder interests
Edison people committed to excellence in safety and customer service
August 29, 2008
EDISON INTERNATIONAL®
31
Leading the Way in Electricity SM
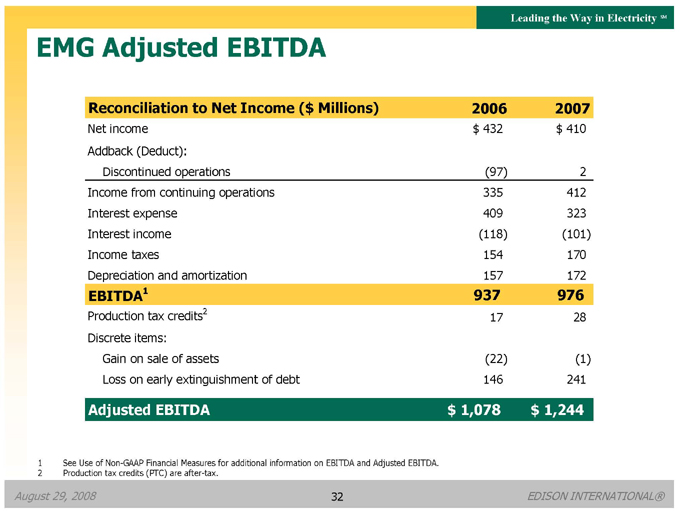
EMG Adjusted EBITDA
Reconciliation to Net Income ($ Millions) 2006 2007
Net income $ 432 $ 410
Addback (Deduct):
Discontinued operations (97) 2
Income from continuing operations 335 412
Interest expense 409 323
Interest income (118) (101)
Income taxes 154 170
Depreciation and amortization 157 172
EBITDA1 937 976
Production tax credits2 17 28
Discrete items:
Gain on sale of assets (22) (1)
Loss on early extinguishment of debt 146 241
Adjusted EBITDA $ 1,078 $ 1,244
1 | | See Use of Non-GAAP Financial Measures for additional information on EBITDA and Adjusted EBITDA. |
2 | | Production tax credits (PTC) are after-tax. |
August 29, 2008
EDISON INTERNATIONAL®
32

Leading the Way in Electricity SM
Use of Non-GAAP Financial Measures
Edison International’s earnings are prepared in accordance with generally accepted accounting principles used in the United States and represent the company’s earnings as reported to the Securities and Exchange Commission. Our management uses core earnings and EPS by principal operating subsidiary internally for financial planning and for analysis of performance. We also use core earnings and EPS by principal operating subsidiary as primary performance measurements when communicating with analysts and investors regarding our earnings results and outlook, as it allows us to more accurately compare the company’s ongoing performance across periods. Core earnings exclude discontinued operations and other non-core items and are reconciled to basic earnings per common share.
EPS by principal operating subsidiary is based on the principal operating subsidiary net income and Edison International’s weighted average outstanding common shares. The impact of participating securities (vested stock options that earn dividend equivalents that may participate in undistributed earnings with common stock) for each principal operating subsidiary is not material to each principal operating subsidiary’s EPS and is therefore reflected in the results of the Edison International holding company, which we refer to as EIX parent company. EPS and core EPS by principal operating subsidiary are reconciled to basic earnings per common share.
EBITDA is defined as earnings before interest, income taxes, depreciation and amortization. Adjusted EBITDA includes production tax credits from EMG’s wind projects and excludes amounts from gain on the sale of assets, loss on early extinguishment of debt and leases, and impairment of assets and investments. Our management uses Adjusted EBITDA as an important financial measure for evaluating EMG.
A reconciliation of Non-GAAP information to GAAP information, including the impact of participating securities, is included either on the slide where the information appears or on another slide referenced in the presentation.
August 29, 2008
EDISON INTERNATIONAL®
33