Exhibit 99.1
Leading the Way in Electricity SM
Bernstein Alternative Energy Conference September 16, 2008
Pedro J. Pizarro Executive Vice President Southern California Edison
September 16, 2008 EDISON INTERNATIONAL®
Leading the Way in Electricity SM
Forward-Looking Statements
Statements contained in this presentation about future performance, including, without limitation, earnings, asset and rate base growth, load growth, capital investments, and other statements that are not purely historical, are forward-looking statements. These forward-looking statements reflect our current expectations; however, such statements involve risks and uncertainties. Actual results could differ materially from current expectations. Important factors that could cause different results are discussed under the headings “Risk Factors” and “Management’s Discussion and Analysis” in Edison International’s 2007 Form 10-K and other reports filed with the Securities and Exchange Commission available on our website: www.edisoninvestor.com. These forward-looking statements represent our expectations only as of the date of this presentation, and Edison International assumes no duty to update them to reflect new information, events or circumstances.
September 16, 2008 1 EDISON INTERNATIONAL®
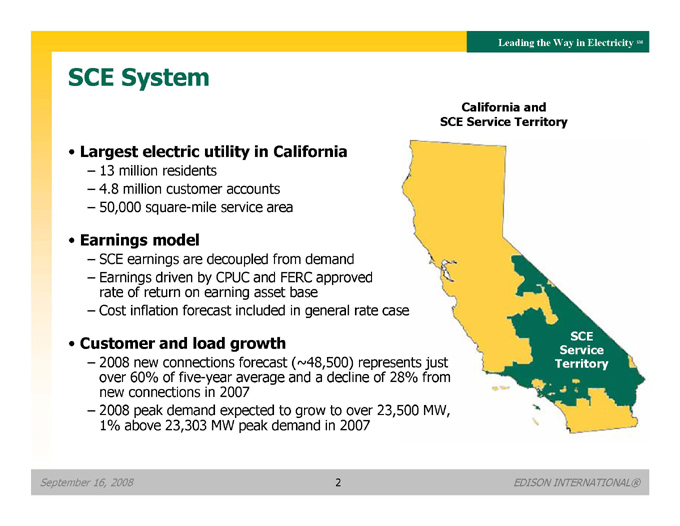
SCE System
Leading the Way in Electricity SM
Largest electric utility in California
– 13 million residents
– 4.8 million customer accounts
– 50,000 square-mile service area
Earnings model
– SCE earnings are decoupled from demand
– Earnings driven by CPUC and FERC approved rate of return on earning asset base
– Cost inflation forecast included in general rate case
Customer and load growth
– 2008 new connections forecast (~48,500) represents just over 60% of five-year average and a decline of 28% from new connections in 2007
– 2008 peak demand expected to grow to over 23,500 MW, 1% above 23,303 MW peak demand in 2007
California and SCE Service Territory
September 16, 2008 2 EDISON INTERNATIONAL®
Leading the Way in Electricity SM
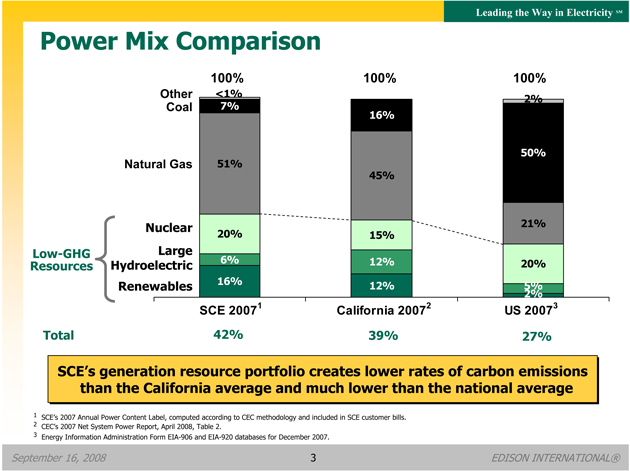
Power Mix Comparison
Other Coal
100%
<1%
100%
100%
7%
16%
2%
Natural Gas
51%
45%
50%
Low-GHG Resources
Nuclear
Large
Hydroelectric
Renewables
20%
15%
21%
6%
12%
20%
16%
12%
5%
2%
SCE 2007 1
California 2007 2
US 2007 3
Total
42%
39%
27%
SCE’s generation resource portfolio creates lower rates of carbon emissions than the California average and much lower than the national average
1 | | SCE’s 2007 Annual Power Content Label, computed according to CEC methodology and included in SCE customer bills. |
2 | | CEC’s 2007 Net System Power Report, April 2008, Table 2. |
3 | | Energy Information Administration Form EIA-906 and EIA-920 databases for December 2007. |
September 16, 2008
EDISON INTERNATIONAL®
Leading the Way in Electricity SM
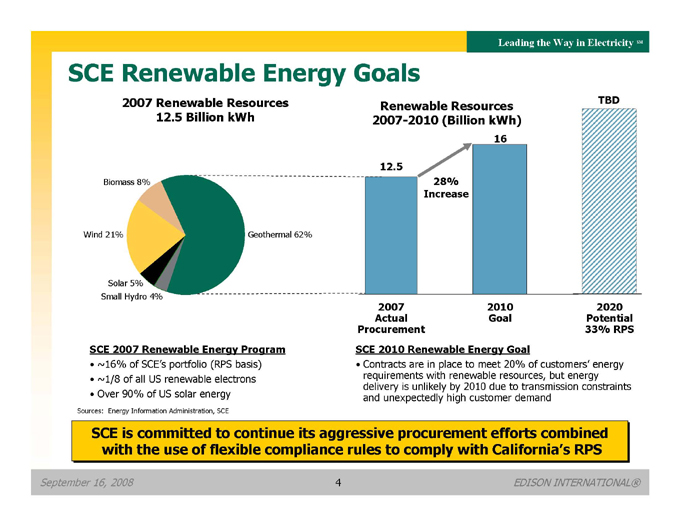
SCE Renewable Energy Goals
2007 Renewable Resources Renewable Resources TBD
12.5 Billion kWh 2007-2010 (Billion kWh) 16
12.5
Biomass 8% 28% Increase
Wind 21% Geothermal 62%
Solar 5% Small Hydro 4%
2007 2010 2020 Actual Goal Potential Procurement 33% RPS
SCE 2007 Renewable Energy Program SCE 2010 Renewable Energy Goal
~16% of SCE’s portfolio (RPS basis) Contracts are in place to meet 20% of customers’ energy
~1/8 of all US renewable electrons requirements with renewable resources, but energy delivery is unlikely by 2010 due to transmission constraints
Over 90% of US solar energy and unexpectedly high customer demand
Sources: Energy Information Administration, SCE
SCE is committed to continue its aggressive procurement efforts combined with the use of flexible compliance rules to comply with California’s RPS
September 16, 2008 4 EDISON INTERNATIONAL®
Leading the Way in Electricity SM
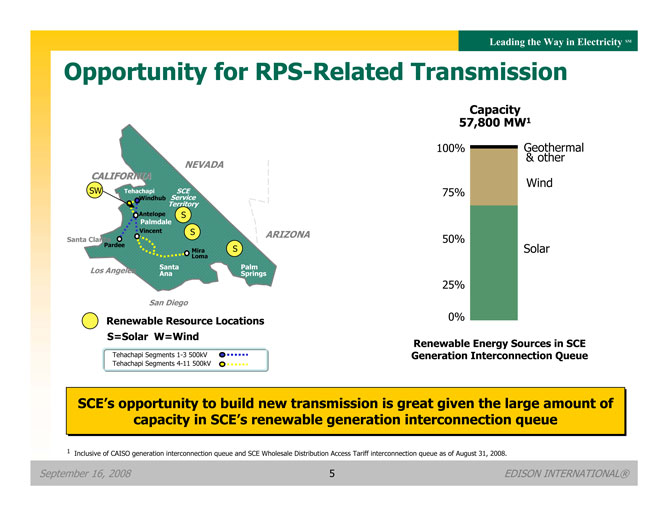
Opportunity for RPS-Related Transmission
Capacity 57,800 MW1
100% Geothermal & other
NEVADA CALIFORNIA
Tehachapi SCE Wind
SW Service 75%
Windhub
Territory
Antelope S Palmdale
Vincent S ARIZONA
Santa Clarita 50%
Pardee Mira S Solar Loma Los Angeles Santa Ana Springs Palm
25%
San Diego
Renewable Resource Locations 0% S=Solar W=Wind
Renewable Energy Sources in SCE Tehachapi Segments 1-3 500kV Generation Interconnection Queue
Tehachapi Segments 4-11 500kV
SCE’s opportunity to build new transmission is great given the large amount of capacity in SCE’s renewable generation interconnection queue
1 Inclusive of CAISO generation interconnection queue and SCE Wholesale Distribution Access Tariff interconnection queue as of August 31, 2008.
September 16, 2008 5 EDISON INTERNATIONAL®
Leading the Way in Electricity SM
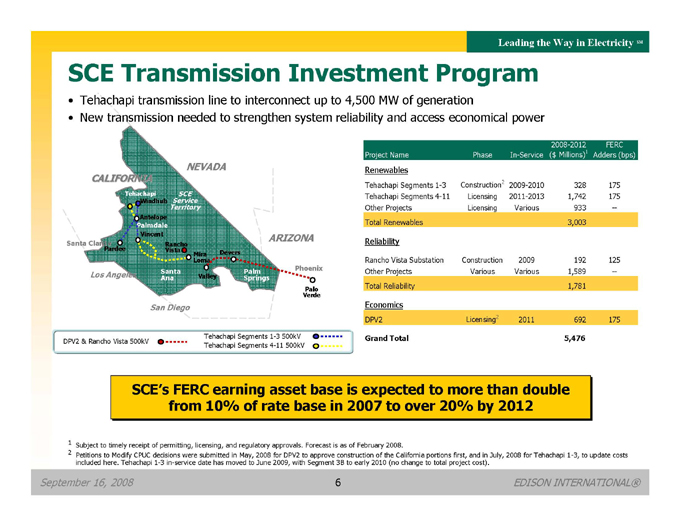
SCE Transmission Investment Program
Tehachapi transmission line to interconnect up to 4,500 MW of generation
New transmission needed to strengthen system reliability and access economical power
2008-2012 FERC Project Name Phase In-Service ($ Millions)1 Adders (bps) NEVADA Renewables
CALIFORNIA 2
Tehachapi Segments 1-3 Construction 2009-2010 328 175 Tehachapi Service SCE Tehachapi Segments 4-11 Licensing 2011-2013 1,742 175
Windhub
Territory Other Projects Licensing Various 933 —
Antelope
Palmdale Total Renewables 3,003 Vincent ARIZONA Reliability
Santa Clarita Rancho Pardee Vista
Mira Devers
Loma Rancho Vista Substation Construction 2009 192 125 Santa Palm Phoenix Other Projects Various Various 1,589 —
Los Angeles Ana Valley Springs
Palo Total Reliability 1,781
Verde
San Diego Economics
DPV2 Licensing2 2011 692 175 Tehachapi Segments 1-3 500kV Grand Total 5,476 DPV2 & Rancho Vista 500kV
Tehachapi Segments 4-11 500kV
SCE’s FERC earning asset base is expected to more than double from 10% of rate base in 2007 to over 20% by 2012
1 | | Subject to timely receipt of permitting, licensing, and regulatory approvals. Forecast is as of February 2008. |
2 Petitions to Modify CPUC decisions were submitted in May, 2008 for DPV2 to approve construction of the California portions first, and in July, 2008 for Tehachapi 1-3, to update costs included here. Tehachapi 1-3 in-service date has moved to June 2009, with Segment 3B to early 2010 (no change to total project cost).
September 16, 2008 6 EDISON INTERNATIONAL®
Leading the Way in Electricity SM
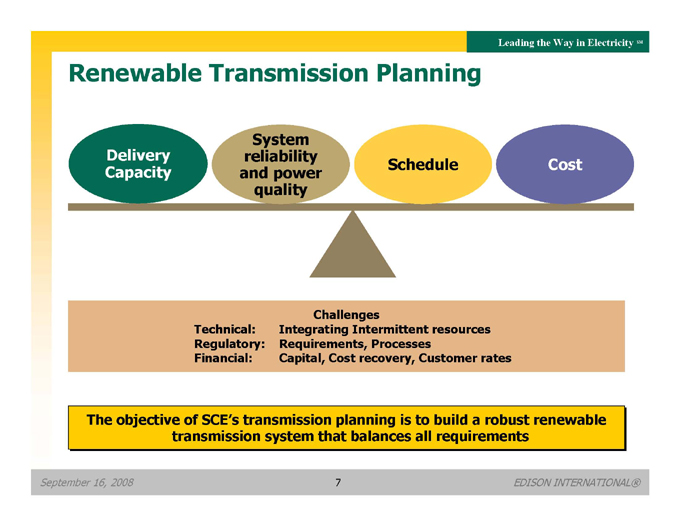
Renewable Transmission Planning
System Delivery reliability
Capacity Schedule Cost and power quality
Challenges
Technical: Integrating Intermittent resources Regulatory: Requirements, Processes Financial: Capital, Cost recovery, Customer rates
The objective of SCE’s transmission planning is to build a robust renewable transmission system that balances all requirements
September 16, 2008 7 EDISON INTERNATIONAL®
Leading the Way in Electricity SM
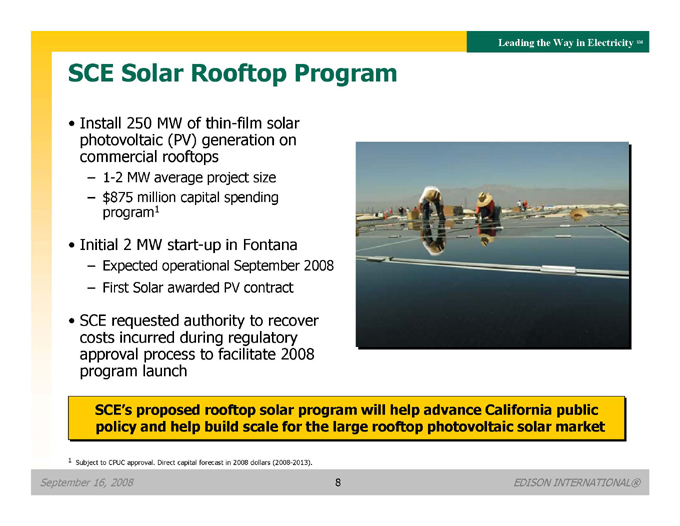
SCE Solar Rooftop Program
Install 250 MW of thin-film solar photovoltaic (PV) generation on commercial rooftops
– 1-2 MW average project size
– $875 million capital spending program1
Initial 2 MW start-up in Fontana
– Expected operational September 2008
– First Solar awarded PV contract
SCE requested authority to recover costs incurred during regulatory approval process to facilitate 2008 program launch
SCE’s proposed rooftop solar program will help advance California public policy and help build scale for the large rooftop photovoltaic solar market
1 | | Subject to CPUC approval. Direct capital forecast in 2008 dollars (2008-2013). |
September 16, 2008 8 EDISON INTERNATIONAL®
Leading the Way in Electricity SM
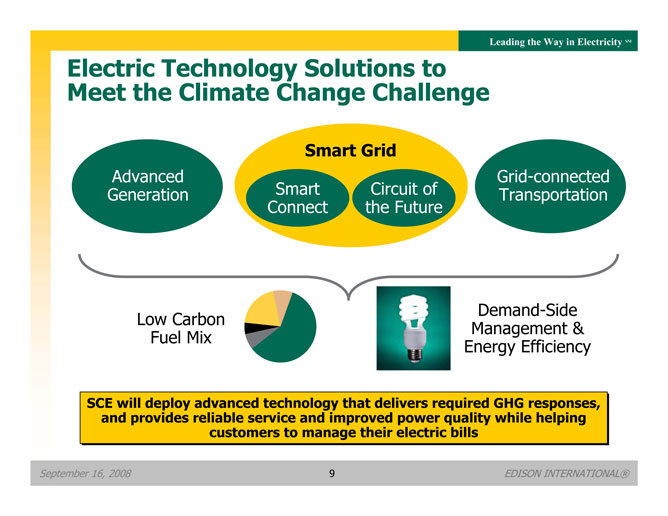
Electric Technology Solutions to Meet the Climate Change Challenge
Smart Grid
Advanced Grid-connected Generation Smart Circuit of Transportation Connect the Future
Demand-Side Low Carbon Management & Fuel Mix Energy Efficiency
SCE will deploy advanced technology that delivers required GHG responses, and provides reliable service and improved power quality while helping customers to manage their electric bills
September 16, 2008 9 EDISON INTERNATIONAL®
Leading the Way in Electricity SM
Appendix
September 16, 2008 10 EDISON INTERNATIONAL®
Leading the Way in Electricity SM
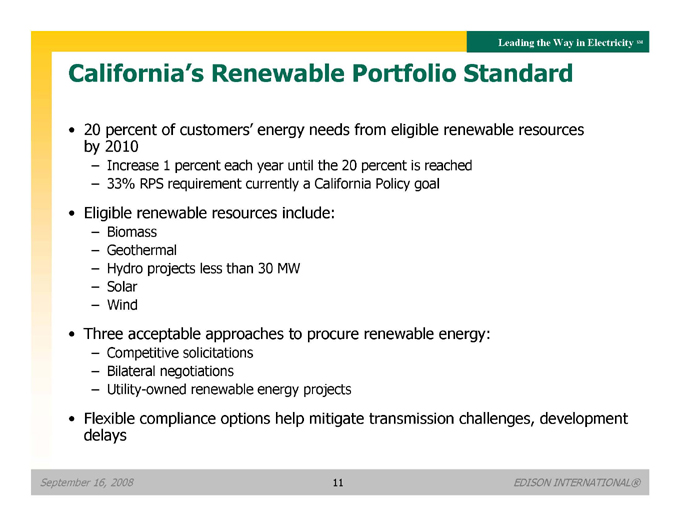
California’s Renewable Portfolio Standard
20 percent of customers’ energy needs from eligible renewable resources by 2010
– Increase 1 percent each year until the 20 percent is reached
– 33% RPS requirement currently a California Policy goal
Eligible renewable resources include:
– Biomass
– Geothermal
– Hydro projects less than 30 MW
– Solar
– Wind
Three acceptable approaches to procure renewable energy:
– Competitive solicitations
– Bilateral negotiations
– Utility-owned renewable energy projects
Flexible compliance options help mitigate transmission challenges, development delays
September 16, 2008 11 EDISON INTERNATIONAL®
Leading the Way in Electricity SM
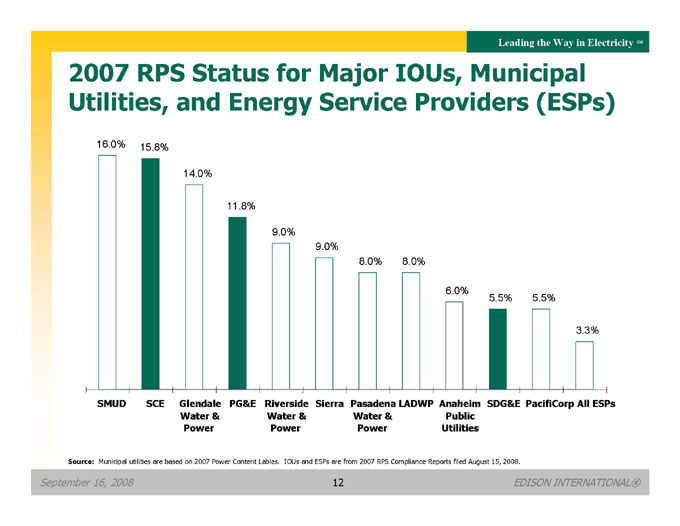
2007 RPS Status for Major IOUs, Municipal Utilities, and Energy Service Providers (ESPs)
16.0% 15.8%
14.0%
11.8%
9.0%
9.0%
8.0% 8.0%
6.0%
5.5% 5.5%
3.3%
SMUD
SCE
Glendale PG&E Water & Power
Riverside Sierra Water & Power
Pasadena LADWP Water & Power
Anaheim Public Utilities
SDG&E PacifiCorp All ESPs
Source: Municipal utilities are based on 2007 Power Content Lables. IOUs and ESPs are from 2007 RPS Compliance Reports filed August 15, 2008.
September 16, 2008 12 EDISON INTERNATIONAL®
Leading the Way in Electricity SM
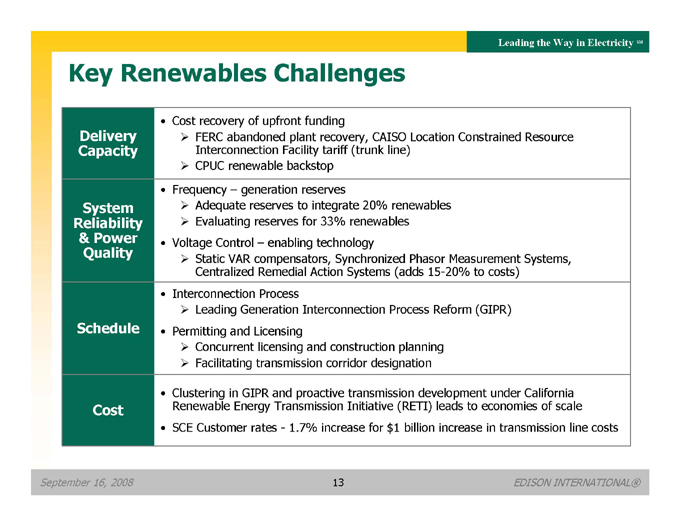
Key Renewables Challenges
Delivery Capacity
Cost recovery of upfront funding
??FERC abandoned plant recovery, CAISO Location Constrained Resource Interconnection Facility tariff (trunk line)
??CPUC renewable backstop
System Reliability
& Power Quality
Frequency – generation reserves
??Adequate reserves to integrate 20% renewables
??Evaluating reserves for 33% renewables
Voltage Control – enabling technology
??Static VAR compensators, Synchronized Phasor Measurement Systems, Centralized Remedial Action Systems (adds 15-20% to costs)
Schedule
Interconnection Process
??Leading Generation Interconnection Process Reform (GIPR)
Permitting and Licensing
??Concurrent licensing and construction planning
??Facilitating transmission corridor designation
Cost
Clustering in GIPR and proactive transmission development under California Renewable Energy Transmission Initiative (RETI) leads to economies of scale
SCE Customer rates—1.7% increase for $1 billion increase in transmission line costs
September 16, 2008 13 EDISON INTERNATIONAL®
Leading the Way in Electricity SM
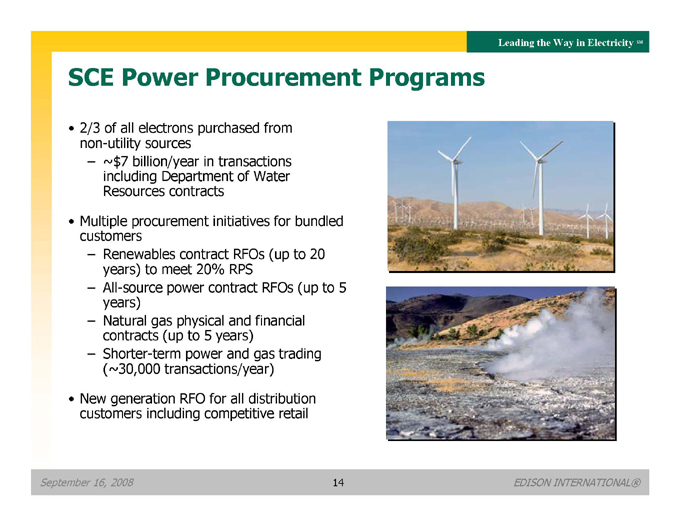
SCE Power Procurement Programs
2/3 of all electrons purchased from non-utility sources
– ~$7 billion/year in transactions including Department of Water Resources contracts
Multiple procurement initiatives for bundled customers
– Renewables contract RFOs (up to 20 years) to meet 20% RPS
– All-source power contract RFOs (up to 5 years)
– Natural gas physical and financial contracts (up to 5 years)
– Shorter-term power and gas trading (~30,000 transactions/year)
New generation RFO for all distribution customers including competitive retail
September 16, 2008 14 EDISON INTERNATIONAL®
Leading the Way in Electricity SM
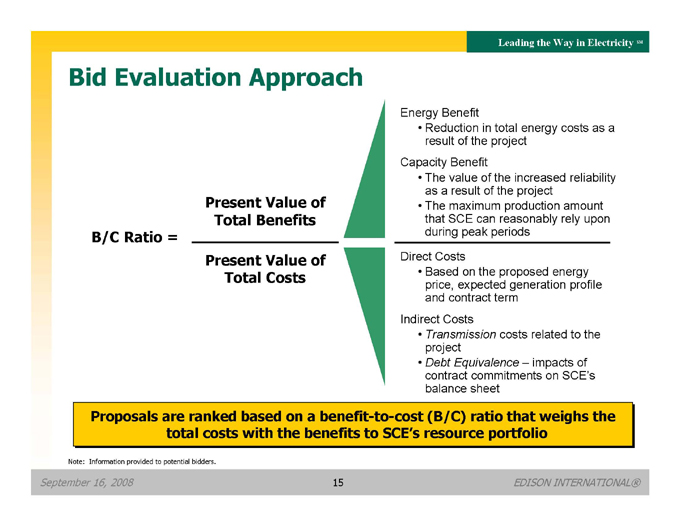
Bid Evaluation Approach
B/C Ratio =
Present Value of Total Benefits
Present Value of Total Costs
Energy Benefit
Reduction in total energy costs as a result of the project Capacity Benefit
The value of the increased reliability as a result of the project
The maximum production amount that SCE can reasonably rely upon during peak periods
Direct Costs
Based on the proposed energy price, expected generation profile and contract term Indirect Costs
Transmission costs related to the project
Debt Equivalence – impacts of contract commitments on SCE’s balance sheet
Proposals are ranked based on a benefitt—to—cost (B/C) ratio that weighs the total costs with the benefits to SCE’s resource portfolio
Note: Information provided to potential bidders.
September 16, 2008 15 EDISON INTERNATIONAL®
Leading the Way in Electricity SM
Solicitation Factors of Success
Competitively priced proposal
– Projects that qualify for federal subsidies have an advantage
– On-peak deliveries produce higher benefits, yielding higher benefit/cost ratios
– Federal subsidies include Production Tax Credits (for wind) or Investment Tax Credits (for solar)
Early place in the interconnection queue
– Provides priority for completing studies
– Allows for earlier interconnection, which can potentially avoid future transmission upgrade costs
– Helps bidders better understand their interconnection costs
Demonstrated signs of a viable project
– Site control
– Plan to deliver into CAISO grid
– Strong financial backing
– Realistic on-line dates and forecasted operating performance
Thoughtful edits to Pro Forma Contract
– Demonstrates major issues between buyer and seller to execute contract
– Gives some indication to the time required to develop and execute contract
SCE considers many factors when evaluating renewable energy projects
Note: Information provided to potential bidders.
September 16, 2008 16 EDISON INTERNATIONAL®
Leading the Way in Electricity SM
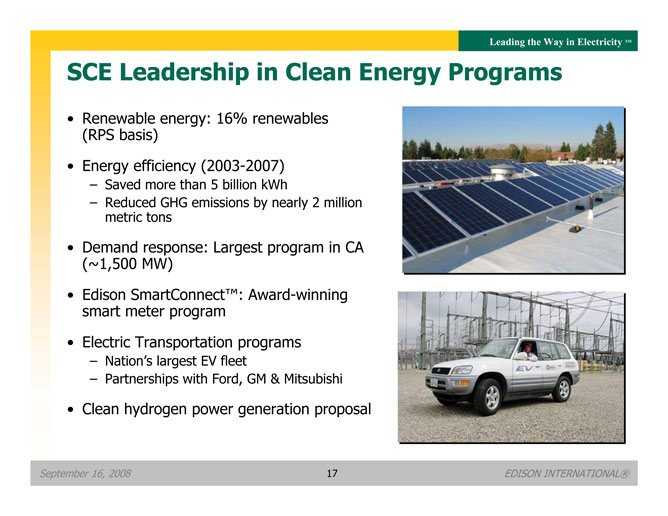
SCE Leadership in Clean Energy Programs
Renewable energy: 16% renewables (RPS basis)
Energy efficiency (2003-2007)
– Saved more than 5 billion kWh
– Reduced GHG emissions by nearly 2 million metric tons
Demand response: Largest program in CA (~1,500 MW)
Edison SmartConnect™: Award-winning smart meter program
Electric Transportation programs
– Nation’s largest EV fleet
– Partnerships with Ford, GM & Mitsubishi
Clean hydrogen power generation proposal
September 16, 2008 17 EDISON INTERNATIONAL®
Leading the Way in Electricity SM
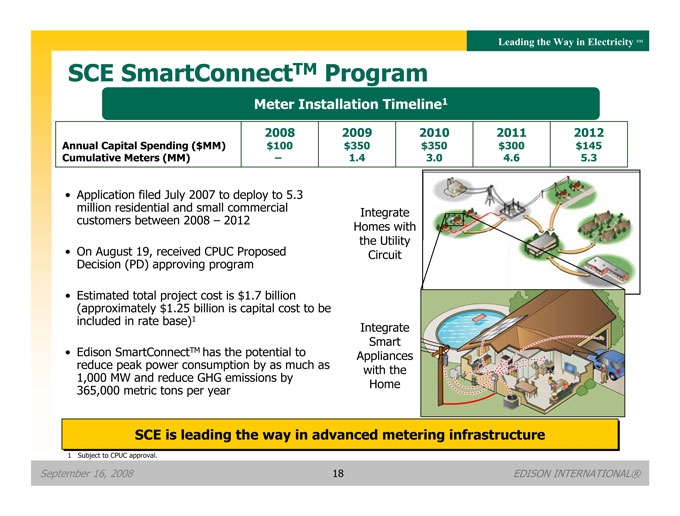
SCE SmartConnectTM Program
Meter Installation Timeline1
Annual Capital Spending ($MM) Cumulative Meters (MM)
2008 $100 –
2009 $350 1.4
2010 $350 3.0
2011 $300 4.6
2012 $145 5.3
Application filed July 2007 to deploy to 5.3 million residential and small commercial customers between 2008 – 2012
On August 19, received CPUC Proposed Decision (PD) approving program
Estimated total project cost is $1.7 billion (approximately $1.25 billion is capital cost to be included in rate base)1
Edison SmartConnectTM has the potential to reduce peak power consumption by as much as 1,000 MW and reduce GHG emissions by 365,000 metric tons per year
Integrate Homes with the Utility Circuit
Integrate Smart Appliances with the Home
SCE is leading the way in advanced metering infrastructure
1 | | Subject to CPUC approval. |
September 16, 2008 18 EDISON INTERNATIONAL®
Leading the Way in Electricity SM
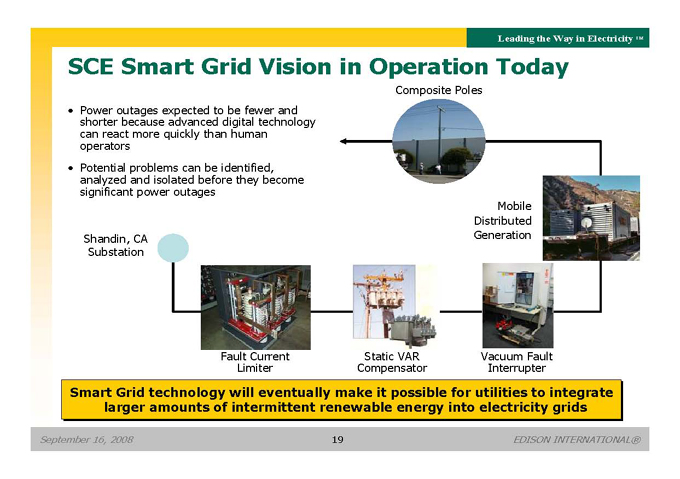
SCE Smart Grid Vision in Operation Today
Composite Poles
Power outages expected to be fewer and shorter because advanced digital technology can react more quickly than human operators
Potential problems can be identified, analyzed and isolated before they become significant power outages
Shandin, CA Substation
Mobile Distributed Generation
Fault Current Limiter
Static VAR
Compensator
Vacuum Fault Interrupter
Smart Grid technology will eventually make it possible for utilities to integrate larger amounts of intermittent renewable energy into electricity grids
September 16, 2008 19 EDISON INTERNATIONAL®
Leading the Way in Electricity SM
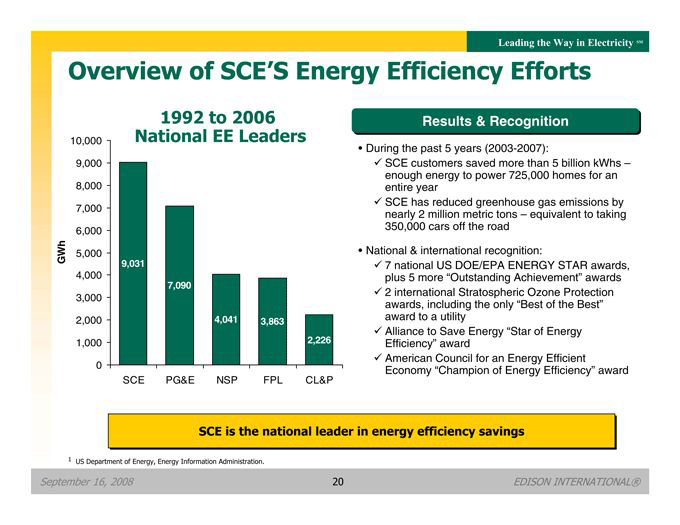
Overview of SCE’S Energy Efficiency Efforts
1992 to 2006 National EE Leaders
GWh
10,000 9,000 8,000 7,000 6,000 5,000 4,000 3,000 2,000 1,000 0
9,031
7,090
4,041 3,863
2,226
SCE PG&E NSP FPL CL&P
Results & Recognition
During the past 5 years (2003-2007):
SCE customers saved more than 5 billion kWhs –enough energy to power 725,000 homes for an entire year
SCE has reduced greenhouse gas emissions by nearly 2 million metric tons – equivalent to taking 350,000 cars off the road
National & international recognition:
7 | | national US DOE/EPA ENERGY STAR awards, plus 5 more “Outstanding Achievement” awards |
2 | | international Stratospheric Ozone Protection awards, including the only “Best of the Best” award to a utility |
Alliance to Save Energy “Star of Energy Efficiency” award
American Council for an Energy Efficient Economy “Champion of Energy Efficiency” award
SCE is the national leader in energy efficiency savings
1 | | US Department of Energy, Energy Information Administration. |
September 16, 2008 20 EDISON INTERNATIONAL®