Exhibit 99.1
Leading the Way in Electricity SM
Business Update
November 2008
November 7, 2008 EDISON INTERNATIONAL®

Leading the Way in Electricity SM
Forward-Looking Statements
Statements contained in this presentation about future performance, including, without limitation, earnings, asset and rate base growth, load growth, capital investments, and other statements that are not purely historical, are forward-looking statements. These forward-looking statements reflect our current expectations; however, such statements involve risks and uncertainties. Actual results could differ materially from current expectations. Important factors that could cause different results are discussed under the headings “Risk Factors” and “Management’s Discussion and Analysis” in Edison International’s 2007 Form 10-K and other reports filed with the Securities and Exchange Commission are available on our website: www.edisoninvestor.com. These forward-looking statements represent our expectations only as of the date of this presentation, and Edison International assumes no duty to update them to reflect new information, events or circumstances.
November 7, 2008 1 EDISON INTERNATIONAL®
Leading the Way in Electricity SM
What’s New Since Our Last Business Update
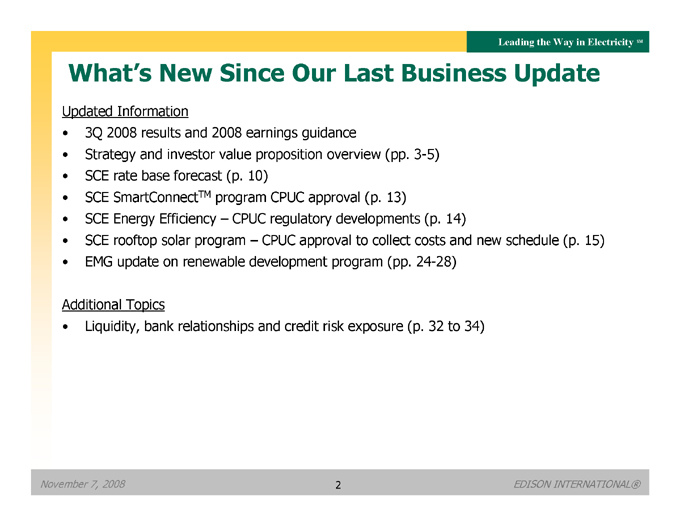
Updated Information
3Q 2008 results and 2008 earnings guidance
Strategy and investor value proposition overview (pp. 3-5)
SCE rate base forecast (p. 10)
SCE SmartConnectTM program CPUC approval (p. 13)
SCE Energy Efficiency – CPUC regulatory developments (p. 14)
SCE rooftop solar program – CPUC approval to collect costs and new schedule (p. 15)
EMG update on renewable development program (pp. 24-28)
Additional Topics
Liquidity, bank relationships and credit risk exposure (p. 32 to 34)
November 7, 2008 2 EDISON INTERNATIONAL®

Leading the Way in Electricity SM
Edison International Value Drivers
Business Model Leverage
One of the best U.S. electric utility growth opportunities
Unregulated power generation business with strong cash flow and diversification strategy focused on renewables
Growth opportunities driven by long-term public policy initiatives: reliable infrastructure, renewable energy and less carbon-intensity economy
Growth enablers:
Strong financial position
Excellence in execution
2007 Core Earnings By Business1
Southern California Edison 55%
Edison Mission Group 45%
2007 Assets By Business1
Southern California Edison 74%
Edison Mission Group 26%
1 See Non-GAAP Reconciliation and Use of Non-GAAP Financial Measures in Appendix for reconciliation to basic earnings per share and additional information on core earnings. Percentages exclude Edison International holding company costs and impact of participating securities.
November 7, 2008 3 EDISON INTERNATIONAL®
Leading the Way in Electricity SM
Southern California Edison Strategy
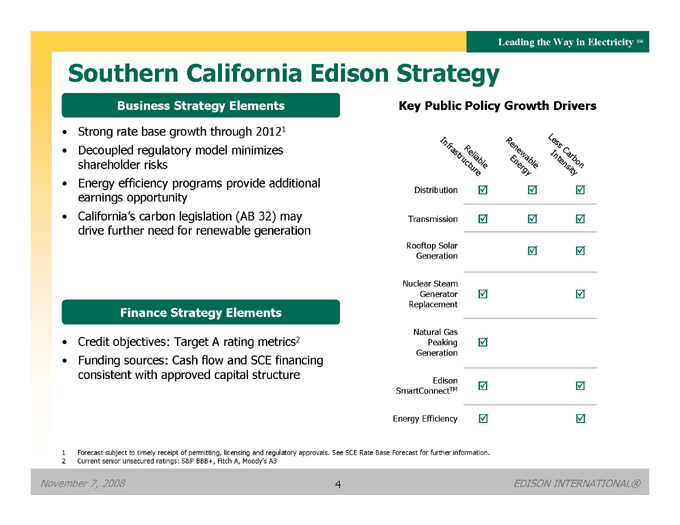
Business Strategy Elements
Strong rate base growth through 20121
Decoupled regulatory model minimizes shareholder risks
Energy efficiency programs provide additional earnings opportunity
California’s carbon legislation (AB 32) may drive further need for renewable generation
Finance Strategy Elements
Credit objectives: Target A rating metrics2
Funding sources: Cash flow and SCE financing consistent with approved capital structure
Key Public Policy Growth Drivers
Reliable Infrastructure
Renewable Energy
Less Carbon Intensity
Distribution
Transmission
Rooftop Solar Generation
Nuclear Steam Generator Replacement
Natural Gas Peaking Generation
Edison SmartConnectTM
Energy Efficiency
1 Forecast subject to timely receipt of permitting, licensing and regulatory approvals. See SCE Rate Base Forecast for further information.
2 Current senior unsecured ratings: S&P BBB+, Fitch A, Moody’s A3
November 7, 2008 4
Leading the Way in Electricity SM
Edison Mission Group Strategy
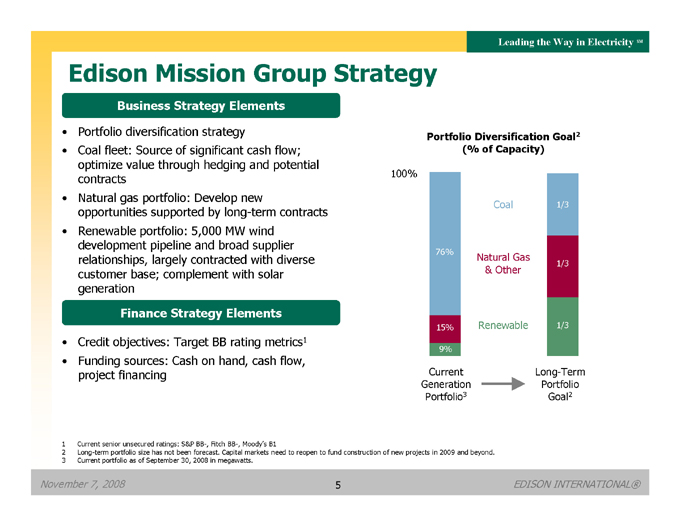
Business Strategy Elements
Portfolio diversification strategy
Coal fleet: Source of significant cash flow; optimize value through hedging and potential contracts
Natural gas portfolio: Develop new opportunities supported by long-term contracts
Renewable portfolio: 5,000 MW wind development pipeline and broad supplier relationships, largely contracted with diverse customer base; complement with solar generation
Finance Strategy Elements
Credit objectives: Target BB rating metrics1
Funding sources: Cash on hand, cash flow, project financing
Portfolio Diversification Goal2 (% of Capacity)
100%
76% 15% 9%
Current Generation Portfolio3
Long-Term Portfolio Goal2
Coal
Natural Gas & Other
Renewable
1/3 1/3 1/3
1 | | Current senior unsecured ratings: S&P BB-, Fitch BB-, Moody’s B1 |
2 Long-term portfolio size has not been forecast. Capital markets need to reopen to fund construction of new projects in 2009 and beyond.
3 | | Current portfolio as of September 30, 2008 in megawatts. |
November 7, 2008 5 EDISON INTERNATIONAL®
Leading the Way in Electricity SM
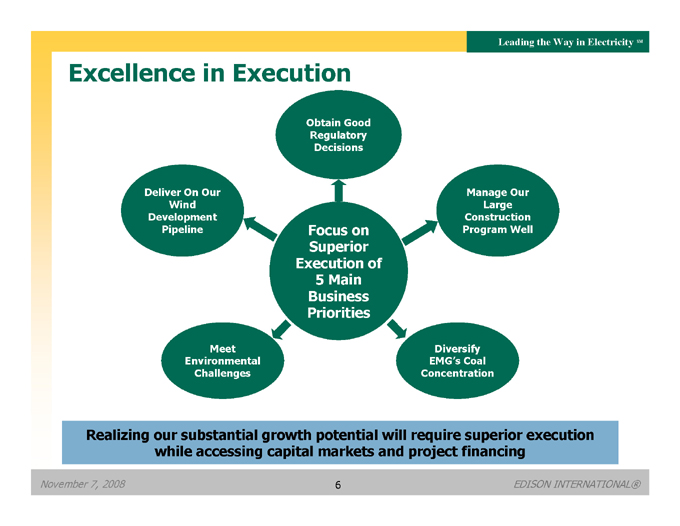
Excellence in Execution
Obtain Good Regulatory Decisions
Deliver On Our Wind Development Pipeline
Focus on Superior Execution of
5 | | Main Business Priorities |
Manage Our Large Construction Program Well
Meet Environmental Challenges
Diversify EMG’s Coal Concentration
Realizing our substantial growth potential will require superior execution while accessing capital markets and project financing
November 7, 2008 6 EDISON INTERNATIONAL®
Leading the Way in Electricity SM
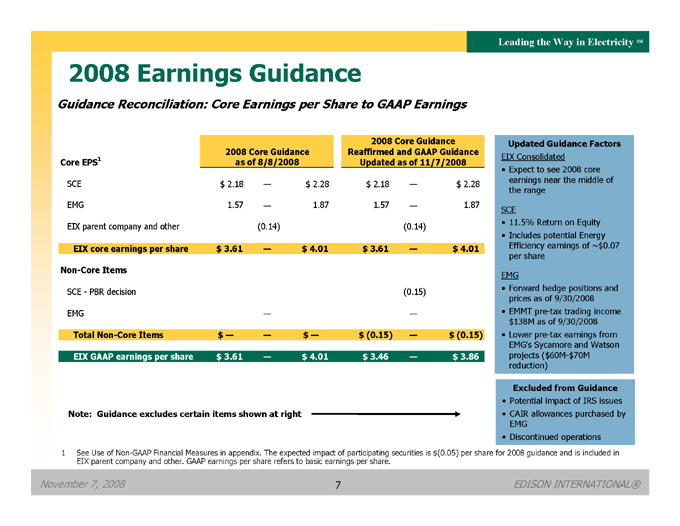
2008 Earnings Guidance
Guidance Reconciliation: Core Earnings per Share to GAAP Earnings
Core EPS1 2008 Core Guidance as of 8/8/2008 2008 Core Guidance Reaffirmed and GAAP Guidance Updated as of 11/7/2008
SCE $ 2.18 — $ 2.28 $ 2.18 — $ 2.28
EMG 1.57 — 1.87 1.57 — 1.87
EIX parent company and other (0.14) (0.14)
EIX core earnings per share $ 3.61 — $ 4.01 $ 3.61 — $ 4.01
Non-Core Items
SCE—PBR decision (0.15)
EMG — —
Total Non-Core Items $ — — $ — $ (0.15) — $ (0.15)
EIX GAAP earnings per share $ 3.61 — $ 4.01 $ 3.46 — $ 3.86
Note: Guidance excludes certain items shown at right
Updated Guidance Factors
EIX Consolidated
Expect to see 2008 core
earnings near the middle of the range
SCE
11.5% Return on Equity
Includes potential Energy Efficiency earnings of ~$0.07 per share EMG
Forward hedge positions and prices as of 9/30/2008
EMMT pre-tax trading income $138M as of 9/30/2008
Lower pre-tax earnings from EMG’s Sycamore and Watson projects ($60M-$70M reduction)
Excluded from Guidance
Potential impact of IRS issues
CAIR allowances purchased by EMG
Discontinued operations
1 See Use of Non-GAAP Financial Measures in appendix. The expected impact of participating securities is $(0.05) per share for 2008 guidance and is included in EIX parent company and other. GAAP earnings per share refers to basic earnings per share.
November 7, 2008 7 EDISON INTERNATIONAL®
Leading the Way in Electricity SM
Southern California Edison (SCE)
November 7, 2008 8 EDISON INTERNATIONAL®
Leading the Way in Electricity SM
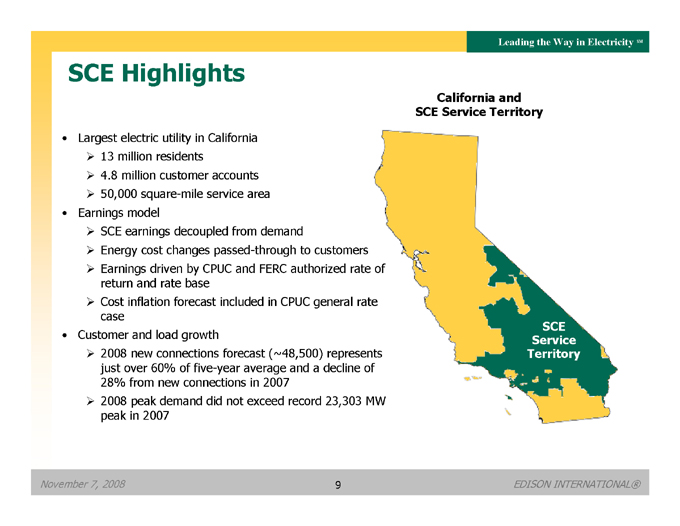
California and SCE Service Territory
SCE Service Territory
SCE Highlights
Largest electric utility in California
13 million residents
4.8 million customer accounts
50,000 square-mile service area
Earnings model
SCE earnings decoupled from demand
Energy cost changes passed-through to customers
Earnings driven by CPUC and FERC authorized rate of return and rate base
Cost inflation forecast included in CPUC general rate case
Customer and load growth
2008 new connections forecast (~48,500) represents just over 60% of five-year average and a decline of 28% from new connections in 2007 2008 peak demand did not exceed record 23,303 MW peak in 2007
November 7, 2008 9 EDISON INTERNATIONAL®

Leading the Way in Electricity SM
SCE Rate Base Forecast (2007-2012)1
$ Billions
$25 $20 $15 $10 $5 $0
2007 2008 2009 2010 2011 2012
$11.7 $12.7 $15.0 $18.0 $20.8 $23.2
Superior execution of capital expenditure program and continued regulatory support could nearly double SCE’s 2007 rate base by 2012
1 Forecast is as of October 2008 and includes impact of 2006 CPUC and FERC GRC decisions, forecasted rate base for FERC (2007-2012) and CPUC (2009-2012) which are subject to timely receipt of permitting, licensing and regulatory approvals and are based in part on March 2008 construction forecasts. Forecast includes estimated impacts of the November 15, 2007 FERC incentives decision allowing construction work-in-progress (CWIP) recovery in rate base and updated estimates for benefits of accelerated depreciation based upon the Economic Stimulus Act of 2008, and timing of forecasted project completions. The forecast includes $692 million of capital spending for DPV2, the majority of which is forecast to occur in 2009 and 2010. The Arizona Corporation Commission (ACC) denied approval of the DPV2 project which has resulted in a minimum two-year delay of the project and could be delayed further. SCE has initiated pre-filing activities with the FERC and is continuing to work with the ACC on acceptable alternatives. Rate base forecast includes update for September 4, 2008 GRC update filing which could be affected by changes in capital spending and other operating and decision related impacts associated with final 2009-2011 general rate case decision.
November 7, 2008 10 EDISON INTERNATIONAL®

Leading the Way in Electricity SM
SCE Capital Investment Forecast
$19.9 Billion Over 5 Years
$ Billions $5 $4 $3 $2 $1 $0
2008 2009 2010 2011 2012
$2.9 $4.1 $4.5 $4.6 $3.8
By Classification
$ %
Solar Rooftop Program 0.85 4
Edison SmartConnect™ 1.25 6
Generation 2.50 13
Transmission 5.50 28
Distribution 9.80 49
Total1 19.90 100
By Proceeding Type
%
2009-2011 CPUC Rate Case 39
Other Year CPUC Rate Cases 20
CPUC Project Specific 13
FERC Rate Cases 28
Total1 100
In 2008 SCE anticipates regulatory approval on a substantial portion of its capital spending program
1 Subject to timely receipt of permitting, licensing and regulatory approvals. Forecast as of March 2008 and includes $692 million of capital spending for DPV2, the majority of which is forecast to occur in 2009 and 2010. The Arizona Corporation Commission (ACC) denied approval of the DPV2 project, resulting in a minimum two-year delay and could be delayed further. SCE initiated pre-filing activities with the FERC and continues to work with the ACC on acceptable alternatives. Construction forecasts could be affected by changes in capital spending associated with the final 2009-2011 general rate case decision.
November 7, 2008 11 EDISON INTERNATIONAL®

Leading the Way in Electricity SM
Constructive Regulatory Environment
What’s Changed Since the Power Crisis
Advance approval of annual procurement plans for purchased power
Trigger mechanism for fuel and purchased power cost recovery
Forward-looking rate-making includes expected cost inflation
State support for reliable electric system infrastructure
Multi-year cost of capital program
Benefits to Customers and Investors
Upfront review of utility purchasing decisions through a defined procurement plan
Better matching of revenues and cash expenditures for fuel and purchased power costs with predetermined trigger mechanisms for recovering higher costs
Three-year process based on forecast expenses, capital spending and asset base increases between rate cases
Regulatory decisions address emerging issues (such as adding peaking capacity for 2007 summer season) and opportunities (new energy efficiency program and incentives for utility renewable energy investment)
Provides three-year certainty on cost of capital and return on equity, with annual adjustment in approved long-term debt interest rates and trigger mechanism to prospectively adjust return on equity beyond certain trigger points
November 7, 2008 12 EDISON INTERNATIONAL®
Leading the Way in Electricity SM
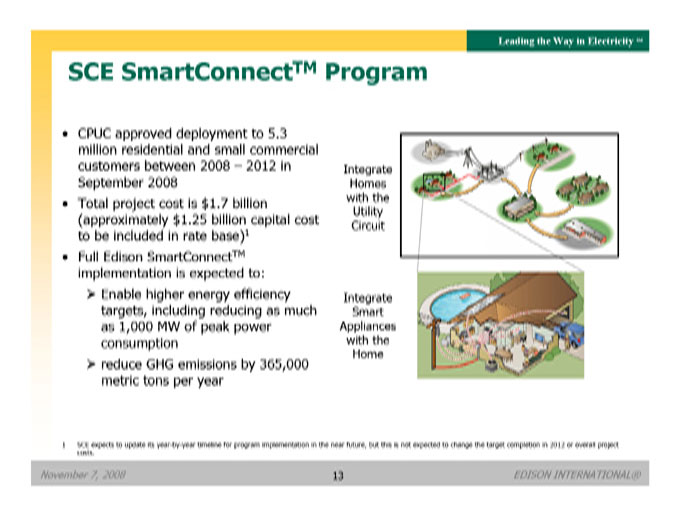
SCE SmartConnectTM Program
CPUC approved deployment to 5.3 million residential and small commercial customers between 2008 – 2012 in September 2008
Total project cost is $1.7 billion (approximately $1.25 billion capital cost to be included in rate base)1
Full Edison SmartConnectTM implementation is expected to:
Enable higher energy efficiency targets, including reducing as much as 1,000 MW of peak power consumption
reduce GHG emissions by 365,000 metric tons per year
Integrate Homes with the Utility Circuit
Integrate Smart Appliances with the Home
1 SCE expects to update its year-by-year timeline for program implementation in the near future, but this is not expected to change the target completion in 2012 or overall project costs.
November 7, 2008 13 EDISON INTERNATIONAL®
Leading the Way in Electricity SM
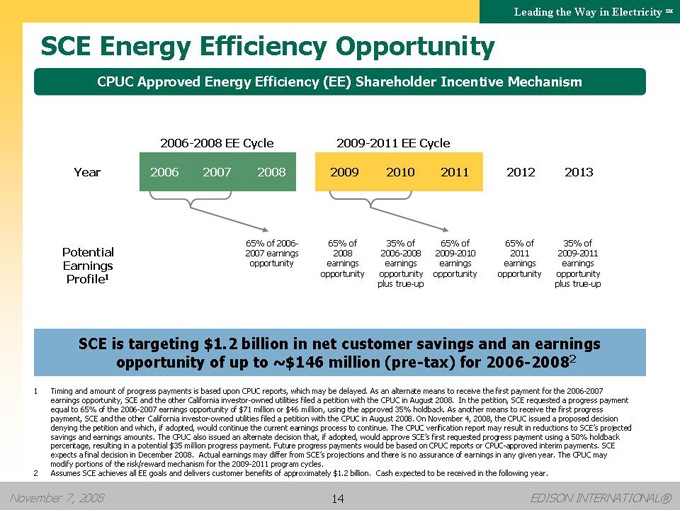
SCE Energy Efficiency Opportunity
CPUC Approved Energy Efficiency (EE) Shareholder Incentive Mechanism
Year
Potential Earnings Profile1
2006-2008 EE Cycle
2006 2007 2008
2009-2011 EE Cycle
2009 2010 2011 2012 2013
| | | | | | | | | | |
65% of 2006-2007 earnings opportunity | | 65% of 2008 earnings opportunity | | 35% of 2006-2008 earnings opportunity plus true-up | | 65% of 2009-2010 earnings opportunity | | 65% of 2011 earnings opportunity | | 35% of 2009-2011 earnings opportunity plus true-up |
SCE is targeting $1.2 billion in net customer savings and an earnings opportunity of up to ~$146 million (pre-tax) for 2006-20082
1 Timing and amount of progress payments is based upon CPUC reports, which may be delayed. As an alternate means to receive the first payment for the 2006-2007 earnings opportunity, SCE and the other California investor-owned utilities filed a petition with the CPUC in August 2008. In the petition, SCE requested a progress payment equal to 65% of the 2006-2007 earnings opportunity of $71 million or $46 million, using the approved 35% holdback. On November 4, 2008, the CPUC issued a proposed decision denying the petition and which, if adopted, would continue the current earnings process to continue. The CPUC verification report may result in reductions to SCE’s projected savings and earnings amounts. The CPUC also issued an alternate decision that, if adopted, would approve SCE’s first requested progress payment using a 50% holdback percentage, resulting in a potential $35 million progress payment. Future progress payments would be based on CPUC reports or CPUC-approved interim payments. SCE expects a final decision in December 2008. Actual earnings may differ from SCE’s projections and there is no assurance of earnings in any given year. The CPUC may modify portions of the risk/reward mechanism for the 2009-2011 program cycles.
2 Assumes SCE achieves all EE goals and delivers customer benefits of approximately $1.2 billion. Cash expected to be received in the following year.
November 7, 2008 14 EDISON INTERNATIONAL®

Leading the Way in Electricity SM
SCE Solar Rooftop Program
Install 250 MW of thin-film solar photovoltaic (PV) generation on commercial rooftops
1-2 MW average project size
$875 million capital spending program
Subject to CPUC approval – decision scheduled March 2009
First 2 MW projected completed in Fontana in September 2008 through First Solar contract
Up to 3 MW of additional projects planned over next six months
CPUC granted authority in September 2008 to track up to $25 million of project costs incurred during regulatory review process to facilitate 2008 program launch – recovery subject to final CPUC approval
SCE’s proposed rooftop solar program will help advance California public policy and help build scale for the large rooftop photovoltaic solar market
1 | | Direct capital forecast for 2008-2013 in 2008 dollars. |
November 7, 2008 15 EDISON INTERNATIONAL®
Leading the Way in Electricity SM
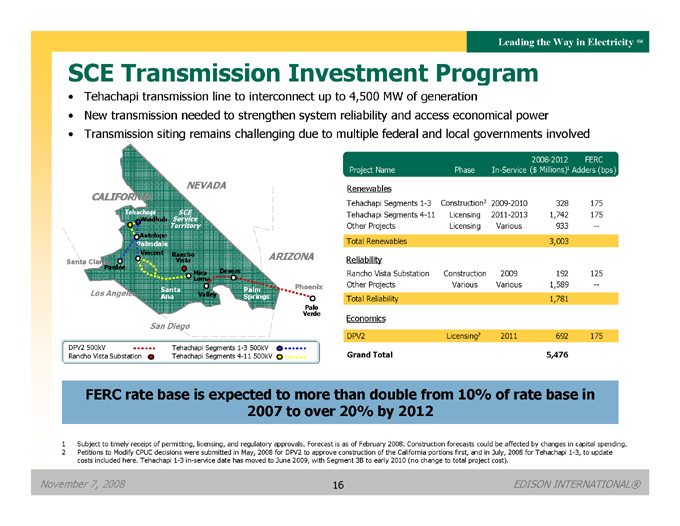
SCE Transmission Investment Program
Tehachapi transmission line to interconnect up to 4,500 MW of generation
New transmission needed to strengthen system reliability and access economical power
Transmission siting remains challenging due to multiple federal and local governments involved
Project Name Phase In-Service 2008-2012 ($ Millions)1 FERC Adders (bps)
Renewables
Tehachapi Segments 1-3 Construction2 2009-2010 328 175
Tehachapi Segments 4-11 Licensing 2011-2013 1,742 175
Other Projects Licensing Various 933 –
Total Renewables 3,003
Reliability
Rancho Vista Substation Construction 2009 192 125
Other Projects Various Various 1,589 –
Total Reliability 1,781
Economics
DPV2 Licensing2 2011 692 175
Grand Total 5,476
FERC rate base is expected to more than double from 10% of rate base in 2007 to over 20% by 2012
1 Subject to timely receipt of permitting, licensing, and regulatory approvals. Forecast is as of February 2008. Construction forecasts could be affected by changes in capital spending.
2 Petitions to Modify CPUC decisions were submitted in May, 2008 for DPV2 to approve construction of the California portions first, and in July, 2008 for Tehachapi 1-3, to update costs included here. Tehachapi 1-3 in-service date has moved to June 2009, with Segment 3B to early 2010 (no change to total project cost).
NEVADA
ARIZONA
CALIFORNIA
San Diego
Service SCE Territory
Verde Palo
San Diego
PalmSprings
DPV2 500kV
Tehachapi Segments 1-3 500kV
Rancho Vista Substation
Tehachapi Segments 4-11 500kV
November 7, 2008 16 EDISON INTERNATIONAL®
Leading the Way in Electricity SM
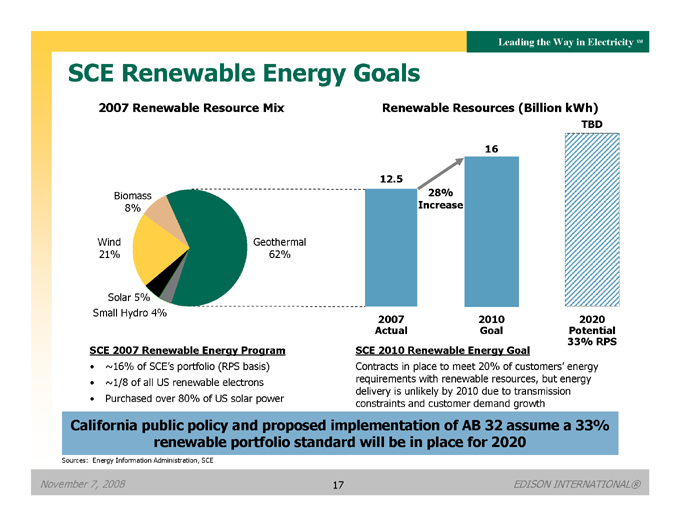
SCE Renewable Energy Goals
2007 Renewable Resource Mix
Renewable Resources (Billion kWh)
12.5 16 TBD
28% Increase
Biomass 8%
Geothermal 62%
Wind 21%
Solar 5% Small Hydro 4%
2007 Actual 2010 Goal
2020 Potential 33% RPS
SCE 2007 Renewable Energy Program
~16% of SCE’s portfolio (RPS basis)
~1/8 of all US renewable electrons
Purchased over 80% of US solar power
SCE 2010 Renewable Energy Goal
Contracts in place to meet 20% of customers’ energy requirements with renewable resources, but energy delivery is unlikely by 2010 due to transmission constraints and customer demand growth
California public policy and proposed implementation of AB 32 assume a 33% renewable portfolio standard will be in place for 2020
Sources: Energy Information Administration, SCE
November 7, 2008 17 EDISON INTERNATIONAL®
Leading the Way in Electricity SM
Edison Mission Group (EMG)
November 7, 2008 18 EDISON INTERNATIONAL®
Leading the Way in Electricity SM
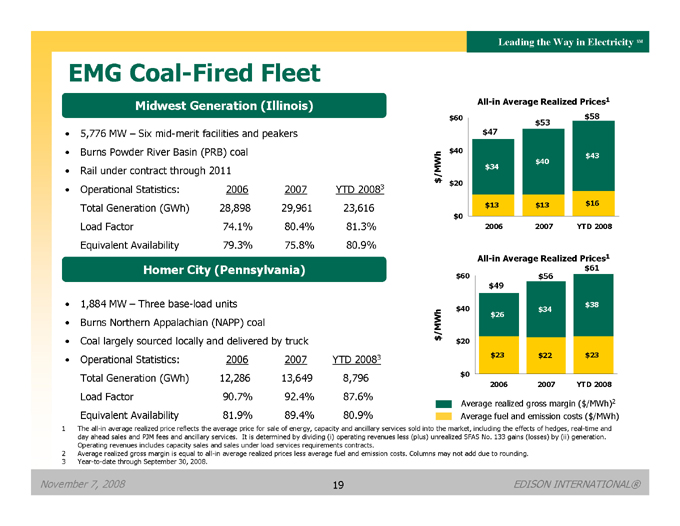
EMG Coal-Fired Fleet
Midwest Generation (Illinois)
5,776 MW – Six mid-merit facilities and peakers
Burns Powder River Basin (PRB) coal
Rail under contract through 2011
Operational Statistics: 2006 2007 YTD 20083
Total Generation (GWh) 28,898 29,961 23,616
Load Factor 74.1% 80.4% 81.3%
Equivalent Availability 79.3% 75.8% 80.9%
Homer City (Pennsylvania)
1,884 MW – Three base-load units
Burns Northern Appalachian (NAPP) coal
Coal largely sourced locally and delivered by truck
Operational Statistics: 2006 2007 YTD 20083
Total Generation (GWh) 12,286 13,649 8,796
Load Factor 90.7% 92.4% 87.6%
Equivalent Availability 81.9% 89.4% 80.9%
All-in Average Realized Prices1
$60 $40 $20 $0
$47 $34 $13
$53 $40 $13
$58 $43 $16
2006 2007 YTD 2008
All-in Average Realized Prices1
$49 $26 $23
$56 $34 $22
$61 $38 $23
$60 $40 $20 $0
2006 2007 YTD 2008
Average realized gross margin ($/MWh)2
Average fuel and emission costs ($/MWh)
1 The all-in average realized price reflects the average price for sale of energy, capacity and ancillary services sold into the market, including the effects of hedges, real-time and day ahead sales and PJM fees and ancillary services. It is determined by dividing (i) operating revenues less (plus) unrealized SFAS No. 133 gains (losses) by (ii) generation. Operating revenues includes capacity sales and sales under load services requirements contracts.
2 Average realized gross margin is equal to all-in average realized prices less average fuel and emission costs. Columns may not add due to rounding.
3 | | Year-to-date through September 30, 2008. |
November 7, 2008 19 EDISON INTERNATIONAL®
Leading the Way in Electricity SM
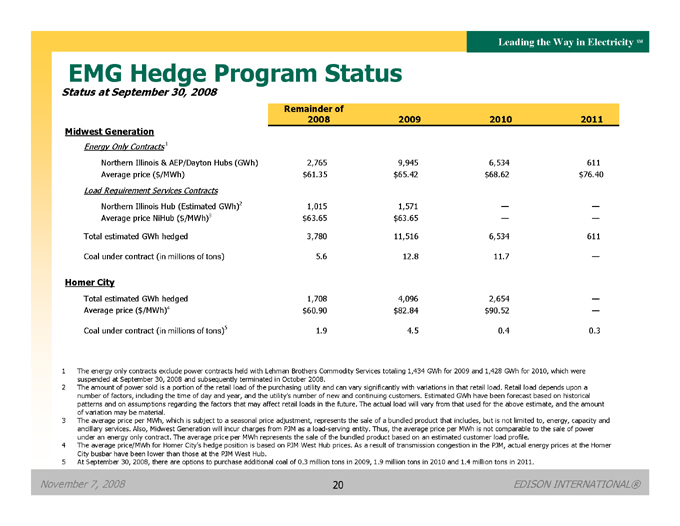
EMG Hedge Program Status
Status at September 30, 2008
Remainder of 2008 2009 2010 2011
Midwest Generation
Energy Only Contracts 1
Northern Illinois & AEP/Dayton Hubs (GWh) 2,765 9,945 6,534 611
Average price ($/MWh) $61.35 $65.42 $68.62 $76.40
Load Requirement Services Contracts
Northern Illinois Hub (Estimated GWh)2 1,015 1,571 — —
Average price NiHub ($/MWh)3 $63.65 $63.65 — —
Total estimated GWh hedged 3,780 11,516 6,534 611
Coal under contract (in millions of tons) 5.6 12.8 11.7 —
Homer City
Total estimated GWh hedged 1,708 4,096 2,654 —
Average price ($/MWh)4 $60.90 $82.84 $90.52 —
Coal under contract (in millions of tons)5 1.9 4.5 0.4 0.3
1 The energy only contracts exclude power contracts held with Lehman Brothers Commodity Services totaling 1,434 GWh for 2009 and 1,428 GWh for 2010, which were suspended at September 30, 2008 and subsequently terminated in October 2008.
2 The amount of power sold is a portion of the retail load of the purchasing utility and can vary significantly with variations in that retail load. Retail load depends upon a number of factors, including the time of day and year, and the utility’s number of new and continuing customers. Estimated GWh have been forecast based on historical patterns and on assumptions regarding the factors that may affect retail loads in the future. The actual load will vary from that used for the above estimate, and the amount of variation may be material.
3 The average price per MWh, which is subject to a seasonal price adjustment, represents the sale of a bundled product that includes, but is not limited to, energy, capacity and ancillary services. Also, Midwest Generation will incur charges from PJM as a load-serving entity. Thus, the average price per MWh is not comparable to the sale of power under an energy only contract. The average price per MWh represents the sale of the bundled product based on an estimated customer load profile.
4 The average price/MWh for Homer City’s hedge position is based on PJM West Hub prices. As a result of transmission congestion in the PJM, actual energy prices at the Homer City busbar have been lower than those at the PJM West Hub.
5 At September 30, 2008, there are options to purchase additional coal of 0.3 million tons in 2009, 1.9 million tons in 2010 and 1.4 million tons in 2011.
November 7, 2008 20 EDISON INTERNATIONAL®

November 7, 2008 21 EDISON INTERNATIONAL®
Leading the Way in Electricity SM
EMG Capacity Sales
Status at September 30, 2008
Oct 1, 2008 — May 31, 2009 Jun 1, 2009 — May 31, 2010 Jun 1, 2010 — May 31, 2011 Jun 1, 2011 — May 31, 2012
Megawatts except price per MW-day Midwest Generation Homer City Midwest Generation Homer City Midwest Generation Homer City Midwest Generation Homer City
Installed Capacity 5,776 1,884 5,776 1,884 5,477 1,884 5,477 1,884
Less: Net capacity held due to load
requirement services contracts,1
and retained for outages (1,918) (159) (447) (214) (548) (71) (895) (113)
Net Capacity Available for Sale 3,858 1,725 5,329 1,670 4,929 1,813 4,582 1,771
Fixed Price Capacity Sales
RPM Auction Process
• Net Capacity Sold2 2,954 820 4,614 1,670 4,929 1,813 4,582 1,771
• Price per MW-day2 $122.42 $111.92 $102.04 $191.32 $174.29 $174.29 $110.00 $110.00
Non-unit Specific Capacity Sales
• Net Capacity Sold 880 — 715 — — — — —
• Price per MW-day (Net) $64.35 $ — $71.46 $ — $ — $ — $ — $ —
Variable Capacity Sales
Third Party Transaction
• Capacity — 905 — — — — — —
• Expected price per MW-day3 $ — $62.22 $ — $ — $ — $ — $ — $ —
Total Capacity Sold 3,834 1,725 5,329 1,670 4,929 1,813 4,582 1,771
Average Price per MW-Day $109.09 $85.85 $97.94 $191.32 $174.29 $174.29 $110.00 $110.00
1 | | Load requirements services contracts include energy, capacity and ancillary services. |
2 The original price of $111.92 was affected by Midwest Generation’s participation in a supplemental RPM auction during the first quarter of 2008, which resulted in purchasing certain capacity amounts at a price of $10 per MW-day, thereby reducing the aggregate forward capacity sales for this period and increasing the effective capacity price to $122.42.
3 Actual contract price is a function of NYISO capacity auction clearing prices for October 2008 and forward over-the-counter NYISO capacity prices on September 30, 2008 for November 2008 through May 2009.
November 7, 2008 22 EDISON INTERNATIONAL®
Leading the Way in Electricity SM
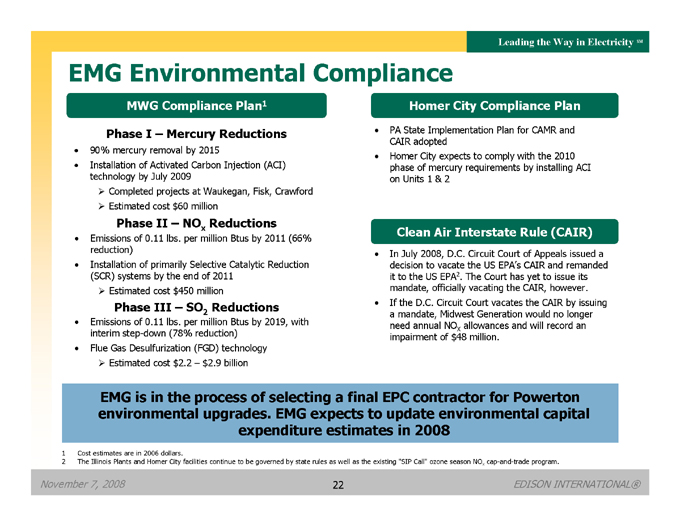
EMG Environmental Compliance
MWG Compliance Plan1
Phase I – Mercury Reductions
90% mercury removal by 2015
Installation of Activated Carbon Injection (ACI) technology by July 2009
Completed projects at Waukegan, Fisk, Crawford
Estimated cost $60 million
Phase II – NOx Reductions
Emissions of 0.11 lbs. per million Btus by 2011 (66% reduction)
Installation of primarily Selective Catalytic Reduction (SCR) systems by the end of 2011
?Estimated cost $450 million
Phase III – SO2 Reductions
Emissions of 0.11 lbs. per million Btus by 2019, with interim step-down (78% reduction)
Flue Gas Desulfurization (FGD) technology
?Estimated cost $2.2 – $2.9 billion
Homer City Compliance Plan
PA State Implementation Plan for CAMR and CAIR adopted Homer City expects to comply with the 2010 phase of mercury requirements by installing ACI on Units 1 & 2
Clean Air Interstate Rule (CAIR)
In July 2008, D.C. Circuit Court of Appeals issued a decision to vacate the US EPA’s CAIR and remanded it to the US EPA2. The Court has yet to issue its mandate, officially vacating the CAIR, however. If the D.C. Circuit Court vacates the CAIR by issuing a mandate, Midwest Generation would no longer need annual NOX allowances and will record an impairment of $48 million.
EMG is in the process of selecting a final EPC contractor for Powerton environmental upgrades. EMG expects to update environmental capital expenditure estimates in 2008
1 | | Cost estimates are in 2006 dollars. |
2 The Illinois Plants and Homer City facilities continue to be governed by state rules as well as the existing “SIP Call” ozone season NOx cap-and-trade program.

Leading the Way in Electricity SM
Edison Mission Marketing & Trading (EMMT)
Markets energy and capacity of merchant generation fleet
Hedges key power-related risks such as forward electricity prices
?
Typically a rolling 24 to 36 month hedging program
?
Target hedge-neutral position for prompt year with lesser percentages hedged in the out years
Trades a proprietary book in markets where it is active in merchant generation
?Primarily transmission-related transactions
?Largely in eastern markets
Enters into load service requirements contracts with local utilities and hedges related to energy price risk
Controls on types and sizes of exposures
?VaR; EaR; stress and scenario testing; volumetric, duration, and credit limits
EMMT Trading Margin (pre-tax)1
$ Millions
$250 $200 $150 $100 $50 $0
2003 2004 2005 2006 2007 YTD Sept.
2008
$34
$23
$195
$130
$143 $138
1 Income from energy trading represents gains recognized from trade price changes. The overhead cost of energy trading is excluded.
November 7, 2008 23 EDISON INTERNATIONAL®
Leading the Way in Electricity SM
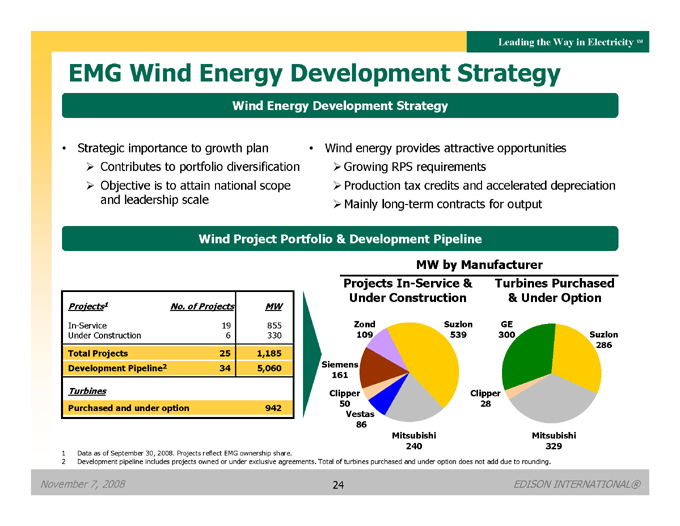
EMG Wind Energy Development Strategy
Wind Energy Development Strategy
Strategic importance to growth plan •
Wind energy provides attractive opportunities
??Contributes to portfolio diversification ?
Growing RPS requirements
??Objective is to attain national scope ?
Production tax credits and accelerated depreciation and leadership scale ?
Mainly long-term contracts for output
Wind Project Portfolio & Development Pipeline
MW by Manufacturer
Projects In-Service & Turbines Purchased Under Construction & Under Option
Projects1 No. of Projects MW
In-Service 19 855
Under Construction 6 330
Total Projects 25 1,185
Development Pipeline2 34 5,060
Turbines
Purchased and under option 942
Zond 109
Siemens 161
Clipper 50 Vestas 86
Mitsubishi 240
Suzlon 539
GE 300
Clipper 28
Suzlon 286
Mitsubishi 329
1 | | Data as of September 30, 2008. Projects reflect EMG ownership share. |
2 Development pipeline includes projects owned or under exclusive agreements. Total of turbines purchased and under option does not add due to rounding.
November 7, 2008 24 EDISON INTERNATIONAL®
Leading the Way in Electricity SM
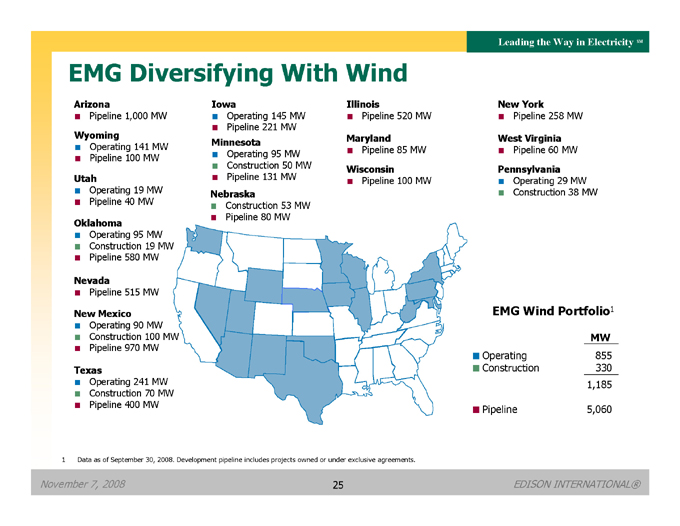
EMG Diversifying With Wind
Arizona
Pipeline 1,000 MW
Wyoming
Operating 141 MW
Pipeline 100 MW
Utah
Operating 19 MW
Pipeline 40 MW
Oklahoma
Operating 95 MW
Construction 19 MW
Pipeline 580 MW
Nevada
Pipeline 515 MW
New Mexico
Operating 90 MW
Construction 100 MW
Pipeline 970 MW
Texas
Operating 241 MW
Construction 70 MW
Pipeline 400 MW
Iowa
Operating 145 MW
Pipeline 221 MW
Minnesota
Operating 95 MW
Construction 50 MW
Pipeline 131 MW
Nebraska
Construction 53 MW
Pipeline 80 MW
Illinois
Pipeline 520 MW
Maryland
Pipeline 85 MW
Wisconsin
Pipeline 100 MW
New York
Pipeline 258 MW
West Virginia
Pipeline 60 MW
Pennsylvania
Operating 29 MW
Construction 38 MW
EMG Wind Portfolio1
MW
Operating 855
Construction 330
1,185
Pipeline 5,060
1 | | Data as of September 30, 2008. Development pipeline includes projects owned or under exclusive agreements. |
November 7, 2008 25 EDISON INTERNATIONAL®
November 7, 2008 26 EDISON INTERNATIONAL®
Leading the Way in Electricity SM
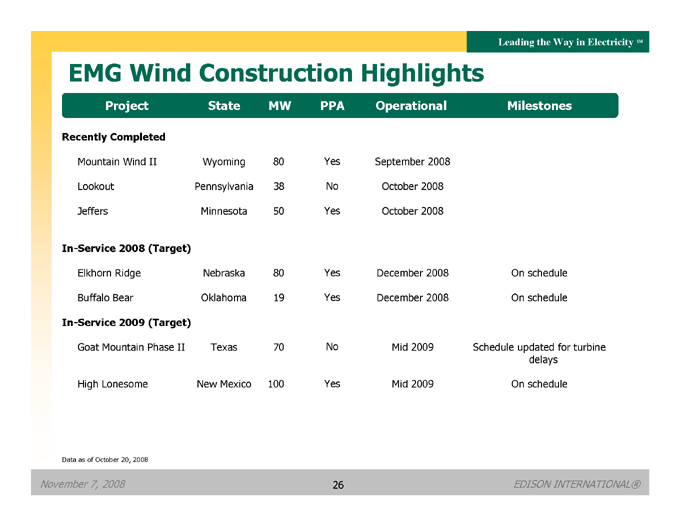
EMG Wind Construction Highlights
Project State MW PPA Operational Milestones
Recently Completed
Mountain Wind II Wyoming 80 Yes September 2008
Lookout Pennsylvania 38 No October 2008
Jeffers Minnesota 50 Yes October 2008
In-Service 2008 (Target)
Elkhorn Ridge Nebraska 80 Yes December 2008 On schedule
Buffalo Bear Oklahoma 19 Yes December 2008 On schedule
In-Service 2009 (Target)
Goat Mountain Phase II Texas 70 No Mid 2009 Schedule updated for turbine
delays
High Lonesome New Mexico 100 Yes Mid 2009 On schedule
Data as of October 20, 2008
November 7, 2008 27 EDISON INTERNATIONAL®
Leading the Way in Electricity SM
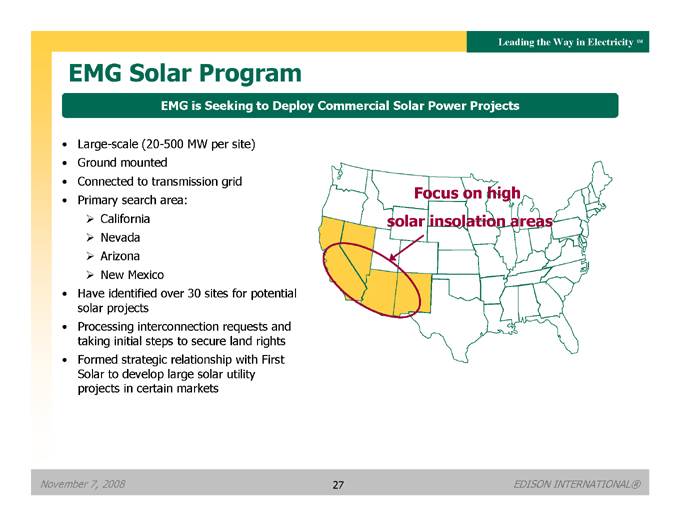
EMG Solar Program
EMG is Seeking to Deploy Commercial Solar Power Projects
Large-scale (20-500 MW per site) Ground mounted Connected to transmission grid Primary search area:
??California
??Nevada
??Arizona
??New Mexico
Have identified over 30 sites for potential solar projects Processing interconnection requests and taking initial steps to secure land rights Formed strategic relationship with First Solar to develop large solar utility projects in certain markets
Focus on high solar insolation areas
Leading the Way in Electricity SM
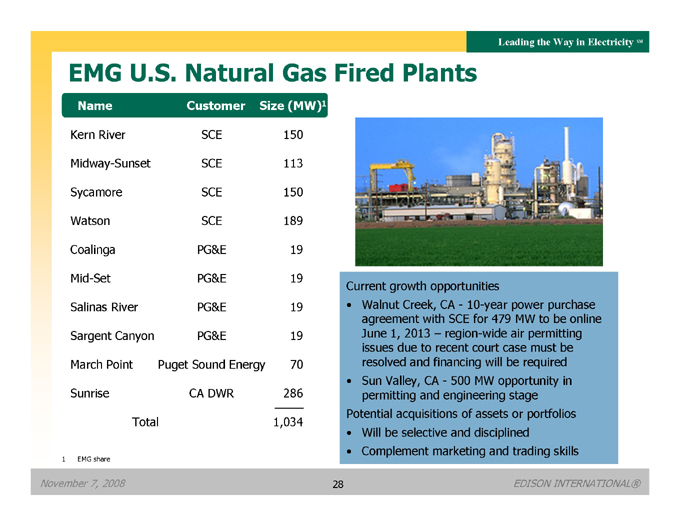
EMG U.S. Natural Gas Fired Plants
| | | | |
Name | | Customer | | Size (MW)1 |
Kern River | | SCE | | 150 |
Midway-Sunset | | SCE | | 113 |
Sycamore | | SCE | | 150 |
Watson | | SCE | | 189 |
Coalinga | | PG&E | | 19 |
Mid-Set | | PG&E | | 19 |
Salinas River | | PG&E | | 19 |
Sargent Canyon | | PG&E | | 19 |
March Point | | Puget Sound Energy | | 70 |
Sunrise | | CA DWR | | 286 |
Total | | | | 1,034 |
1 EMG share
November 7, 2008
Current growth opportunities
Walnut Creek, CA - 10-year power purchase agreement with SCE for 479 MW to be online June 1, 2013 – region-wide air permitting issues due to recent court case must be resolved and financing will be required
Sun Valley, CA - 500 MW opportunity in permitting and engineering stage Potential acquisitions of assets or portfolios
Will be selective and disciplined
Complement marketing and trading skills
28
Leading the Way in Electricity SM
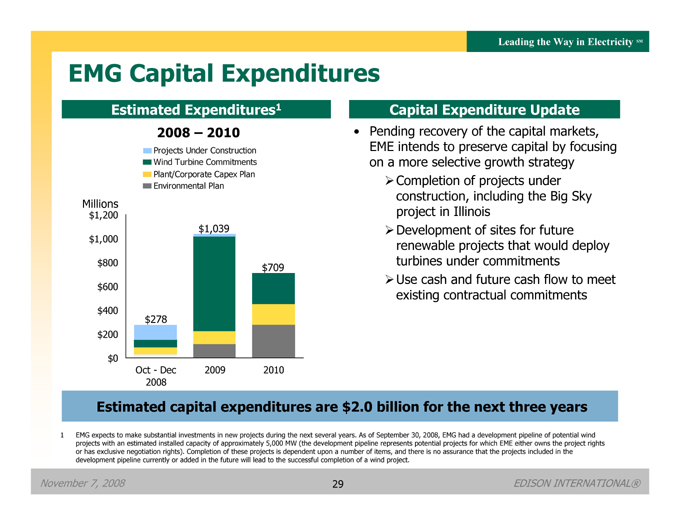
EMG Capital Expenditures
Estimated Expenditures1
2008 – 2010
Projects Under Construction Wind Turbine Commitments Plant/Corporate Capex Plan Environmental Plan
Millions $1,200
$1,000 $800 $600 $400 $200 $0
$1,039
$709
$278
Oct - Dec 2009 2010 2008
Capital Expenditure Update
Pending recovery of the capital markets, EME intends to preserve capital by focusing on a more selective growth strategy
Completion of projects under construction, including the Big Sky project in Illinois
Development of sites for future renewable projects that would deploy turbines under commitments
Use cash and future cash flow to meet existing contractual commitments
2008
Estimated capital expenditures are $2.0 billion for the next three years
1 EMG expects to make substantial investments in new projects during the next several years. As of September 30, 2008, EMG had a development pipeline of potential wind projects with an estimated installed capacity of approximately 5,000 MW (the development pipeline represents potential projects for which EME either owns the project rights or has exclusive negotiation rights). Completion of these projects is dependent upon a number of items, and there is no assurance that the projects included in the development pipeline currently or added in the future will lead to the successful completion of a wind project.
November 7, 2008 29 EDISON INTERNATIONAL®

November 7, 2008 30 EDISON INTERNATIONAL®
Leading the Way in Electricity SM
Our Shareholder Value Proposition
Attractive business portfolio and growth opportunities
Southern California Edison
?Among the best domestic electric utility growth platforms
?Demonstrated need for utility infrastructure investments
?Leadership in environmental and alternative energy programs (energy efficiency, renewable energy, advanced technologies)
Edison Mission Group
?Portfolio diversification strategy with strong growth pipeline led by renewable investments
Commitment to long-term shareholder value creation
Edison people committed to excellence in safety and customer service
November 7, 2008 31 EDISON INTERNATIONAL®
Leading the Way in Electricity SM
Appendix
November 7, 2008 32 EDISON INTERNATIONAL®
Leading the Way in Electricity SM
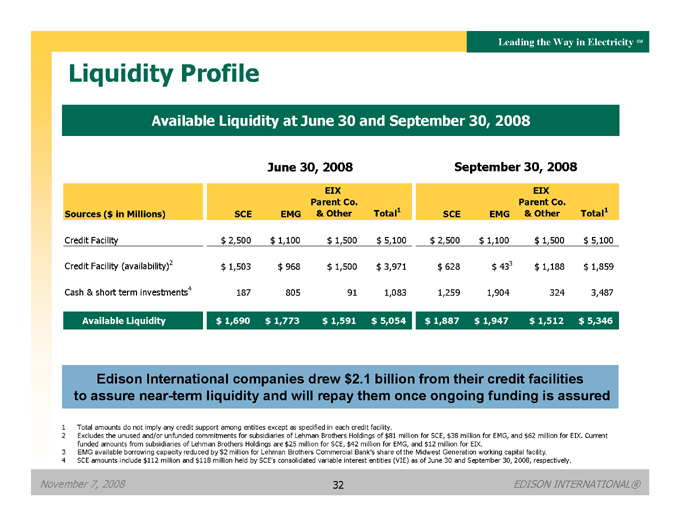
Liquidity Profile
Available Liquidity at June 30 and September 30, 2008
June 30, 2008 September 30, 2008
Sources ($ in Millions) SCE EMG EIX Parent Co. & Other Total1 SCE EMG EIX Parent Co. & Other Total1
Credit Facility $ 2,500 $1,100 $ 1,500 $ 5,100 $ 2,500 $1,100 $ 1,500 $5,100
Credit Facility (availability)2 $ 1,503 $ 968 $ 1,500 $ 3,971 $ 628 $ 433 $ 1,188 $1,859
Cash & short term investments4 187 805 91 1,083 1,259 1,904 324 3,487
Available Liquidity $ 1,690 $ 1,773 $ 1,591 $ 5,054 $ 1,887 $ 1,947 $ 1,512 $ 5,346
Edison International companies drew $2.1 billion from their credit facilities to assure near-term liquidity and will repay them once ongoing funding is assured
1 | | Total amounts do not imply any credit support among entities except as specified in each credit facility. |
2 Excludes the unused and/or unfunded commitments for subsidiaries of Lehman Brothers Holdings of $81 million for SCE, $38 million for EMG, and $62 million for EIX. Current funded amounts from subsidiaries of Lehman Brothers Holdings are $25 million for SCE, $42 million for EMG, and $12 million for EIX.
3 EMG available borrowing capacity reduced by $2 million for Lehman Brothers Commercial Bank’s share of the Midwest Generation working capital facility.
4 SCE amounts include $112 million and $118 million held by SCE’s consolidated variable interest entities (VIE) as of June 30 and September 30, 2008, respectively.
November 7, 2008 33 EDISON INTERNATIONAL®
Leading the Way in Electricity SM
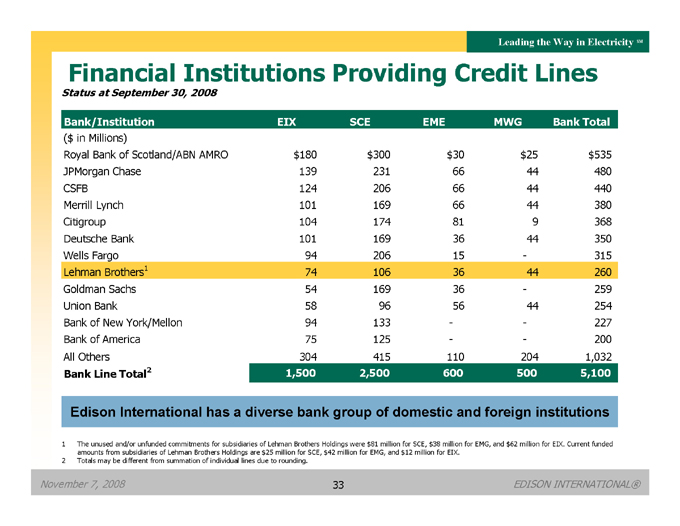
Financial Institutions Providing Credit Lines
Status at September 30, 2008
Bank/Institution EIX SCE EME MWG Bank Total
($ in Millions)
Royal Bank of Scotland/ABN AMRO $180 $300 $30 $25 $535
JPMorgan Chase 139 231 66 44 480
CSFB 124 206 66 44 440
Merrill Lynch 101 169 66 44 380
Citigroup 104 174 81 9 368
Deutsche Bank 101 169 36 44 350
Wells Fargo 94 206 15 — 315
Lehman Brothers1 74 106 36 44 260
Goldman Sachs 54 169 36 — 259
Union Bank 58 96 56 44 254
Bank of New York/Mellon 94 133 —— 227
Bank of America 75 125 —— 200
All Others 304 415 110 204 1,032
Bank Line Total2 1,500 2,500 600 500 5,100
Edison International has a diverse bank group of domestic and foreign institutions
1 The unused and/or unfunded commitments for subsidiaries of Lehman Brothers Holdings were $81 million for SCE, $38 million for EMG, and $62 million for EIX. Current funded amounts from subsidiaries of Lehman Brothers Holdings are $25 million for SCE, $42 million for EMG, and $12 million for EIX.
2 | | Totals may be different from summation of individual lines due to rounding. |
November 7, 2008 34 EDISON INTERNATIONAL®
Leading the Way in Electricity SM
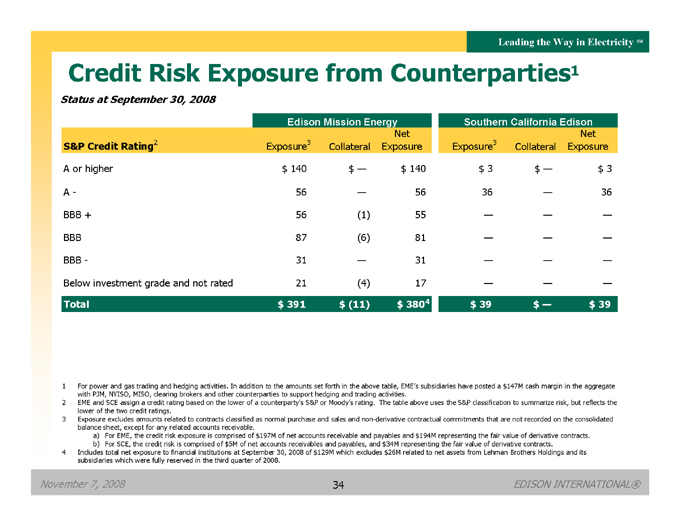
Credit Risk Exposure from Counterparties1
Status at September 30, 2008
Edison Mission Energy Southern California Edison
S&P Credit Rating2 Exposure3 Collateral Net Exposure Exposure3 Collateral Exposure Net
A or higher $ 140 $ — $ 140 $ 3 $ — $ 3
A— 56 — 56 36 — 36
BBB + 56 (1) 55 — — —
BBB 87 (6) 81 — — —
BBB— 31 — 31 — — —
Below investment grade and not rated 21 (4) 17 — — —
Total $ 391 $ (11) $ 3804 $ 39 $ — $ 39
1 For power and gas trading and hedging activities. In addition to the amounts set forth in the above table, EME’s subsidiaries have posted a $147M cash margin in the aggregate with PJM, NYISO, MISO, clearing brokers and other counterparties to support hedging and trading activities.
2 EME and SCE assign a credit rating based on the lower of a counterparty’s S&P or Moody’s rating. The table above uses the S&P classification to summarize risk, but reflects the lower of the two credit ratings.
3 Exposure excludes amounts related to contracts classified as normal purchase and sales and non-derivative contractual commitments that are not recorded on the consolidated balance sheet, except for any related accounts receivable. a) For EME, the credit risk exposure is comprised of $197M of net accounts receivable and payables and $194M representing the fair value of derivative contracts. b) For SCE, the credit risk is comprised of $5M of net accounts receivables and payables, and $34M representing the fair value of derivative contracts.
4 Includes total net exposure to financial institutions at September 30, 2008 of $129M which excludes $26M related to net assets from Lehman Brothers Holdings and its subsidiaries which were fully reserved in the third quarter of 2008.
November 7, 2008 35 EDISON INTERNATIONAL®
Leading the Way in Electricity SM
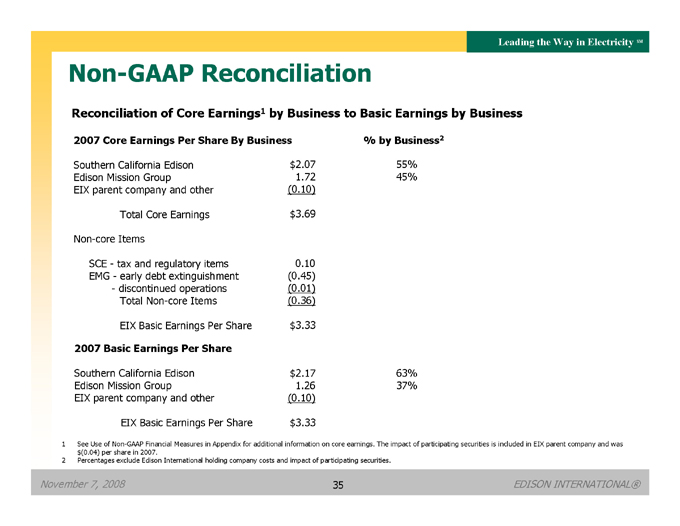
Non-GAAP Reconciliation
Reconciliation of Core Earnings1 by Business to Basic Earnings by Business
2007 Core Earnings Per Share By Business % by Business2
Southern California Edison $2.07 55%
Edison Mission Group 1.72 45%
EIX parent company and other (0.10)
Total Core Earnings $3.69
Non-core Items
SCE—tax and regulatory items 0.10
EMG—early debt extinguishment (0.45)
- discontinued operations (0.01)
Total Non-core Items (0.36)
EIX Basic Earnings Per Share $3.33
2007 Basic Earnings Per Share
Southern California Edison $2.17 63%
Edison Mission Group 1.26 37%
EIX parent company and other (0.10)
EIX Basic Earnings Per Share $3.33
1 See Use of Non-GAAP Financial Measures in Appendix for additional information on core earnings. The impact of participating securities is included in EIX parent company and was $(0.04) per share in 2007.
2 | | Percentages exclude Edison International holding company costs and impact of participating securities. |
[Graphic Appears Here]
Leading the Way in Electricity SM
Use of Non-GAAP Financial Measures
Edison International’s earnings are prepared in accordance with generally accepted accounting principles used in the United States and represent the company’s earnings as reported to the Securities and Exchange Commission. Our management uses core earnings and EPS by principal operating subsidiary internally for financial planning and for analysis of performance. We also use core earnings and EPS by principal operating subsidiary as primary performance measurements when communicating with analysts and investors regarding our earnings results and outlook, as it allows us to more accurately compare the company’s ongoing performance across periods. Core earnings exclude discontinued operations and other non-core items and are reconciled to basic earnings per common share.
EPS by principal operating subsidiary is based on the principal operating subsidiary net income and Edison International’s weighted average outstanding common shares. The impact of participating securities (vested stock options that earn dividend equivalents that may participate in undistributed earnings with common stock) for each principal operating subsidiary is not material to each principal operating subsidiary’s EPS and is therefore reflected in the results of the Edison International holding company, which we refer to as EIX parent company. EPS and core EPS by principal operating subsidiary are reconciled to basic earnings per common share.
EBITDA is defined as earnings before interest, income taxes, depreciation and amortization. Adjusted EBITDA includes production tax credits from EMG’s wind projects and excludes amounts from gain on the sale of assets, loss on early extinguishment of debt and leases, and impairment of assets and investments. Our management uses Adjusted EBITDA as an important financial measure for evaluating EMG.
A reconciliation of Non-GAAP information to GAAP information, including the impact of participating securities, is included either on the slide where the information appears or on another slide referenced in the presentation.