Exhibit 99.2
Leading the Way in Electricity SM
Exhibit 99.2
Fourth Quarter 2008 Financial Teleconference
March 2, 2008
EDISON INTERNATIONAL®
Leading the Way in Electricity SM
Forward-Looking Statements
Statements contained in this presentation about future performance, including, without limitation, earnings, asset and rate base growth, load growth, capital investments, and other statements that are not purely historical, are forward-looking statements. These forward-looking statements reflect our current expectations; however, such statements involve risks and uncertainties. Actual results could differ materially from current expectations. Important factors that could cause different results are discussed under the headings “Risk Factors” and “Management’s Discussion and Analysis” in Edison International’s 2008 Form 10-K and other reports filed with the Securities and Exchange Commission and are available on our website: www.edisoninvestor.com. These forward-looking statements represent our expectations only as of the date of this presentation, and Edison International assumes no duty to update them to reflect new information, events or circumstances.
1 |
| EDISON INTERNATIONAL® |
Leading the Way in Electricity SM
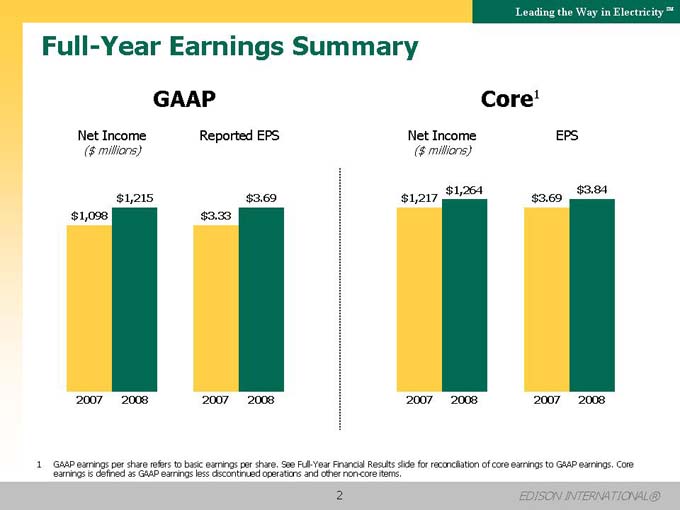
Full-Year Earnings Summary
GAAP
Net Income
($ millions)
Reported EPS
$1,215 $3.69 $1,098 $3.33
2007 2008 2007 2008
Core1
Net Income
($ millions)
EPS
$1,264 $3.84 $1,217 $3.69
2007 2008 2007 2008
1 GAAP earnings per share refers to basic earnings per share. See Full-Year Financial Results slide for reconciliation of core earnings to GAAP earnings. Core earnings is defined as GAAP earnings less discontinued operations and other non-core items.
2 |
| EDISON INTERNATIONAL® |
Leading the Way in Electricity SM
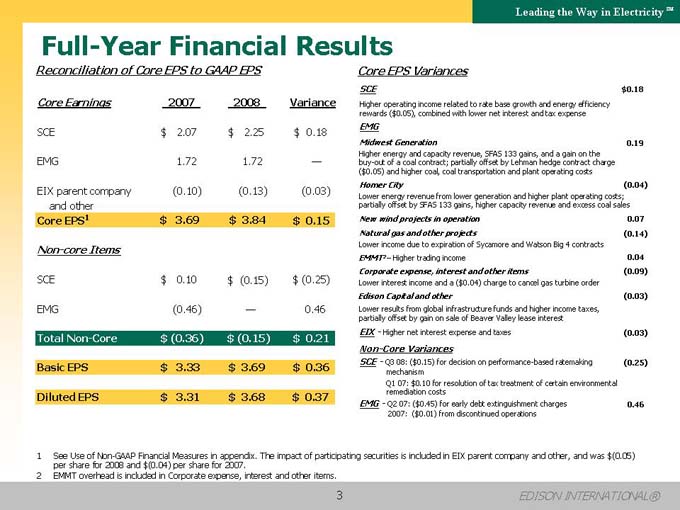
Full-Year Financial Results
Reconciliation of Core EPS to GAAP EPS
Core Earnings 2007 2008 Variance
SCE $ 2.07 $ 2.25 $ 0.18
EMG 1.72 1.72 —
EIX parent company (0.10) (0.13) (0.03) and other
Core EPS1 $ 3.69 $ 3.84 $ 0.15
Non-core Items
SCE $ 0.10 $ (0.15) $ (0.25)
EMG (0.46) — 0.46
Total Non-Core $ (0.36) $ (0.15) $ 0.21 Basic EPS $ 3.33 $ 3.69 $ 0.36 Diluted EPS $ 3.31 $ 3.68 $ 0.37
Core EPS Variances
SCE $0.18
Higher operating income related to rate base growth and energy efficiency rewards ($0.05), combined with lower net interest and tax expense
EMG
Midwest Generation 0.19
Higher energy and capacity revenue, SFAS 133 gains, and a gain on the buy-out of a coal contract; partially offset by Lehman hedge contract charge
($0.05) and higher coal, coal transportation and plant operating costs
Homer City (0.04)
Lower energy revenue from lower generation and higher plant operating costs; partially offset by SFAS 133 gains, higher capacity revenue and excess coal sales
New wind projects in operation 0.07 Natural gas and other projects (0.14)
Lower income due to expiration of Sycamore and Watson Big 4 contracts
EMMT2 – Higher trading income 0.04
Corporate expense, interest and other items (0.09)
Lower interest income and a ($0.04) charge to cancel gas turbine order
Edison Capital and other (0.03)
Lower results from global infrastructure funds and higher income taxes, partially offset by gain on sale of Beaver Valley lease interest
EIX—Higher net interest expense and taxes (0.03)
Non-Core Variances
SCE—Q3 08: ($0.15) for decision on performance-based ratemaking (0.25) mechanism Q1 07: $0.10 for resolution of tax treatment of certain environmental remediation costs EMG—Q2 07: ($0.45) for early debt extinguishment charges 0.46 2007: ($0.01) from discontinued operations
1 See Use of Non-GAAP Financial Measures in appendix. The impact of participating securities is included in EIX parent company and other, and was $(0.05) per share for 2008 and $(0.04) per share for 2007.
2 |
| EMMT overhead is included in Corporate expense, interest and other items. |
3 |
| EDISON INTERNATIONAL® |
Leading the Way in Electricity SM
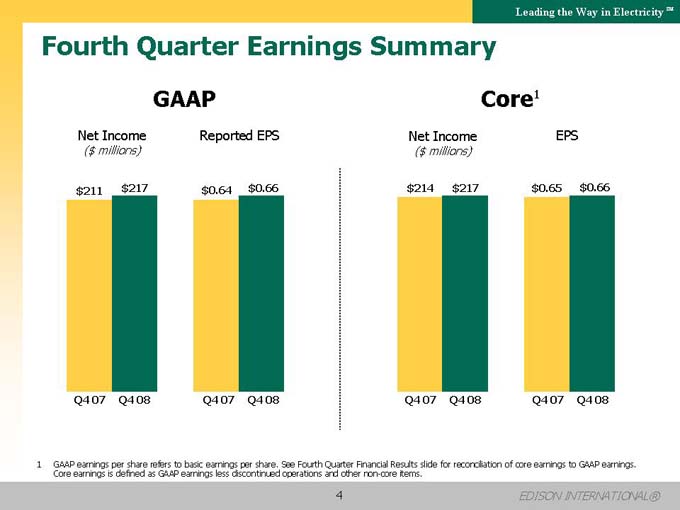
Fourth Quarter Earnings Summary
GAAP Core1
Net Income
($ millions)
Reported EPS
$211 $217 $0.64 $0.66
Q4 07 Q4 08 Q4 07 Q4 08
Net Income
($ millions)
EPS
$214 $217 $0.65 $0.66
Q4 07 Q4 08 Q4 07 Q4 08
1 GAAP earnings per share refers to basic earnings per share. See Fourth Quarter Financial Results slide for reconciliation of core earnings to GAAP earnings. Core earnings is defined as GAAP earnings less discontinued operations and other non-core items.
4 |
| EDISON INTERNATIONAL® |
Leading the Way in Electricity SM
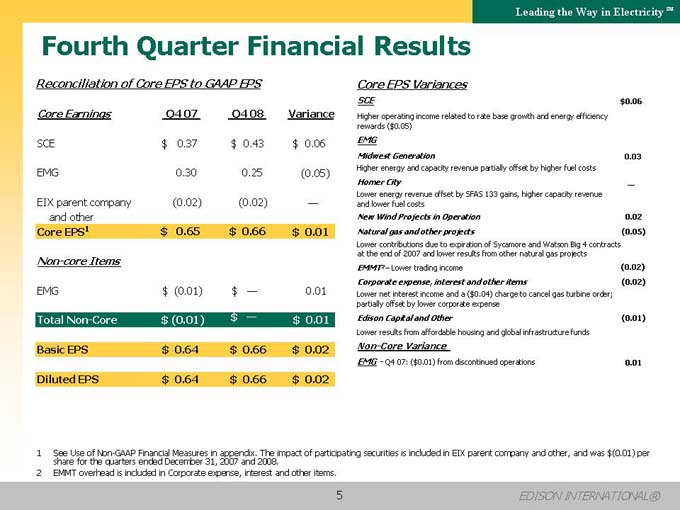
Fourth Quarter Financial Results
Reconciliation of Core EPS to GAAP EPS
Core Earnings Q4 07 Q4 08 Variance
SCE $ 0.37 $ 0.43 $ 0.06
EMG 0.30 0.25 (0.05)
EIX parent company (0.02) (0.02) —and other
Core EPS1 $ 0.65 $ 0.66 $ 0.01
Non-core Items
EMG $ (0.01) $ — 0.01
Total Non-Core $ (0.01) $ — $ 0.01 Basic EPS $ 0.64 $ 0.66 $ 0.02 Diluted EPS $ 0.64 $ 0.66 $ 0.02
Core EPS Variances
SCE $0.06
Higher operating income related to rate base growth and energy efficiency rewards ($0.05)
EMG
Midwest Generation 0.03
Higher energy and capacity revenue partially offset by higher fuel costs
Homer City —
Lower energy revenue offset by SFAS 133 gains, higher capacity revenue and lower fuel costs
New Wind Projects in Operation 0.02 Natural gas and other projects (0.05)
Lower contributions due to expiration of Sycamore and Watson Big 4 contracts at the end of 2007 and lower results from other natural gas projects EMMT2 – Lower trading income (0.02)
Corporate expense, interest and other items (0.02)
Lower net interest income and a ($0.04) charge to cancel gas turbine order; partially offset by lower corporate expense
Edison Capital and Other (0.01)
Lower results from affordable housing and global infrastructure funds
Non-Core Variance
EMG—Q4 07: ($0.01) from discontinued operations 0.01
1 See Use of Non-GAAP Financial Measures in appendix. The impact of participating securities is included in EIX parent company and other, and was $(0.01) per share for the quarters ended December 31, 2007 and 2008.
2 |
| EMMT overhead is included in Corporate expense, interest and other items. |
5 |
| EDISON INTERNATIONAL® |
Leading the Way in Electricity SM
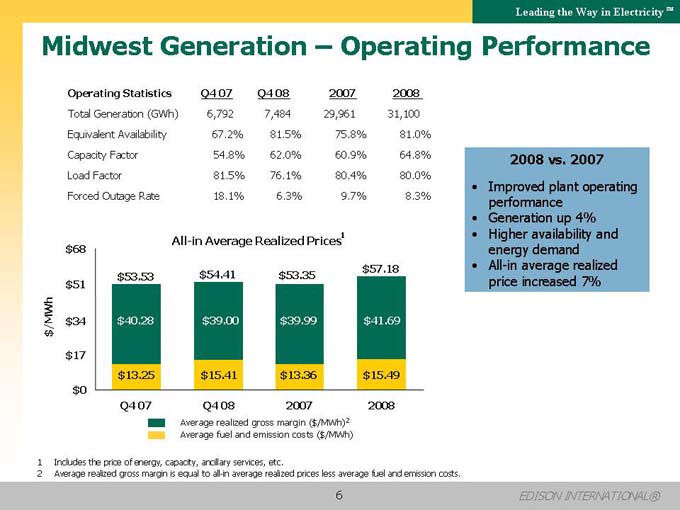
Midwest Generation – Operating Performance
Operating Statistics Q4 07 Q4 08 2007 2008
Total Generation (GWh) 6,792 7,484 29,961 31,100 Equivalent Availability 67.2% 81.5% 75.8% 81.0% Capacity Factor 54.8% 62.0% 60.9% 64.8% Load Factor 81.5% 76.1% 80.4% 80.0% Forced Outage Rate 18.1% 6.3% 9.7% 8.3%
All-in Average Realized Prices1 $68 $57.18 $53.53 $54.41 $53.35 $51
$34 $40.28 $39.00 $39.99 $41.69
$17 $13.25 $15.41 $13.36 $15.49 $0 Q4 07 Q4 08 2007 2008
Average realized gross margin ($/MWh)2 Average fuel and emission costs ($/MWh)
1 |
| Includes the price of energy, capacity, ancillary services, etc. |
2 |
| Average realized gross margin is equal to all-in average realized prices less average fuel and emission costs. |
2008 vs. 2007
• Improved plant operating performance
• Generation up 4%
• Higher availability and energy demand
• All-in average realized price increased 7%
6 |
| EDISON INTERNATIONAL® |
Leading the Way in Electricity SM
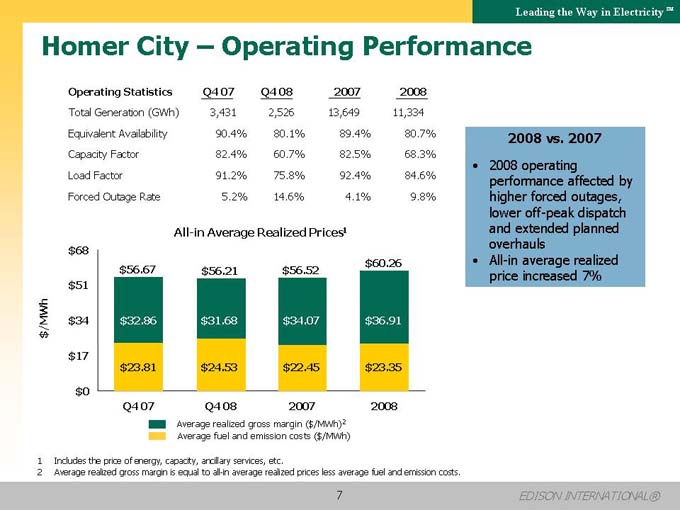
Homer City – Operating Performance
Operating Statistics Q4 07 Q4 08 2007 2008
Total Generation (GWh) 3,431 2,526 13,649 11,334 Equivalent Availability 90.4% 80.1% 89.4% 80.7% Capacity Factor 82.4% 60.7% 82.5% 68.3% Load Factor 91.2% 75.8% 92.4% 84.6% Forced Outage Rate 5.2% 14.6% 4.1% 9.8%
2008 vs. 2007
2008 operating performance affected by higher forced outages, lower off-peak dispatch and extended planned overhauls All-in average realized price increased 7%
All-in Average Realized Prices1 $68 $60.26 $56.67 $56.21 $56.52 $51
$34 $32.86 $31.68 $34.07 $36.91
$17 $23.81 $24.53 $22.45 $23.35
$0
Q4 07 Q4 08 2007 2008
Average realized gross margin ($/MWh)2 Average fuel and emission costs ($/MWh)
1 |
| Includes the price of energy, capacity, ancillary services, etc. |
2 |
| Average realized gross margin is equal to all-in average realized prices less average fuel and emission costs. |
7 |
| EDISON INTERNATIONAL® |
Leading the Way in Electricity SM
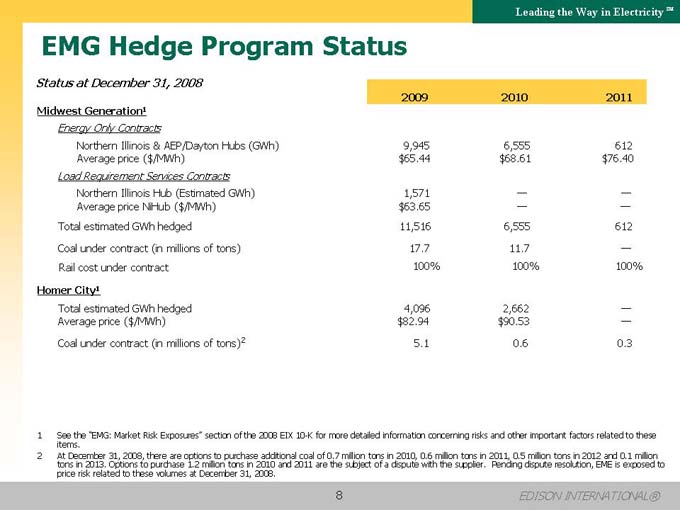
EMG Hedge Program Status
Status at December 31, 2008
2009 2010 2011 Midwest Generation1
Energy Only Contracts
Northern Illinois & AEP/Dayton Hubs (GWh) 9,945 6,555 612 Average price ($/MWh) $65.44 $68.61 $76.40
Load Requirement Services Contracts
Northern Illinois Hub (Estimated GWh) 1,571 — —Average price NiHub ($/MWh) $63.65 — —Total estimated GWh hedged 11,516 6,555 612 Coal under contract (in millions of tons) 17.7 11.7 —Rail cost under contract 100% 100% 100%
Homer City1
Total estimated GWh hedged 4,096 2,662 —Average price ($/MWh) $82.94 $90.53 —Coal under contract (in millions of tons) 2 5.1 0.6 0.3
1 See the “EMG: Market Risk Exposures” section of the 2008 EIX 10-K for more detailed information concerning risks and other important factors related to these items.
2 At December 31, 2008, there are options to purchase additional coal of 0.7 million tons in 2010, 0.6 million tons in 2011, 0.5 million tons in 2012 and 0.1 million tons in 2013. Options to purchase 1.2 million tons in 2010 and 2011 are the subject of a dispute with the supplier. Pending dispute resolution, EME is exposed to price risk related to these volumes at December 31, 2008.
8 |
| EDISON INTERNATIONAL® |

Leading the Way in Electricity SM
Appendix
9 EDISON INTERNATIONAL®
Leading the Way in Electricity SM
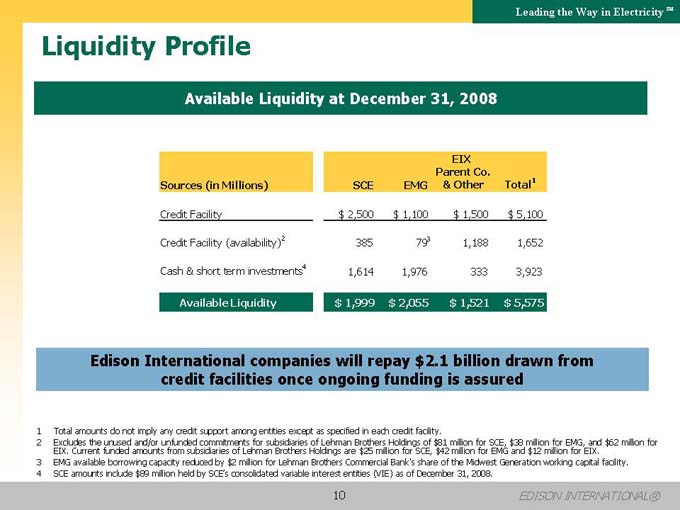
Liquidity Profile
Available Liquidity at December 31, 2008
EIX Parent Co.
Sources (in Millions) SCE EMG & Other Total1
Credit Facility $ 2,500 $ 1,100 $ 1,500 $ 5,100 Credit Facility (availability)2 385 793 1,188 1,652 Cash & short term investments4 1,614 1,976 333 3,923
Available Liquidity $ 1,999 $ 2,055 $ 1,521 $ 5,575
Edison International companies will repay $2.1 billion drawn from credit facilities once ongoing funding is assured
1 |
| Total amounts do not imply any credit support among entities except as specified in each credit facility. |
2 Excludes the unused and/or unfunded commitments for subsidiaries of Lehman Brothers Holdings of $81 million for SCE, $38 million for EMG, and $62 million for EIX. Current funded amounts from subsidiaries of Lehman Brothers Holdings are $25 million for SCE, $42 million for EMG and $12 million for EIX.
3 EMG available borrowing capacity reduced by $2 million for Lehman Brothers Commercial Bank’s share of the Midwest Generation working capital facility.
4 |
| SCE amounts include $89 million held by SCE’s consolidated variable interest entities (VIE) as of December 31, 2008. |
10 EDISON INTERNATIONAL®
Leading the Way in Electricity SM
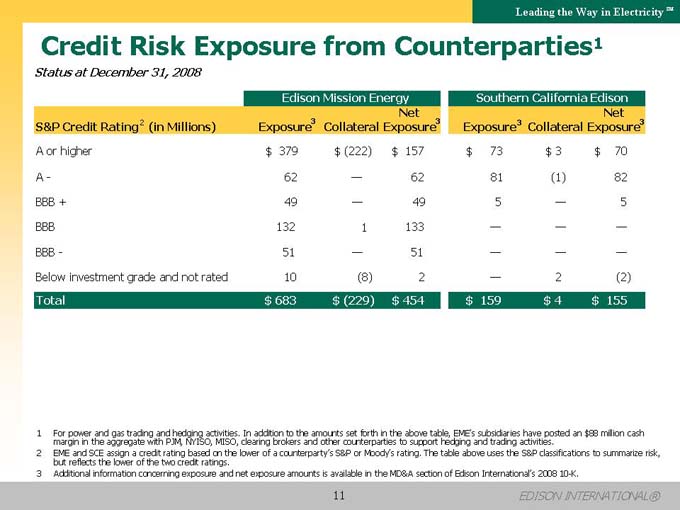
Credit Risk Exposure from Counterparties1
Status at December 31, 2008
Edison Mission Energy Southern California Edison
3 |
| Net 3 Net S&P Credit Rating 2 (in Millions) Exposure Collateral Exposure Exposure3 Collateral Exposure3 |
A or higher $ 379 $ (222) $ 157 $ 73 $ 3 $ 70
A—62 — 62 81 (1) 82 BBB + 49 — 49 5 — 5 BBB 132 1 133 — — —BBB—51 — 51 — — —Below investment grade and not rated 10 (8) 2 — 2 (2)
Total $ 683 $ (229) $ 454 $ 159 $ 4 $ 155
1 For power and gas trading and hedging activities. In addition to the amounts set forth in the above table, EME’s subsidiaries have posted an $88 million cash margin in the aggregate with PJM, NYISO, MISO, clearing brokers and other counterparties to support hedging and trading activities.
2 EME and SCE assign a credit rating based on the lower of a counterparty’s S&P or Moody’s rating. The table above uses the S&P classifications to summarize risk, but reflects the lower of the two credit ratings.
3 Additional information concerning exposure and net exposure amounts is available in the MD&A section of Edison International’s 2008 10-K.
11 EDISON INTERNATIONAL®
Leading the Way in Electricity SM
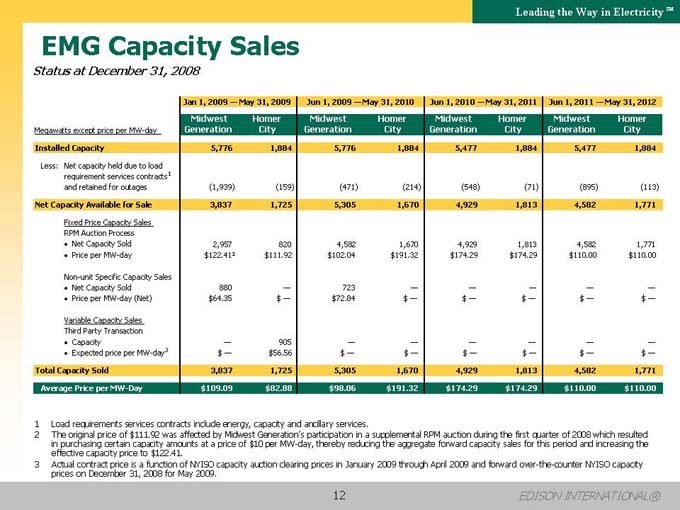
EMG Capacity Sales
Status at December 31, 2008
Jan 1, 2009 — May 31, 2009 Jun 1, 2009 — May 31, 2010 Jun 1, 2010 — May 31, 2011 Jun 1, 2011 — May 31, 2012 Midwest Homer Midwest Homer Midwest Homer Midwest Homer Megawatts except price per MW-day Generation City Generation City Generation City Generation City Installed Capacity 5,776 1,884 5,776 1,884 5,477 1,884 5,477 1,884
Less: Net capacity held due to load requirement services contracts1 and retained for outages (1,939) (159) (471) (214) (548) (71) (895) (113)
Net Capacity Available for Sale 3,837 1,725 5,305 1,670 4,929 1,813 4,582 1,771
Fixed Price Capacity Sales RPM Auction Process
• Net Capacity Sold 2,957 820 4,582 1,670 4,929 1,813 4,582 1,771
• Price per MW-day $122.412 $111.92 $102.04 $191.32 $174.29 $174.29 $110.00 $110.00
Non-unit Specific Capacity Sales
• Net Capacity Sold 880 — 723 — — — — —
• Price per MW-day (Net) $64.35 $ — $72.84 $ — $ — $ — $ — $ —
Variable Capacity Sales Third Party Transaction
• Capacity — 905 — — — — — —
• Expected price per MW-day3 $ — $56.56 $ — $ — $ — $ — $ — $ —
Total Capacity Sold 3,837 1,725 5,305 1,670 4,929 1,813 4,582 1,771
Average Price per MW-Day $109.09 $82.88 $98.06 $191.32 $174.29 $174.29 $110.00 $110.00
1 |
| Load requirements services contracts include energy, capacity and ancillary services. |
2 The original price of $111.92 was affected by Midwest Generation’s participation in a supplemental RPM auction during the first quarter of 2008 which resulted in purchasing certain capacity amounts at a price of $10 per MW-day, thereby reducing the aggregate forward capacity sales for this period and increasing the effective capacity price to $122.41.
3 Actual contract price is a function of NYISO capacity auction clearing prices in January 2009 through April 2009 and forward over-the-counter NYISO capacity prices on December 31, 2008 for May 2009.
12 EDISON INTERNATIONAL®
Leading the Way in Electricity SM
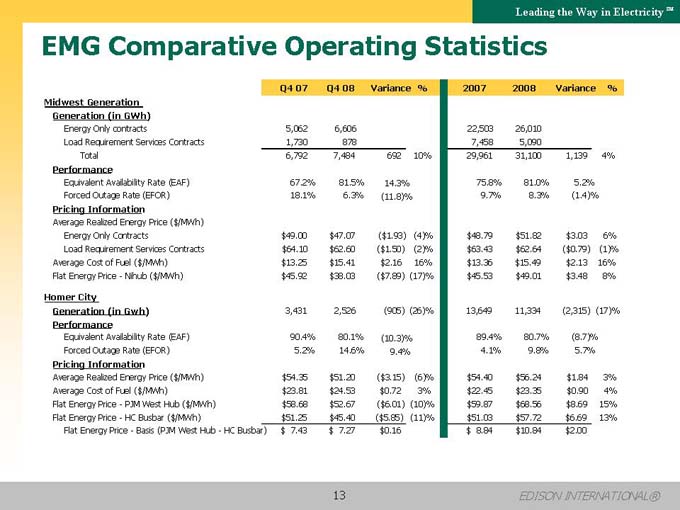
EMG Comparative Operating Statistics
Q4 07 Q4 08 Variance % 2007 2008 Variance % Midwest Generation Generation (in GWh)
Energy Only contracts 5,062 6,606 22,503 26,010 Load Requirement Services Contracts 1,730 878 7,458 5,090
Total 6,792 7,484 692 10% 29,961 31,100 1,139 4%
Performance
Equivalent Availability Rate (EAF) 67.2% 81.5% 14.3% 75.8% 81.0% 5.2% Forced Outage Rate (EFOR) 18.1% 6.3% (11.8)% 9.7% 8.3% (1.4)%
Pricing Information
Average Realized Energy Price ($/MWh)
Energy Only Contracts $49.00 $47.07 ($1.93) (4)% $48.79 $51.82 $3.03 6% Load Requirement Services Contracts $64.10 $62.60 ($1.50) (2)% $63.43 $62.64 ($0.79) (1)% Average Cost of Fuel ($/MWh) $13.25 $15.41 $2.16 16% $13.36 $15.49 $2.13 16% Flat Energy Price—Nihub ($/MWh) $45.92 $38.03 ($7.89) (17)% $45.53 $49.01 $3.48 8%
Homer City
Generation (in Gwh) 3,431 2,526 (905) (26)% 13,649 11,334 (2,315) (17)%
Performance
Equivalent Availability Rate (EAF) 90.4% 80.1% (10.3)% 89.4% 80.7% (8.7)% Forced Outage Rate (EFOR) 5.2% 14.6% 9.4% 4.1% 9.8% 5.7%
Pricing Information
Average Realized Energy Price ($/MWh) $54.35 $51.20 ($3.15) (6)% $54.40 $56.24 $1.84 3% Average Cost of Fuel ($/MWh) $23.81 $24.53 $0.72 3% $22.45 $23.35 $0.90 4% Flat Energy Price—PJM West Hub ($/MWh) $58.68 $52.67 ($6.01) (10)% $59.87 $68.56 $8.69 15% Flat Energy Price—HC Busbar ($/MWh) $51.25 $45.40 ($5.85) (11)% $51.03 $57.72 $6.69 13% Flat Energy Price—Basis (PJM West Hub—HC Busbar) $ 7.43 $ 7.27 $0.16 $ 8.84 $10.84 $2.00
13 EDISON INTERNATIONAL®
Leading the Way in Electricity SM
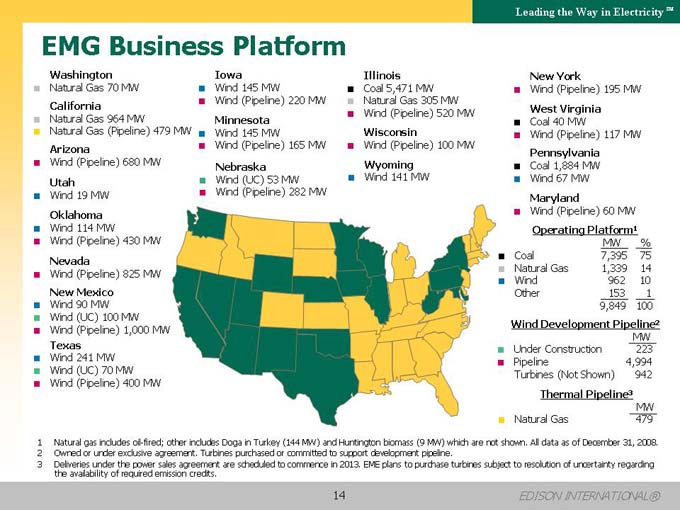
EMG Business Platform
Washington Iowa Illinois New York
? Natural Gas 70 MW ? Wind 145 MW ? Coal 5,471 MW ? Wind (Pipeline) 195 MW
? Wind (Pipeline) 220 MW ? Natural Gas 305 MW
California West Virginia
? Wind (Pipeline) 520 MW
? Natural Gas 964 MW Minnesota ? Coal 40 MW
? Natural Gas (Pipeline) 479 MW ? Wind 145 MW Wisconsin ? Wind (Pipeline) 117 MW Arizona ? Wind (Pipeline) 165 MW ? Wind (Pipeline) 100 MW
Pennsylvania
? Wind (Pipeline) 680 MW Nebraska Wyoming ? Coal 1,884 MW
? Wind (UC) 53 MW ? Wind 141 MW ? Wind 67 MW
Utah
? Wind 19 MW ? Wind (Pipeline) 282 MW
Maryland
Oklahoma ? Wind (Pipeline) 60 MW
? Wind 114 MW Operating Platform1
? Wind (Pipeline) 430 MW MW %
? Coal 7,395 75
Nevada
? Natural Gas 1,339 14
? Wind (Pipeline) 825 MW
? Wind 962 10 New Mexico Other 153 1
? Wind 90 MW 9,849 100
? Wind (UC) 100 MW
Wind Development Pipeline2
? Wind (Pipeline) 1,000 MW
MW Texas ? Under Construction 223
? Wind 241 MW ? Pipeline 4,994
? Wind (UC) 70 MW Turbines (Not Shown) 942
? Wind (Pipeline) 400 MW
Thermal Pipeline3
MW
? Natural Gas 479
1 Natural gas includes oil-fired; other includes Doga in Turkey (144 MW) and Huntington biomass (9 MW) which are not shown. All data as of December 31, 2008.
2 |
| Owned or under exclusive agreement. Turbines purchased or committed to support development pipeline. |
3 Deliveries under the power sales agreement are scheduled to commence in 2013. EME plans to purchase turbines subject to resolution of uncertainty regarding the availability of required emission credits.
14 EDISON INTERNATIONAL®
Leading the Way in Electricity SM
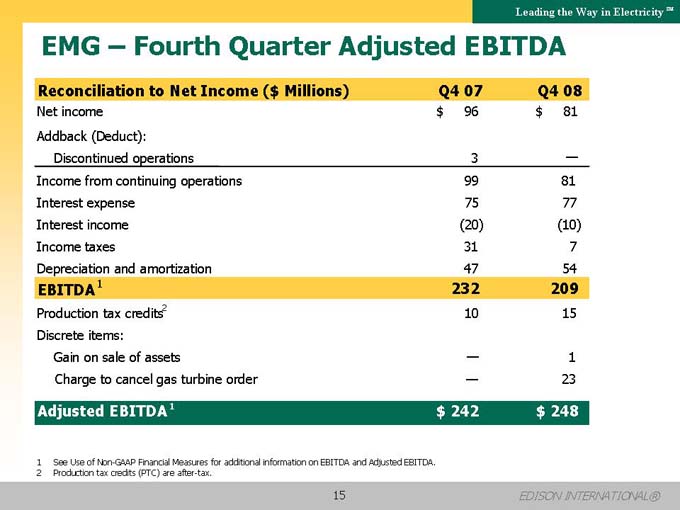
EMG – Fourth Quarter Adjusted EBITDA
Reconciliation to Net Income ($ Millions) Q4 07 Q4 08
Net income $ 96 $ 81 Addback (Deduct): Discontinued operations 3 —Income from continuing operations 99 81 Interest expense 75 77 Interest income (20) (10) Income taxes 31 7 Depreciation and amortization 47 54
EBITDA1 232 209
Production tax credits2 10 15 Discrete items: Gain on sale of assets — 1 Charge to cancel gas turbine order — 23
Adjusted EBITDA1 $ 242 $ 248
1 |
| See Use of Non-GAAP Financial Measures for additional information on EBITDA and Adjusted EBITDA. |
2 |
| Production tax credits (PTC) are after-tax. |
15 EDISON INTERNATIONAL®
Leading the Way in Electricity SM
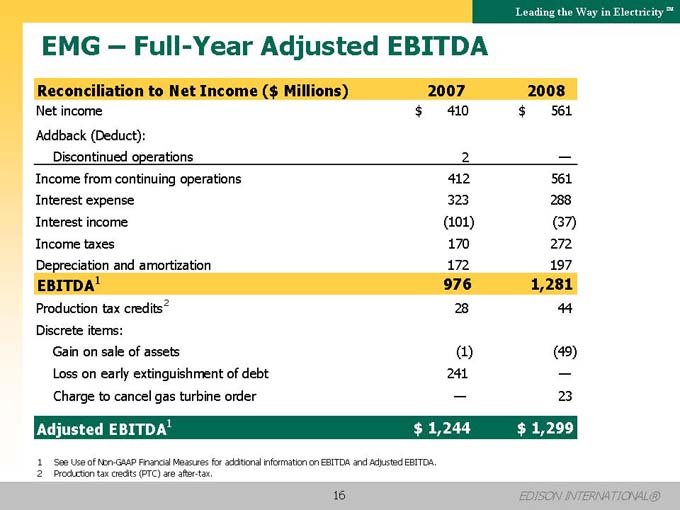
EMG – Full-Year Adjusted EBITDA
Reconciliation to Net Income ($ Millions) 2007 2008
Net income $ 410 $ 561 Addback (Deduct): Discontinued operations 2 —Income from continuing operations 412 561 Interest expense 323 288 Interest income (101) (37) Income taxes 170 272 Depreciation and amortization 172 197
EBITDA1 976 1,281
Production tax credits2 28 44 Discrete items: Gain on sale of assets (1) (49) Loss on early extinguishment of debt 241 —Charge to cancel gas turbine order — 23
Adjusted EBITDA1 $ 1,244 $ 1,299
1 |
| See Use of Non-GAAP Financial Measures for additional information on EBITDA and Adjusted EBITDA. |
2 |
| Production tax credits (PTC) are after-tax. |
16 EDISON INTERNATIONAL®
Leading the Way in Electricity SM
Use of Non-GAAP Financial Measures
Edison International’s earnings are prepared in accordance with generally accepted accounting principles used in the United States and represent the company’s earnings as reported to the Securities and Exchange Commission. Our management uses core earnings and EPS by principal operating subsidiary internally for financial planning and for analysis of performance. We also use core earnings and EPS by principal operating subsidiary as primary performance measurements when communicating with analysts and investors regarding our earnings results and outlook, as it allows us to more accurately compare the company’s ongoing performance across periods. Core earnings exclude discontinued operations and other non-core items and are reconciled to basic earnings per common share.
EPS by principal operating subsidiary is based on the principal operating subsidiary net income and Edison International’s weighted average outstanding common shares. The impact of participating securities (vested stock options that earn dividend equivalents that may participate in undistributed earnings with common stock) for each principal operating subsidiary is not material to each principal operating subsidiary’s EPS and is therefore reflected in the results of the Edison International holding company, which we refer to as EIX parent company and other. EPS and core EPS by principal operating subsidiary are reconciled to basic earnings per common share.
EBITDA is defined as earnings before interest, income taxes, depreciation and amortization. Adjusted EBITDA includes production tax credits from EMG’s wind projects and excludes amounts from gain on the sale of assets, loss on early extinguishment of debt and leases, and impairment of assets and investments. Our management uses Adjusted EBITDA as an important financial measure for evaluating EMG.
A reconciliation of Non-GAAP information to GAAP information, including the impact of participating securities, is included either on the slide where the information appears or on another slide referenced in the presentation.
17 EDISON INTERNATIONAL®