Exhibit 99.1
Exhibit 99.1
Leading the Way in Electricity SM
Edison International
Business Update
May 2009
May 8, 2009
EDISON INTERNATIONAL®
Leading the Way in Electricity SM
Forward-Looking Statements
Statements contained in this presentation about future performance, including, without limitation, earnings, asset and rate base growth, load growth, capital investments, and other statements that are not purely historical, are forward-looking statements. These forward-looking statements reflect our current expectations; however, such statements involve risks and uncertainties. Actual results could differ materially from current expectations. Important factors that could cause different results are discussed under the headings “Risk Factors” and “Management’s Discussion and Analysis” in Edison International’s 2008 Form 10-K and other reports filed with the Securities and Exchange Commission, which are available on our website: www.edisoninvestor.com. These forward-looking statements represent our expectations only as of the date of this presentation, and Edison International assumes no duty to update them to reflect new information, events or circumstances.
May 8, 2009 1 EDISON INTERNATIONAL®
Leading the Way in Electricity SM
What’s New Since Our Last Business Update
Updated Information
Q1 2009 results and standard information
SCE capital expenditures and rate base forecast updated (pp. 7-9)
2009 Earnings Guidance (p. 4)
SCE Regulatory Key Events (p. 27)
May 8, 2009 2 EDISON INTERNATIONAL®
Leading the Way in Electricity SM
Value Drivers
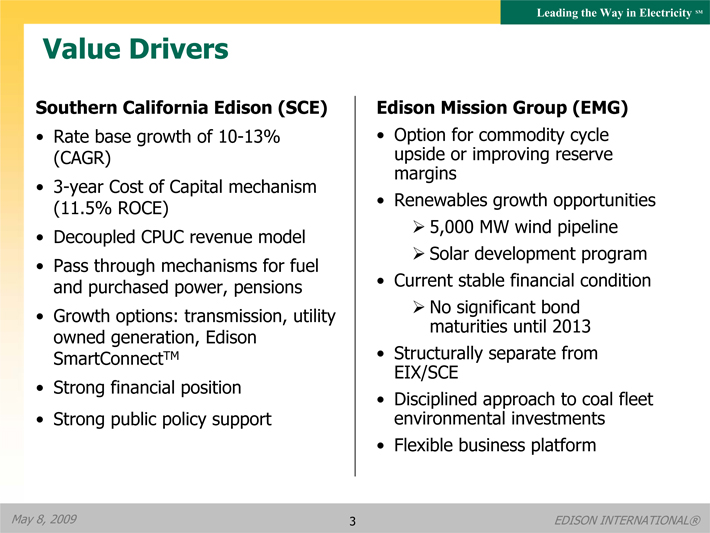
Southern California Edison (SCE)
Rate base growth of 10-13% (CAGR)
3-year Cost of Capital mechanism (11.5% ROCE)
Decoupled CPUC revenue model
Pass through mechanisms for fuel and purchased power, pensions
Growth options: transmission, utility owned generation, Edison SmartConnectTM
Strong financial position
Strong public policy support
Edison Mission Group (EMG)
Option for commodity cycle upside or improving reserve margins
Renewables growth opportunities
5,000 MW wind pipeline
Solar development program
Current stable financial condition
No significant bond maturities until 2013
Structurally separate from EIX/SCE
Disciplined approach to coal fleet environmental investments
Flexible business platform
May 8, 2009 3 EDISON INTERNATIONAL®
Leading the Way in Electricity SM
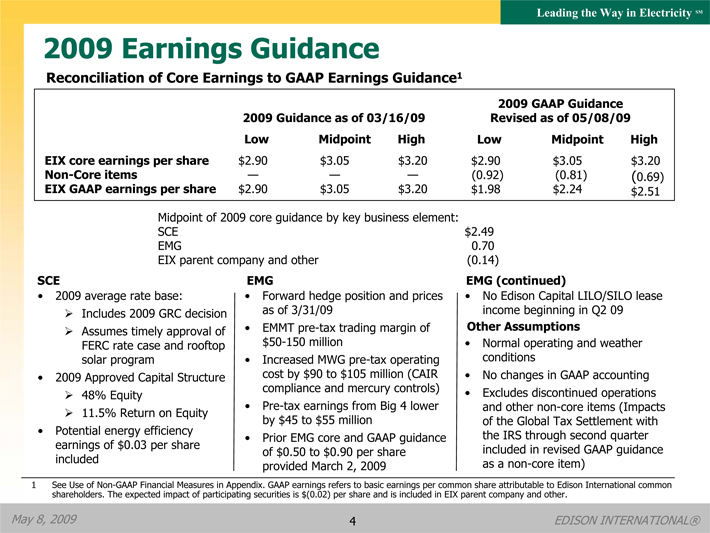
2009 Earnings Guidance
Reconciliation of Core Earnings to GAAP Earnings Guidance1
2009 GAAP Guidance
2009 Guidance as of 03/16/09
Revised as of 05/08/09
Low Midpoint High Low Midpoint High
EIX core earnings per share $2.90 $3.05 $3.20 $2.90 $3.05 $3.20
Non-Core items — — — (0.92) (0.81) (0.69)
EIX GAAP earnings per share $2.90 $3.05 $3.20 $1.98 $2.24 $2.51
Midpoint of 2009 core guidance by key business element:
SCE $2.49
EMG 0.70
EIX parent company and other (0.14)
SCE
2009 average rate base:
Includes 2009 GRC decision
Assumes timely approval of FERC rate case and rooftop solar program
2009 Approved Capital Structure
48% Equity
11.5% Return on Equity
Potential energy efficiency earnings of $0.03 per share included
EMG
Forward hedge position and prices as of 3/31/09
EMMT pre-tax trading margin of $50-150 million
Increased MWG pre-tax operating cost by $90 to $105 million (CAIR compliance and mercury controls)
Pre-tax earnings from Big 4 lower by $45 to $55 million
Prior EMG core and GAAP guidance of $0.50 to $0.90 per share provided March 2, 2009
EMG (continued)
No Edison Capital LILO/SILO lease income beginning in Q2 09
Other Assumptions
Normal operating and weather conditions
No changes in GAAP accounting
Excludes discontinued operations and other non-core items (Impacts of the Global Tax Settlement with the IRS through second quarter included in revised GAAP guidance as a non-core item)
1 See Use of Non-GAAP Financial Measures in Appendix. GAAP earnings refers to basic earnings per common share attributable to Edison International common shareholders. The expected impact of participating securities is $(0.02) per share and is included in EIX parent company and other.
May 8, 2009 4 EDISON INTERNATIONAL®
Leading the Way in Electricity SM
Southern California Edison (SCE)
May 8, 2009
5
EDISON INTERNATIONAL®
Leading the Way in Electricity SM
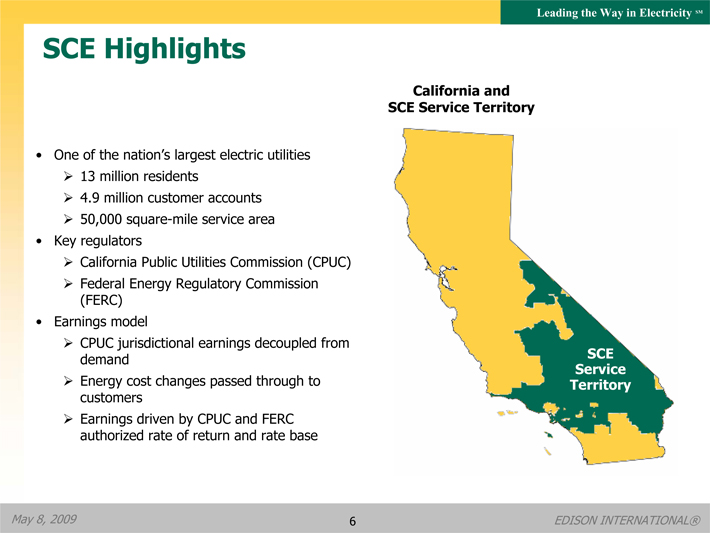
SCE Highlights
California and SCE Service Territory
One of the nation’s largest electric utilities
13 million residents
4.9 million customer accounts
50,000 square-mile service area
Key regulators
California Public Utilities Commission (CPUC)
Federal Energy Regulatory Commission (FERC)
Earnings model
CPUC jurisdictional earnings decoupled from demand
Energy cost changes passed through to customers
Earnings driven by CPUC and FERC authorized rate of return and rate base
SCE Service Territory
May 8, 2009
6
EDISON INTERNATIONAL®

Leading the Way in Electricity SM
SCE Capital Investment Forecast1
$ Billions $5 $4 $3 $2 $1 $0 Base Case Low Case3
20092 $3.4 $2.8
20102 $3.9 $3.2
20112 $4.2 $3.5
2012 $4.4 $3.7
2013 $4.3 $3.6
5-Yr Base Case By Classification $ %
Solar Rooftop Program 0.6 3
Edison SmartConnectTM 1.2 6
Generation 2.5 12
Transmission 6.2 31
Distribution 9.7 48
Total 20.2 100
5-Yr Base Case By Proceeding Type %
2009 CPUC Rate Case2 33
2012 CPUC Rate Case 25
Other CPUC 11
FERC Rate Cases 31
Total 100
1 Subject to timely receipt of permitting, licensing and regulatory approvals. Forecast as of April 2009.
2 Based on an ongoing examination of the 2009 GRC decision and is subject to change.
3 Low Case reflects the potential variability to project investment levels related to execution risk, scope change, delays, regulatory constraints, and other contingencies. The level of variability experienced in 2008 was 18%.
May 8, 2009 7 EDISON INTERNATIONAL®
Leading the Way in Electricity SM
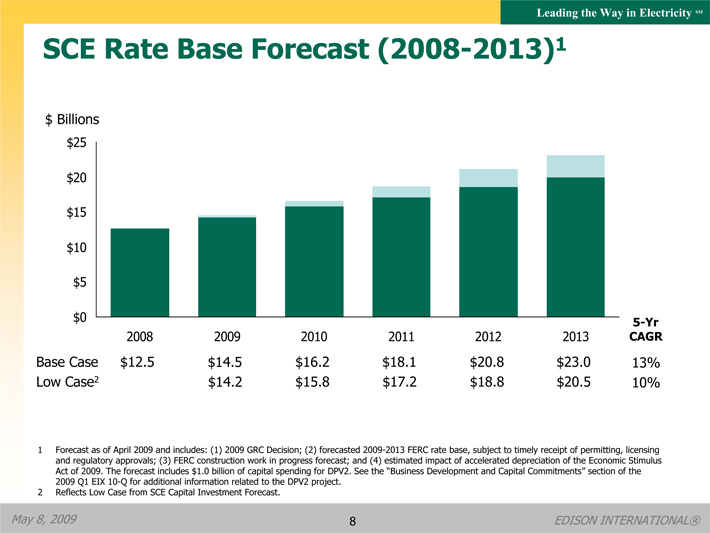
SCE Rate Base Forecast (2008-2013)1
$ Billions $25 $20 $15 $10 $5 $0
2008 2009 2010 2011 2012 2013 5-Yr CAGR
Base Case $12.5 $14.5 $16.2 $18.1 $20.8 $23.0 13%
Low Case2 $14.2 $15.8 $17.2 $18.8 $20.5 10%
1 Forecast as of April 2009 and includes: (1) 2009 GRC Decision; (2) forecasted 2009-2013 FERC rate base, subject to timely receipt of permitting, licensing and regulatory approvals; (3) FERC construction work in progress forecast; and (4) estimated impact of accelerated depreciation of the Economic Stimulus Act of 2009. The forecast includes $1.0 billion of capital spending for DPV2. See the “Business Development and Capital Commitments” section of the 2009 Q1 EIX 10-Q for additional information related to the DPV2 project.
2 Reflects Low Case from SCE Capital Investment Forecast.
May 8, 2009 8 EDISON INTERNATIONAL®
Leading the Way in Electricity SM
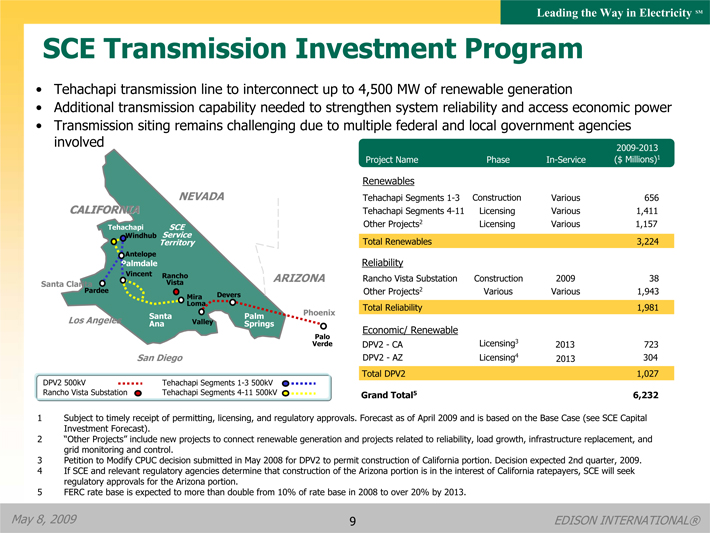
SCE Transmission Investment Program
Tehachapi transmission line to interconnect up to 4,500 MW of renewable generation
Additional transmission capability needed to strengthen system reliability and access economic power
Transmission siting remains challenging due to multiple federal and local government agencies
involved
NEVADA
CALIFORNIA
Tehachapi
SCE Service Territory
Windhub
Antelope
Palmdale
Vincent
Rancho Vista
ARIZONA
Santa Clarita
Pardee
Mira Loma
Devers
Santa Ana
Phoenix
Los Angeles
Valley
PalmSprings
Verde Palo
San Diego
DPV2 500kV
Tehachapi Segments 1-3 500kV
Rancho Vista Substation
Tehachapi Segments 4-11 500kV
1 Subject to timely receipt of permitting, licensing, and regulatory approvals. Forecast as of April 2009 and is based on the Base Case (see SCE Capital Investment Forecast).
2 “Other Projects” include new projects to connect renewable generation and projects related to reliability, load growth, infrastructure replacement, and grid monitoring and control.
3 Petition to Modify CPUC decision submitted in May 2008 for DPV2 to permit construction of California portion. Decision expected 2nd quarter, 2009.
4 If SCE and relevant regulatory agencies determine that construction of the Arizona portion is in the interest of California ratepayers, SCE will seek regulatory approvals for the Arizona portion.
5 FERC rate base is expected to more than double from 10% of rate base in 2008 to over 20% by 2013.
2009-2013
Project Name
Phase
In-Service
($ Millions)1
Renewables
Tehachapi Segments 1-3
Construction
Various
656
Tehachapi Segments 4-11
Licensing
Various
1,411
Other Projects2
Licensing
Various
1,157
Total Renewables
3,224
Reliability
Rancho Vista Substation
Construction
2009
38
Other Projects2
Various
Various
1,943
Total Reliability
1,981
Economic/ Renewable
DPV2 - CA
Licensing3
2013
723
DPV2 - AZ
Licensing4
2013
304
Total DPV2
1,027
Grand Total5
6,232
May 8, 2009
9
EDISON INTERNATIONAL®
Leading the Way in Electricity SM
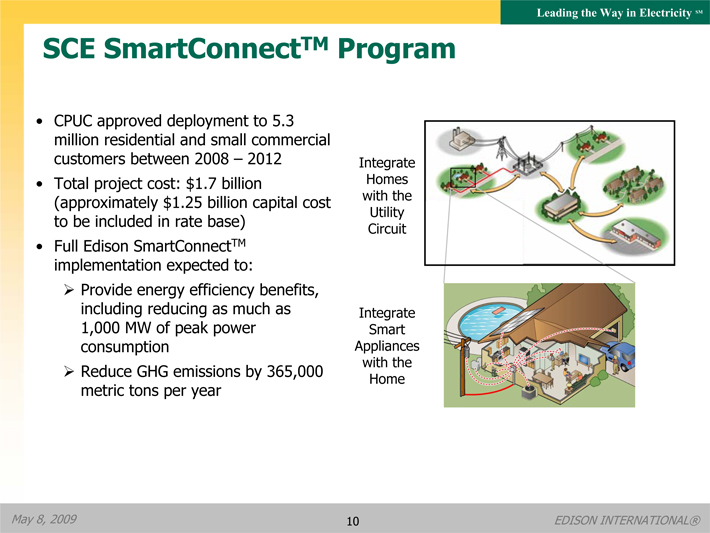
SCE SmartConnectTM Program
CPUC approved deployment to 5.3 million residential and small commercial customers between 2008 – 2012
Total project cost: $1.7 billion (approximately $1.25 billion capital cost to be included in rate base)
Full Edison SmartConnectTM implementation expected to:
Provide energy efficiency benefits, including reducing as much as 1,000 MW of peak power consumption
Reduce GHG emissions by 365,000 metric tons per year
Integrate Homes with the Utility Circuit
Integrate Smart Appliances with the Home
May 8, 2009 10 EDISON INTERNATIONAL®
Leading the Way in Electricity SM
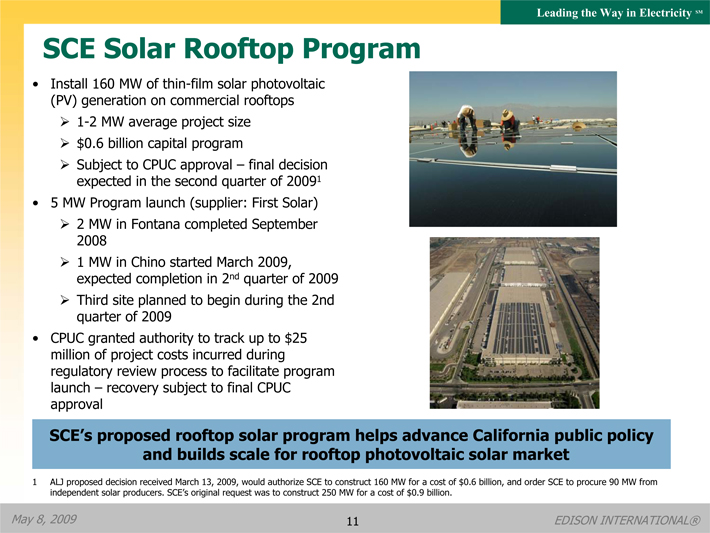
SCE Solar Rooftop Program
Install 160 MW of thin-film solar photovoltaic (PV) generation on commercial rooftops
1-2 MW average project size
$0.6 billion capital program
Subject to CPUC approval – final decision expected in the second quarter of 20091
5 MW Program launch (supplier: First Solar)
2 MW in Fontana completed September 2008
1 MW in Chino started March 2009, expected completion in 2nd quarter of 2009
Third site planned to begin during the 2nd quarter of 2009
CPUC granted authority to track up to $25 million of project costs incurred during regulatory review process to facilitate program launch – recovery subject to final CPUC approval
SCE’s proposed rooftop solar program helps advance California public policy and builds scale for rooftop photovoltaic solar market
1 ALJ proposed decision received March 13, 2009, would authorize SCE to construct 160 MW for a cost of $0.6 billion, and order SCE to procure 90 MW from independent solar producers. SCE’s original request was to construct 250 MW for a cost of $0.9 billion.
May 8, 2009 11 EDISON INTERNATIONAL®
Leading the Way in Electricity SM
Edison Mission Group (EMG)
May 8, 2009 12 EDISON INTERNATIONAL®
Leading the Way in Electricity SM
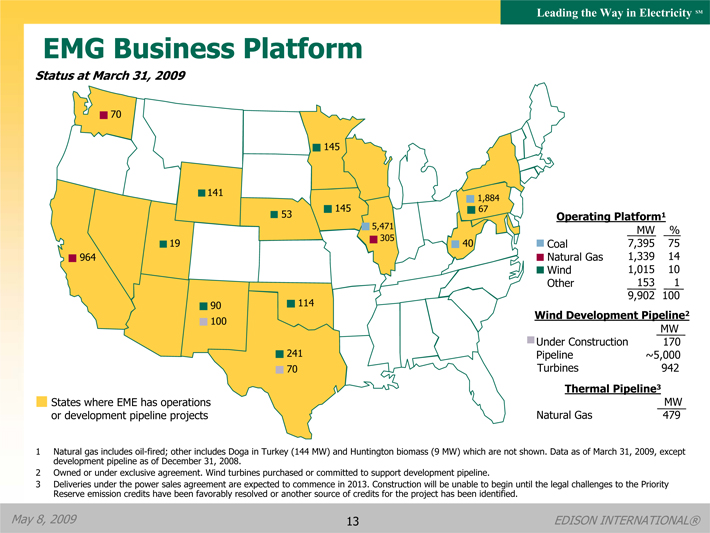
EMG Business Platform
Status at March 31, 2009
70
145
141
1,884
145
67
53
5,471
305
19
40
964
90
114
100
241
70
States where EME has operations or development pipeline projects
1 Natural gas includes oil-fired; other includes Doga in Turkey (144 MW) and Huntington biomass (9 MW) which are not shown. Data as of March 31, 2009, except development pipeline as of December 31, 2008.
2 Owned or under exclusive agreement. Wind turbines purchased or committed to support development pipeline.
3 Deliveries under the power sales agreement are expected to commence in 2013. Construction will be unable to begin until the legal challenges to the Priority Reserve emission credits have been favorably resolved or another source of credits for the project has been identified.
Operating Platform1 MW %
Coal 7,395 75
Natural Gas 1,339 14
Wind 1,015 10
Other 153 1
9,902 100
Wind Development Pipeline2 MW
Under Construction 170
Pipeline ~5,000
Turbines 942
Thermal Pipeline3
MW
Natural Gas 479
May 8, 2009 13 EDISON INTERNATIONAL®
Leading the Way in Electricity SM
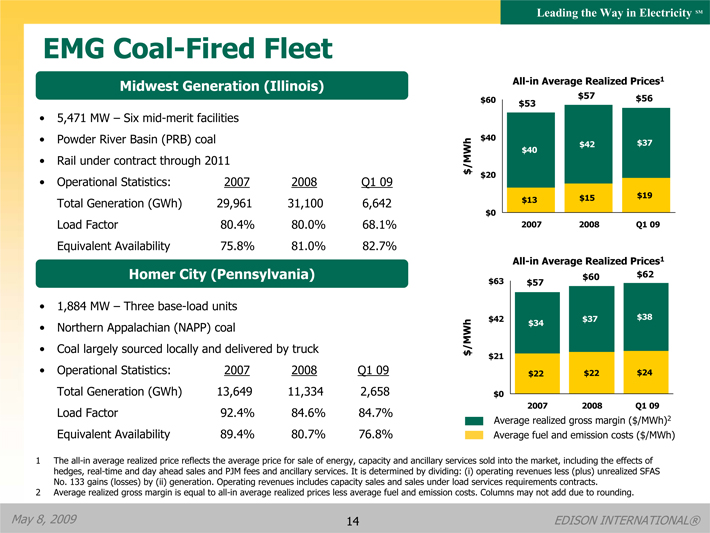
EMG Coal-Fired Fleet
Midwest Generation (Illinois)
5,471 MW – Six mid-merit facilities
Powder River Basin (PRB) coal
Rail under contract through 2011
Operational Statistics: 2007 2008 Q1 09 Total Generation (GWh) 29,961 31,100 6,642 Load Factor 80.4% 80.0% 68.1% Equivalent Availability 75.8% 81.0% 82.7%
Homer City (Pennsylvania)
1,884 MW – Three base-load units
Northern Appalachian (NAPP) coal
Coal largely sourced locally and delivered by truck
Operational Statistics: 2007 2008 Q1 09 Total Generation (GWh) 13,649 11,334 2,658 Load Factor 92.4% 84.6% 84.7% Equivalent Availability 89.4% 80.7% 76.8%
1 The all-in average realized price reflects the average price for sale of energy, capacity and ancillary services sold into the market, including the effects of hedges, real-time and day ahead sales and PJM fees and ancillary services. It is determined by dividing: (i) operating revenues less (plus) unrealized SFAS No. 133 gains (losses) by (ii) generation. Operating revenues includes capacity sales and sales under load services requirements contracts.
2 Average realized gross margin is equal to all-in average realized prices less average fuel and emission costs. Columns may not add due to rounding.
All-in Average Realized Prices1 $60 $57 $56 $53 $40 $42 $37 $/MWh $40 $20 $15 $19 $13 $0 2007 2008 Q1 09
All-in Average Realized Prices1 $60 $62 $63 $57 $42 $37 $38 $/MWh $34 $21 $22 $22 $24 $0 2007 2008 Q1 09 Average realized gross margin ($/MWh)2 Average fuel and emission costs ($/MWh)
May 8, 2009 14 EDISON INTERNATIONAL®
Leading the Way in Electricity SM
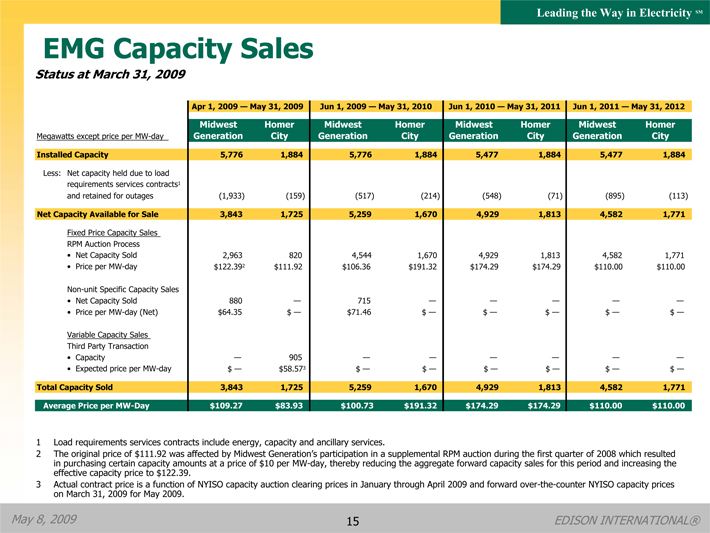
EMG Capacity Sales
Status at March 31, 2009
Apr 1, 2009 — May 31, 2009 Jun 1, 2009 — May 31, 2010 Jun 1, 2010 — May 31, 2011 Jun 1, 2011 — May 31, 2012
Midwest Generation Homer City Midwest Generation Homer City Midwest Generation Homer City Midwest Generation Homer City Megawatts except price per MW-day
Installed Capacity 5,776 1,884 5,776 1,884 5,477 1,884 5,477 1,884
Less: Net capacity held due to load requirements services contracts1 and retained for outages (1,933) (159) (517) (214) (548) (71) (895) (113)
Net Capacity Available for Sale 3,843 1,725 5,259 1,670 4,929 1,813 4,582 1,771
Fixed Price Capacity Sales
RPM Auction Process
Net Capacity Sold 2,963 820 4,544 1,670 4,929 1,813 4,582 1,771
Price per MW-day $122.392 $111.92 $106.36 $191.32 $174.29 $174.29 $110.00 $110.00
Non-unit Specific Capacity Sales
Net Capacity Sold 880 — 715 — — — — —
Price per MW-day (Net) $64.35 $ — $71.46 $ — $ — $ — $ — $ —
Variable Capacity Sales
Third Party Transaction
Capacity — 905 — — — — — —
Expected price per MW-day $ — $58.573 $ — $ — $ — $ — $ — $ —
Total Capacity Sold 3,843 1,725 5,259 1,670 4,929 1,813 4,582 1,771
Average Price per MW-Day $109.27 $83.93 $100.73 $191.32 $174.29 $174.29 $110.00 $110.00
1 Load requirements services contracts include energy, capacity and ancillary services.
2 The original price of $111.92 was affected by Midwest Generation’s participation in a supplemental RPM auction during the first quarter of 2008 which resulted in purchasing certain capacity amounts at a price of $10 per MW-day, thereby reducing the aggregate forward capacity sales for this period and increasing the effective capacity price to $122.39.
3 Actual contract price is a function of NYISO capacity auction clearing prices in January through April 2009 and forward over-the-counter NYISO capacity prices on March 31, 2009 for May 2009.
May 8, 2009 15 EDISON INTERNATIONAL®
Leading the Way in Electricity SM
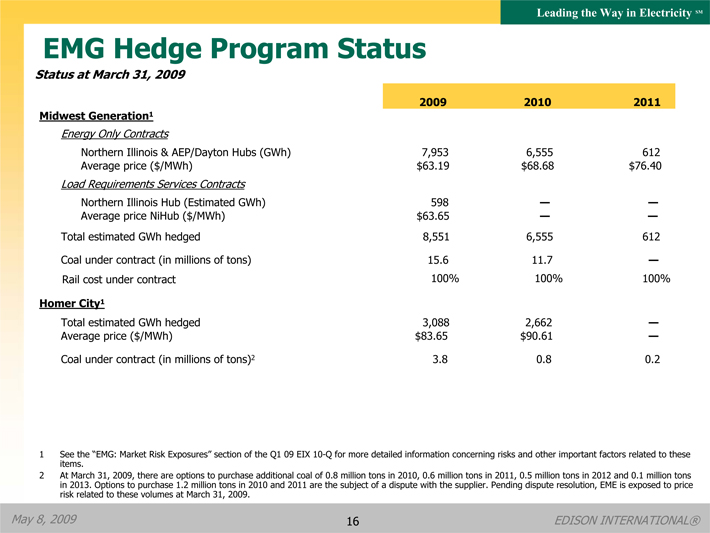
EMG Hedge Program Status
Status at March 31, 2009
2009 2010 2011
Midwest Generation1
Energy Only Contracts
Northern Illinois & AEP/Dayton Hubs (GWh) 7,953 6,555 612
Average price ($/MWh) $63.19 $68.68 $76.40
Load Requirements Services Contracts
Northern Illinois Hub (Estimated GWh) 598 — —
Average price NiHub ($/MWh) $63.65 — —
Total estimated GWh hedged 8,551 6,555 612
Coal under contract (in millions of tons) 15.6 11.7 —
Rail cost under contract 100% 100% 100%
Homer City1
Total estimated GWh hedged 3,088 2,662 —
Average price ($/MWh) $83.65 $90.61 —
Coal under contract (in millions of tons)2 3.8 0.8 0.2
1 See the “EMG: Market Risk Exposures” section of the Q1 09 EIX 10-Q for more detailed information concerning risks and other important factors related to these items.
2 At March 31, 2009, there are options to purchase additional coal of 0.8 million tons in 2010, 0.6 million tons in 2011, 0.5 million tons in 2012 and 0.1 million tons in 2013. Options to purchase 1.2 million tons in 2010 and 2011 are the subject of a dispute with the supplier. Pending dispute resolution, EME is exposed to price risk related to these volumes at March 31, 2009.
May 8, 2009 16 EDISON INTERNATIONAL®
Leading the Way in Electricity SM
EMG Environmental Compliance1
MWG Compliance Plan
Mercury Reductions
Emissions of 0.008 lbs. per GWh or minimum 90% mercury removal by 20152
Installation of Activated Carbon Injection (ACI) technology by July 2009
Estimated cost $43 million
NOX Reductions
Emissions of 0.11 lbs. per million Btus by December 31, 2011
SO2 Reductions
Emissions of 0.11 lbs. per million Btus by year-end 2018, with interim step-downs
Firm deadlines for flue gas desulfurization - varies by plant (2013-2018)
Homer City Compliance Plan
Use of existing technology and allowances for current compliance
Additional environmental control equipment would likely need to be installed to meet the 2015 Clean Air Act deadline
Next Steps
EMG continues to look at various innovative and less costly technologies that may be employed to meet environmental compliance including testing:
Selective non-catalytic NOX removal technologies and
Reagent based SO2 removal technologies
EMG is also evaluating several interim and alternative compliance solutions including combinations of retrofits and specific unit shutdowns
EMG is evaluating alternative compliance technologies to meet the NOX and SO2 emissions requirements at significantly lower capital costs – final decisions about compliance path have not been made
1 The MWG and Homer City facilities continue to be governed by state rules as well as the existing “SIP Call” ozone season NOx cap-and-trade program. Changes in the cost of labor, equipment, materials and other factors may materially affect the above estimates for SCR, SNCR & FGD equipment. See the “Environmental Developments” section in Management Overview of the 2009 Q1 EIX 10-Q for additional information concerning environmental compliance.
2 Except Will County #3 which is in 2016
May 8, 2009 17 EDISON INTERNATIONAL®
Leading the Way in Electricity SM
Edison Mission Marketing & Trading (EMMT)
Markets energy and capacity of merchant generation fleet
Hedges key power-related risks such as forward electricity prices
Typically a rolling 12 to 24 month hedging program
Target hedge-neutral position for prompt year with lesser percentages hedged in out years
Proprietary trading in markets where it is active in merchant generation
Primarily transmission-related transactions
Largely in eastern markets
Enters into load service requirements contracts with local utilities and hedges related to energy price risk
Controls on types and sizes of exposures
VaR; EaR; stress and scenario testing; volumetric, duration, and credit limits
EMMT Trading Margin (pre-tax)1
$ Millions
$250
$200
$150
$100
$50
$0
$23
$195
$130
$142
$164
$10
2004
2005
2006
2007
2008
YTD
20092
1 Income from energy trading represents gains recognized from trade price changes. The overhead cost of energy trading is excluded.
2 Year-to-date through March 31, 2009.
May 8, 2009 18 EDISON INTERNATIONAL®
Leading the Way in Electricity SM
EMG Wind Energy Development Strategy
Wind Energy Development Strategy
Strategic importance to growth plan
Contributes to portfolio diversification
Objective is to attain national scope and leadership scale
Wind energy provides attractive opportunities
Growing RPS requirements
Production tax credits and accelerated depreciation
Mainly long-term contracts for output
Wind Project Portfolio & Development Pipeline
Projects1
No. of Projects
MW
In-Service
23
1,015
Under Construction
2
170
Total Projects
25
1,185
Development Pipeline2
39
~5,000
Turbines
Purchased & Firm Purchase Commitments3
942
MW by Manufacturer
Projects In-Service & Under Construction
Turbines Purchased & Firm Purchase Commitments3
Zond109
Suzlon 439
Siemens 161
Clipper 150
Mitsubishi 240
Vestas 86
GE300
Suzlon 286
Clipper 27
Mitsubishi 329
1 Data as of March 31, 2009, except development pipeline, which is as of December 31, 2008. Projects reflect EMG ownership share.
2 Development pipeline includes projects owned or under exclusive agreements.
3 Commitments include cancellation charges.
May 8, 2009
19
EDISON INTERNATIONAL®
Leading the Way in Electricity SM
EMG Solar Program
Large-scale (20-100 MW per site)
Ground mounted
Connected to transmission grid
Identified over 30 sites for potential solar projects
Processing interconnection requests and taking initial steps to secure land rights
Formed strategic relationship with First Solar to develop large solar utility projects in certain markets
Focus on high solar insolation areas in southwestern United States
EMG is seeking to deploy commercial solar power projects
May 8, 2009 20 EDISON INTERNATIONAL®
Leading the Way in Electricity SM
EMG Capital Expenditures
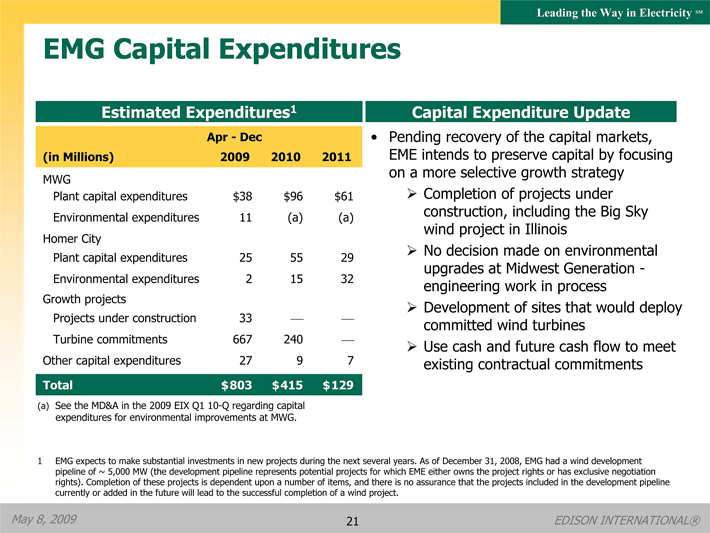
Estimated Expenditures1
Apr - Dec •
(in Millions) 2009 2010 2011
MWG
Plant capital expenditures $38 $96 $61
Environmental expenditures 11 (a) (a)
Homer City
Plant capital expenditures 25 55 29
Environmental expenditures 2 15 32
Growth projects
Projects under construction 33 — —
Turbine commitments 667 240 —
Other capital expenditures 27 9 7
Total $803 $415 $129
(a) See the MD&A in the 2009 EIX Q1 10-Q regarding capital expenditures for environmental improvements at MWG.
Capital Expenditure Update Pending recovery of the capital markets, EME intends to preserve capital by focusing on a more selective growth strategy Completion of projects under construction, including the Big Sky wind project in Illinois No decision made on environmental upgrades at Midwest Generation -engineering work in process Development of sites that would deploy committed wind turbines Use cash and future cash flow to meet existing contractual commitments
1 EMG expects to make substantial investments in new projects during the next several years. As of December 31, 2008, EMG had a wind development pipeline of ~ 5,000 MW (the development pipeline represents potential projects for which EME either owns the project rights or has exclusive negotiation rights). Completion of these projects is dependent upon a number of items, and there is no assurance that the projects included in the development pipeline currently or added in the future will lead to the successful completion of a wind project. May 8, 2009 21 EDISON INTERNATIONAL®

Leading the Way in Electricity SM
Appendix
May 8, 2009
22
EDISON INTERNATIONAL®
Leading the Way in Electricity SM
First Quarter Financial Results
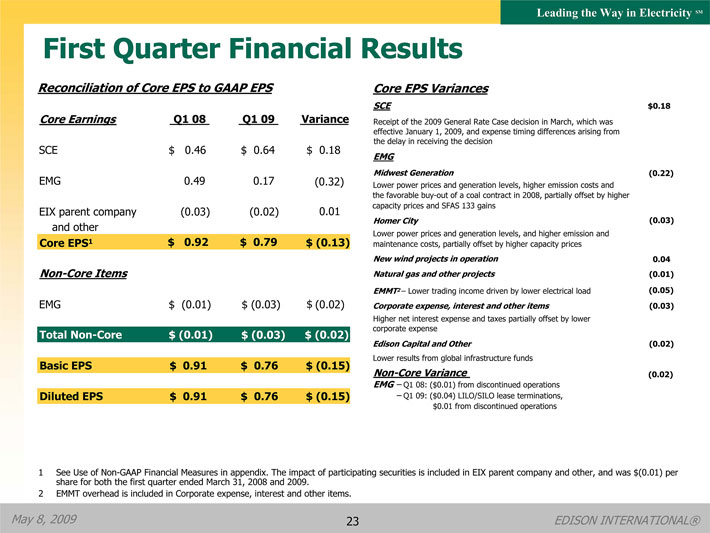
Reconciliation of Core EPS to GAAP EPS
Core Earnings Q1 08 Q1 09 Variance
SCE $ 0.46 $ 0.64 $ 0.18
EMG 0.49 0.17 (0.32)
EIX parent company (0.03) (0.02) 0.01
and other Core EPS1 $ 0.92 $ 0.79 $ (0.13)
Non-Core Items EMG $ (0.01) $ (0.03) (0.02) Total Non-Core $ (0.01) $ (0.03) $ (0.02) Basic EPS $ 0.91 $ 0.76 $ (0.15) Diluted EPS $ 0.91 $ 0.76 $ (0.15) Core EPS Variances SCE $0.18
Receipt of the 2009 General Rate Case decision in March, which was
effective January 1, 2009, and expense timing differences arising from
the delay in receiving the decision
EMG Midwest Generation (0.22)
Lower power prices and generation levels, higher emission costs and
the favorable buy-out of a coal contract in 2008, partially offset by higher
capacity prices and SFAS 133 gains Homer City (0.03)
Lower power prices and generation levels, and higher emission and
maintenance costs, partially offset by higher capacity prices
New wind projects in operation 0.04 Natural gas and other projects (0.01) EMMT2 – Lower trading income driven by lower electrical load (0.05) Corporate expense, interest and other items (0.03) Higher net interest expense and taxes partially offset by lower
corporate expense Edison Capital and Other (0.02)
Lower results from global infrastructure funds Non-Core Variance (0.02)
EMG – Q1 08: ($0.01) from discontinued operations
– Q1 09: ($0.04) LILO/SILO lease terminations,
$0.01 from discontinued operations
1 See Use of Non-GAAP Financial Measures in appendix. The impact of participating securities is included in EIX parent company and other, and was $(0.01) per share for both the first quarter ended March 31, 2008 and 2009.
2 EMMT overhead is included in Corporate expense, interest and other items. May 8, 2009 23 EDISON INTERNATIONAL®
Leading the Way in Electricity SM
Full-Year Financial Results
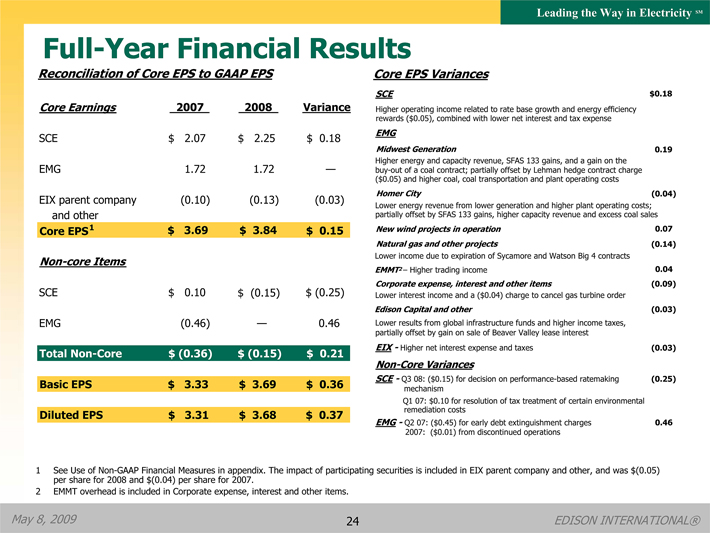
Reconciliation of Core EPS to GAAP EPS
Core Earnings 2007 2008 Variance
SCE $ 2.07 $ 2.25 $ 0.18
EMG 1.72 1.72 — EIX parent company (0.10) (0.13) (0.03)
and other Core EPS 1 $ 3.69 $ 3.84 $ 0.15
Non-core Items SCE $ 0.10 $ (0.15) $ (0.25)
EMG (0.46) — 0.46
Total Non-Core $ (0.36) $ (0.15) $ 0.21
Basic EPS $ 3.33 $ 3.69 $ 0.36
Diluted EPS $ 3.31 $ 3.68 $ 0.37
Core EPS Variances
SCE $0.18
Higher operating income related to rate base growth and energy efficiency
rewards ($0.05), combined with lower net interest and tax expense
EMG
Midwest Generation 0.19
Higher energy and capacity revenue, SFAS 133 gains, and a gain on the
buy-out of a coal contract; partially offset by Lehman hedge contract charge
($0.05) and higher coal, coal transportation and plant operating costs
Homer City (0.04)
Lower energy revenue from lower generation and higher plant operating costs;
partially offset by SFAS 133 gains, higher capacity revenue and excess coal sales
New wind projects in operation 0.07
Natural gas and other projects (0.14)
Lower income due to expiration of Sycamore and Watson Big 4 contracts
EMMT2 – Higher trading income 0.04
Corporate expense, interest and other items (0.09)
Lower interest income and a ($0.04) charge to cancel gas turbine order
Edison Capital and other (0.03)
Lower results from global infrastructure funds and higher income taxes,
partially offset by gain on sale of Beaver Valley lease interest
EIX - Higher net interest expense and taxes (0.03)
Non-Core Variances SCE - Q3 08: ($0.15) for decision on performance-based ratemaking (0.25)
mechanism Q1 07: $0.10 for resolution of tax treatment of certain environmental
remediation costs EMG - Q2 07: ($0.45) for early debt extinguishment charges 0.46
2007: ($0.01) from discontinued operations
1 See Use of Non-GAAP Financial Measures in appendix. The impact of participating securities is included in EIX parent company and other, and was $(0.05) per share for 2008 and $(0.04) per share for 2007.
2 EMMT overhead is included in Corporate expense, interest and other items.
May 8, 2009 24 EDISON INTERNATIONAL®
Leading the Way in Electricity SM
EIX and EMG Legal/Structural Separation
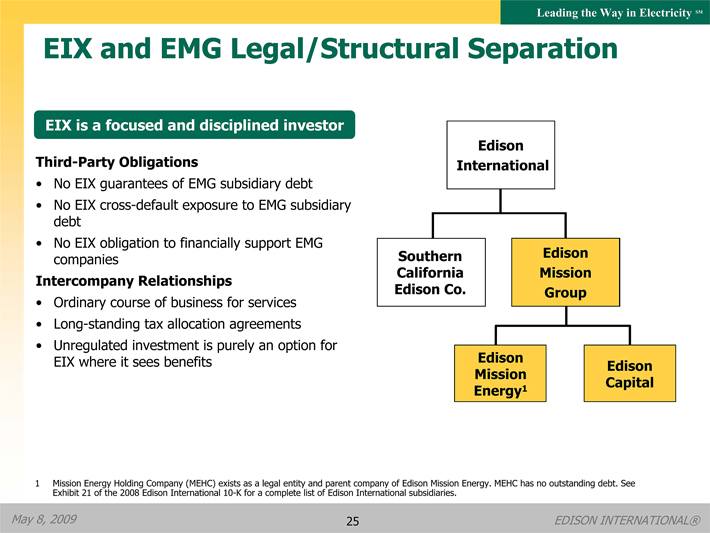
EIX is a focused and disciplined investor
Third-Party Obligations
No EIX guarantees of EMG subsidiary debt
No EIX cross-default exposure to EMG subsidiary debt
No EIX obligation to financially support EMG companies
Intercompany Relationships
Ordinary course of business for services
Long-standing tax allocation agreements
Unregulated investment is purely an option for EIX where it sees benefits
Edison International
Southern California Edison Co.
Edison Mission Group
Edison Mission Energy1
Edison Capital
1 Mission Energy Holding Company (MEHC) exists as a legal entity and parent company of Edison Mission Energy. MEHC has no outstanding debt. See Exhibit 21 of the 2008 Edison International 10-K for a complete list of Edison International subsidiaries.
May 8, 2009 25 EDISON INTERNATIONAL®
Leading the Way in Electricity SM
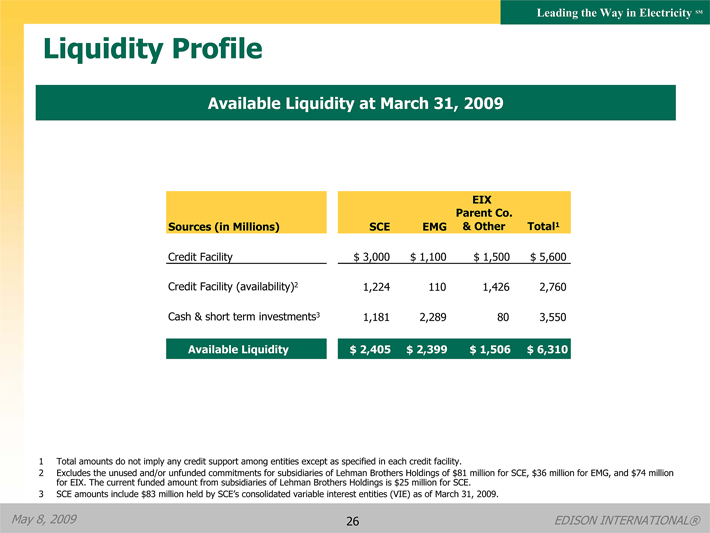
Liquidity Profile
Available Liquidity at March 31, 2009
EIX
Parent Co.
Sources (in Millions) SCE EMG & Other Total1
Credit Facility $ 3,000 $ 1,100 $ 1,500 $ 5,600
Credit Facility (availability)2 1,224 110 1,426 2,760
Cash & short term investments3 1,181 2,289 80 3,550
Available Liquidity $ 2,405 $ 2,399 $ 1,506 $ 6,310
1 Total amounts do not imply any credit support among entities except as specified in each credit facility.
2 Excludes the unused and/or unfunded commitments for subsidiaries of Lehman Brothers Holdings of $81 million for SCE, $36 million for EMG, and $74 million for EIX. The current funded amount from subsidiaries of Lehman Brothers Holdings is $25 million for SCE.
3 SCE amounts include $83 million held by SCE’s consolidated variable interest entities (VIE) as of March 31, 2009.
May 8, 2009 26 EDISON INTERNATIONAL®

Leading the Way in ElectricitySM
SCE Regulatory Key Events
Case Number Date of Filing Status Next Milestone
2006-08 EE Earnings R.09-01-019 01/29/09 CPUC’s R. 09-01-019 urges a settlement to address the IOUs remaining 2006-08 earnings claims SCE filed settlement position on 4/29/09 SCE will participate with parties in a Settlement Conference scheduled in 2nd quarter 2009
2009 FERC Rate Case ER08-1343 08/01/08 FERC Staff settlement proposal provided on 01/08/09 Rate change effective 03/01/09, subject to refund and settlement procedures
A. 04-12-007/8 (Segments 1-3) 12/09/04 Decision Granted D. 07-03-012 / 045 Petitions to Modify Certificate of Public Convenience and Necessity filed on 07/18/08 Petition to Modify decision expected 2nd quarter 2009
Tehachapi Transmission A. 07-06-031 (Segments 4-11) 06/28/07 Draft Environmental Impact Report/Environmental Impact Statement (EIE/EIS) received on 02/13/09 Final EIR/EIS expected in August 2009. Certificate of Public Convenience and Necessity & Record of Decision from United States Forest Service expected by 4th quarter 2009
A. 05-04-015 04/11/05 Petition to Modify D. 07-01-040 to advance construction of CA portion filed on 05/14/08 Petition to Modify decision expected 2nd quarter 2009
DPV2 – Transmission1 ACC: L-00000A-06-0295-00130 05/01/06 Arizona portion of DPV2 is under SCE review If SCE and relevant regulatory agencies determine that construction of the Arizona portion is in the interest of California ratepayers, SCE will seek regulatory approvals for the Arizona portion
SCE Solar Rooftop Program A. 08-03-015 03/21/08 Hearings completed 11/06/08 Briefs filed 11/25/08 Reply Briefs filed 12/10/08 Proposed decision received 03/13/09 Final Decision 2nd quarter 2009
1 CPUC has approved A. 05-04-015 via D. 07-01-040 and FERC has declared the region a National Interest Electric Transmission Corridor (N.I.E.T.C.).
May 8, 2009 27 EDISON INTERNATIONAL®
Leading the Way in Electricity SM
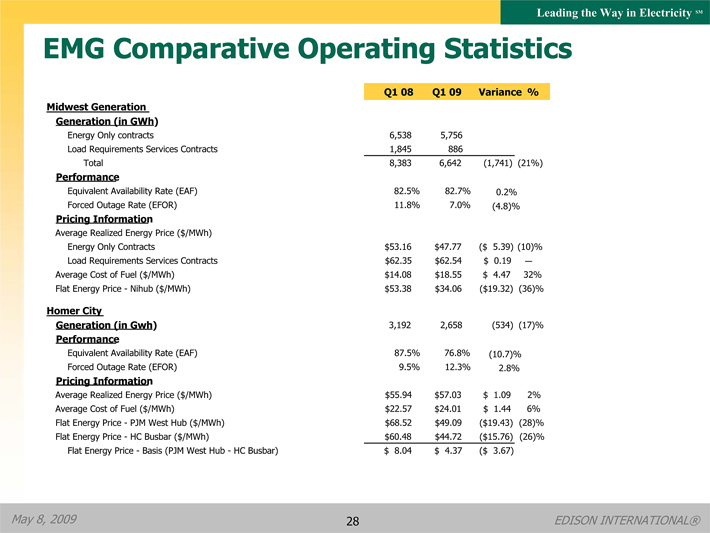
EMG Comparative Operating Statistics
Q1 08 Q1 09 Variance %
Midwest Generation
Generation (in GWh)
Energy Only contracts 6,538 5,756
Load Requirements Services Contracts 1,845 886
Total 8,383 6,642 (1,741) (21%)
Performance
Equivalent Availability Rate (EAF) 82.5% 82.7% 0.2%
Forced Outage Rate (EFOR) 11.8% 7.0% (4.8)%
Pricing Information
Average Realized Energy Price ($/MWh)
Energy Only Contracts $53.16 $47.77 ($ 5.39) (10)%
Load Requirements Services Contracts $62.35 $62.54 $ 0.19 —
Average Cost of Fuel ($/MWh) $14.08 $18.55 $ 4.47 32%
Flat Energy Price - Nihub ($/MWh) $53.38 $34.06 ($19.32) (36)%
Homer City
Generation (in Gwh) 3,192 2,658 (534) (17)%
Performance
Equivalent Availability Rate (EAF) 87.5% 76.8% (10.7)%
Forced Outage Rate (EFOR) 9.5% 12.3% 2.8%
Pricing Information
Average Realized Energy Price ($/MWh) $55.94 $57.03 $ 1.09 2%
Average Cost of Fuel ($/MWh) $22.57 $24.01 $ 1.44 6%
Flat Energy Price - PJM West Hub ($/MWh) $68.52 $49.09 ($19.43) (28)%
Flat Energy Price - HC Busbar ($/MWh) $60.48 $44.72 ($15.76) (26)%
Flat Energy Price - Basis (PJM West Hub - HC Busbar) $ 8.04 $ 4.37 ($ 3.67)
May 8, 2009 28 EDISON INTERNATIONAL®
Leading the Way in Electricity SM
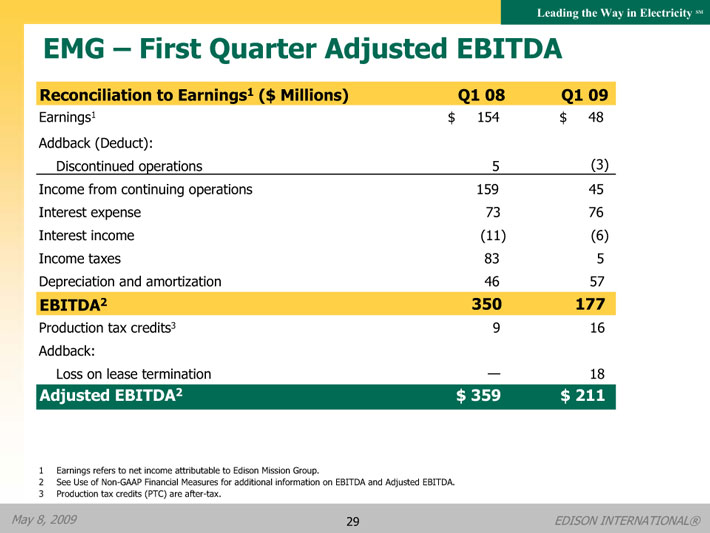
EMG – First Quarter Adjusted EBITDA
Reconciliation to Earnings1 ($ Millions)
Q1 08
Q1 09
Earnings1
$ 154
$ 48
Addback (Deduct):
Discontinued operations
5
(3)
Income from continuing operations
159
45
Interest expense
73
76
Interest income
(11)
(6)
Income taxes
83
5
Depreciation and amortization
46
57
EBITDA2
350
177
Production tax credits3
9
16
Addback:
Loss on lease termination
—
18
Adjusted EBITDA2
$ 359
$ 211
1 Earnings refers to net income attributable to common shareholders of EME.
2 See Use of Non-GAAP Financial Measures for additional information on EBITDA and Adjusted EBITDA.
3 Production tax credits (PTC) are after-tax.
May 8, 2009 29 EDISON INTERNATIONAL®
Leading the Way in Electricity SM
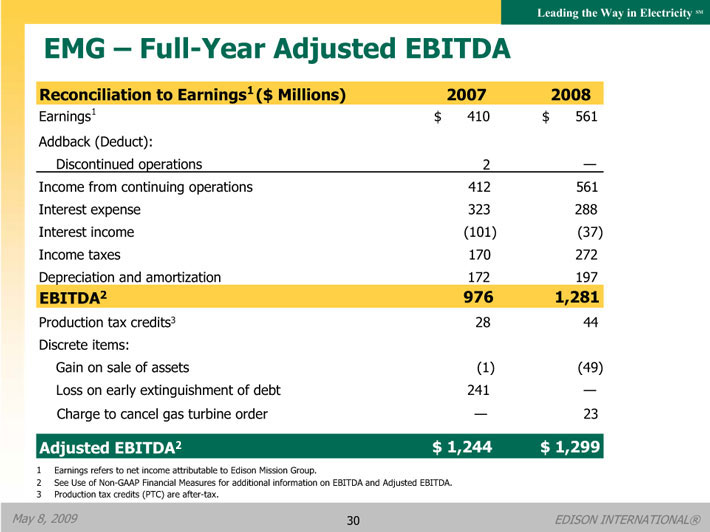
EMG – Full-Year Adjusted EBITDA
Reconciliation to Net Income ($ Millions)
2007
2008
Net income
$ 410
$ 561
Addback (Deduct):
Discontinued operations
2
—
Income from continuing operations
412
561
Interest expense
323
288
Interest income
(101)
(37)
Income taxes
170
272
Depreciation and amortization
172
197
EBITDA1
976
1,281
Production tax credits2
28
44
Discrete items:
Gain on sale of assets
(1)
(49)
Loss on early extinguishment of debt
241
—
Charge to cancel gas turbine order
—
23
Adjusted EBITDA2
$ 1,244
$ 1,299
1 See Use of Non-GAAP Financial Measures for additional information on EBITDA and Adjusted EBITDA.
2 Production tax credits (PTC) are after-tax.
May 8, 2009 30 EDISON INTERNATIONAL®
Leading the Way in Electricity SM
Use of Non-GAAP Financial Measures
Edison International’s earnings are prepared in accordance with generally accepted accounting principles used in the United States and represent the company’s earnings as reported to the Securities and Exchange Commission. Our management uses core earnings and EPS by principal operating subsidiary internally for financial planning and for analysis of performance. We also use core earnings and EPS by principal operating subsidiary as primary performance measurements when communicating with analysts and investors regarding our earnings results and outlook, as it allows us to more accurately compare the company’s ongoing performance across periods. Core earnings exclude discontinued operations and other non-core items and are reconciled to basic earnings per common share.
EPS by principal operating subsidiary is based on the principal operating subsidiaries’ net income attributable to each subsidiary, respectively, and Edison International’s weighted average outstanding common shares. The impact of participating securities (vested stock options that earn dividend equivalents that may participate in undistributed earnings with common stock) for each principal operating subsidiary is not material to each principal operating subsidiary’s EPS and is therefore reflected in the results of the Edison International holding company, which we refer to as EIX parent company and other. EPS and core EPS by principal operating subsidiary are reconciled to basic earnings per common share.
EBITDA is defined as earnings before interest, income taxes, depreciation and amortization. Adjusted EBITDA includes production tax credits from EMG’s wind projects and excludes amounts from gain on the sale of assets, loss on early extinguishment of debt and leases, and impairment of assets and investments. Our management uses Adjusted EBITDA as an important financial measure for evaluating EMG.
A reconciliation of Non-GAAP information to GAAP information, including the impact of participating securities, is included either on the slide where the information appears or on another slide referenced in this presentation.
May 8, 2009 31 EDISON INTERNATIONAL®