Exhibit 99.1
Exhibit 99.1
Leading the Way in Electricity SM
Business Update
September 2009
September 9, 2009 EDISON INTERNATIONAL®
Leading the Way in Electricity SM
Forward-Looking Statements
Statements contained in this presentation about future performance, including, without limitation, earnings, asset and rate base growth, load growth, capital investments, and other statements that are not purely historical, are forward-looking statements. These forward-looking statements reflect our current expectations; however, such statements involve risks and uncertainties. Actual results could differ materially from current expectations. These forward-looking statements represent our expectations only as of the date of this presentation, and Edison International assumes no duty to update them to reflect new information, events or circumstances. Important factors that could cause different results are discussed under the headings “Risk Factors,” and “Management’s Discussion and Analysis” in Edison International’s 2008 Form 10-K, most recent Form 10-Q and other reports filed with the Securities and Exchange Commission, which are available on our website: www.edisoninvestor.com. These filings also provide additional information on historical and other factual data contained in this presentation.
September 9, 2009 EDISON INTERNATIONAL®
Leading the Way in Electricity SM
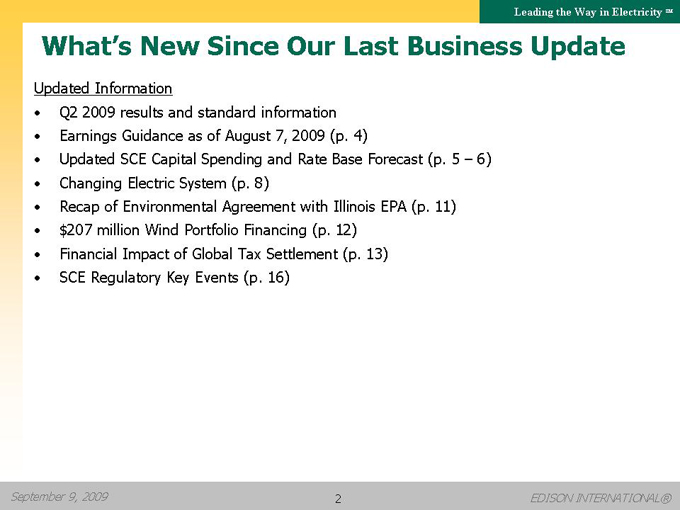
What’s New Since Our Last Business Update
Updated Information
Q2 2009 results and standard information
Earnings Guidance as of August 7, 2009 (p. 4)
Updated SCE Capital Spending and Rate Base Forecast (p. 5 – 6)
Changing Electric System (p. 8)
Recap of Environmental Agreement with Illinois EPA (p. 11)
$207 million Wind Portfolio Financing (p. 12)
Financial Impact of Global Tax Settlement (p. 13)
SCE Regulatory Key Events (p. 16)
September 9, 2009 EDISON INTERNATIONAL®
Leading the Way in Electricity SM
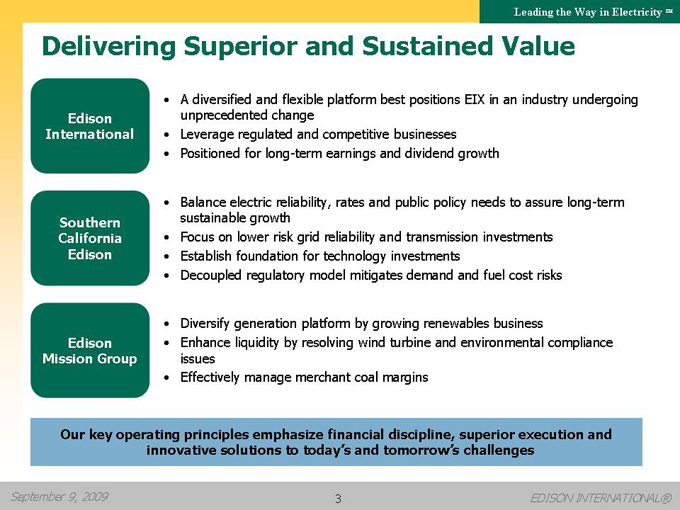
Delivering Superior and Sustained Value
Edison International
A diversified and flexible platform best positions EIX in an industry undergoing unprecedented change
Leverage regulated and competitive businesses
Positioned for long-term earnings and dividend growth
Southern California Edison
Balance electric reliability, rates and public policy needs to assure long-term sustainable growth
Focus on lower risk grid reliability and transmission investments
Establish foundation for technology investments
Decoupled regulatory model mitigates demand and fuel cost risks
Edison Mission Group
Diversify generation platform by growing renewables business
Enhance liquidity by resolving wind turbine and environmental compliance issues
Effectively manage merchant coal margins
Our key operating principles emphasize financial discipline, superior execution and innovative solutions to today’s and tomorrow’s challenges
September 9, 2009 EDISON INTERNATIONAL®

Leading the Way in Electricity SM
2009 Earnings Guidance
Reconciliation of Core Earnings to GAAP Earnings Guidance1
2009 Earnings Guidance 2009 Earnings Guidance
as of 05/08/09 Updated as of 08/07/09
Low Midpoint High Low Midpoint High
EIX core earnings per share $2.90 $3.05 $3.20 $2.90 $3.05 $3.20
Non-Core items (0.92) (0.81) (0.69) (0.72)
EIX GAAP earnings per share $1.98 $2.24 $2.51 $2.18 $2.33 $2.48
Midpoint of 2009 core guidance by key business element:
SCE $2.49
EMG 0.70
EIX parent company and other (0.14)
SCE
2009 average rate base:
Includes 2009 GRC decision
Assumes timely approval of FERC rate case and rooftop solar program
2009 Approved Capital Structure
48% Equity
11.5% Return on Equity
Potential energy efficiency earnings of $0.03 per share included
EMG
Forward hedge position and prices as of 6/30/09
EMMT pre-tax trading margin of $50-100 million
Increased MWG pre-tax operating cost by $90 to $105 million (CAIR compliance and mercury controls)
Pre-tax earnings from Big 4 lower by $45 to $55 million
Prior EMG core and GAAP guidance ranges of $0.50 to $0.90 per share provided March 2, 2009
No significant Edison Capital earnings going forward. Includes $0.06 per share MCV lease termination
Non-Core Items
Mountainview transfer of $0.14 per share in Q3 09, global tax settlement of $(0.85) per share through Q2 09, discontinued operations of $(0.01) per share through Q2 09
Other Assumptions
Normal operating and weather conditions
No changes in GAAP accounting
Excludes discontinued operations and other non-core items except as noted (impacts of the Global Tax Settlement with the IRS through second quarter included in updated GAAP guidance as a non-core item)
See Use of Non-GAAP Financial Measures in Appendix. GAAP earnings refers to basic earnings per common share attributable to Edison International common shareholders. The expected impact of participating securities is $(0.02) per share and is included in EIX parent company and other.
September 9, 2009 EDISON INTERNATIONAL®

Leading the Way in Electricity SM
SCE Capital Investment Forecast1
July 2009
$ Billions
2009 2010 2011 2012 2013
$5 $4 $3 $2 $1 $0
5-Yr Base Case
By Classification
$ %
Solar Rooftop Program 0.8 4
Edison SmartConnect™ 1.2 6
Generation 2.5 12
Transmission 6.2 30
Distribution 9.7 48
Total 20.4 100
5-Yr Base Case
By Proceeding Type %
2009 CPUC Rate Case 33
2012 CPUC Rate Case 25
Other CPUC 12
FERC Rate Cases 30
Total 100
Base Case $3.3 $3.9 $4.3 $4.5 $4.4
Low Case2 $2.7 $3.2 $3.5 $3.7 $3.6
Subject to timely receipt of permitting, licensing and regulatory approvals. Forecast as of July 2009 and includes: (1) CPUC approval of 5 year, 250 MW, $875 million rooftop solar program at SCE and (2) SCE’s decision in May 2009 to not pursue at this time permitting of the Arizona portion of the DPV2 transmission project.
Low Case reflects the potential variability to project investment levels related to execution risk, scope change, delays, regulatory constraints, and other contingencies. The level of variability experienced in 2008 was 18%.
September 9, 2009 EDISON INTERNATIONAL®
Leading the Way in Electricity SM
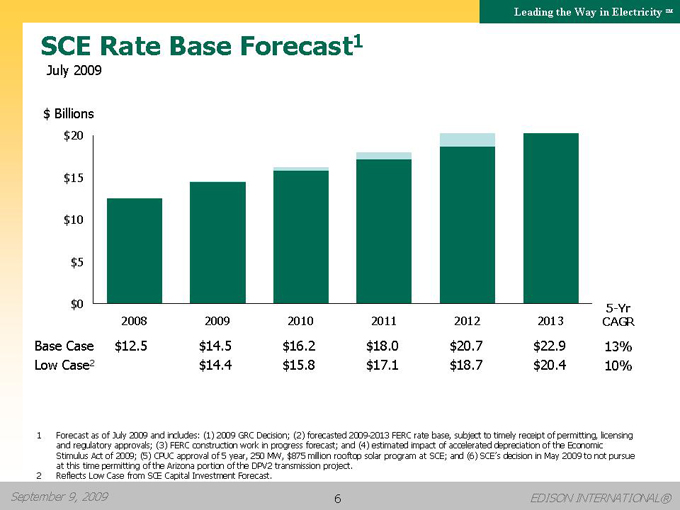
SCE Rate Base Forecast1
July 2009
$ Billions $20
$15 $10 $5 $0
5-Yr
2008 2009 2010 2011 2012 2013 CAGR
Base Case $12.5 $14.5 $16.2 $18.0 $20.7 $22.9 13%
Low Case2 $14.4 $15.8 $17.1 $18.7 $20.4 10%
Forecast as of July 2009 and includes: (1) 2009 GRC Decision; (2) forecasted 2009-2013 FERC rate base, subject to timely receipt of permitting, licensing and regulatory approvals; (3) FERC construction work in progress forecast; and (4) estimated impact of accelerated depreciation of the Economic Stimulus Act of 2009; (5) CPUC approval of 5 year, 250 MW, $875 million rooftop solar program at SCE; and (6) SCE’s decision in May 2009 to not pursue at this time permitting of the Arizona portion of the DPV2 transmission project.
Reflects Low Case from SCE Capital Investment Forecast.
September 9, 2009 EDISON INTERNATIONAL®
Leading the Way in Electricity SM
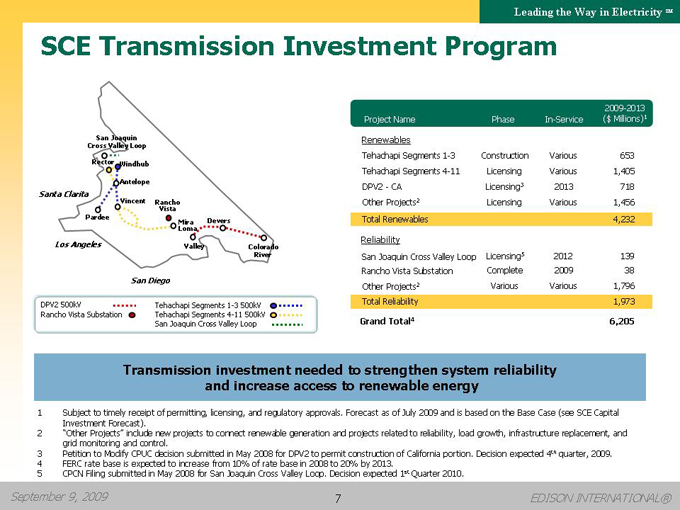
SCE Transmission Investment Program
San Joaquin Cross Valley Loop
SCE
Rector Windhub Service
Territory
Antelope
Santa Clarita Palmdale
Vincent Rancho Vista
Pardee Devers MiraLoma
Los Angeles SantaAna Valley PalmSprings Colorado River
DPV2 500kV
Rancho Vista Substation
Tehachapi Segments 1-3 500kV Tehachapi Segments 4-11 500kV San Joaquin Cross Valley Loop
2009-2013
Project Name Phase In-Service ($ Millions)1
Renewables
Tehachapi Segments 1-3 Construction Various 653
Tehachapi Segments 4-11 Licensing Various 1,405
DPV2—CA Licensing3 2013 718
Other Projects2 Licensing Various 1,456
Total Renewables 4,232
Reliability
San Joaquin Cross Valley Loop Licensing5 2012 139
Rancho Vista Substation Complete 2009 38
Other Projects2 Various Various 1,796
Total Reliability 1,973
Grand Total4 6,205
Transmission investment needed to strengthen system reliability
and increase access to renewable energy
Subject to timely receipt of permitting, licensing, and regulatory approvals. Forecast as of July 2009 and is based on the Base Case (see SCE Capital Investment Forecast).
“Other Projects” include new projects to connect renewable generation and projects related to reliability, load growth, infrastructure replacement, and grid monitoring and control.
Petition to Modify CPUC decision submitted in May 2008 for DPV2 to permit construction of California portion. Decision expected 4th quarter, 2009.
FERC rate base is expected to increase from 10% of rate base in 2008 to 20% by 2013.
CPCN Filing submitted in May 2008 for San Joaquin Cross Valley Loop. Decision expected 1st Quarter 2010.
September 9, 2009 EDISON INTERNATIONAL®
Leading the Way in Electricity SM
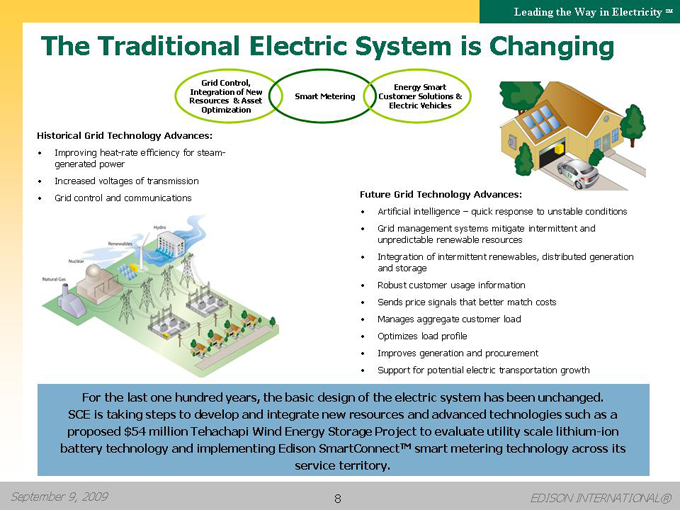
The Traditional Electric System is Changing
Grid Control, Integration of New Resources & Asset Optimization
Smart Metering
Energy Smart Customer Solutions & Electric Vehicles
Historical Grid Technology Advances:
Improving heat-rate efficiency for steam-generated power
Increased voltages of transmission
Grid control and communications
Future Grid Technology Advances:
Artificial intelligence – quick response to unstable conditions
Grid management systems mitigate intermittent and unpredictable renewable resources
Integration of intermittent renewables, distributed generation and storage
Robust customer usage information
Sends price signals that better match costs
Manages aggregate customer load
Optimizes load profile
Improves generation and procurement
Support for potential electric transportation growth
For the last one hundred years, the basic design of the electric system has been unchanged. SCE is taking steps to develop and integrate new resources and advanced technologies such as a proposed $54 million Tehachapi Wind Energy Storage Project to evaluate utility scale lithium-ion battery technology and implementing Edison SmartConnectTM smart metering technology across its service territory.
September 9, 2009 EDISON INTERNATIONAL®
Leading the Way in Electricity SM
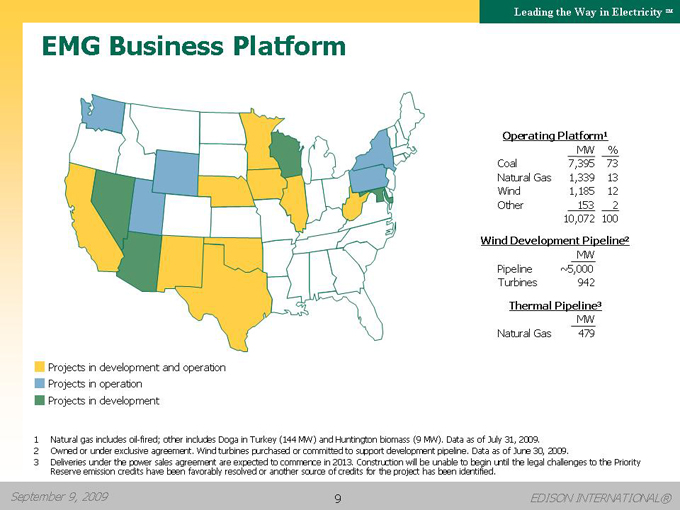
EMG Business Platform
Operating Platform1
MW %
Coal 7,395 73
Natural Gas 1,339 13
Wind 1,185 12
Other 153 2
10,072 100
Wind Development Pipeline2
MW
Pipeline ~5,000
Turbines 942
Thermal Pipeline3
MW
Natural Gas 479
Projects in development and operation
Projects in operation
Projects in development
1 Natural gas includes oil-fired; other includes Doga in Turkey (144 MW) and Huntington biomass (9 MW). Data as of July 31, 2009.
2 Owned or under exclusive agreement. Wind turbines purchased or committed to support development pipeline. Data as of June 30, 2009.
3 Deliveries under the power sales agreement are expected to commence in 2013. Construction will be unable to begin until the legal challenges to the Priority Reserve emission credits have been favorably resolved or another source of credits for the project has been identified.
September 9, 2009 EDISON INTERNATIONAL®
9
Leading the Way in Electricity SM
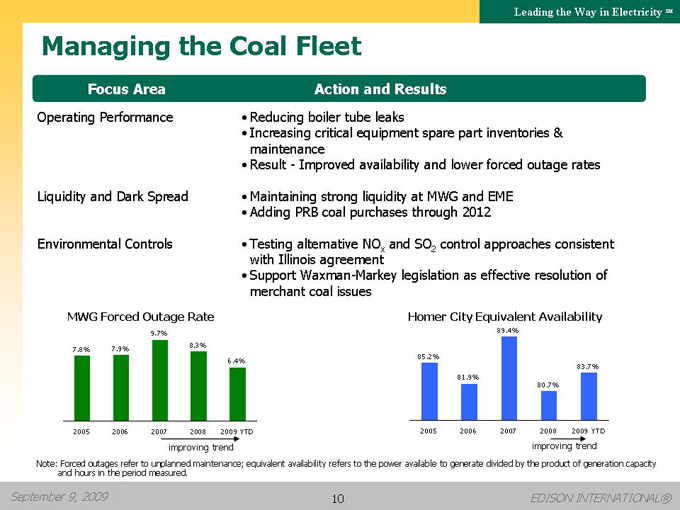
Managing the Coal Fleet
Focus Area Action and Results
Operating Performance
Liquidity and Dark Spread
Environmental Controls
Reducing boiler tube leaks
Increasing critical equipment spare part inventories & maintenance
Result - Improved availability and lower forced outage rates
Maintaining strong liquidity at MWG and EME
Adding PRB coal purchases through 2012
Testing alternative NOx and SO2 control approaches consistent with Illinois agreement
Support Waxman-Markey legislation as effective resolution of merchant coal issues
MWG Forced Outage Rate
9.7%
7.9% 8.3% 7.8%
6.4%
2005 2006 2007 2008 2009 YTD improving trend
Homer City Equivalent Availability
89.4%
85.2%
83.7% 81.9% 80.7%
2005 2006 2007 2008 2009 YTD improving trend
Note: Forced outages refer to unplanned maintenance; equivalent availability refers to the power available to generate divided by the product of generation capacity and hours in the period measured.
September 9, 2009 EDISON INTERNATIONAL®
10

Leading the Way in Electricity SM
Environmental Agreement with Illinois EPA
In 2006, Midwest Generation entered into agreement with Illinois EPA to reduce Mercury, NOx and SO2 emissions at its Illinois coal plants
Key Elements
Mercury (90% removal by 2015)
Installed Dry Sorbent Injection equipment utilizing activated carbon on all units
Evaluating particulate removal upgrades to meet 2015 removal standards
NOx (Beginning Jan. 1, 2012, 0.11 lbs./mmBTU average annual emission rate)
Testing of Selective Non-Catalytic Reduction (SNCR) utilizing urea injection for NOx removal
Preliminary results conclude emission rate can be met by SNCR only
SO2 (Beginning in 2013, average annual emission rate reductions with final limit of 0.11 lbs./mmBTU by 2019)
Testing sodium based dry sorbent injection
Preliminary results on removal rates favorable
Evaluating impact on particulate removal
Comments
Testing alternative environmental compliance plan to reduce NOx & SO2
Illinois IPA granted permits for testing
Spending capital on SCR or FGD scrubber technologies infeasible given uncertainty with CO2 legislation and commodity price risk
September 9, 2009 EDISON INTERNATIONAL®
11
Leading the Way in Electricity SM
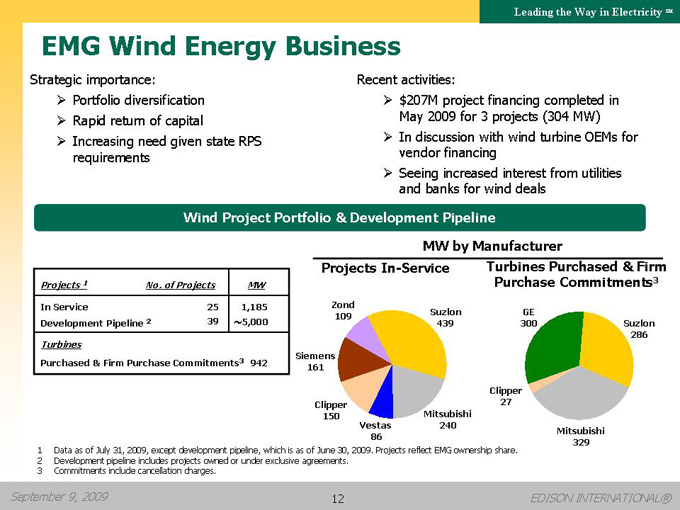
EMG Wind Energy Business
Strategic importance:
Portfolio diversification
Rapid return of capital
Increasing need given state RPS requirements
Recent activities:
$207M project financing completed in May 2009 for 3 projects (304 MW)
In discussion with wind turbine OEMs for vendor financing
Seeing increased interest from utilities and banks for wind deals
Wind Project Portfolio & Development Pipeline
Projects1 No. of Projects MW
In Service 25 1,185
Development Pipeline2 39 ~5,000
Turbines
Purchased & Firm Purchase Commitments3 942
MW by Manufacturer
Projects In-Service Turbines Purchased & Firm Purchase Commitments3
Zond
109 Suzlon GE
439 300 Suzlon 286
Siemens 161
Clipper Clipper 27 150 Mitsubishi Vestas 240
Mitsubishi 86 329
1 Data as of July 31, 2009, except development pipeline, which is as of June 30, 2009. Projects reflect EMG ownership share.
2 Development pipeline includes projects owned or under exclusive agreements.
3 Commitments include cancellation charges.
September 9, 2009 EDISON INTERNATIONAL®
12
Leading the Way in Electricity SM
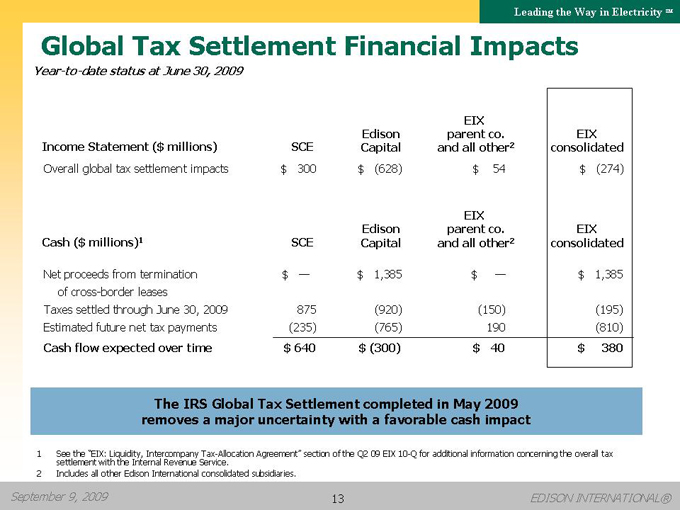
Global Tax Settlement Financial Impacts
Year-to-date status at June 30, 2009
EIX
Edison parent co. EIX
Income Statement ($ millions) SCE Capital and all other2 consolidated
Overall global tax settlement impacts $ 300 $ (628) $ 54 $ (274)
EIX
Edison parent co. EIX
Cash ($ millions)1 SCE Capital and all other2 consolidated
Net proceeds from termination $ — $ 1,385 $ — $ 1,385
of cross-border leases
Taxes settled through June 30, 2009 875 (920) (150) (195)
Estimated future net tax payments (235) (765) 190 (810)
Cash flow expected over time $ 640 $ (300) $ 40 $ 380
The IRS Global Tax Settlement completed in May 2009
removes a major uncertainty with a favorable cash impact
See the “EIX: Liquidity, Intercompany Tax-Allocation Agreement” section of the Q2 09 EIX 10-Q for additional information concerning the overall tax settlement with the Internal Revenue Service.
Includes all other Edison International consolidated subsidiaries.
September 9, 2009 EDISON INTERNATIONAL®
13

Leading the Way in Electricity SM
Appendix
September 9, 2009 EDISON INTERNATIONAL®
14
Leading the Way in Electricity SM
Southern California Edison (SCE)
September 9, 2009 EDISON INTERNATIONAL®
15
Leading the Way in Electricity SM
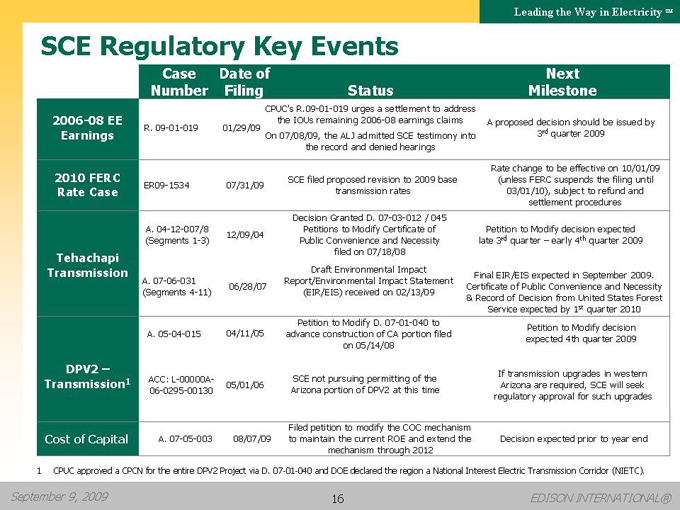
SCE Regulatory Key Events
Case Date of Next
Number Filing Status Milestone
CPUC’s R.09-01-019 urges a settlement to address
2006-08 EE the IOUs remaining 2006-08 earnings claims A proposed decision should be issued by
R. 09-01-019 01/29/09
Earnings On 07/08/09, the ALJ admitted SCE testimony into 3rd quarter 2009
the record and denied hearings
Rate change to be effective on 10/01/09
2010 FERC SCE filed proposed revision to 2009 base (unless FERC suspends the filing until
ER09-1534 07/31/09
Rate Case transmission rates 03/01/10), subject to refund and
settlement procedures
Decision Granted D. 07-03-012 / 045
A. 04-12-007/8 Petitions to Modify Certificate of Petition to Modify decision expected
12/09/04
(Segments 1-3) Public Convenience and Necessity late 3rd quarter – early 4th quarter 2009
Tehachapi filed on 07/18/08
Transmission Draft Environmental Impact Final EIR/EIS expected in September 2009.
A. 07-06-031 Report/Environmental Impact Statement
06/28/07 Certificate of Public Convenience and Necessity
(Segments 4-11) (EIR/EIS) received on 02/13/09 & Record of Decision from United States Forest
Service expected by 1st quarter 2010
Petition to Modify D. 07-01-040 to Petition to Modify decision
A. 05-04-015 04/11/05 advance construction of CA portion filed expected 4th quarter 2009
on 05/14/08
DPV2 – If transmission upgrades in western
Transmission1 ACC: L-00000A- 05/01/06 SCE not pursuing permitting of the Arizona are required, SCE will seek
06-0295-00130 Arizona portion of DPV2 at this time regulatory approval for such upgrades
Filed petition to modify the COC mechanism
Cost of Capital A. 07-05-003 08/07/09 to maintain the current ROE and extend the Decision expected prior to year end
mechanism through 2012
1 CPUC approved a CPCN for the entire DPV2 Project via D. 07-01-040 and DOE declared the region a National Interest Electric Transmission Corridor (NIETC).
September 9, 2009 EDISON INTERNATIONAL®
16
Leading the Way in Electricity SM
Edison Mission Group (EMG)
September 9, 2009 EDISON INTERNATIONAL®
17
Leading the Way in Electricity SM
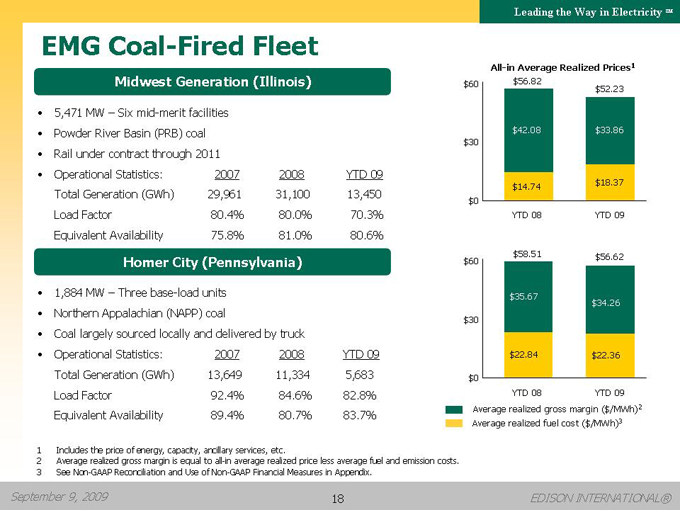
EMG Coal-Fired Fleet
Midwest Generation (Illinois)
5,471 MW – Six mid-merit facilities
Powder River Basin (PRB) coal
Rail under contract through 2011
Operational Statistics: 2007 2008 YTD 09
Total Generation (GWh) 29,961 31,100 13,450
Load Factor 80.4% 80.0% 70.3%
Equivalent Availability 75.8% 81.0% 80.6%
Homer City (Pennsylvania)
1,884 MW – Three base-load units
Northern Appalachian (NAPP) coal
Coal largely sourced locally and delivered by truck
Operational Statistics: 2007 2008 YTD 09
Total Generation (GWh) 13,649 11,334 5,683
Load Factor 92.4% 84.6% 82.8%
Equivalent Availability 89.4% 80.7% 83.7%
All-in Average Realized Prices1
$60 $56.82
$52.23
$42.08 $33.86 $30
$14.74 $18.37 $0 YTD 08 YTD 09
$58.51 $56.62 $60
$35.67
$34.26 $30
$22.84 $22.36
$0
YTD 08 YTD 09 Average realized gross margin ($/MWh)2 Average realized fuel cost ($/MWh)3
Includes the price of energy, capacity, ancillary services, etc.
Average realized gross margin is equal to all-in average realized price less average fuel and emission costs.
See Non-GAAP Reconciliation and Use of Non-GAAP Financial Measures in Appendix.
September 9, 2009 EDISON INTERNATIONAL®
18
Leading the Way in Electricity SM
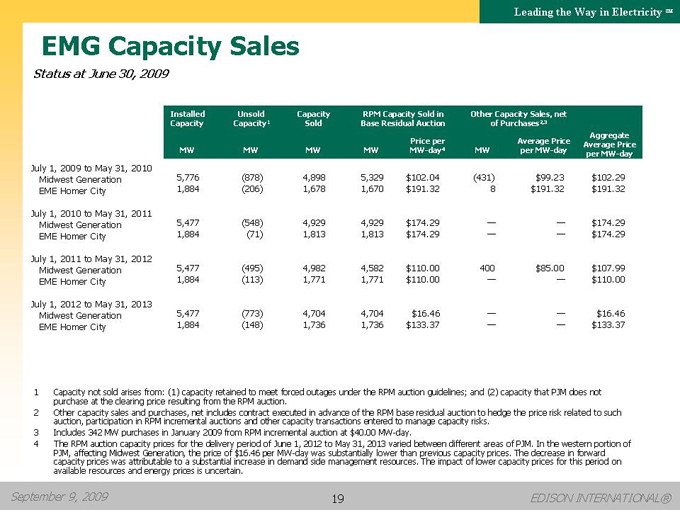
EMG Capacity Sales
Status at June 30, 2009
Installed Unsold Capacity RPM Capacity Sold in Other Capacity Sales, net
Capacity Capacity1 Sold Base Residual Auction of Purchases2,3
Aggregate
Price per Average Price Average Price
MW MW MW MW MW-day4 MW per MW-day per MW-day
July 1, 2009 to May 31, 2010
Midwest Generation 5,776 (878) 4,898 5,329 $102.04 (431) $99.23 $102.29
EME Homer City 1,884 (206) 1,678 1,670 $191.32 8 $191.32 $191.32
July 1, 2010 to May 31, 2011
Midwest Generation 5,477 (548) 4,929 4,929 $174.29 — — $174.29
EME Homer City 1,884 (71) 1,813 1,813 $174.29 — — $174.29
July 1, 2011 to May 31, 2012
Midwest Generation 5,477 (495) 4,982 4,582 $110.00 400 $85.00 $107.99
EME Homer City 1,884 (113) 1,771 1,771 $110.00 — — $110.00
July 1, 2012 to May 31, 2013
Midwest Generation 5,477 (773) 4,704 4,704 $16.46 — — $16.46
EME Homer City 1,884 (148) 1,736 1,736 $133.37 — — $133.37
Capacity not sold arises from: (1) capacity retained to meet forced outages under the RPM auction guidelines; and (2) capacity that PJM does not purchase at the clearing price resulting from the RPM auction.
Other capacity sales and purchases, net includes contract executed in advance of the RPM base residual auction to hedge the price risk related to such auction, participation in RPM incremental auctions and other capacity transactions entered to manage capacity risks.
Includes 342 MW purchases in January 2009 from RPM incremental auction at $40.00 MW-day.
The RPM auction capacity prices for the delivery period of June 1, 2012 to May 31, 2013 varied between different areas of PJM. In the western portion of PJM, affecting Midwest Generation, the price of $16.46 per MW-day was substantially lower than previous capacity prices. The decrease in forward capacity prices was attributable to a substantial increase in demand side management resources. The impact of lower capacity prices for this period on available resources and energy prices is uncertain.
September 9, 2009 EDISON INTERNATIONAL®
19
Leading the Way in Electricity SM
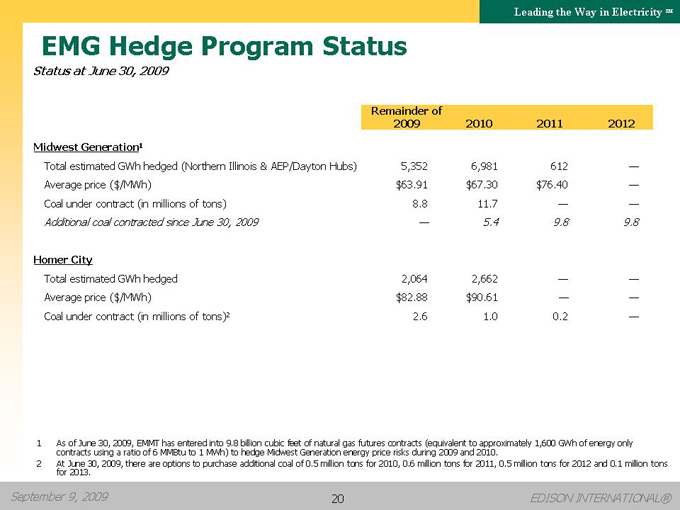
EMG Hedge Program Status
Status at June 30, 2009
Remainder of
2009 2010 2011 2012
Midwest Generation1
Total estimated GWh hedged (Northern Illinois & AEP/Dayton Hubs) 5,352 6,981 612 —
Average price ($/MWh) $63.91 $67.30 $76.40 —
Coal under contract (in millions of tons) 8.8 11.7 — —
Additional coal contracted since June 30, 2009 — 5.4 9.8 9.8
Homer City
Total estimated GWh hedged 2,064 2,662 — —
Average price ($/MWh) $82.88 $90.61 — —
Coal under contract (in millions of tons)2 2.6 1.0 0.2 —
1 As of June 30, 2009, EMMT has entered into 9.8 billion cubic feet of natural gas futures contracts (equivalent to approximately 1,600 GWh of energy only contracts using a ratio of 6 MMBtu to 1 MWh) to hedge Midwest Generation energy price risks during 2009 and 2010.
2 At June 30, 2009, there are options to purchase additional coal of 0.5 million tons for 2010, 0.6 million tons for 2011, 0.5 million tons for 2012 and 0.1 million tons for 2013.
September 9, 2009 EDISON INTERNATIONAL®
20
Leading the Way in Electricity SM
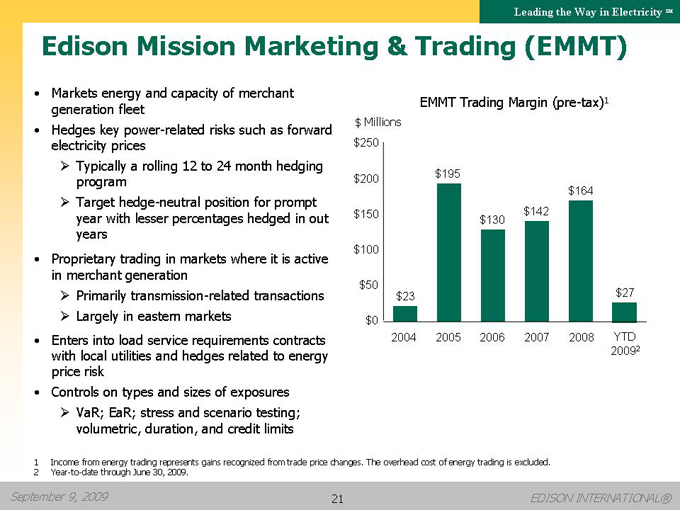
Edison Mission Marketing & Trading (EMMT)
Markets energy and capacity of merchant generation fleet
Hedges key power-related risks such as forward electricity prices
Typically a rolling 12 to 24 month hedging program
Target hedge-neutral position for prompt year with lesser percentages hedged in out years
Proprietary trading in markets where it is active in merchant generation
Primarily transmission-related transactions
Largely in eastern markets
Enters into load service requirements contracts with local utilities and hedges related to energy price risk
Controls on types and sizes of exposures
VaR; EaR; stress and scenario testing; volumetric, duration, and credit limits
EMMT Trading Margin (pre-tax)1 $ Millions $250
$200 $195 $164 $150 $142 $130
$100
$50
$23 $27 $0 2004 2005 2006 2007 2008 YTD
20092
Income from energy trading represents gains recognized from trade price changes. The overhead cost of energy trading is excluded.
Year-to-date through June 30, 2009.
September 9, 2009 EDISON INTERNATIONAL®
21
Leading the Way in Electricity SM
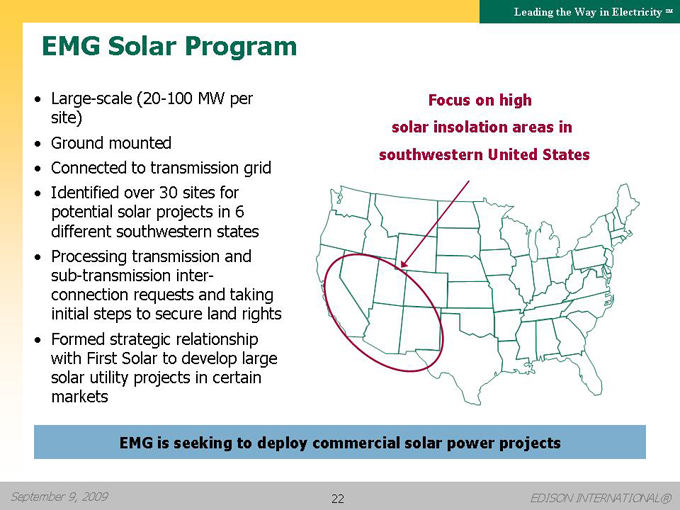
EMG Solar Program
Large-scale (20-100 MW per site)
Ground mounted
Connected to transmission grid
Identified over 30 sites for potential solar projects in 6 different southwestern states
Processing transmission and sub-transmission inter- connection requests and taking initial steps to secure land rights
Formed strategic relationship with First Solar to develop large solar utility projects in certain markets
Focus on high
solar insolation areas in
southwestern United States
EMG is seeking to deploy commercial solar power projects
September 9, 2009 EDISON INTERNATIONAL®
22
Leading the Way in Electricity SM
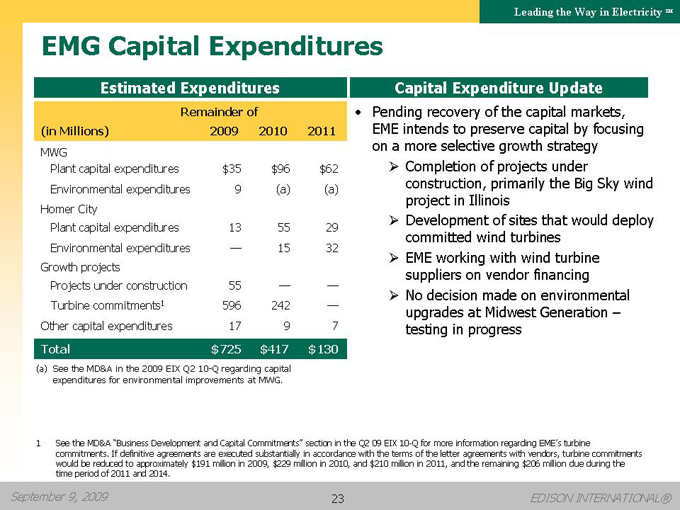
EMG Capital Expenditures
Estimated Expenditures
Remainder of
(in Millions) 2009 2010 2011
MWG
Plant capital expenditures $35 $96 $62
Environmental expenditures 9 (a) (a)
Homer City
Plant capital expenditures 13 55 29
Environmental expenditures ? 15 32
Growth projects
Projects under construction 55 ? ?
Turbine commitments1 596 242 ?
Other capital expenditures 17 9 7
Total $725 $417 $130
(a) | | See the MD&A in the 2009 EIX Q2 10-Q regarding capital |
expenditures for environmental improvements at MWG.
Capital Expenditure Update
Pending recovery of the capital markets, EME intends to preserve capital by focusing on a more selective growth strategy
?Completion of projects under construction, primarily the Big Sky wind project in Illinois
?Development of sites that would deploy committed wind turbines
?EME working with wind turbine suppliers on vendor financing
?No decision made on environmental upgrades at Midwest Generation –testing in progress
See the MD&A “Business Development and Capital Commitments” section in the Q2 09 EIX 10-Q for more information regarding EME’s turbine commitments. If definitive agreements are executed substantially in accordance with the terms of the letter agreements with vendors, turbine commitments would be reduced to approximately $191 million in 2009, $229 million in 2010, and $210 million in 2011, and the remaining $206 million due during the time period of 2011 and 2014.
September 9, 2009 EDISON INTERNATIONAL®
23
Leading the Way in Electricity SM
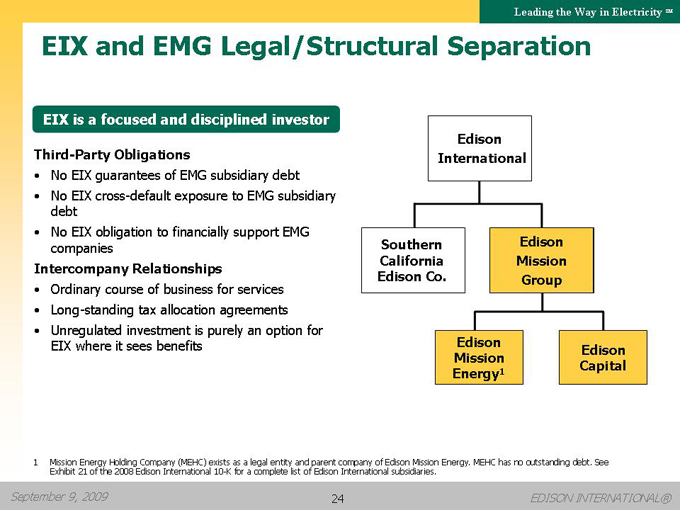
EIX and EMG Legal/Structural Separation
EIX is a focused and disciplined investor
Third-Party Obligations
No EIX guarantees of EMG subsidiary debt
No EIX cross-default exposure to EMG subsidiary debt
No EIX obligation to financially support EMG companies
Intercompany Relationships
Ordinary course of business for services
Long-standing tax allocation agreements
Unregulated investment is purely an option for EIX where it sees benefits
Edison
International
Southern California Edison Co.
Edison
Mission
Group
Edison Mission Energy1
Edison Capital
Mission Energy Holding Company (MEHC) exists as a legal entity and parent company of Edison Mission Energy. MEHC has no outstanding debt. See Exhibit 21 of the 2008 Edison International 10-K for a complete list of Edison International subsidiaries.
September 9, 2009 EDISON INTERNATIONAL®
24
Leading the Way in Electricity SM
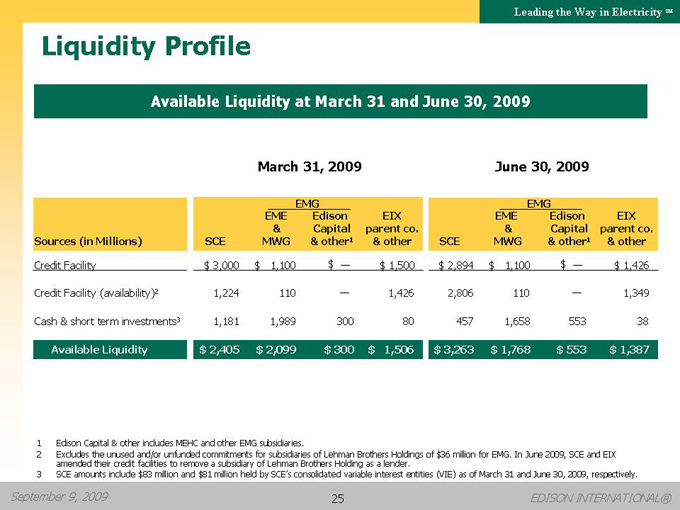
Liquidity Profile
Available Liquidity at March 31 and June 30, 2009
March 31, 2009 June 30, 2009
EMG EMG
EME Edison EIX EME Edison EIX
& Capital parent co. & Capital parent co.
Sources (in Millions) SCE MWG & other1 & other SCE MWG & other1 & other
Credit Facility $ 3,000 $ 1,100 $ ? $ 1,500 $ 2,894 $ 1,100 $ ? $ 1,426
Credit Facility (availability)2 1,224 110 ? 1,426 2,806 110 ? 1,349
Cash & short term investments3 1,181 1,989 300 80 457 1,658 553 38
Available Liquidity $ 2,405 $ 2,099 $ 300 $ 1,506 $ 3,263 $ 1,768 $ 553 $ 1,387
Edison Capital & other includes MEHC and other EMG subsidiaries.
Excludes the unused and/or unfunded commitments for subsidiaries of Lehman Brothers Holdings of $36 million for EMG. In June 2009, SCE and EIX amended their credit facilities to remove a subsidiary of Lehman Brothers Holding as a lender.
SCE amounts include $83 million and $81 million held by SCE’s consolidated variable interest entities (VIE) as of March 31 and June 30, 2009, respectively.
September 9, 2009 EDISON INTERNATIONAL®
25
Leading the Way in Electricity SM
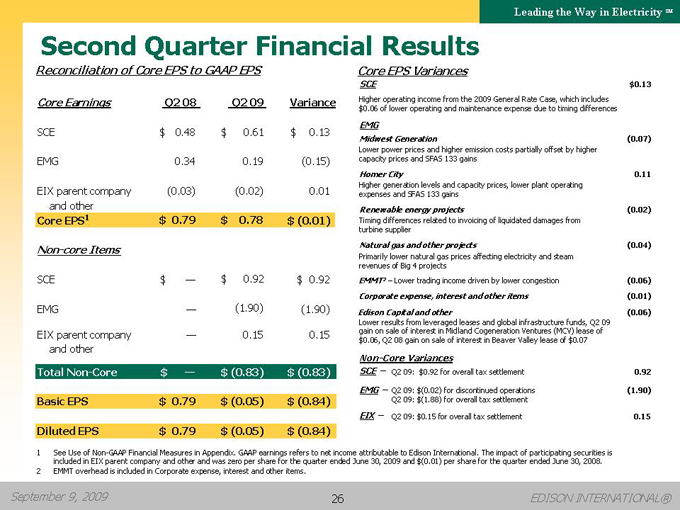
Second Quarter Financial Results
Reconciliation of Core EPS to GAAP EPS
Core Earnings Q2 08 Q2 09 Variance
SCE $ 0.48 $ 0.61 $ 0.13
EMG 0.34 0.19 (0.15)
EIX parent company (0.03) (0.02) 0.01
and other
Core EPS 1 $ 0.79 $ 0.78 $ (0.01)
Non-core Items
SCE $ — $ 0.92 $ 0.92
EMG — (1.90) (1.90)
EIX parent company — 0.15 0.15
and other
Total Non-Core $ — $ (0.83) $ (0.83)
Basic EPS $ 0.79 $ (0.05) $ (0.84)
Diluted EPS $ 0.79 $ (0.05) $ (0.84)
Core EPS Variances
SCE $0.13
Higher operating income from the 2009 General Rate Case, which includes
$0.06 of lower operating and maintenance expense due to timing differences
EMG
Midwest Generation (0.07)
Lower power prices and higher emission costs partially offset by higher
capacity prices and SFAS 133 gains
Homer City 0.11
Higher generation levels and capacity prices, lower plant operating
expenses and SFAS 133 gains
Renewable energy projects (0.02)
Timing differences related to invoicing of liquidated damages from
turbine supplier
Natural gas and other projects (0.04)
Primarily lower natural gas prices affecting electricity and steam
revenues of Big 4 projects
EMMT2 – Lower trading income driven by lower congestion (0.06)
Corporate expense, interest and other items (0.01)
Edison Capital and other (0.06)
Lower results from leveraged leases and global infrastructure funds, Q2 09
gain on sale of interest in Midland Cogeneration Ventures (MCV) lease of
$0.06, Q2 08 gain on sale of interest in Beaver Valley lease of $0.07
Non-Core Variances
SCE – Q2 09: $0.92 for overall tax settlement 0.92
EMG – Q2 09: $(0.02) for discontinued operations (1.90)
Q2 09: $(1.88) for overall tax settlement
EIX – Q2 09: $0.15 for overall tax settlement 0.15
See Use of Non-GAAP Financial Measures in Appendix. GAAP earnings refers to net income attributable to Edison International. The impact of participating securities is included in EIX parent company and other and was zero per share for the quarter ended June 30, 2009 and $(0.01) per share for the quarter ended June 30, 2008.
EMMT overhead is included in Corporate expense, interest and other items.
September 9, 2009 EDISON INTERNATIONAL®
26
Leading the Way in Electricity SM
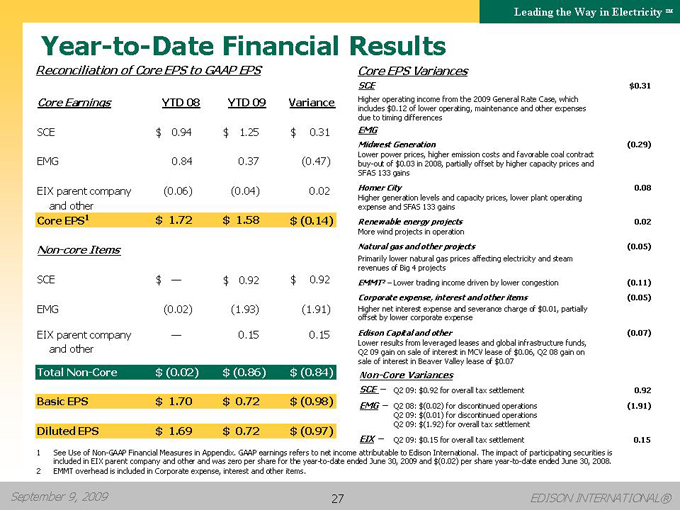
Year-to-Date Financial Results
Reconciliation of Core EPS to GAAP EPS
Core Earnings YTD 08 YTD 09 Variance
SCE $ 0.94 $ 1.25 $ 0.31
EMG 0.84 0.37 (0.47)
EIX parent company (0.06) (0.04) 0.02
and other
Core EPS 1 $ 1.72 $ 1.58 $ (0.14)
Non-core Items
SCE $ — $ 0.92 $ 0.92
EMG (0.02) (1.93) (1.91)
EIX parent company — 0.15 0.15
and other
Total Non-Core $ (0.02) $ (0.86) $ (0.84)
Basic EPS $ 1.70 $ 0.72 $ (0.98)
Diluted EPS $ 1.69 $ 0.72 $ (0.97)
Core EPS Variances
SCE $0.31
Higher operating income from the 2009 General Rate Case, which
includes $0.12 of lower operating, maintenance and other expenses
due to timing differences
EMG
Midwest Generation (0.29)
Lower power prices, higher emission costs and favorable coal contract
buy-out of $0.03 in 2008, partially offset by higher capacity prices and
SFAS 133 gains
Homer City 0.08
Higher generation levels and capacity prices, lower plant operating
expense and SFAS 133 gains
Renewable energy projects 0.02
More wind projects in operation
Natural gas and other projects (0.05)
Primarily lower natural gas prices affecting electricity and steam
revenues of Big 4 projects
EMMT2 – Lower trading income driven by lower congestion (0.11)
Corporate expense, interest and other items (0.05)
Higher net interest expense and severance charge of $0.01, partially
offset by lower corporate expense
Edison Capital and other (0.07)
Lower results from leveraged leases and global infrastructure funds,
Q2 09 gain on sale of interest in MCV lease of $0.06, Q2 08 gain on
sale of interest in Beaver Valley lease of $0.07
Non-Core Variances
SCE – Q2 09: $0.92 for overall tax settlement 0.92
EMG – Q2 08: $(0.02) for discontinued operations (1.91)
Q2 09: $(0.01) for discontinued operations
Q2 09: $(1.92) for overall tax settlement
EIX – Q2 09: $0.15 for overall tax settlement 0.15
See Use of Non-GAAP Financial Measures in Appendix. GAAP earnings refers to net income attributable to Edison International. The impact of participating securities is included in EIX parent company and other and was zero per share for the year-to-date ended June 30, 2009 and $(0.02) per share year-to-date ended June 30, 2008.
EMMT overhead is included in Corporate expense, interest and other items.
September 9, 2009 EDISON INTERNATIONAL®
27
Leading the Way in Electricity SM
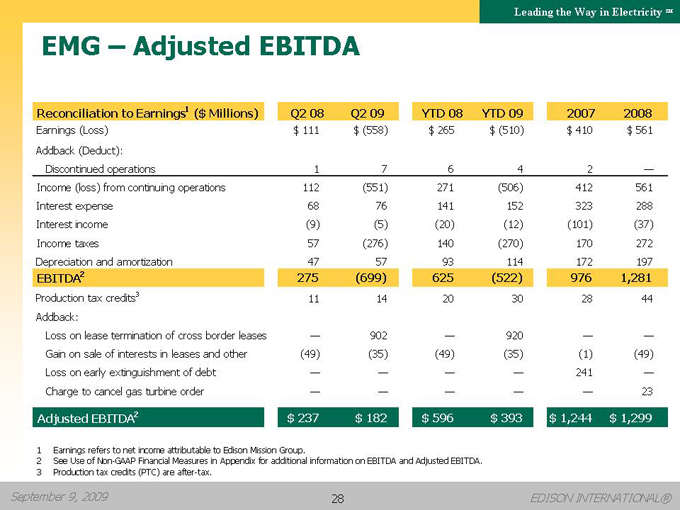
EMG – Adjusted EBITDA
Reconciliation to Earnings1 ($ Millions) Q2 08 Q2 09 YTD 08 YTD 09 2007 2008
Earnings (Loss) $ 111 $ (558) $ 265 $ (510) $ 410 $ 561
Addback (Deduct):
Discontinued operations 1 7 6 4 2 —
Income (loss) from continuing operations 112 (551) 271 (506) 412 561
Interest expense 68 76 141 152 323 288
Interest income (9) (5) (20) (12) (101) (37)
Income taxes 57 (276) 140 (270) 170 272
Depreciation and amortization 47 57 93 114 172 197
EBITDA2 275 (699) 625 (522) 976 1,281
Production tax credits3 11 14 20 30 28 44
Addback:
Loss on lease termination of cross border leases — 902 — 920 — —
Gain on sale of interests in leases and other (49) (35) (49) (35) (1) (49)
Loss on early extinguishment of debt — — — — 241 —
Charge to cancel gas turbine order — — — — — 23
Adjusted EBITDA2 $ 237 $ 182 $ 596 $ 393 $ 1,244 $ 1,299
1 Earnings refers to net income attributable to Edison Mission Group.
2 See Use of Non-GAAP Financial Measures in Appendix for additional information on EBITDA and Adjusted EBITDA.
3 Production tax credits (PTC) are after-tax.
September 9, 2009 EDISON INTERNATIONAL®
28
Leading the Way in Electricity SM
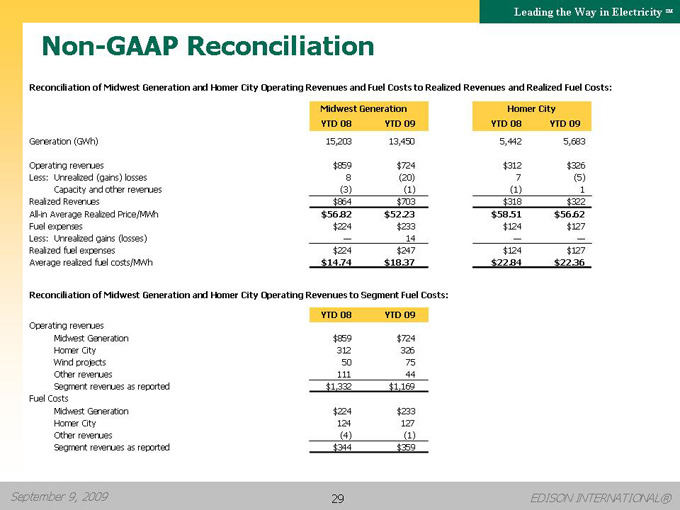
Non-GAAP Reconciliation
Reconciliation of Midwest Generation and Homer City Operating Revenues and Fuel Costs to Realized Revenues and Realized Fuel Costs:
Midwest Generation Homer City
YTD 08 YTD 09 YTD 08 YTD 09
Generation (GWh) 15,203 13,450 5,442 5,683
Operating revenues $859 $724 $312 $326
Less: Unrealized (gains) losses 8 (20) 7 (5)
Capacity and other revenues (3) (1) (1) 1
Realized Revenues $864 $703 $318 $322
All-in Average Realized Price/MWh $56.82 $52.23 $58.51 $56.62
Fuel expenses $224 $233 $124 $127
Less: Unrealized gains (losses) — 14 — —
Realized fuel expenses $224 $247 $124 $127
Average realized fuel costs/MWh $14.74 $18.37 $22.84 $22.36
Reconciliation of Midwest Generation and Homer City Operating Revenues to Segment Fuel Costs:
YTD 08 YTD 09
Operating revenues
Midwest Generation $859 $724
Homer City 312 326
Wind projects 50 75
Other revenues 111 44
Segment revenues as reported $1,332 $1,169
Fuel Costs
Midwest Generation $224 $233
Homer City 124 127
Other revenues (4) (1)
Segment revenues as reported $344 $359
September 9, 2009 EDISON INTERNATIONAL®
29
Leading the Way in Electricity SM
Use of Non-GAAP Financial Measures
Edison International’s earnings are prepared in accordance with generally accepted accounting principles used in the United States and represent the company’s earnings as reported to the Securities and Exchange Commission. Our management uses core earnings and EPS by principal operating subsidiary internally for financial planning and for analysis of performance. We also use core earnings and EPS by principal operating subsidiary as primary performance measurements when communicating with analysts and investors regarding our earnings results and outlook, as it allows us to more accurately compare the company’s ongoing performance across periods. Core earnings exclude discontinued operations and other non-core items and are reconciled to basic earnings per common share.
EPS by principal operating subsidiary is based on the principal operating subsidiaries’ net income attributable to the common shareholders of each subsidiary, respectively, and Edison International’s weighted average outstanding common shares. The impact of participating securities (vested stock options that earn dividend equivalents that may participate in undistributed earnings with common stock) for each principal operating subsidiary is not material to each principal operating subsidiary’s EPS and is therefore reflected in the results of the Edison International holding company, which we refer to as EIX parent company and other. EPS and core EPS by principal operating subsidiary are reconciled to basic earnings per common share.
EBITDA is defined as earnings before interest, income taxes, depreciation and amortization. Adjusted EBITDA includes production tax credits from EMG’s wind projects and excludes amounts from gain on the sale of assets, loss on early extinguishment of debt and leases, and impairment of assets and investments. Our management uses Adjusted EBITDA as an important financial measure for evaluating EMG.
The average realized energy price and average realized fuel cost is a non-GAAP performance measure since such statistical measures exclude unrealized gains or losses recorded as operating revenues and unrealized gains or losses recorded as fuel expenses. Management believes that the average realized energy price and average realized fuel cost is more meaningful for investors as it reflects the impact of hedge contracts at the time of actual generation in period-over-period comparisons or as compared to real-time market prices.
A reconciliation of Non-GAAP information to GAAP information, including the impact of participating securities, is included either on the slide where the information appears or on another slide referenced in this presentation.
September 9, 2009 EDISON INTERNATIONAL®
30