Exhibit 99.2

Leading the Way in Electricity SM
Third Quarter 2009 Financial Teleconference
November 6, 2009 EDISON INTERNATIONAL®
Leading the Way in Electricity SM
Forward-Looking Statements
Statements contained in this presentation about future performance, including, without limitation, earnings, asset and rate base growth, load growth, capital investments, and other statements that are not purely historical, are forward-looking statements. These forward-looking statements reflect our current expectations; however, such statements involve risks and uncertainties. Actual results could differ materially from current expectations. These forward-looking statements represent our expectations only as of the date of this presentation, and Edison International assumes no duty to update them to reflect new information, events or circumstances. Important factors that could cause different results are discussed under the headings “Risk Factors,” and “Management’s Discussion and Analysis” in Edison International’s 2008 Form 10-K, most recent Form 10-Q and other reports filed with the Securities and Exchange Commission, which are available on our website: www.edisoninvestor.com. These filings also provide additional information on historical and other factual data contained in this presentation.
November 6, 2009 1 EDISON INTERNATIONAL®
Leading the Way in Electricity SM
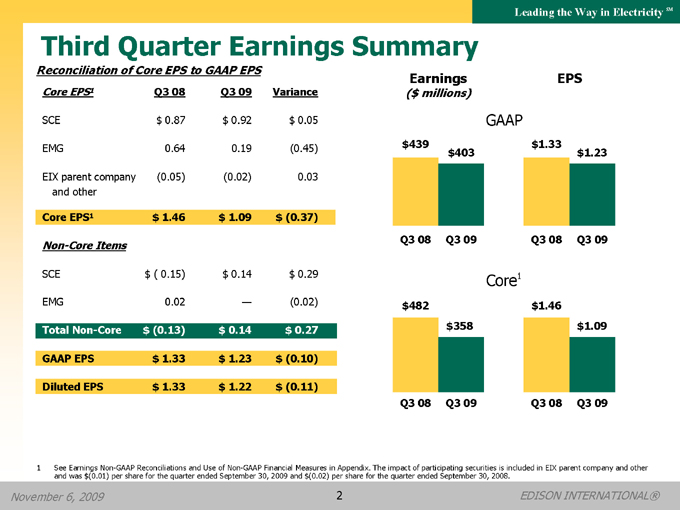
Third Quarter Earnings Summary
Reconciliation of Core EPS to GAAP EPS
Core EPS1 Q3 08 Q3 09 Variance
SCE $ 0.87 $ 0.92 $ 0.05
EMG 0.64 0.19 (0.45)
EIX parent company (0.05) (0.02) 0.03
and other
Core EPS1 $ 1.46 $ 1.09 $ (0.37)
Non-Core Items
SCE $ ( 0.15) $ 0.14 $ 0.29
EMG 0.02 — (0.02)
Total Non-Core $ (0.13) $ 0.14 $ 0.27
GAAP EPS $ 1.33 $ 1.23 $ (0.10)
Diluted EPS $ 1.33 $ 1.22 $ (0.11)
Earnings EPS
($ millions)
GAAP
$439 $1.33
$403 $1.23
Q3 08 Q3 09 Q3 08 Q3 09
Core1
$482 $1.46
$358 $1.09
Q3 08 Q3 09 Q3 08 Q3 09
1 See Earnings Non-GAAP Reconciliations and Use of Non-GAAP Financial Measures in Appendix. The impact of participating securities is included in EIX parent company and other and was $(0.01) per share for the quarter ended September 30, 2009 and $(0.02) per share for the quarter ended September 30, 2008.
November 6, 2009 2 EDISON INTERNATIONAL®
Leading the Way in ElectricitySM
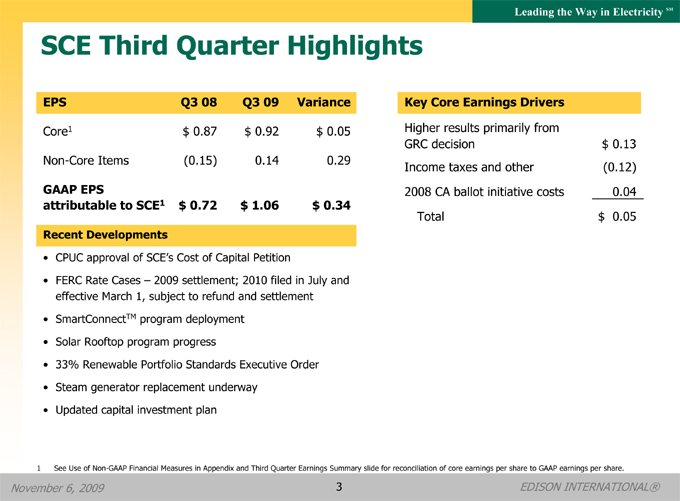
SCE Third Quarter Highlights
EPS Q3 08 Q3 09 Variance
Core1 $ 0.87 $ 0.92 $ 0.05
Non-Core Items (0.15) 0.14 0.29
GAAP EPS attributable to SCE1 $ 0.72 $ 1.06 $ 0.34
Recent Developments
CPUC approval of SCE’s Cost of Capital Petition
FERC Rate Cases — 2009 settlement; 2010 filed in July and effective March 1, subject to refund and settlement
SmartConnectTM program deployment
Solar Rooftop program progress
33% Renewable Portfolio Standards Executive Order
Steam generator replacement underway
Updated capital investment plan
Key Core Earnings Drivers
Higher results primarily from
GRC decision $ 0.13
Income taxes and other (0.12)
2008 CA ballot initiative costs 0.04
Total $ 0.05
1 See Use of Non-GAAP Financial Measures in Appendix and Third Quarter Earnings Summary slide for reconciliation of core earnings per share to GAAP earnings per share.
November 6, 2009 3 EDISON INTERNATIONAL®
Leading the Way in Electricity SM
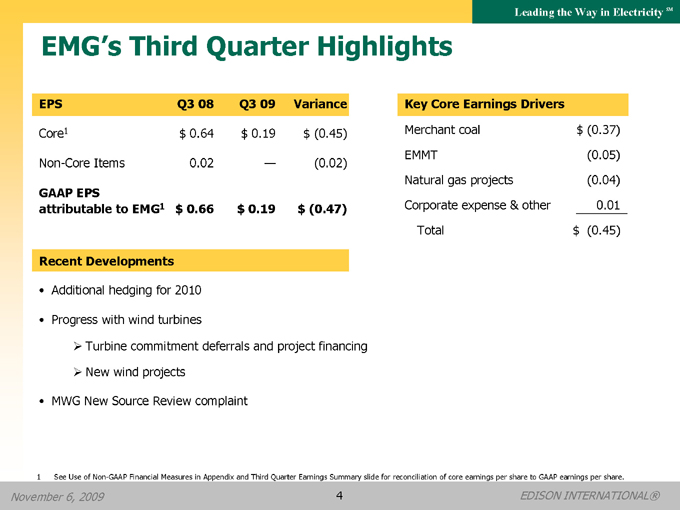
EMG’s Third Quarter Highlights
EPS Q3 08 Q3 09 Variance
Core1 $ 0.64 $ 0.19 $ (0.45)
Non-Core Items 0.02 — (0.02)
GAAP EPS
attributable to EMG1 $ 0.66 $ 0.19 $ (0.47)
Recent Developments
• Additional hedging for 2010
• Progress with wind turbines
Turbine commitment deferrals and project financing
New wind projects
• MWG New Source Review complaint
Key Core Earnings Drivers
Merchant coal $(0.37)
EMMT(0.05)
Natural gas projects(0.04)
Corporate expense & other 0.01
Total $(0.45)
1 See Use of Non-GAAP Financial Measures in Appendix and Third Quarter Earnings Summary slide for reconciliation of core earnings per share to GAAP earnings per share.
November 6, 2009 4 EDISON INTERNATIONAL®
Leading the Way in Electricity SM
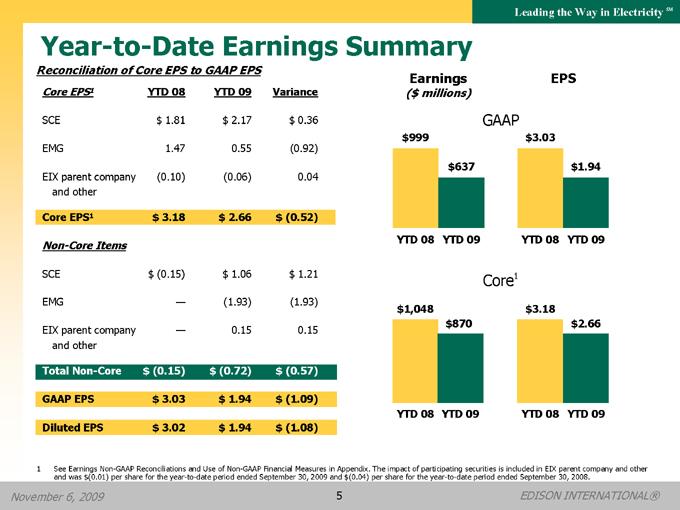
Year-to-Date Earnings Summary
Reconciliation of Core EPS to GAAP EPS
Core EPS1 YTD 08 YTD 09 Variance
SCE $ 1.81 $ 2.17 $ 0.36
EMG 1.47 0.55 (0.92)
EIX parent company (0.10) (0.06) 0.04
and other
Core EPS1 $ 3.18 $ 2.66 $ (0.52)
Non-Core Items
SCE $ (0.15) $ 1.06 $ 1.21
EMG — (1.93) (1.93)
EIX parent company — 0.15 0.15
and other
Total Non-Core $ (0.15) $ (0.72) $ (0.57)
GAAP EPS $ 3.03 $ 1.94 $ (1.09)
Diluted EPS $ 3.02 $ 1.94 $ (1.08)
Earnings EPS
($ millions)
GAAP
$999 $3.03
$637 $1.94
YTD 08 YTD 09 YTD 08 YTD 09
Core1
$1,048 $3.18
$870 $2.66
YTD 08 YTD 09 YTD 08 YTD 09
1 See Earnings Non-GAAP Reconciliations and Use of Non-GAAP Financial Measures in Appendix. The impact of participating securities is included in EIX parent company and other and was $(0.01) per share for the year-to-date period ended September 30, 2009 and $(0.04) per share for the year-to-date period ended September 30, 2008.
November 6, 2009 5 EDISON INTERNATIONAL®
Leading the Way in Electricity SM
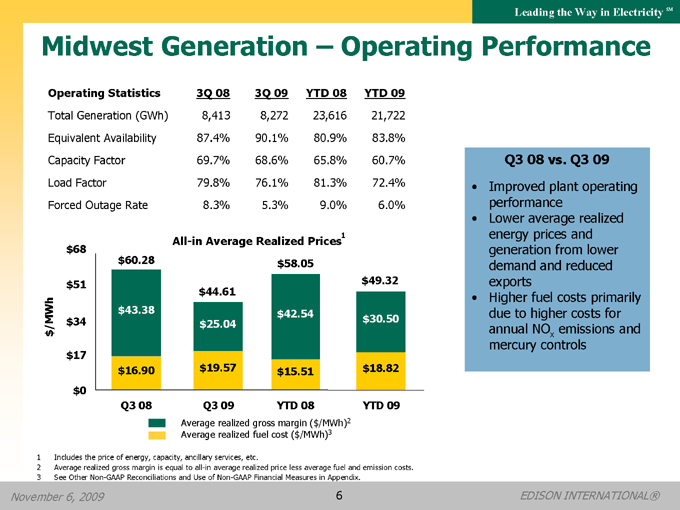
Midwest Generation – Operating Performance
Operating Statistics 3Q 08 3Q 09 YTD 08 YTD 09
Total Generation (GWh) 8,413 8,272 23,616 21,722
Equivalent Availability 87.4% 90.1% 80.9% 83.8%
Capacity Factor 69.7% 68.6% 65.8% 60.7%
Load Factor 79.8% 76.1% 81.3% 72.4%
Forced Outage Rate 8.3% 5.3% 9.0% 6.0%
All-in Average Realized Prices1
$68
$51 $49.32
$44.61
$34 $25.04 $30.50
$17
$16.90 | | $19.57 $15.51 $18.82 |
$0
Q3 08 Q3 09 YTD 08 YTD 09
Average realized gross margin ($/MWh)2
Average realized fuel cost ($/MWh)3
Q3 08 vs. Q3 09
• Improved plant operating performance
• Lower average realized energy prices and generation from lower demand and reduced exports
• Higher fuel costs primarily due to higher costs for annual NOX emissions and mercury controls
1 | | Includes the price of energy, capacity, ancillary services, etc. |
2 | | Average realized gross margin is equal to all-in average realized price less average fuel and emission costs. |
3 | | See Other Non-GAAP Reconciliations and Use of Non-GAAP Financial Measures in Appendix. |
November 6, 2009 6 EDISON INTERNATIONAL®
Leading the Way in Electricity SM
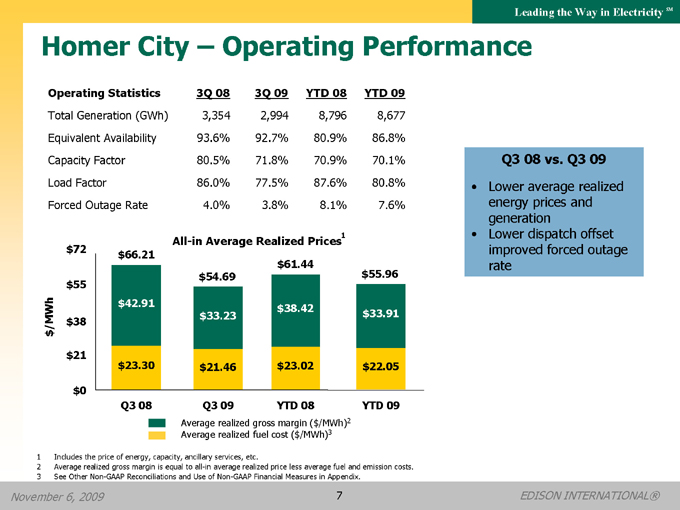
Homer City – Operating Performance
Operating Statistics 3Q 08 3Q 09 YTD 08 YTD 09
Total Generation (GWh) 3,354 2,994 8,796 8,677
Equivalent Availability 93.6% 92.7% 80.9% 86.8%
Capacity Factor 80.5% 71.8% 70.9% 70.1%
Load Factor 86.0% 77.5% 87.6% 80.8%
Forced Outage Rate 4.0% 3.8% 8.1% 7.6%
All-in Average Realized Prices1
$72 $66.21
$61.44
$55 $54.69 $55.96
$38 $33.23 $33.91
$21
$23.30 | | $21.46 $23.02 $22.05 |
$0
Q3 08 Q3 09 YTD 08 YTD 09
Average realized gross margin ($/MWh)2
Average realized fuel cost ($/MWh)3
Q3 08 vs. Q3 09
• Lower average realized energy prices and generation
• Lower dispatch offset improved forced outage rate
1 | | Includes the price of energy, capacity, ancillary services, etc. |
2 | | Average realized gross margin is equal to all-in average realized price less average fuel and emission costs. |
3 | | See Other Non-GAAP Reconciliations and Use of Non-GAAP Financial Measures in Appendix. |
November 6, 2009 7 EDISON INTERNATIONAL®
Leading the Way in ElectricitySM
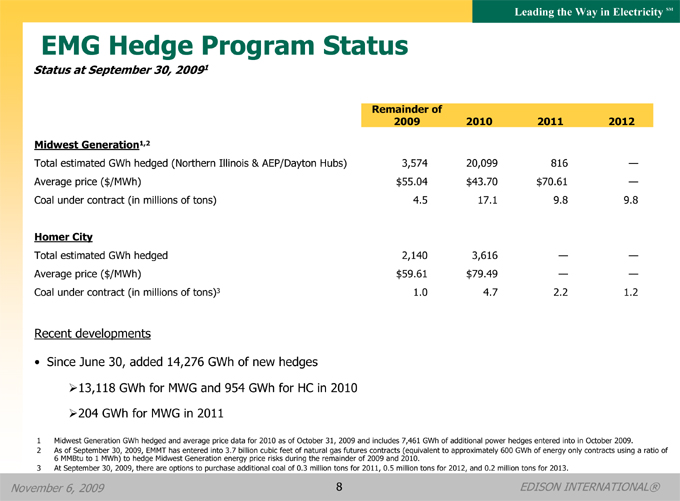
EMG Hedge Program Status
Status at September 30, 20091
Remainder of 2009 2010 2011 2012
Midwest Generation1,2
Total estimated GWh hedged (Northern Illinois & AEP/Dayton Hubs) 3,574 20,099 816 -
Average price ($/MWh) $55.04 $43.70 $70.61 -
Coal under contract (in millions of tons) 4.5 17.1 9.8 9.8
Homer City
Total estimated GWh hedged 2,140 3,616 - -
Average price ($/MWh) $59.61 $79.49 - -
Coal under contract (in millions of tons)3 1.0 4.7 2.2 1.2
Recent developments
Since June 30, added 14,276 GWh of new hedges
13,118 GWh for MWG and 954 GWh for HC in 2010
204 GWh for MWG in 2011
1 Midwest Generation GWh hedged and average price data for 2010 as of October 31, 2009 and includes 7,461 GWh of additional power hedges entered into in October 2009.
2 As of September 30, 2009, EMMT has entered into 3.7 billion cubic feet of natural gas futures contracts (equivalent to approximately 600 GWh of energy only contracts using a ratio of 6 MMBtu to 1 MWh) to hedge Midwest Generation energy price risks during the remainder of 2009 and 2010.
3 At September 30, 2009, there are options to purchase additional coal of 0.3 million tons for 2011, 0.5 million tons for 2012, and 0.2 million tons for 2013.
November 6, 2009 8 EDISON INTERNATIONAL®
Leading the Way in Electricity SM
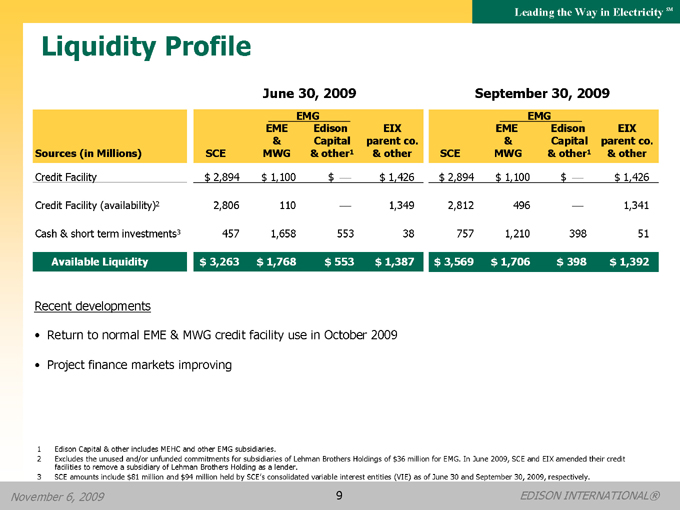
Liquidity Profile
June 30, 2009 September 30, 2009
EMG EMG
EME Edison EIX EME Edison EIX
& Capital parent co. & Capital parent co.
Sources (in Millions) SCE MWG & other1 & other SCE MWG & other1 & other
Credit Facility $ 2,894 $ 1,100 $ — $ 1,426 $ 2,894 $ 1,100 $ — $ 1,426
Credit Facility (availability)2 2,806 110 — 1,349 2,812 496 — 1,341
Cash & short term investments3 457 1,658 553 38 757 1,210 398 51
Available Liquidity $ 3,263 $ 1,768 $ 553 $ 1,387 $ 3,569 $ 1,706 $ 398 $ 1,392
Recent developments
• Return to normal EME & MWG credit facility use in October 2009
• Project finance markets improving
1 | | Edison Capital & other includes MEHC and other EMG subsidiaries. |
2 Excludes the unused and/or unfunded commitments for subsidiaries of Lehman Brothers Holdings of $36 million for EMG. In June 2009, SCE and EIX amended their credit facilities to remove a subsidiary of Lehman Brothers Holding as a lender.
3 SCE amounts include $81 million and $94 million held by SCE’s consolidated variable interest entities (VIE) as of June 30 and September 30, 2009, respectively.
November 6, 2009 9 EDISON INTERNATIONAL®
Leading the Way in Electricity SM
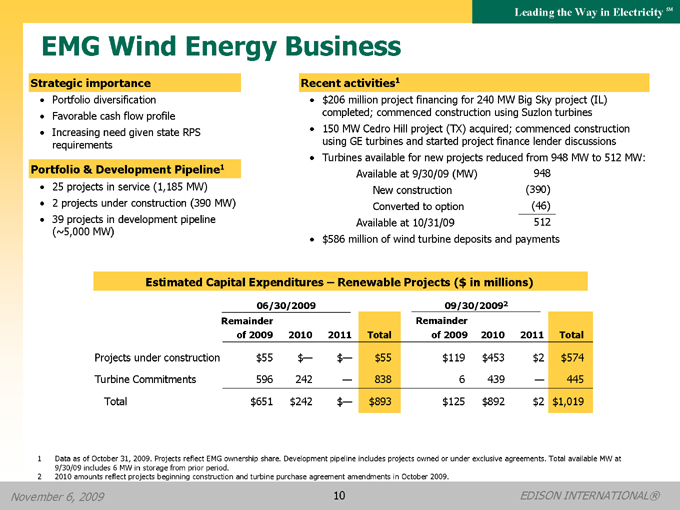
EMG Wind Energy Business
Strategic importance
• Portfolio diversification
• Favorable cash flow profile
• Increasing need given state RPS requirements
Portfolio & Development Pipeline1
• 25 projects in service (1,185 MW)
• | | 2 projects under construction (390 MW) |
• 39 projects in development pipeline (~5,000 MW)
Recent activities1
• $206 million project financing for 240 MW Big Sky project (IL) completed; commenced construction using Suzlon turbines
• 150 MW Cedro Hill project (TX) acquired; commenced construction using GE turbines and started project finance lender discussions
• Turbines available for new projects reduced from 948 MW to 512 MW: Available at 9/30/09 (MW) 948 New construction (390) Converted to option (46) Available at 10/31/09 512
• $586 million of wind turbine deposits and payments
Estimated Capital Expenditures – Renewable Projects ($ in millions)
06/30/2009 09/30/20092
Remainder Remainder
of 2009 2010 2011 Total of 2009 2010 2011 Total
Projects under construction $55 $— $— $55 $119 $453 $2 $574
Turbine Commitments 596 242 — 838 6 439 — 445
Total $651 $242 $— $893 $125 $892 $2 $1,019
1 Data as of October 31, 2009. Projects reflect EMG ownership share. Development pipeline includes projects owned or under exclusive agreements. Total available MW at 9/30/09 includes 6 MW in storage from prior period.
2 | | 2010 amounts reflect projects beginning construction and turbine purchase agreement amendments in October 2009. |
November 6, 2009 10 EDISON INTERNATIONAL®
Leading the Way in Electricity SM
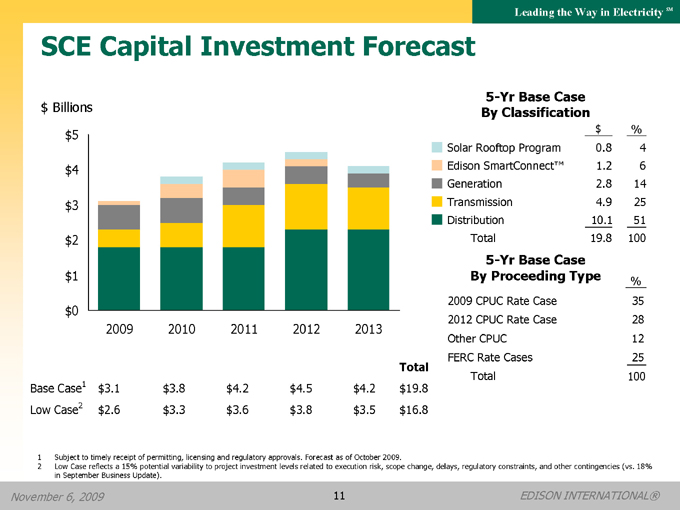
SCE Capital Investment Forecast
$ Billions $5
$4 $3 $2 $1
$0
2009 2010 2011 2012 2013
Total
Base Case1 $3.1 $3.8 $4.2 $4.5 $4.2 $19.8
Low Case2 $2.6 $3.3 $3.6 $3.8 $3.5 $16.8
5-Yr Base Case
By Classification
$%
Solar Rooftop Program 0.8 4
Edison SmartConnect™ 1.2 6
Generation 2.8 14
Transmission 4.9 25
Distribution 10.1 51
Total 19.8 100
5-Yr Base Case
By Proceeding Type%
2009 CPUC Rate Case 35
2012 CPUC Rate Case 28
Other CPUC 12
FERC Rate Cases 25
Total 100
1 | | Subject to timely receipt of permitting, licensing and regulatory approvals. Forecast as of October 2009. |
2 Low Case reflects a 15% potential variability to project investment levels related to execution risk, scope change, delays, regulatory constraints, and other contingencies (vs. 18% in September Business Update).
November 6, 2009 11 EDISON INTERNATIONAL®
Leading the Way in Electricity SM
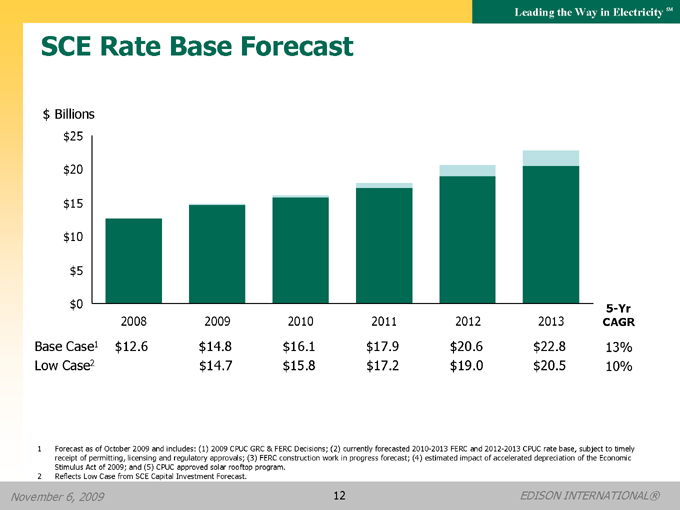
SCE Rate Base Forecast
$ Billions
$25
$20
$15
$10
$5
$0 5-Yr
2008 2009 2010 2011 2012 2013 CAGR
Base Case1 $12.6 $14.8 $16.1 $17.9 $20.6 $22.8 13%
Low Case2 $14.7 $15.8 $17.2 $19.0 $20.5 10%
1 Forecast as of October 2009 and includes: (1) 2009 CPUC GRC & FERC Decisions; (2) currently forecasted 2010-2013 FERC and 2012-2013 CPUC rate base, subject to timely receipt of permitting, licensing and regulatory approvals; (3) FERC construction work in progress forecast; (4) estimated impact of accelerated depreciation of the Economic Stimulus Act of 2009; and (5) CPUC approved solar rooftop program.
2 | | Reflects Low Case from SCE Capital Investment Forecast. |
November 6, 2009 12 EDISON INTERNATIONAL®
Leading the Way in Electricity SM
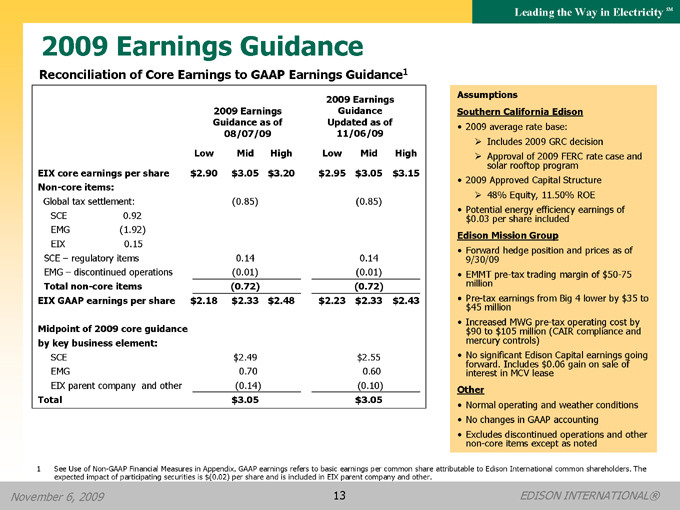
2009 Earnings Guidance
Reconciliation of Core Earnings to GAAP Earnings Guidance1
2009 Earnings
2009 Earnings Guidance
Guidance as of Updated as of
08/07/09 11/06/09
Low Mid High Low Mid High
EIX core earnings per share $2.90 $3.05 $3.20 $2.95 $3.05 $3.15
Non-core items:
Global tax settlement: (0.85) (0.85)
SCE 0.92
EMG(1.92)
EIX 0.15
SCE – regulatory items 0.14 0.14
EMG – discontinued operations (0.01) (0.01)
Total non-core items (0.72) (0.72)
EIX GAAP earnings per share $2.18 $2.33 $2.48 $2.23 $2.33 $2.43
Midpoint of 2009 core guidance
by key business element:
SCE $2.49 $2.55
EMG 0.70 0.60
EIX parent company and other (0.14) (0.10)
Total $3.05 $3.05
Assumptions
Southern California Edison
• 2009 average rate base:
Includes 2009 GRC decision
solar Approval rooftop of 2009 program FERC rate case and
• 2009 Approved Capital Structure
48% Equity, 11.50% ROE
• $ Potential 0.03 per energy share included efficiency earnings of
Edison Mission Group
• 9/30/09 Forward hedge position and prices as of • million EMMT pre-tax trading margin of $50-75
• $ Pre 45- tax million earnings from Big 4 lower by $35 to
• $ Increased 90 to $105 MWG million pre—(CAIR tax operating compliance cost and by mercury controls) • forward. No significant Includes Edison $0.06 Capital gain earnings on sale of going interest in MCV lease
Other
• Normal operating and weather conditions
• No changes in GAAP accounting
• non Excludes -core discontinued items except operations as noted and other
1 See Use of Non-GAAP Financial Measures in Appendix. GAAP earnings refers to basic earnings per common share attributable to Edison International common shareholders. The expected impact of participating securities is $(0.02) per share and is included in EIX parent company and other.
November 6, 2009 13 EDISON INTERNATIONAL®

Leading the Way in Electricity SM
Appendix
November 6, 2009 14 EDISON INTERNATIONAL®
Leading the Way in Electricity SM
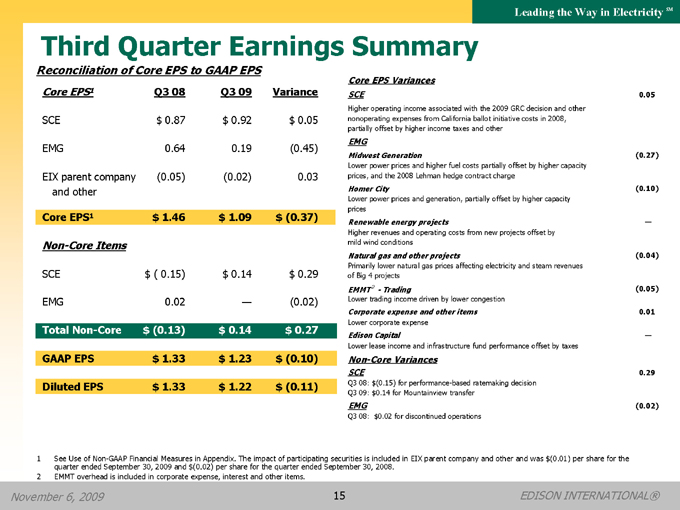
Third Quarter Earnings Summary
Reconciliation of Core EPS to GAAP EPS
Core EPS1 Q3 08 Q3 09 Variance
SCE $ 0.87 $ 0.92 $ 0.05
EMG 0.64 0.19 (0.45)
EIX parent company (0.05)(0.02) 0.03
and other
Core EPS1 $ 1.46 $ 1.09 $ (0.37)
Non-Core Items
SCE $ (0.15) $ 0.14 $ 0.29
EMG 0.02 — (0.02)
Total Non-Core $ (0.13) $ 0.14 $ 0.27
GAAP EPS $ 1.33 $ 1.23 $ (0.10)
Diluted EPS $ 1.33 $ 1.22 $ (0.11)
Core EPS Variances
SCE 0.05
Higher operating income associated with the 2009 GRC decision and other
nonoperating expenses from California ballot initiative costs in 2008,
partially offset by higher income taxes and other
EMG
Midwest Generation(0.27)
Lower power prices and higher fuel costs partially offset by higher capacity
prices, and the 2008 Lehman hedge contract charge
Homer City (0.10)
Lower power prices and generation, partially offset by higher capacity
prices
Renewable energy projects —
Higher revenues and operating costs from new projects offset by
mild wind conditions
Natural gas and other projects(0.04)
Primarily lower natural gas prices affecting electricity and steam revenues
of Big 4 projects
EMMT 2 - Trading(0.05)
Lower trading income driven by lower congestion
Corporate expense and other items 0.01
Lower corporate expense
Edison Capital —
Lower lease income and infrastructure fund performance offset by taxes
Non-Core Variances
SCE 0.29
Q3 08: $(0.15) for performance-based ratemaking decision
Q3 09: $0.14 for Mountainview transfer
EMG (0.02)
Q3 08: $0.02 for discontinued operations
1 See Use of Non-GAAP Financial Measures in Appendix. The impact of participating securities is included in EIX parent company and other and was $(0.01) per share for the quarter ended September 30, 2009 and $(0.02) per share for the quarter ended September 30, 2008.
2 | | EMMT overhead is included in corporate expense, interest and other items. |
November 6, 2009 15 EDISON INTERNATIONAL®
Leading the Way in Electricity SM
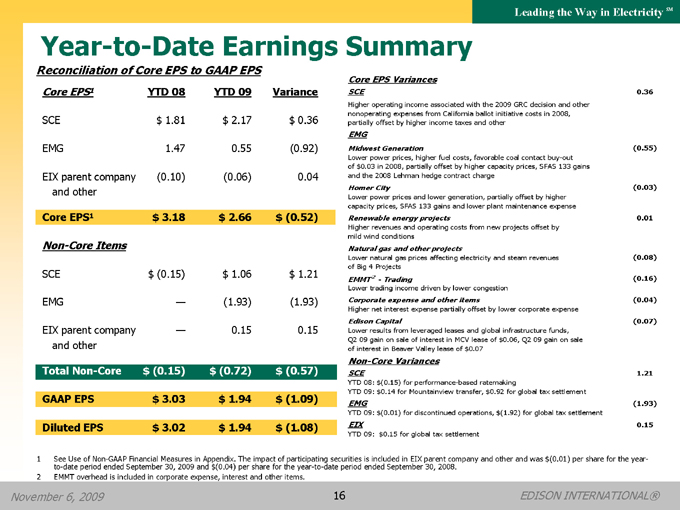
Year-to-Date Earnings Summary
Reconciliation of Core EPS to GAAP EPS
Core EPS1 YTD 08 YTD 09 Variance
SCE $ 1.81 $ 2.17 $ 0.36
EMG 1.47 0.55 (0.92)
EIX parent company (0.10) (0.06) 0.04
and other
Core EPS1 $ 3.18 $ 2.66 $ (0.52)
Non-Core Items
SCE $ (0.15) $ 1.06 $ 1.21
EMG — (1.93) (1.93)
EIX parent company — 0.15 0.15
and other
Total Non-Core $ (0.15) $ (0.72) $ (0.57)
GAAP EPS $ 3.03 $ 1.94 $ (1.09)
Diluted EPS $ 3.02 $ 1.94 $ (1.08)
Core EPS Variances
SCE 0.36
Higher operating income associated with the 2009 GRC decision and other
nonoperating expenses from California ballot initiative costs in 2008,
partially offset by higher income taxes and other
EMG
Midwest Generation (0.55)
Lower power prices, higher fuel costs, favorable coal contact buy-out
of $0.03 in 2008, partially offset by higher capacity prices, SFAS 133 gains
and the 2008 Lehman hedge contract charge
Homer City (0.03)
Lower power prices and lower generation, partially offset by higher
capacity prices, SFAS 133 gains and lower plant maintenance expense
Renewable energy projects 0.01
Higher revenues and operating costs from new projects offset by
mild wind conditions
Natural gas and other projects
Lower natural gas prices affecting electricity and steam revenues(0.08)
of Big 4 Projects
EMMT 2 - Trading (0.16)
Lower trading income driven by lower congestion
Corporate expense and other items(0.04)
Higher net interest expense partially offset by lower corporate expense
Edison Capital (0.07)
Lower results from leveraged leases and global infrastructure funds,
Q2 09 gain on sale of interest in MCV lease of $0.06, Q2 09 gain on sale
of interest in Beaver Valley lease of $0.07
Non-Core Variances
SCE 1.21
YTD 08: $(0.15) for performance-based ratemaking
YTD 09: $0.14 for Mountainview transfer, $0.92 for global tax settlement
EMG (1.93)
YTD 09: $(0.01) for discontinued operations, $(1.92) for global tax settlement
EIX 0.15
YTD 09: $0.15 for global tax settlement
1 See Use of Non-GAAP Financial Measures in Appendix. The impact of participating securities is included in EIX parent company and other and was $(0.01) per share for the year-to-date period ended September 30, 2009 and $(0.04) per share for the year-to-date period ended September 30, 2008.
2 | | EMMT overhead is included in corporate expense, interest and other items. |
November 6, 2009 16 EDISON INTERNATIONAL®
Leading the Way in Electricity SM
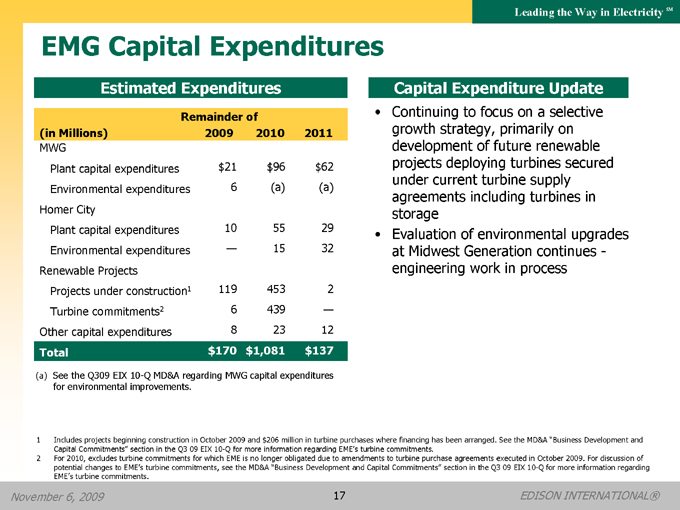
EMG Capital Expenditures
Estimated Expenditures
Remainder of
(in Millions) 2009 2010 2011
MWG
Plant capital expenditures $21 $96 $62
Environmental expenditures 6 (a) (a)
Homer City
Plant capital expenditures 10 55 29
Environmental expenditures — 15 32
Renewable Projects
Projects under construction1 119 453 2
Turbine commitments2 6 439 —
Other capital expenditures 8 23 12
Total $170 $1,081 $137
(a) | | See the Q309 EIX 10-Q MD&A regarding MWG capital expenditures for environmental improvements. |
Capital Expenditure Update
• Continuing to focus on a selective growth strategy, primarily on development of future renewable projects deploying turbines secured under current turbine supply agreements including turbines in storage
• Evaluation of environmental upgrades at Midwest Generation continues -engineering work in process
1 Includes projects beginning construction in October 2009 and $206 million in turbine purchases where financing has been arranged. See the MD&A “Business Development and Capital Commitments” section in the Q3 09 EIX 10-Q for more information regarding EME’s turbine commitments.
2 For 2010, excludes turbine commitments for which EME is no longer obligated due to amendments to turbine purchase agreements executed in October 2009. For discussion of potential changes to EME’s turbine commitments, see the MD&A “Business Development and Capital Commitments” section in the Q3 09 EIX 10-Q for more information regarding EME’s turbine commitments.
November 6, 2009 17 EDISON INTERNATIONAL®
Leading the Way in Electricity SM
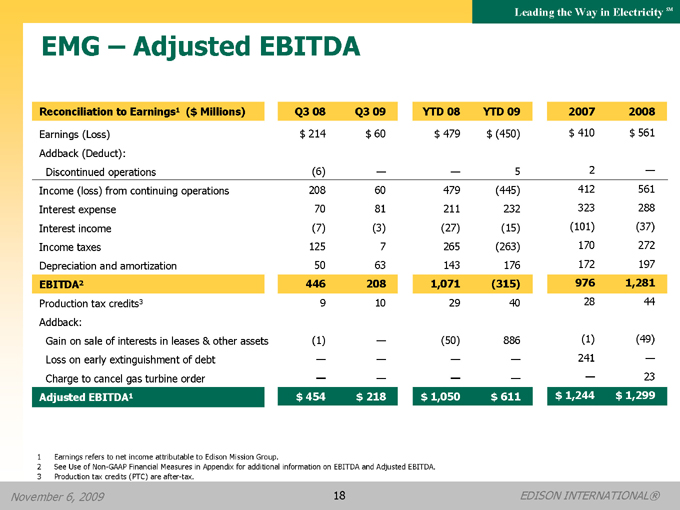
EMG – Adjusted EBITDA
Reconciliation to Earnings1 ($ Millions) Q3 08 Q3 09 YTD 08 YTD 09 2007 2008
Earnings (Loss) $ 214 $ 60 $ 479 $ (450) $ 410 $ 561
Addback (Deduct):
Discontinued operations (6) — — 5 2 —
Income (loss) from continuing operations 208 60 479 (445) 412 561
Interest expense 70 81 211 232 323 288
Interest income(7) (3) (27) (15) (101) (37)
Income taxes 125 7 265 (263) 170 272
Depreciation and amortization 50 63 143 176 172 197
EBITDA2 446 208 1,071 (315) 976 1,281
Production tax credits3 9 10 29 40 28 44
Addback:
Gain on sale of interests in leases & other assets (1) —(50) 886(1)(49)
Loss on early extinguishment of debt — — — — 241 —
Charge to cancel gas turbine order — — — — — 23
Adjusted EBITDA1 $ 454 $ 218 $ 1,050 $ 611 $ 1,244 $ 1,299
1 | | Earnings refers to net income attributable to Edison Mission Group. |
2 | | See Use of Non-GAAP Financial Measures in Appendix for additional information on EBITDA and Adjusted EBITDA. |
3 | | Production tax credits (PTC) are after-tax. |
November 6, 2009 18 EDISON INTERNATIONAL®
Leading the Way in Electricity SM
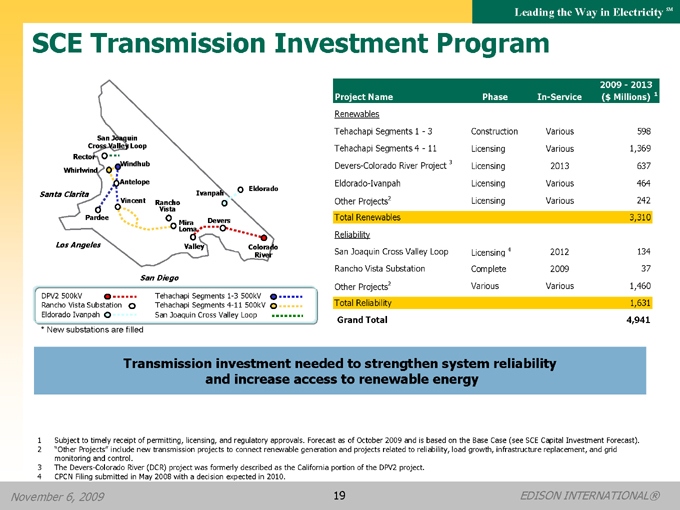
SCE Transmission Investment Program
San Joaquin
Cross Valley Loop
Rector
Windhub
Whirlwind
Antelope
Santa Clarita Ivanpah Eldorado
Vincent Rancho Vista
Pardee
Mira Loma Devers
Los Angeles Valley Colorado
River
San Diego
DPV2 500kV Tehachapi Segments 1-3 500kV
Rancho Vista Substation Tehachapi Segments 4-11 500kV
Eldorado Ivanpah San Joaquin Cross Valley Loop
* | | New substations are filled |
2009 - 2013
Project Name Phase In-Service ($ Millions) 1
Renewables
Tehachapi Segments 1 - 3 Construction Various 598
Tehachapi Segments 4 - 11 Licensing Various 1,369
Devers-Colorado River Project3 Licensing 2013 637
Eldorado-Ivanpah Licensing Various 464
Other Projects2 Licensing Various 242
Total Renewables 3,310
Reliability
San Joaquin Cross Valley Loop Licensing4 2012 134
Rancho Vista Substation Complete 2009 37
Other Projects2 Various Various 1,460
Total Reliability 1,631
Grand Total 4,941
Transmission investment needed to strengthen system reliability and increase access to renewable energy
1 Subject to timely receipt of permitting, licensing, and regulatory approvals. Forecast as of October 2009 and is based on the Base Case (see SCE Capital Investment Forecast).
2 “Other Projects” include new transmission projects to connect renewable generation and projects related to reliability, load growth, infrastructure replacement, and grid monitoring and control.
3 | | The Devers-Colorado River (DCR) project was formerly described as the California portion of the DPV2 project. |
4 | | CPCN Filing submitted in May 2008 with a decision expected in 2010. |
November 6, 2009 19 EDISON INTERNATIONAL®
Leading the Way in Electricity SM
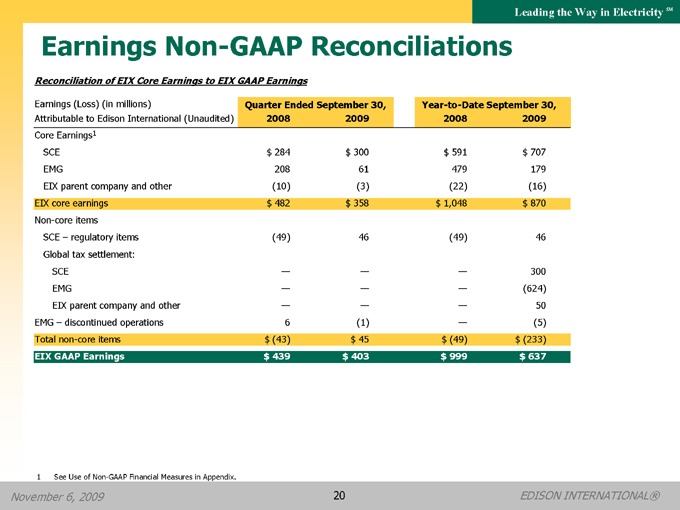
Earnings Non-GAAP Reconciliations
Reconciliation of EIX Core Earnings to EIX GAAP Earnings
Earnings (Loss) (in millions) Quarter Ended September 30, Year-to-Date September 30,
Attributable to Edison International (Unaudited) 2008 2009 2008 2009
Core Earnings1
SCE $ 284 $ 300 $ 591 $ 707
EMG 208 61 479 179
EIX parent company and other (10) (3) (22) (16)
EIX core earnings $ 482 $ 358 $ 1,048 $ 870
Non-core items
SCE – regulatory items (49) 46 (49) 46
Global tax settlement:
SCE — — — 300
EMG — — —(624)
EIX parent company and other — — — 50
EMG – discontinued operations 6 (1) — (5)
Total non-core items $ (43) $ 45 $ (49) $ (233)
EIX GAAP Earnings $ 439 $ 403 $ 999 $ 637
1 | | See Use of Non-GAAP Financial Measures in Appendix. |
November 6, 2009 20 EDISON INTERNATIONAL®
Leading the Way in ElectricitySM
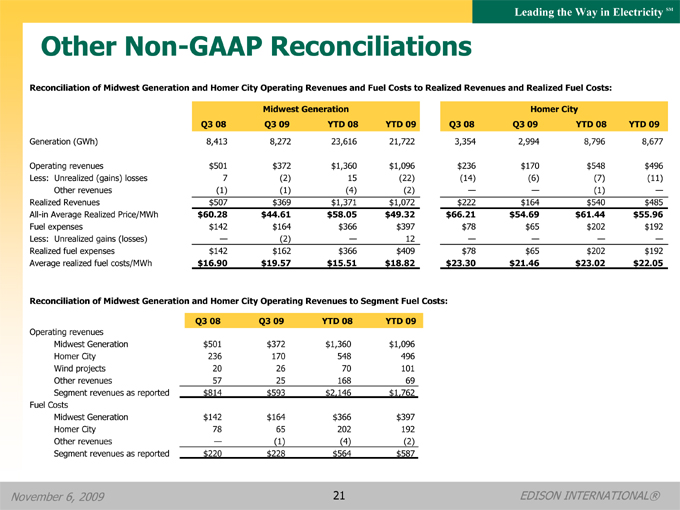
Other Non-GAAP Reconciliations
Reconciliation of Midwest Generation and Homer City Operating Revenues and Fuel Costs to Realized Revenues and Realized Fuel Costs:
Midwest Generation
Q3 08 Q3 09 YTD 08 YTD 09
Generation (GWh) 8,413 8,272 23,616 21,722
Operating revenues $501 $372 $1,360 $1,096
Less: Unrealized (gains) losses 7 (2) 15 (22)
Other revenues (1) (1) (4) (2)
Realized Revenues $507 $369 $1,371 $1,072
All-in Average Realized Price/MWh $60.28 $44.61 $58.05 $49.32
Fuel expenses $142 $164 $366 $397
Less: Unrealized gains (losses) — (2) — 12
Realized fuel expenses $142 $162 $366 $409
Average realized fuel costs/MWh $16.90 $19.57 $15.51 $18.82
Homer City
Q3 08 Q3 09 YTD 08 YTD 09
3,354 2,994 8,796 8,677
$236 $170 $548 $496
(14) (6) (7) (11)
— — (1) —
$222 $164 $540 $485
$66.21 $54.69 $61.44 $55.96
$78 $65 $202 $192
— — — —
$78 $65 $202 $192
$23.30 $21.46 $23.02 $22.05
Reconciliation of Midwest Generation and Homer City Operating Revenues to Segment Fuel Costs:
Q3 08 Q3 09 YTD 08 YTD 09
Operating revenues
Midwest Generation $501 $372 $1,360 $1,096
Homer City 236 170 548 496
Wind projects 20 26 70 101
Other revenues 57 25 168 69
Segment revenues as reported $814 $593 $2,146 $1,762
Fuel Costs
Midwest Generation $142 $164 $366 $397
Homer City 78 65 202 192
Other revenues — (1) (4) (2)
Segment revenues as reported $220 $228 $564 $587
November 6, 2009 21 EDISON INTERNATIONAL®
Leading the Way in Electricity SM
Use of Non-GAAP Financial Measures
Edison International’s earnings are prepared in accordance with generally accepted accounting principles used in the United States and represent the company’s earnings as reported to the Securities and Exchange Commission. Our management uses core earnings and EPS by principal operating subsidiary internally for financial planning and for analysis of performance. We also use core earnings and EPS by principal operating subsidiary as primary performance measurements when communicating with analysts and investors regarding our earnings results and outlook, as it allows us to more accurately compare the company’s ongoing performance across periods.
Core earnings and core earnings per share are defined as GAAP earnings and GAAP earnings per share less discontinued operations and other non-core items. GAAP earnings refers to net income attributable to Edison International or attributable to the common shareholders of each subsidiary and EIX GAAP earnings per share refers to basic earnings per common share attributable to Edison International common shareholders. EPS by principal operating subsidiary is based on the principal operating subsidiaries’ net income attributable to the common shareholders of each subsidiary, respectively, and Edison International’s weighted average outstanding common shares. The impact of participating securities (vested stock options that earn dividend equivalents that may participate in undistributed earnings with common stock) for each principal operating subsidiary is not material to each principal operating subsidiary’s EPS and is therefore reflected in the results of the Edison International holding company, which we refer to as EIX parent company and other.
EBITDA is defined as earnings before interest, income taxes, depreciation and amortization. Adjusted EBITDA includes production tax credits from EMG’s wind projects and excludes amounts from gain on the sale of assets, loss on early extinguishment of debt and leases, and impairment of assets and investments. Our management uses Adjusted EBITDA as an important financial measure for evaluating EMG.
The average realized energy price and average realized fuel cost is a non-GAAP performance measure since such statistical measures exclude unrealized gains or losses recorded as operating revenues and unrealized gains or losses recorded as fuel expenses. Management believes that the average realized energy price and average realized fuel cost is more meaningful for investors as it reflects the impact of hedge contracts at the time of actual generation in period-over-period comparisons or as compared to real-time market prices.
A reconciliation of Non-GAAP information to GAAP information, including the impact of participating securities, is included either on the slide where the information appears or on another slide referenced in this presentation.
November 6, 2009
22 EDISON INTERNATIONAL®