Exhibit 99.1

Exhibit 99.1
Leading the Way in Electricity SM
Business Update
November 2009
November 6, 2009
EDISON INTERNATIONAL®
Leading the Way in Electricity SM
Forward-Looking Statements
Statements contained in this presentation about future performance, including, without limitation, earnings, asset and rate base growth, load growth, capital investments, and other statements that are not purely historical, are forward-looking statements. These forward-looking statements reflect our current expectations; however, such statements involve risks and uncertainties. Actual results could differ materially from current expectations. These forward-looking statements represent our expectations only as of the date of this presentation, and Edison International assumes no duty to update them to reflect new information, events or circumstances. Important factors that could cause different results are discussed under the headings “Risk Factors,” and “Management’s Discussion and Analysis” in Edison International’s 2008 Form 10-K, most recent Form 10-Q and other reports filed with the Securities and Exchange Commission, which are available on our website: www.edisoninvestor.com. These filings also provide additional information on historical and other factual data contained in this presentation.
November 6, 2009
EDISON INTERNATIONAL®
Leading the Way in Electricity SM
What’s New Since Our Last Business Update
Updated Information
• Q3 2009 results and standard information
• Earnings Guidance as of November 6, 2009 (p. 6)
• Updated SCE Capital Investment and Rate Base Forecast (p. 9 – 10)
• Updated Transmission Investment Program (p. 11)
• California 33% RPS Policy (p. 12)
• SCE EE & DSM Plan through 2012 (p. 13)
• SCE Key Regulatory Events (p. 15)
November 6, 2009
EDISON INTERNATIONAL®
2
Leading the Way in Electricity SM
Delivering Superior and Sustained Value
Edison International
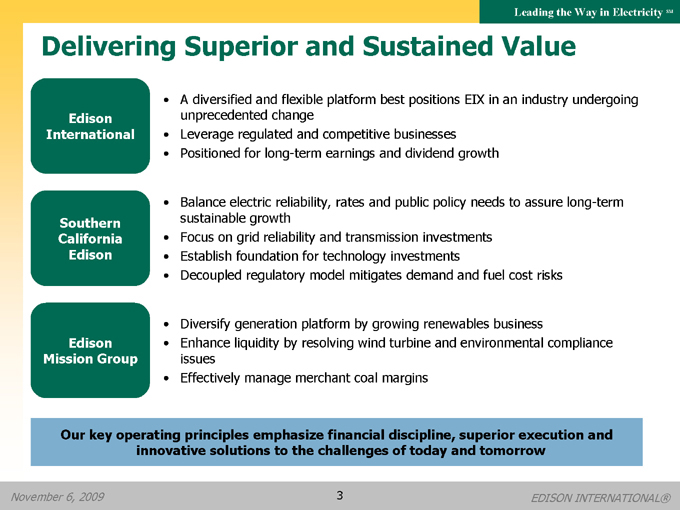
A diversified and flexible platform best positions EIX in an industry undergoing unprecedented change Leverage regulated and competitive businesses Positioned for long-term earnings and dividend growth
Southern California Edison
Balance electric reliability, rates and public policy needs to assure long-term sustainable growth Focus on grid reliability and transmission investments Establish foundation for technology investments Decoupled regulatory model mitigates demand and fuel cost risks
Edison Mission Group
Diversify generation platform by growing renewables business
Enhance liquidity by resolving wind turbine and environmental compliance issues Effectively manage merchant coal margins
Our key operating principles emphasize financial discipline, superior execution and innovative solutions to the challenges of today and tomorrow
November 6, 2009
Leading the Way in Electricity SM
Third Quarter Earnings Summary
Reconciliation of Core EPS to GAAP EPS
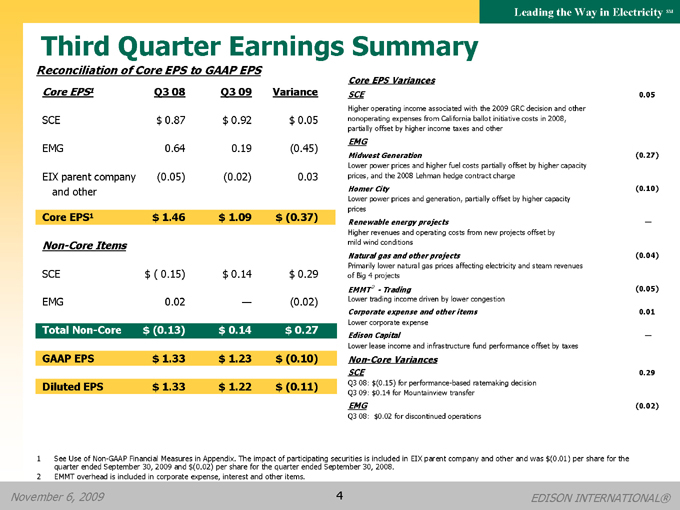
Core EPS1 Q3 08 Q3 09 Variance
SCE $ 0.87 $ 0.92 $ 0.05
EMG 0.64 0.19 (0.45)
EIX parent company (0.05) (0.02) 0.03
and other
Core EPS1 $ 1.46 $ 1.09 $ (0.37)
Non-Core Items
SCE $ ( 0.15) $ 0.14 $ 0.29
EMG 0.02 — (0.02)
Total Non-Core $ (0.13) $ 0.14 $ 0.27
GAAP EPS $ 1.33 $ 1.23 $ (0.10)
Diluted EPS $ 1.33 $ 1.22 $ (0.11)
Core EPS Variances
SCE 0.05
Higher operating income associated with the 2009 GRC decision and other
nonoperating expenses from California ballot initiative costs in 2008,
partially offset by higher income taxes and other
EMG
Midwest Generation (0.27)
Lower power prices and higher fuel costs partially offset by higher capacity
prices, and the 2008 Lehman hedge contract charge
Homer City (0.10)
Lower power prices and generation, partially offset by higher capacity
prices
Renewable energy projects —
Higher revenues and operating costs from new projects offset by
mild wind conditions
Natural gas and other projects (0.04)
Primarily lower natural gas prices affecting electricity and steam revenues
of Big 4 projects
EMMT 2-Trading (0.05)
Lower trading income driven by lower congestion
Corporate expense and other items 0.01
Lower corporate expense
Edison Capital —
Lower lease income and infrastructure fund performance offset by taxes
Non-Core Variances
SCE 0.29
Q3 08: $(0.15) for performance-based ratemaking decision
Q3 09: $0.14 for Mountainview transfer
EMG (0.02)
Q3 08: $0.02 for discontinued operations
1 See Use of Non-GAAP Financial Measures in Appendix. The impact of participating securities is included in EIX parent company and other and was $(0.01) per share for the quarter ended September 30, 2009 and $(0.02) per share for the quarter ended September 30, 2008.
2 | | EMMT overhead is included in corporate expense, interest and other items. |
November 6, 2009 4 EDISON INTERNATIONAL®
Leading the Way in Electricity SM
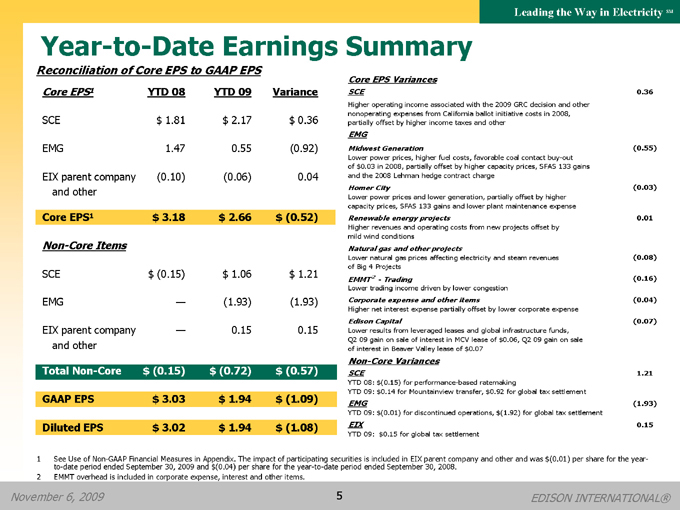
Year-to-Date Earnings Summary
Reconciliation of Core EPS to GAAP EPS
Core EPS1 YTD 08 YTD 09 Variance
SCE $ 1.81 $ 2.17 $ 0.36
EMG 1.47 0.55 (0.92)
EIX parent company (0.10) (0.06) 0.04
and other
Core EPS1 $ 3.18 $ 2.66 $ (0.52)
Non-Core Items
SCE $ (0.15) $ 1.06 $ 1.21
EMG — (1.93) (1.93)
EIX parent company — 0.15 0.15
and other
Total Non-Core $ (0.15) $ (0.72) $ (0.57)
GAAP EPS $ 3.03 $ 1.94 $ (1.09)
Diluted EPS $ 3.02 $ 1.94 $ (1.08)
Core EPS Variances
SCE 0.36
Higher operating income associated with the 2009 GRC decision and other
nonoperating expenses from California ballot initiative costs in 2008,
partially offset by higher income taxes and other
EMG
Midwest Generation (0.55)
Lower power prices, higher fuel costs, favorable coal contact buy-out
of $0.03 in 2008, partially offset by higher capacity prices, SFAS 133 gains
and the 2008 Lehman hedge contract charge
Homer City (0.03)
Lower power prices and lower generation, partially offset by higher
capacity prices, SFAS 133 gains and lower plant maintenance expense
Renewable energy projects 0.01
Higher revenues and operating costs from new projects offset by
mild wind conditions
Natural gas and other projects
Lower natural gas prices affecting electricity and steam revenues (0.08)
of Big 4 Projects
EMMT 2—Trading (0.16)
Lower trading income driven by lower congestion
Corporate expense and other items (0.04)
Higher net interest expense partially offset by lower corporate expense
Edison Capital (0.07)
Lower results from leveraged leases and global infrastructure funds,
Q2 09 gain on sale of interest in MCV lease of $0.06, Q2 09 gain on sale
of interest in Beaver Valley lease of $0.07
Non-Core Variances
SCE 1.21
YTD 08: $(0.15) for performance-based ratemaking
YTD 09: $0.14 for Mountainview transfer, $0.92 for globl tax settlement
EMG (1.93)
YTD 09: $(0.01) for discontinued operations, $(1.92) for global tax settlement
EIX 0.15
YTD 09: $0.15 for global tax settlement
1 See Use of Non-GAAP Financial Measures in Appendix. The impact of participating securities is included in EIX parent company and other and was $(0.01) per share for the year-to-date period ended September 30, 2009 and $(0.04) per share for the year-to-date period ended September 30, 2008.
2 | | EMMT overhead is included in corporate expense, interest and other items. |
November 6, 2009 5 EDISON INTERNATIONAL®

Leading the Way in Electricity SM
2009 Earnings Guidance
Reconciliation of Core Earnings to GAAP Earnings Guidance1
2009 Earnings
2009 Earnings Guidance
Guidance as of Updated as of
08/07/09 11/06/09
Low Mid High Low Mid High
EIX core earnings per share $2.90 $3.05 $3.20 $2.95 $3.05 $3.15
Non-core items:
Global tax settlement: (0.85) (0.85)
SCE 0.92
EMG (1.92)
EIX 0.15
SCE – regulatory items 0.14 0.14
EMG – discontinued operations (0.01) (0.01)
Total non-core items (0.72) (0.72)
EIX GAAP earnings per share $2.18 $2.33 $2.48 $2.23 $2.33 $2.43
Midpoint of 2009 core guidance
by key business element:
SCE $2.49 $2.55
EMG 0.70 0.60
EIX parent company and other (0.14) (0.10)
Total $3.05 $3.05
Assumptions
Southern California Edison
• 2009 average rate base:
Includes 2009 GRC decision
solar Approval rooftop of 2009 program FERC rate case and
• 2009 Approved Capital Structure
48% Equity, 11.50% ROE
• $ Potential 0.03 per energy share included efficiency earnings of
Edison Mission Group
• 9/30/09 Forward hedge position and prices as of • million EMMT pre-tax trading margin of $50-75
• $ Pre 45- tax million earnings from Big 4 lower by $35 to
• $ Increased 90 to $105 MWG million pre-(CAIR tax operating compliance cost and by mercury controls)
• forward. No significant Includes Edison $0.06 Capital gain earnings on sale of going interest in MCV lease
Other
• Normal operating and weather conditions
• No changes in GAAP accounting
• non Excludes -core discontinued items except operations as noted and other
1 See Use of Non-GAAP Financial Measures in Appendix. GAAP earnings refers to basic earnings per common share attributable to Edison International common shareholders. The expected impact of participating securities is $(0.02) per share and is included in EIX parent company and other.
November 6, 2009 6 EDISON INTERNATIONAL®
Leading the Way in Electricity SM
Southern California Edison (SCE)
November 6, 2009 7 EDISON INTERNATIONAL®
1 See Use of Non-GAAP Financial Measures in Appendix and Third Quarter Earnings Summary slide for reconciliation of core earnings per share to GAAP earnings per share.
Leading the Way in Electricity SM
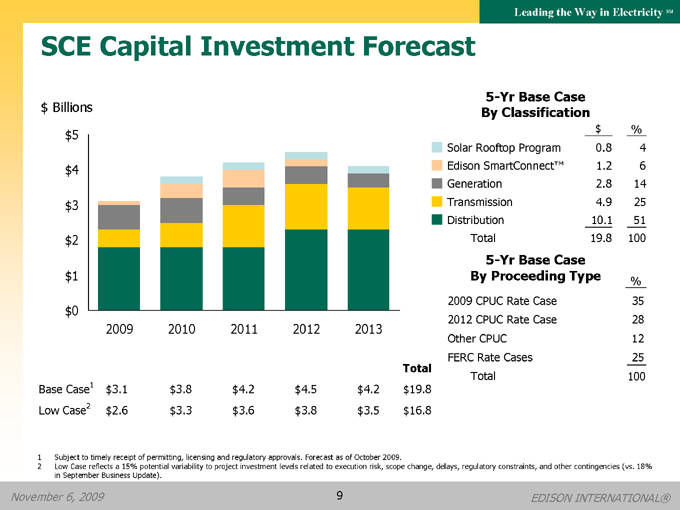
SCE Capital Investment Forecast
$ Billions $5
$4 $3 $2 $1
$0
2009 2010 2011 2012 2013
Total
Base Case1 $3.1 $3.8 $4.2 $4.5 $4.2 $19.8
Low Case2 $2.6 $3.3 $3.6 $3.8 $3.5 $16.8
5-Yr Base Case By Classification
$ %
Solar Rooftop Program 0.8 4
Edison SmartConnect™ 1.2 6
Generation 2.8 14
Transmission 4.9 25
Distribution 10.1 51
Total 19.8 100
5-Yr Base Case
By Proceeding Type %
2009 CPUC Rate Case 35
2012 CPUC Rate Case 28
Other CPUC 12
FERC Rate Cases 25
Total 100
1 | | Subject to timely receipt of permitting, licensing and regulatory approvals. Forecast as of October 2009. |
2 Low Case reflects a 15% potential variability to project investment levels related to execution risk, scope change, delays, regulatory constraints, and other contingencies (vs. 18% in September Business Update).
November 6, 2009 9 EDISON INTERNATIONAL®
Leading the Way in Electricity SM
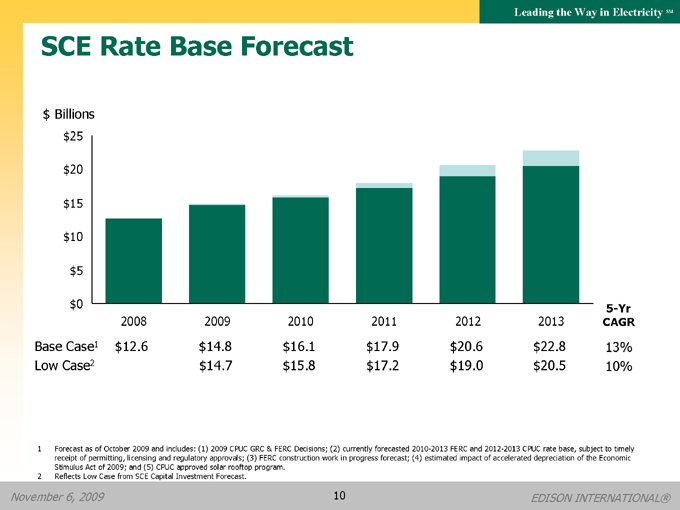
SCE Rate Base Forecast
$ Billions
$25
$20
$15
$10
$5
$0 5-Yr
2008 2009 2010 2011 2012 2013 CAGR
Base Case1 $12.6 $14.8 $16.1 $17.9 $20.6 $22.8 13%
Low Case2 $14.7 $15.8 $17.2 $19.0 $20.5 10%
1 Forecast as of October 2009 and includes: (1) 2009 CPUC GRC & FERC Decisions; (2) currently forecasted 2010-2013 FERC and 2012-2013 CPUC rate base, subject to timely receipt of permitting, licensing and regulatory approvals; (3) FERC construction work in progress forecast; (4) estimated impact of accelerated depreciation of the Economic Stimulus Act of 2009; and (5) CPUC approved solar rooftop program.
2 | | Reflects Low Case from SCE Capital Investment Forecast. |
November 6, 2009 10 EDISON INTERNATIONAL®
Leading the Way in Electricity SM
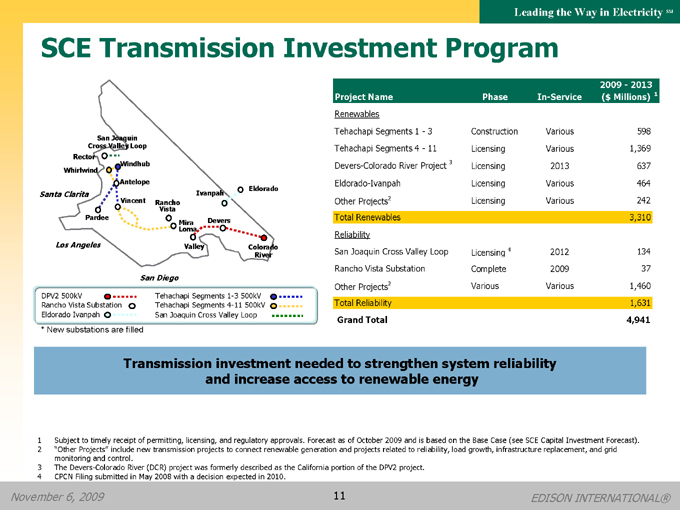
SCE Transmission Investment Program
San Joaquin
Cross Valley Loop
Rector SCE
Windhub Service
Whirlwind Territory
Antelope
Santa Clarita Palmdale Ivanpah Eldorado
Vincent Rancho
Vista
Pardee
MiraLoma Devers
Los Angeles SantaAna Valley PalmSpringsColorado
River
San Diego
DPV2 500kV Tehachapi Segments 1-3 500kV
Rancho Vista Substation Tehachapi Segments 4-11 500kV
Eldorado Ivanpah San Joaquin Cross Valley Loop
* | | New substations are filled |
2009-2013
Project Name Phase In-Service ($ Millions) 1
Renewables
Tehachapi Segments 1-3 Construction Various 598
Tehachapi Segments 4-11 Licensing Various 1,369
Devers-Colorado River Project 3 Licensing 2013 637
Eldorado-Ivanpah Licensing Various 464
Other Projects2 Licensing Various 242
Total Renewables 3,310
Reliability
San Joaquin Cross Valley Loop Licensing 4 2012 134
Rancho Vista Substation Complete 2009 37
Other Projects2 Various Various 1,460
Total Reliability 1,631
Grand Total 4,941
Transmission investment needed to strengthen system reliability and increase access to renewable energy
1 Subject to timely receipt of permitting, licensing, and regulatory approvals. Forecast as of October 2009 and is based on the Base Case (see SCE Capital Investment Forecast).
2 “Other Projects” include new transmission projects to connect renewable generation and projects related to reliability, load growth, infrastructure replacement, and grid monitoring and control.
3 | | The Devers-Colorado River (DCR) project was formerly described as the California portion of the DPV2 project. |
4 | | CPCN Filing submitted in May 2008 with a decision expected in 2010. |
November 6, 2009 11 EDISON INTERNATIONAL®
Leading the Way in Electricity SM
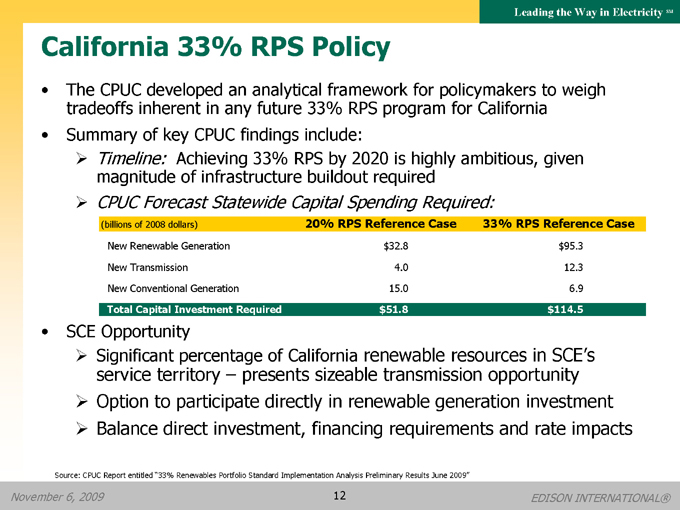
California 33% RPS Policy
• The CPUC developed an analytical framework for policymakers to weigh tradeoffs inherent in any future 33% RPS program for California
• Summary of key CPUC findings include:
Timeline: Achieving 33% RPS by 2020 is highly ambitious, given magnitude of infrastructure buildout required
CPUC Forecast Statewide Capital Spending Required:
(billions of 2008 dollars) 20% RPS Reference Case 33% RPS Reference Case
New Renewable Generation $32.8 $95.3
New Transmission 4.0 12.3
New Conventional Generation 15.0 6.9
Total Capital Investment Required $51.8 $114.5
SCE opportunity
Significant percentage of California renewable resources in SCE’s service territory – presents sizeable transmission opportunity
Option to participate directly in renewable generation investment
Balance direct investment, financing requirements and rate impacts
Source: CPUC Report entitled “33% Renewables Portfolio Standard Implementation Analysis Preliminary Results June 2009”
November 6, 2009 12 EDISON INTERNATIONAL®
Leading the Way in Electricity SM
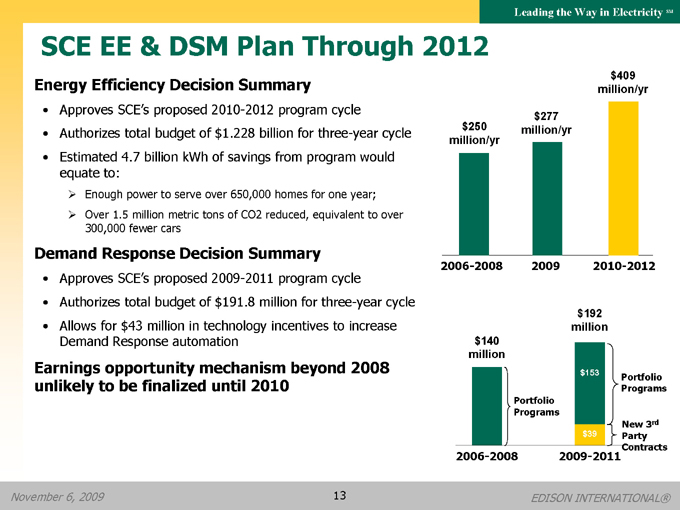
SCE EE & DSM Plan Through 2012
Energy Efficiency Decision Summary
• Approves SCE’s proposed 2010-2012 program cycle
• Authorizes total budget of $1.228 billion for three-year cycle
• Estimated 4.7 billion kWh of savings from program would equate to:
Enough power to serve over 650,000 homes for one year;
Over 1.5 million metric tons of CO2 reduced, equivalent to over 300,000 fewer cars
Demand Response Decision Summary
• Approves SCE’s proposed 2009-2011 program cycle
• Authorizes total budget of $191.8 million for three-year cycle
• Allows for $43 million in technology incentives to increase Demand Response automation
Earnings opportunity mechanism beyond 2008 unlikely to be finalized until 2010
$409 million/yr
$250 $277 million/yr million/yr
2006-2008 2009 2010-2012
$192 million $140 million $153 Portfolio Programs Portfolio Programs New 3rd
$39 Party Contracts 2006-2008 2009-2011
November 6, 2009 13 EDISON INTERNATIONAL®
Leading the Way in Electricity SM
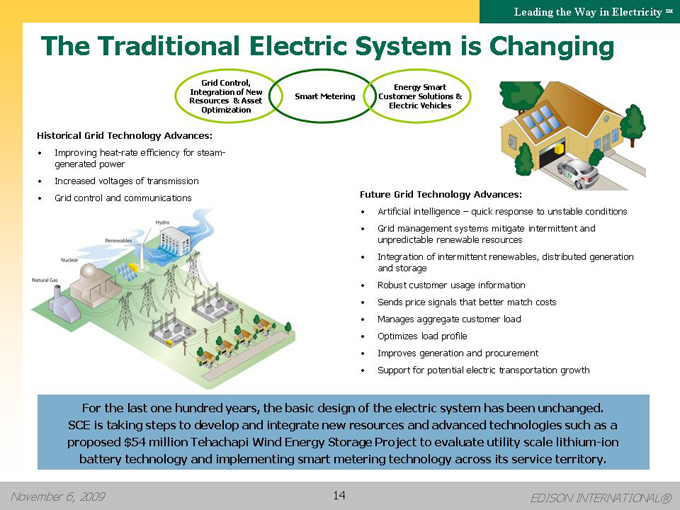
The Traditional Electric System is Changing
Grid Control, Integration of New Resources & Asset Optimization
Smart Metering
Energy Smart Customer Solutions & Electric Vehicles
Historical Grid Technology Advances:
• Improving heat-rate efficiency for steam-generated power
• Increased voltages of transmission
• Grid control and communications
Future Grid Technology Advances:
• Artificial intelligence – quick response to unstable conditions
• Grid management systems mitigate intermittent and unpredictable renewable resources
• Integration of intermittent renewables, distributed generation and storage
• Robust customer usage information
• Sends price signals that better match costs
• Manages aggregate customer load
• Optimizes load profile
• Improves generation and procurement
• Support for potential electric transportation growth
For the last one hundred years, the basic design of the electric system has been unchanged. SCE is taking steps to develop and integrate new resources and advanced technologies such as a proposed $54 million Tehachapi Wind Energy Storage Project to evaluate utility scale lithium-ion battery technology and implementing smart metering technology across its service territory.
November 6, 2009 14 EDISON INTERNATIONAL®
Leading the Way in Electricity SM
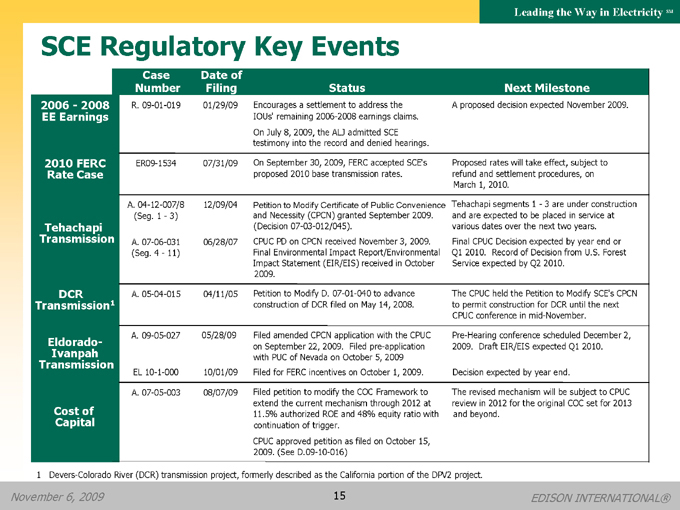
SCE Regulatory Key Events
Case Date of
Number Filing Status Next Milestone
2006-2008 R. 09-01-019 01/29/09 Encourages a settlement to address the A proposed decision expected November 2009.
EE Earnings IOUs’ remaining 2006-2008 earnings claims.
On July 8, 2009, the ALJ admitted SCE
testimony into the record and denied hearings.
2010 FERC ER09-1534 07/31/09 On September 30, 2009, FERC accepted SCE’s Proposed rates will take effect, subject to
Rate Case proposed 2010 base transmission rates. refund and settlement procedures, on
March 1, 2010.
A. 04-12-007/8 12/09/04 Petition to Modify Certificate of Public Convenience Tehachapi segments 1-3 are under construction
(Seg. 1-3) and Necessity (CPCN) granted September 2009. and are expected to be placed in service at
Tehachapi (Decision 07-03-012/045). various dates over the next two years.
Transmission A. 07-06-031 06/28/07 CPUC PD on CPCN received November 3, 2009. Final CPUC Decision expected by year end or
(Seg. 4-11) Final Environmental Impact Report/Environmental Q1 2010. Record of Decision from U.S. Forest
Impact Statement (EIR/EIS) received in October Service expected by Q2 2010.
2009.
DCR A. 05-04-015 04/11/05 Petition to Modify D. 07-01-040 to advance The CPUC held the Petition to Modify SCE’s CPCN
Transmission1 construction of DCR filed on May 14, 2008. to permit construction for DCR until the next
CPUC conference in mid-November.
A. 09-05-027 05/28/09 Filed amended CPCN application with the CPUC Pre-Hearing conference scheduled December 2,
Eldorado- on September 22, 2009. Filed pre-application 2009. Draft EIR/EIS expected Q1 2010.
Ivanpah with PUC of Nevada on October 5, 2009
Transmission
EL 10-1-000 10/01/09 Filed for FERC incentives on October 1, 2009. Decision expected by year end.
A. 07-05-003 08/07/09 Filed petition to modify the COC Framework to The revised mechanism will be subject to CPUC
extend the current mechanism through 2012 at review in 2012 for the original COC set for 2013
Cost of 11.5% authorized ROE and 48% equity ratio with and beyond.
Capital continuation of trigger.
CPUC approved petition as filed on October 15,
2009. (See D.09-10-016)
1 | | Devers-Colorado River (DCR) transmission project, formerly described as the California portion of the DPV2 project. |
November 6, 2009 15 EDISON INTERNATIONAL®
Leading the Way in Electricity SM
Edison Mission Group (EMG)
November 6, 2009 16 EDISON INTERNATIONAL®
Leading the Way in Electricity SM
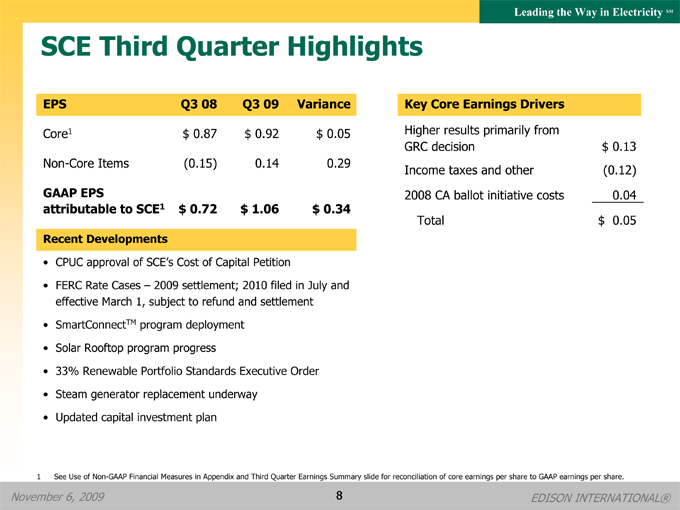
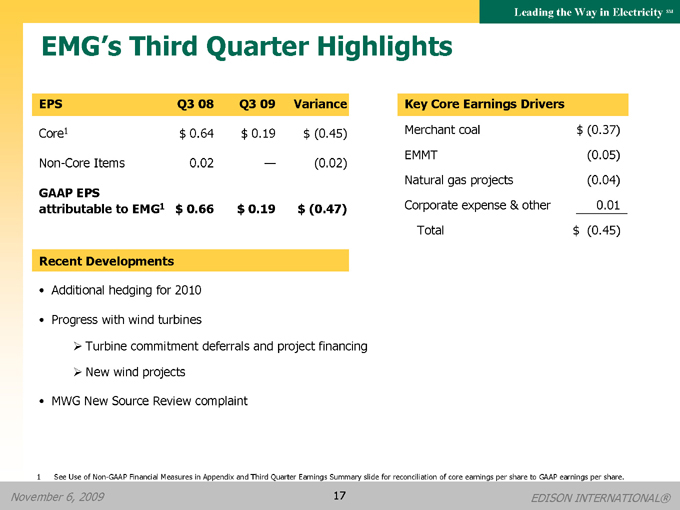
EMG’s Third Quarter Highlights
EPS Q3 08 Q3 09 Variance
Core1 $ 0.64 $ 0.19 $ (0.45)
Non-Core Items 0.02 — (0.02)
GAAP EPS attributable to EMG1 $ 0.66 $ 0.19 $ (0.47)
Recent Developments
• Additional hedging for 2010
• Progress with wind turbines
Turbine commitment deferrals and project financing
New wind projects
• MWG New Source Review complaint
Key Core Earnings Drivers
Merchant coal $ (0.37)
EMMT (0.05)
Natural gas projects (0.04)
Corporate expense & other 0.01
Total $ (0.45)
1 See Use of Non-GAAP Financial Measures in Appendix and Third Quarter Earnings Summary slide for reconciliation of core earnings per share to GAAP earnings per share.
November 6, 2009 17 EDISON INTERNATIONAL®
Leading the Way in Electricity SM
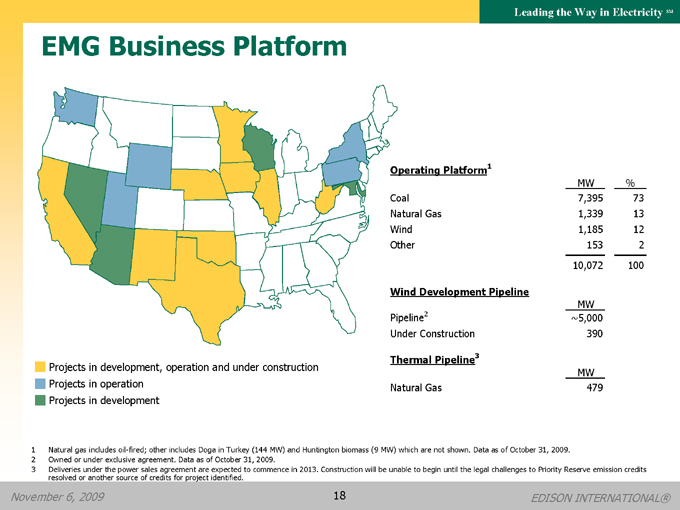
EMG Business Platform
Projects in development, operation and under construction Projects in operation Projects in development
Operating Platform1
MW
%
Coal
7,395
73
Natural Gas
1,339
13
Wind
1,185
12
Other
153
2
10,072
100
Wind Development Pipeline
MW
Pipeline2
~5,000
Under Construction
390
Thermal Pipeline3
MW
Natural Gas
479
1 Natural gas includes oil-fired; other includes Doga in Turkey (144 MW) and Huntington biomass (9 MW) which are not shown. Data as of October 31, 2009.
2 | | Owned or under exclusive agreement. Data as of October 31, 2009. |
3 Deliveries under the power sales agreement are expected to commence in 2013. Construction will be unable to begin until the legal challenges to Priority Reserve emission credits resolved or another source of credits for project identified.
November 6, 2009 18 EDISON INTERNATIONAL®
Leading the Way in Electricity SM
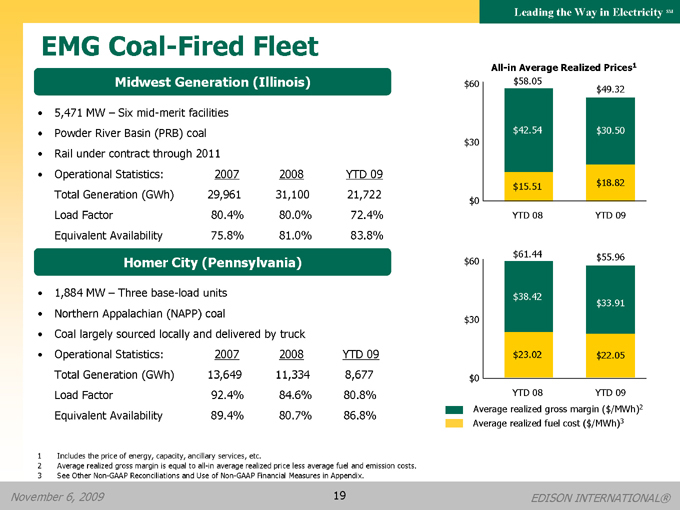
EMG Coal-Fired Fleet
Midwest Generation (Illinois)
• 5,471 MW – Six mid-merit facilities
• Powder River Basin (PRB) coal
• Rail under contract through 2011
• Operational Statistics: 2007 2008 YTD 09 Total Generation (GWh) 29,961 31,100 21,722 Load Factor 80.4% 80.0% 72.4% Equivalent Availability 75.8% 81.0% 83.8%
Homer City (Pennsylvania)
• 1,884 MW – Three base-load units
• Northern Appalachian (NAPP) coal
• Coal largely sourced locally and delivered by truck
• Operational Statistics: 2007 2008 YTD 09 Total Generation (GWh) 13,649 11,334 8,677 Load Factor 92.4% 84.6% 80.8% Equivalent Availability 89.4% 80.7% 86.8%
All-in Average Realized Prices1
$60 $58.05 $49.32
$42.54 $30.50
$30
$15.51 $18.82
$0
YTD 08 YTD 09
$60 $61.44 $55.96
$38.42 $33.91
$30
$23.02 $22.05
$0
YTD 08 YTD 09
Average realized gross margin ($/MWh)2
Average realized fuel cost ($/MWh)3
1 | | Includes the price of energy, capacity, ancillary services, etc. |
2 | | Average realized gross margin is equal to all-in average realized price less average fuel and emission costs. |
3 | | See Other Non-GAAP Reconciliations and Use of Non-GAAP Financial Measures in Appendix. |
November 6, 2009 19 EDISON INTERNATIONAL®
Leading the Way in Electricity SM
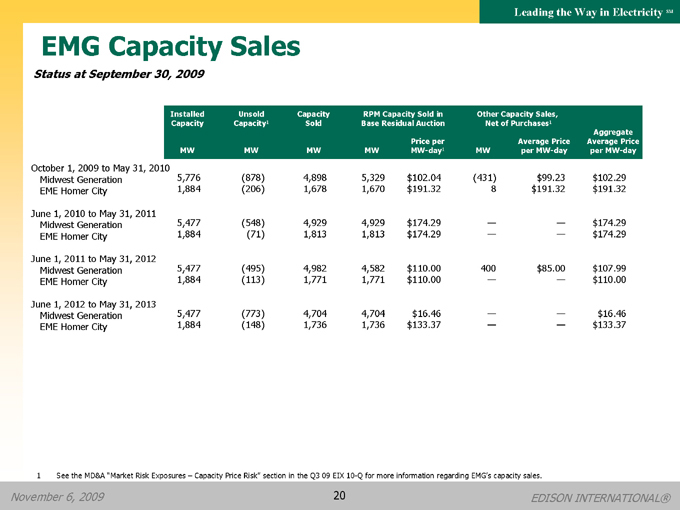
EMG Capacity Sales
Status at September 30, 2009
Installed Unsold Capacity RPM Capacity Sold in Other Capacity Sales,
Capacity Capacity1 Sold Base Residual Auction Net of Purchases1
Aggregate
Price per Average Price Average Price
MW MW MW MW MW-day1 MW per MW-day per MW-day
October 1, 2009 to May 31, 2010
Midwest Generation 5,776 (878) 4,898 5,329 $102.04 (431) $99.23 $102.29
EME Homer City 1,884 (206) 1,678 1,670 $191.32 8 $191.32 $191.32
June 1, 2010 to May 31, 2011
Midwest Generation 5,477 (548) 4,929 4,929 $174.29 — — $174.29
EME Homer City 1,884 (71) 1,813 1,813 $174.29 — — $174.29
June 1, 2011 to May 31, 2012
Midwest Generation 5,477 (495) 4,982 4,582 $110.00 400 $85.00 $107.99
EME Homer City 1,884 (113) 1,771 1,771 $110.00 — — $110.00
June 1, 2012 to May 31, 2013
Midwest Generation 5,477 (773) 4,704 4,704 $16.46 — — $16.46
EME Homer City 1,884 (148) 1,736 1,736 $133.37 — — $133.37
1 See the MD&A “Market Risk Exposures – Capacity Price Risk” section in the Q3 09 EIX 10-Q for more information regarding EMG’s capacity sales.
November 6, 2009 20 EDISON INTERNATIONAL®
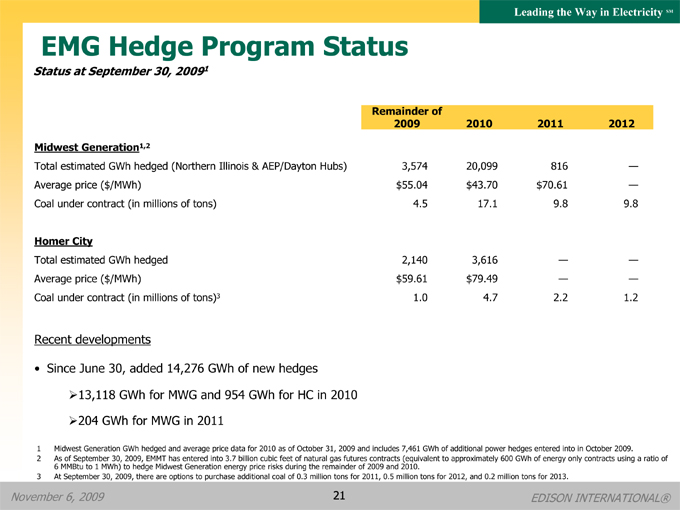
1 Midwest Generation GWh hedged and average price data for 2010 as of October 31, 2009 and includes 7,461 GWh of additional power hedges entered into in October 2009.
6 MMBtu to 1 MWh) to hedge Midwest Generation energy price risks during the remainder of 2009 and 2010.
3 At September 30, 2009, there are options to purchase additional coal of 0.3 million tons for 2011, 0.5 million tons for 2012, and 0.2 million tons for 2013.
Leading the Way in Electricity SM
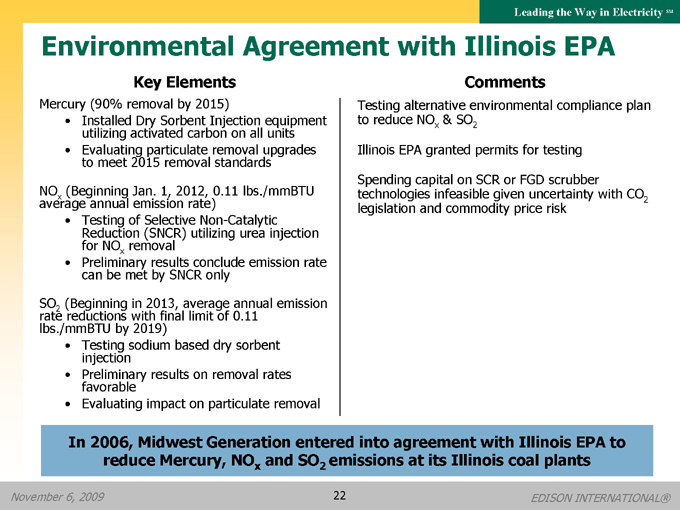
Environmental Agreement with Illinois EPA
Key Elements
Mercury (90% removal by 2015)
• Installed Dry Sorbent Injection equipment utilizing activated carbon on all units
• Evaluating particulate removal upgrades to meet 2015 removal standards NOx (Beginning Jan. 1, 2012, 0.11 lbs./mmBTU average annual emission rate)
• Testing of Selective Non-Catalytic Reduction (SNCR) utilizing urea injection for NOx removal
• Preliminary results conclude emission rate can be met by SNCR only SO2 (Beginning in 2013, average annual emission rate reductions with final limit of 0.11 lbs./mmBTU by 2019)
• Testing sodium based dry sorbent injection
• Preliminary results on removal rates favorable
• Evaluating impact on particulate removal
Comments
Testing alternative environmental compliance plan to reduce NOx & SO2 Illinois EPA granted permits for testing
Spending capital on SCR or FGD scrubber technologies infeasible given uncertainty with CO2 legislation and commodity price risk
In 2006, Midwest Generation entered into agreement with Illinois EPA to reduce Mercury, NOx and SO2 emissions at its Illinois coal plants
November 6, 2009 22 EDISON INTERNATIONAL®
Leading the Way in Electricity SM
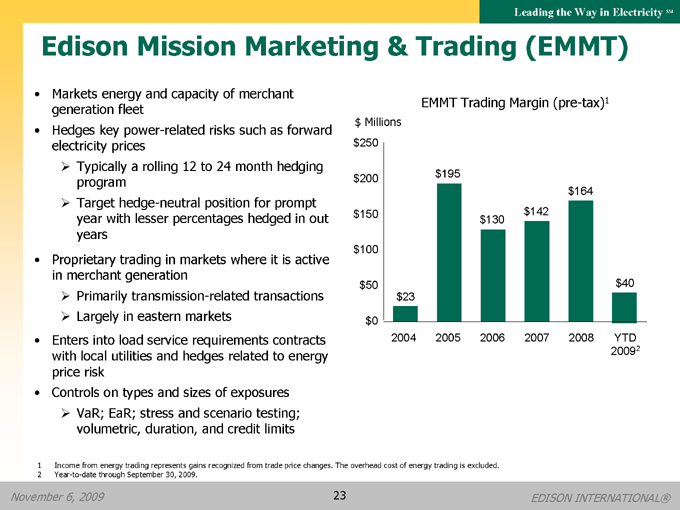
Edison Mission Marketing & Trading (EMMT)
• Markets energy and capacity of merchant generation fleet
• Hedges key power-related risks such as forward electricity prices
Typically a rolling 12 to 24 month hedging program
Target hedge-neutral position for prompt year with lesser percentages hedged in out years
• Proprietary trading in markets where it is active in merchant generation
Primarily transmission-related transactions
Largely in eastern markets
• Enters into load service requirements contracts with local utilities and hedges related to energy price risk
• Controls on types and sizes of exposures
VaR; EaR; stress and scenario testing; volumetric, duration, and credit limits
EMMT Trading Margin (pre-tax)1
$ Millions
$250
$200 $195
$164
$150 $142
$130
$100
$50 $40
$23
$0
2004 2005 2006 2007 2008 YTD
20092
1 Income from energy trading represents gains recognized from trade price changes. The overhead cost of energy trading is excluded.
2 Year-to-date through September 30, 2009.
November 6, 2009 23 EDISON INTERNATIONAL®
Leading the Way in Electricity SM
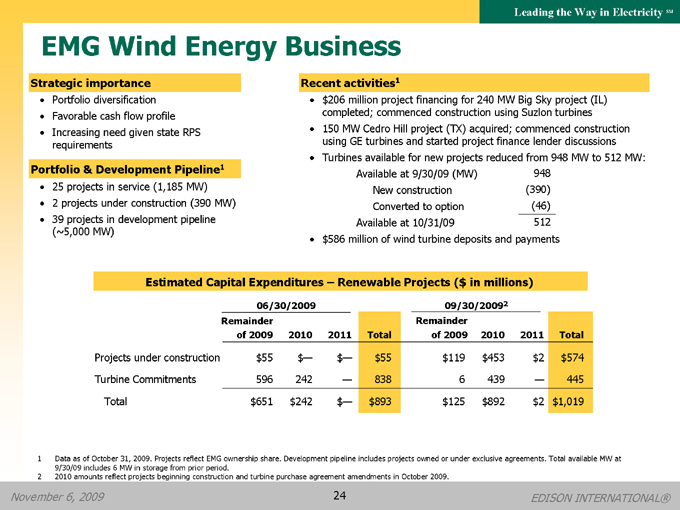
EMG Wind Energy Business
Strategic importance
• Portfolio diversification
• Favorable cash flow profile
• Increasing need given state RPS requirements
Portfolio & Development Pipeline1
• 25 projects in service (1,185 MW)
• | | 2 projects under construction (390 MW) |
• 39 projects in development pipeline (~5,000 MW)
Recent activities1
• $206 million project financing for 240 MW Big Sky project (IL) completed; commenced construction using Suzlon turbines
• 150 MW Cedro Hill project (TX) acquired; commenced construction using GE turbines and started project finance lender discussions
• Turbines available for new projects reduced from 948 MW to 512 MW: Available at 9/30/09 (MW) 948 New construction (390) Converted to option (46) Available at 10/31/09 512
• $586 million of wind turbine deposits and payments
Estimated Capital Expenditures – Renewable Projects ($ in millions)
06/30/2009 09/30/20092
Remainder Remainder
of 2009 2010 2011 Total of 2009 2010 2011 Total
Projects under construction $55 $— $— $55 $119 $453 $2 $574
Turbine Commitments 596 242 — 838 6 439 — 445
Total $651 $242 $— $893 $125 $892 $2 $1,019
1 Data as of October 31, 2009. Projects reflect EMG ownership share. Development pipeline includes projects owned or under exclusive agreements. Total available MW at 9/30/09 includes 6 MW in storage from prior period.
2 | | 2010 amounts reflect projects beginning construction and turbine purchase agreement amendments in October 2009. |
November 6, 2009 24 EDISON INTERNATIONAL®
Leading the Way in Electricity SM
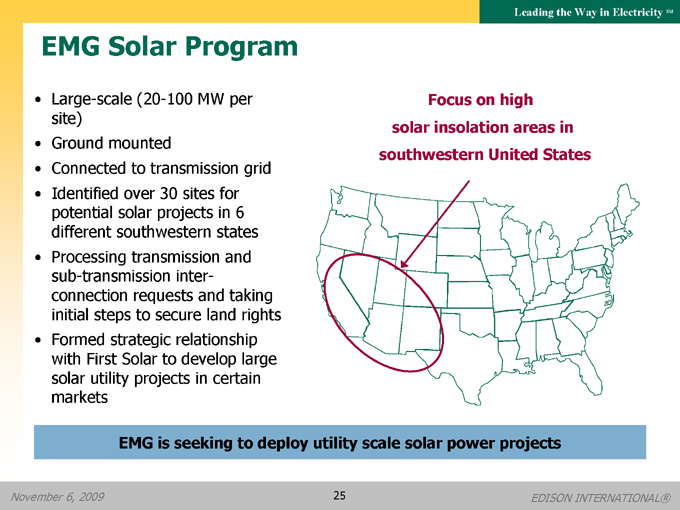
EMG Solar Program
• Large-scale (20-100 MW per site)
• Ground mounted
• Connected to transmission grid
• Identified over 30 sites for potential solar projects in 6 different southwestern states
• Processing transmission and sub-transmission inter-connection requests and taking initial steps to secure land rights
• Formed strategic relationship with First Solar to develop large solar utility projects in certain markets
Focus on high solar insolation areas in southwestern United States
EMG is seeking to deploy utility scale solar power projects
November 6, 2009 25 EDISON INTERNATIONAL®

Leading the Way in Electricity SM
Appendix
November 6, 2009 26 EDISON INTERNATIONAL®
Leading the Way in Electricity SM
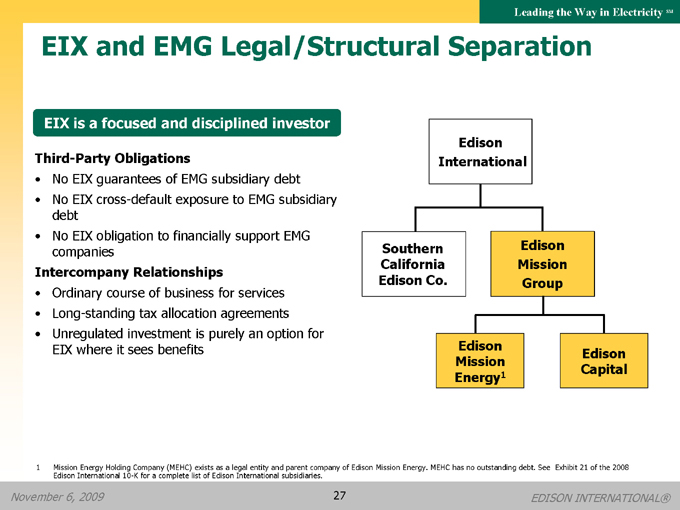
EIX and EMG Legal/Structural Separation
EIX is a focused and disciplined investor
Third-Party Obligations
• No EIX guarantees of EMG subsidiary debt
• No EIX cross-default exposure to EMG subsidiary debt
• No EIX obligation to financially support EMG companies
Intercompany Relationships
• Ordinary course of business for services
• Long-standing tax allocation agreements
• Unregulated investment is purely an option for EIX where it sees benefits
Edison International
Southern Edison California Mission Edison Co. Group
Edison
Edison
Mission
1 Mission Energy Holding Company (MEHC) exists as a legal entity and parent company of Edison Mission Energy. MEHC has no outstanding debt. See Exhibit 21 of the 2008 Edison International 10-K for a complete list of Edison International subsidiaries.
November 6, 2009 27 EDISON INTERNATIONAL®
Leading the Way in Electricity SM
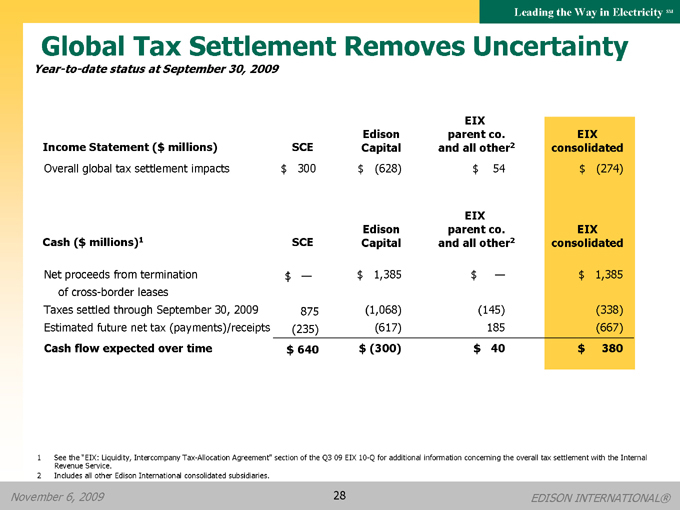
Global Tax Settlement Removes Uncertainty
Year-to-date status at September 30, 2009
Edison parent co. EIX
Income Statement ($ millions) SCE Capital and all other2 EIX consolidated
Overall global tax settlement impacts $ 300 $ (628) $ 54 $ (274)
EIX
Edison parent co. EIX
Cash ($ millions)1 SCE Capital and all other2 consolidated
Net proceeds from termination $ — $ 1,385 $ — $ 1,385
of cross-border leases
Taxes settled through September 30, 2009 875 (1,068) (145) (338)
Estimated future net tax (payments)/receipts (235) (617) 185 (667)
Cash flow expected over time $ 640 $ (300) $ 40 $ 380
1 See the “EIX: Liquidity, Intercompany Tax-Allocation Agreement” section of the Q3 09 EIX 10-Q for additional information concerning the overall tax settlement with the Internal Revenue Service.
2 | | Includes all other Edison International consolidated subsidiaries. |
November 6, 2009 28 EDISON INTERNATIONAL®
Leading the Way in Electricity SM
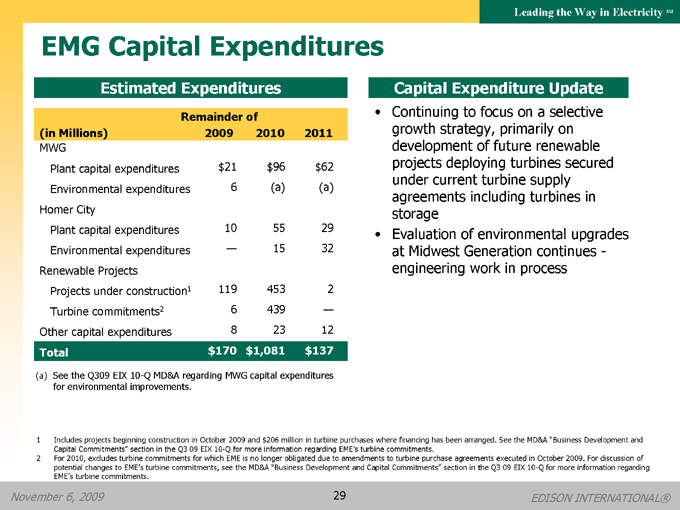
EMG Capital Expenditures
Estimated Expenditures
Remainder of
(in Millions) 2009 2010 2011
MWG
Plant capital expenditures $21 $96 $62
Environmental expenditures 6 (a) (a)
Homer City
Plant capital expenditures 10 55 29
Environmental expenditures — 15 32
Renewable Projects
Projects under construction1 119 453 2
Turbine commitments2 6 439 —
Other capital expenditures 8 23 12
Total $170 $1,081 $137
(a) | | See the Q309 EIX 10-Q MD&A regarding MWG capital expenditures for environmental improvements. |
Capital Expenditure Update
• Continuing to focus on a selective growth strategy, primarily on development of future renewable projects deploying turbines secured under current turbine supply agreements including turbines in storage
• Evaluation of environmental upgrades at Midwest Generation continues -engineering work in process
1 Includes projects beginning construction in October 2009 and $206 million in turbine purchases where financing has been arranged. See the MD&A “Business Development and Capital Commitments” section in the Q3 09 EIX 10-Q for more information regarding EME’s turbine commitments.
2 For 2010, excludes turbine commitments for which EME is no longer obligated due to amendments to turbine purchase agreements executed in October 2009. For discussion of potential changes to EME’s turbine commitments, see the MD&A “Business Development and Capital Commitments” section in the Q3 09 EIX 10-Q for more information regarding EME’s turbine commitments.
November 6, 2009 29 EDISON INTERNATIONAL®
Leading the Way in Electricity SM
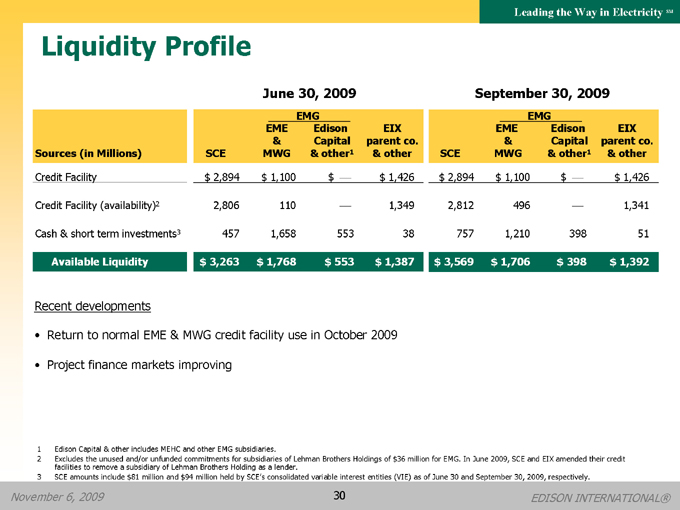
Liquidity Profile
June 30, 2009 September 30, 2009
EMG EMG
EME Edison EIX EME Edison EIX
& Capital parent co. & Capital parent co.
Sources (in Millions) SCE MWG & other1 & other SCE MWG & other1 & other
Credit Facility $ 2,894 $ 1,100 $— $ 1,426 $ 2,894 $ 1,100 $ — $ 1,426
Credit Facility (availability)2 2,806 110 — 1,349 2,812 496 — 1,341
Cash & short term investments3 457 1,658 553 38 757 1,210 398 51
Available Liquidity $ 3,263 $ 1,768 $ 553 $ 1,387 $ 3,569 $ 1,706 $ 398 $ 1,392
Recent developments
• Return to normal EME & MWG credit facility use in October 2009
• Project finance markets improving
1 | | Edison Capital & other includes MEHC and other EMG subsidiaries. |
2 Excludes the unused and/or unfunded commitments for subsidiaries of Lehman Brothers Holdings of $36 million for EMG. In June 2009, SCE and EIX amended their credit facilities to remove a subsidiary of Lehman Brothers Holding as a lender.
3 SCE amounts include $81 million and $94 million held by SCE’s consolidated variable interest entities (VIE) as of June 30 and September 30, 2009, respectively.
November 6, 2009 30 EDISON INTERNATIONAL®

Leading the Way in Electricity SM
EMG – Adjusted EBITDA
Reconciliation to Earnings1 ($ Millions) Q3 08 Q3 09 YTD 08 YTD 09 2007 2008
Earnings (Loss) $ 214 $ 60 $ 479 $ (450) $ 410 $ 561
Addback (Deduct):
Discontinued operations (6) — — 5 2 —
Income (loss) from continuing operations 208 60 479 (445) 412 561
Interest expense 70 81 211 232 323 288
Interest income (7) (3) (27) (15) (101) (37)
Income taxes 125 7 265 (263) 170 272
Depreciation and amortization 50 63 143 176 172 197
EBITDA2 446 208 1,071 (315) 976 1,281
Production tax credits3 9 10 29 40 28 44
Addback:
Gain on sale of interests in leases & other assets (1) — (50) 886 (1) (49)
Loss on early extinguishment of debt — — — — 241 —
Charge to cancel gas turbine order — — — — — 23
Adjusted EBITDA1 $ 454 $ 218 $ 1,050 $ 611 $ 1,244 $ 1,299
1 | | Earnings refers to net income attributable to Edison Mission Group. |
2 | | See Use of Non-GAAP Financial Measures in Appendix for additional information on EBITDA and Adjusted EBITDA. |
3 | | Production tax credits (PTC) are after-tax. |
November 6, 2009 31 EDISON INTERNATIONAL®
Leading the Way in Electricity SM
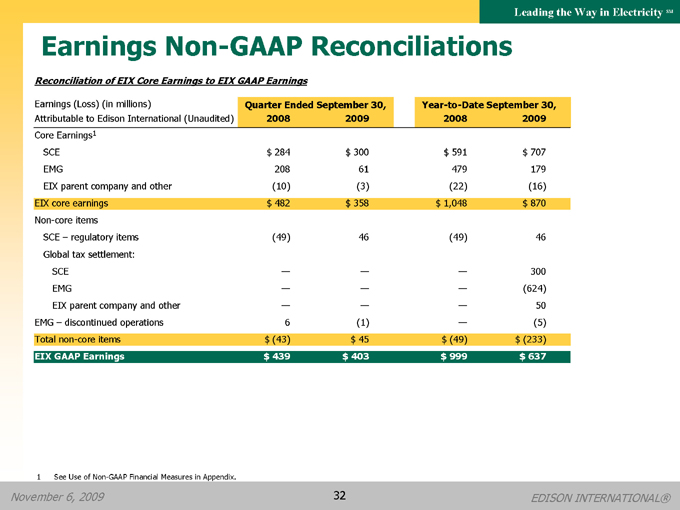
Earnings Non-GAAP Reconciliations
Reconciliation of EIX Core Earnings to EIX GAAP Earnings
Earnings (Loss) (in millions) Quarter Ended September 30, Year-to-Date September 30,
Attributable to Edison International (Unaudited) 2008 2009 2008 2009
Core Earnings1
SCE $ 284 $ 300 $ 591 $ 707
EMG 208 61 479 179
EIX parent company and other (10) (3) (22) (16)
EIX core earnings $ 482 $ 358 $ 1,048 $ 870
Non-core items
SCE – regulatory items (49) 46 (49) 46
Global tax settlement:
SCE — — — 300
EMG — — — (624)
EIX parent company and other — — — 50
EMG – discontinued operations 6 (1) — (5)
Total non-core items $ (43) $ 45 $ (49) $ (233)
EIX GAAP Earnings $ 439 $ 403 $ 999 $ 637
1 | | See Use of Non-GAAP Financial Measures in Appendix. |
November 6, 2009 32 EDISON INTERNATIONAL®
Leading the Way in Electricity SM
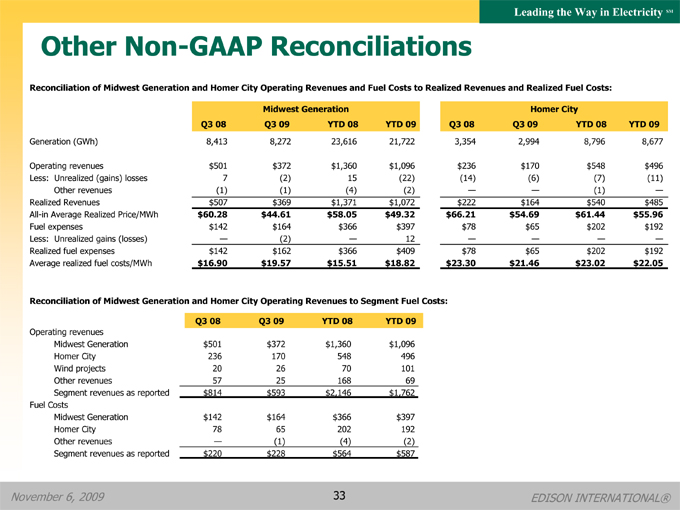
Other Non-GAAP Reconciliations
Reconciliation of Midwest Generation and Homer City Operating Revenues and Fuel Costs to Realized Revenues and Realized Fuel Costs:
Midwest Generation
Q3 08 Q3 09 YTD 08 YTD 09
Generation (GWh) 8,413 8,272 23,616 21,722
Operating revenues $501 $372 $1,360 $1,096
Less: Unrealized (gains) losses 7 (2) 15 (22)
Other revenues (1) (1) (4) (2)
Realized Revenues $507 $369 $1,371 $1,072
All-in Average Realized Price/MWh $60.28 $44.61 $58.05 $49.32
Fuel expenses $142 $164 $366 $397
Less: Unrealized gains (losses) - (2) - 12
Realized fuel expenses $142 $162 $366 $409
Average realized fuel costs/MWh $16.90 $19.57 $15.51 $18.82
Homer City
Q3 08 Q3 09 YTD 08 YTD 09
3,354 2,994 8,796 8,677
$236 $170 $548 $496
(14) (6) (7) (11)
- - (1) -
$222 $164 $540 $485
$66.21 $54.69 $61.44 $55.96
$78 $65 $202 $192
- - - -
$78 $65 $202 $192
$23.30 $21.46 $23.02 $22.05
Reconciliation of Midwest Generation and Homer City Operating Revenues to Segment Fuel Costs:
Q3 08 Q3 09 YTD 08 YTD 09
Operating revenues
Midwest Generation $501 $372 $1,360 $1,096
Homer City 236 170 548 496
Wind projects 20 26 70 101
Other revenues 57 25 168 69
Segment revenues as reported $814 $593 $2,146 $1,762
Fuel Costs
Midwest Generation $142 $164 $366 $397
Homer City 78 65 202 192
Other revenues - (1) (4) (2)
November 6, 2009 EDISON INTERNATIONAL®
Segment revenues as reported $220 $228 $564 $587
33
Leading the Way in Electricity SM
Use of Non-GAAP Financial Measures
Edison International’s earnings are prepared in accordance with generally accepted accounting principles used in the management United States uses and represent core earnings the company’s and EPS by earnings principal as operating reported subsidiary to the Securities internally and for Exchange financial Commission. planning and Our for analysis of performance. We also use core internally for financial planning and for analysis of use core earnings and EPS by principal operating subsidiary earnings and EPS by principal operating subsidiary as primary performance measurements us to more accurately when communicating compare the company’s with analysts ongoing and investors performance regarding across our periods. earnings results and outlook, as it allows Core operations earnings and and other core non earnings -core items. per share GAAP are earnings defined refers as GAAP to net earnings income and attributable GAAP earnings to Edison per International share less discontinued or common attributable share to the attributable common to shareholders Edison International of each subsidiary common and shareholders. EIX GAAP EPS earnings by principal per share operating refers to subsidiary basic earnings is based per on the principal operating subsidiaries’ net income attributable to the common shareholders of each subsidiary, respectively, securities (vested and Edison stock options International’s that earn weighted dividend average equivalents outstanding that may common participate shares. in undistributed The impact of earnings participating with common stock) for each principal operating subsidiary is not material to each principal operating subsidiary’s EPS and is therefore reflected in the results of the Edison International holding company, which we refer to as EIX parent company and other.
EBITDA is defined as earnings before interest, income taxes, depreciation and amortization. Adjusted EBITDA includes production extinguishment tax credits of debt from and EMG’s leases, wind and projects impairment and of excludes assets and amounts investments. from gain Our on management the sale of assets, uses Adjusted loss on early EBITDA as an important financial measure for evaluating EMG.
The average realized energy price and average realized fuel cost is a non-GAAP performance measure since such recorded statistical as measures fuel expenses. exclude Management unrealized gains believes or losses that the recorded average as realized operating energy revenues price and and unrealized average realized gains or fuel losses cost is more meaningful for investors as it reflects the impact of hedge contracts at the time of actual generation in period-over-period comparisons or as compared to real-time market prices.
A reconciliation of Non-GAAP information to GAAP information, including the impact of participating securities, is included either on the slide where the information appears or on another slide referenced in this presentation.
November 6, 2009 34 EDISON INTERNATIONAL®