Exhibit 99.2
Leading the Way in Electricity SM
Fourth Quarter 2009 Financial Teleconference
March 1, 2010 EDISON INTERNATIONAL®
Leading the Way in Electricity SM
Forward-Looking Statements
Statements contained in this presentation about future performance, including, without limitation, earnings, asset and rate base growth, load growth, capital investments, and other statements that are not purely historical, are forward-looking statements. These forward-looking statements reflect our current expectations; however, such statements involve risks and uncertainties. Actual results could differ materially from current expectations. These forward-looking statements represent our expectations only as of the date of this presentation, and Edison International assumes no duty to update them to reflect new information, events or circumstances. Important factors that could cause different results are discussed under the headings “Risk Factors,” and “Management’s Discussion and Analysis” in Edison International’s 2009 Form 10-K, and other reports filed with the Securities and Exchange Commission, which are available on our website: www.edisoninvestor.com. These filings also provide additional information on historical and other factual data contained in this presentation.
March 1, 2010 1 EDISON INTERNATIONAL®
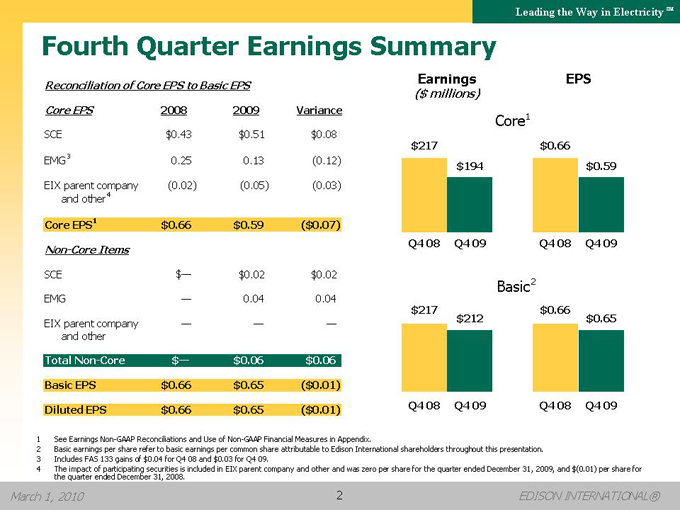
Fourth Quarter Earnings Summary
Reconciliation of Core EPS to Basic EPS
Core EPS
2008
2009
Variance
SCE
$0.43
$0.51
$0.08
EMG3
0.25
0.13
(0.12)
EIX parent company and other4
(0.02)
(0.05)
(0.03)
Core EPS1
$0.66
$0.59
($0.07)
Non-Core Items
SCE
$—
$0.02
$0.02
EMG
—
0.04
0.04
EIX parent company and other
—
—
—
Total Non-Core
$—
$0.06
$0.06
Basic EPS
$0.66
$0.65
($0.01)
Diluted EPS
$0.66
$0.65
($0.01)
Earnings ($ millions)
EPS
Core1
$217 $0.66 $194 $0.59
Q4 08 Q4 09 Q4 08 Q4 09
Basic2
$217 $0.66 $212 $0.65
Q4 08 Q4 09 Q4 08 Q4 09
1 See Earnings Non-GAAP Reconciliations and Use of Non-GAAP Financial Measures in Appendix.
2 Basic earnings per share refer to basic earnings per common share attributable to Edison International shareholders throughout this presentation.
3 Includes FAS 133 gains of $0.04 for Q4 08 and $0.03 for Q4 09.
4 The impact of participating securities is included in EIX parent company and other and was zero per share for the quarter ended December 31, 2009, and $(0.01) per share for the quarter ended December 31, 2008.
March 1, 2010 2 EDISON INTERNATIONAL®
Leading the Way in Electricity SM
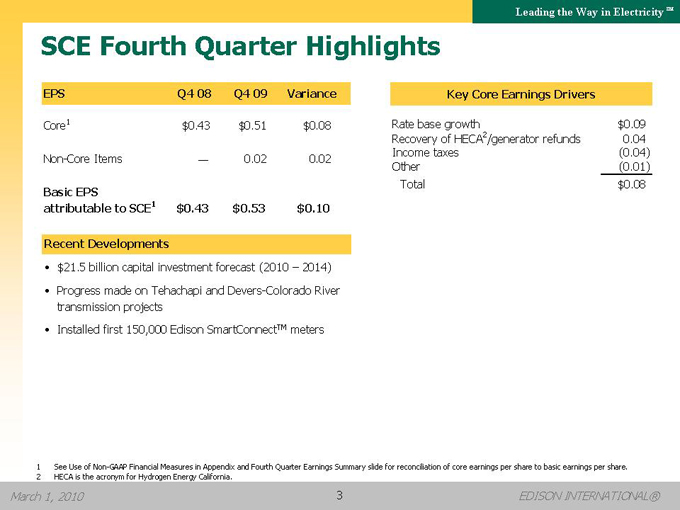
SCE Fourth Quarter Highlights
EPS
Q4 08
Q4 09
Variance
Core1
$0.43
$0.51
$0.08
Non-Core Items
—
0.02
0.02
Basic EPSattributable to SCE1
$0.43
$0.53
$0.10
Recent Developments
• $21.5 billion capital investment forecast (2010 – 2014)
• Progress made on Tehachapi and Devers-Colorado River transmission projects
• Installed first 150,000 Edison SmartConnectTM meters
Key Core Earnings Drivers
Rate base growth
$0.09
Recovery of HECA/generator refunds2
0.04
Income taxes
(0.04)
Other
(0.01)
Total
$0.08
1 See Use of Non-GAAP Financial Measures in Appendix and Fourth Quarter Earnings Summary slide for reconciliation of core earnings per share to basic earnings per share.
2 HECA is the acronym for Hydrogen Energy California.
March 1, 2010 3 EDISON INTERNATIONAL®
Leading the Way in Electricity SM
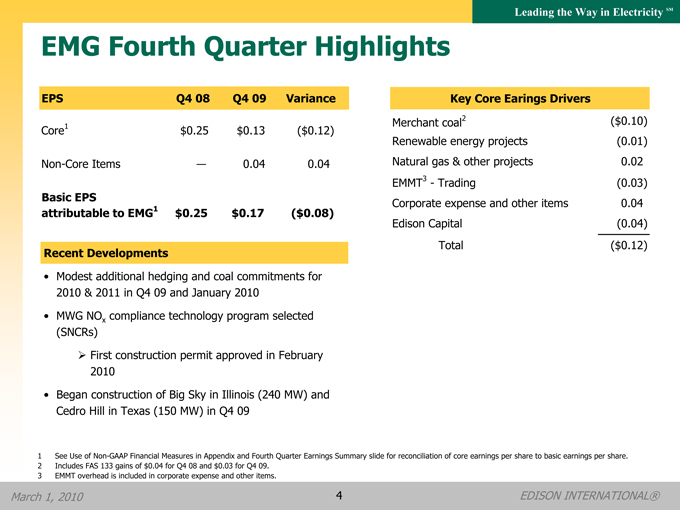
EMG Fourth Quarter Highlights
EPS
Q4 08
Q4 09
Variance
Core1
$0.25
$0.13
($0.12)
Non-Core Items
—
0.04
0.04
Basic EPSattributable to EMG1
$0.25
$0.17
($0.08)
Recent Developments
• Modest additional hedging and coal commitments for 2010 & 2011 in Q4 09 and January 2010
• MWG NOx compliance technology program selected (SNCRs)
?First construction permit approved in February 2010
• Began construction of Big Sky in Illinois (240 MW) and Cedro Hill in Texas (150 MW) in Q4 09
Key Core Earings Drivers
Merchant coal2
($0.10)
Renewable energy projects
(0.01)
Natural gas & other projects
0.02
EMMT3—Trading
(0.03)
Corporate expense and other items
0.04
Edison Capital
(0.04)
Total
($0.12)
1 See Use of Non-GAAP Financial Measures in Appendix and Fourth Quarter Earnings Summary slide for reconciliation of core earnings per share to basic earnings per share.
2 Includes FAS 133 gains of $0.04 for Q4 08 and $0.03 for Q4 09.
3 EMMT overhead is included in corporate expense and other items.
March 1, 2010 4 EDISON INTERNATIONAL®
Leading the Way in Electricity SM
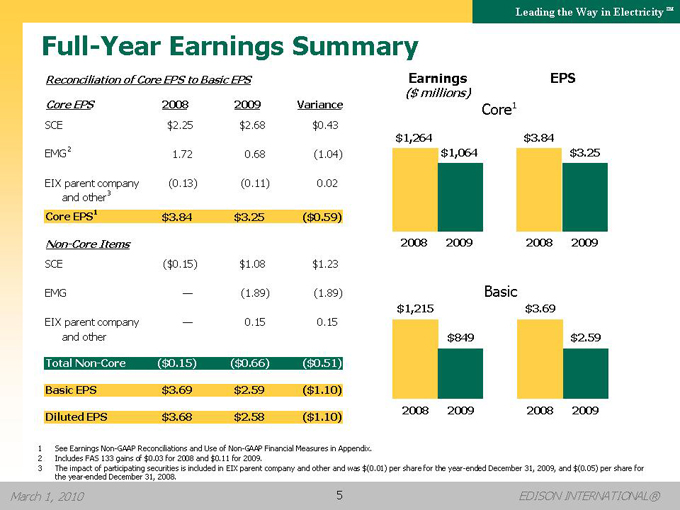
Full-Year Earnings Summary
Reconciliation of Core EPS to Basic EPS
Core EPS
2008
2009
Variance
SCE
$2.25
$2.68
$0.43
EMG2
1.72
0.68
(1.04)
EIX parent company and other3
(0.13)
(0.11)
0.02
Core EPS1
$3.84
$3.25
($0.59)
Non-Core Items
SCE
($0.15)
$1.08
$1.23
EMG
—
(1.89)
(1.89)
EIX parent company and other
—
0.15
0.15
Total Non-Core
($0.15)
($0.66)
($0.51)
Basic EPS
$3.69
$2.59
($1.10)
Diluted EPS
$3.68
$2.58
($1.10)
Earnings EPS
($ millions)
Core1
$1,264 $3.84 $1,064 $3.25
2008 2009 2008 2009
Basic
$1,215 $3.69
$849 $2.59
2008 2009 2008 2009
1 | | See Earnings Non-GAAP Reconciliations and Use of Non-GAAP Financial Measures in Appendix. |
2 | | Includes FAS 133 gains of $0.03 for 2008 and $0.11 for 2009. |
3 | | The impact of participating securities is included in EIX parent company and other and was $(0.01) per share for the year-ended December 31, 2009, and $(0.05) per share for the year-ended December 31, 2008. |
March 1, 2010 5 EDISON INTERNATIONAL®
Leading the Way in Electricity SM
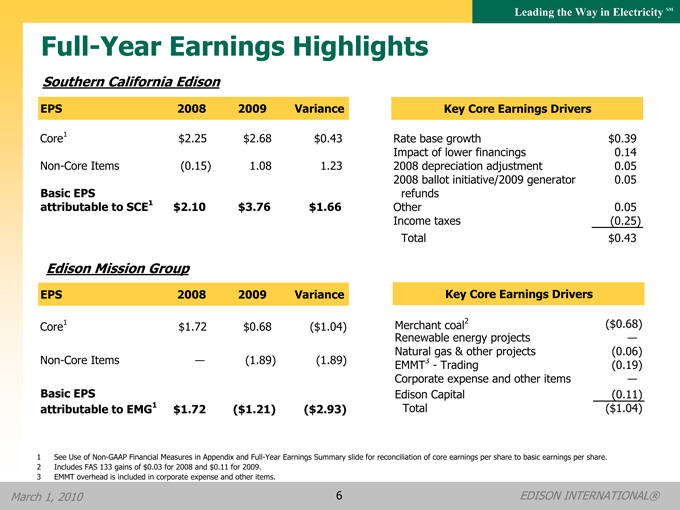
Full-Year Earnings Highlights
Southern California Edison
EPS
2008
2009
Variance
Core1
$2.25
$2.68
$0.43
Non-Core Items
(0.15)
1.08
1.23
Basic EPSattributable to SCE1
$2.10
$3.76
$1.66
Edison Mission Group
EPS
2008
2009
Variance
Core1
$1.72
$0.68
($1.04)
Non-Core Items
—
(1.89)
(1.89)
Basic EPSattributable to EMG1
$1.72
($1.21)
($2.93)
Key Core Earnings Drivers
Rate base growth
$0.39
Impact of lower financings
0.14
2008 depreciation adjustment
0.05
2008 ballot initiative/2009 generator
0.05
refunds
Other
0.05
Income taxes
(0.25)
Total
$0.43
Key Core Earnings Drivers
Merchant coal2
($0.68)
Renewable energy projects
—
Natural gas & other projects
(0.06)
EMMT3—Trading
(0.19)
Corporate expense and other items
—
Edison Capital
(0.11)
Total
($1.04)
1 See Use of Non-GAAP Financial Measures in Appendix and Full-Year Earnings Summary slide for reconciliation of core earnings per share to basic earnings per share.
2 Includes FAS 133 gains of $0.03 for 2008 and $0.11 for 2009.
3 EMMT overhead is included in corporate expense and other items.
March 1, 2010 6 EDISON INTERNATIONAL®
Leading the Way in Electricity SM
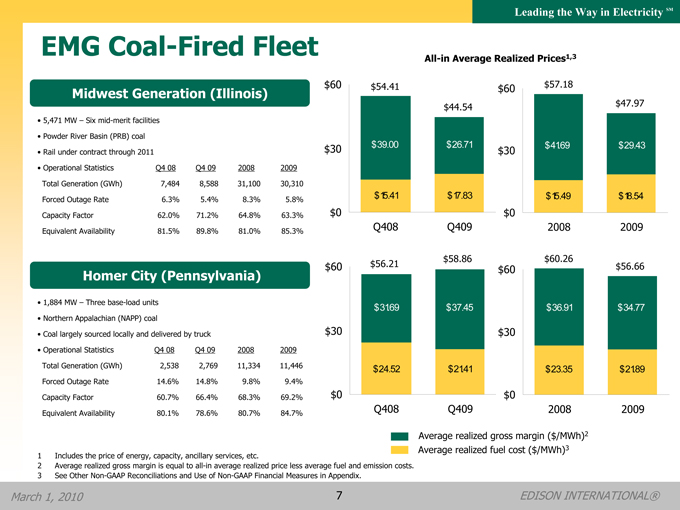
EMG Coal-Fired Fleet
Midwest Generation (Illinois)
• 5,471 MW – Six mid-merit facilities
• Powder River Basin (PRB) coal
• Rail under contract through 2011
• Operational Statistics
Q4 08
Q4 09
2008
2009
Total Generation (GWh)
7,484
8,588
31,100
30,310
Forced Outage Rate
6.3%
5.4%
8.3%
5.8%
Capacity Factor
62.0%
71.2%
64.8%
63.3%
Equivalent Availability
81.5%
89.8%
81.0%
85.3%
Homer City (Pennsylvania)
• 1,884 MW – Three base-load units
• Northern Appalachian (NAPP) coal
• Coal largely sourced locally and delivered by truck
• Operational Statistics
Q4 08
Q4 09
2008
2009
Total Generation (GWh)
2,538
2,769
11,334
11,446
Forced Outage Rate
14.6%
14.8%
9.8%
9.4%
Capacity Factor
60.7%
66.4%
68.3%
69.2%
Equivalent Availability
80.1%
78.6%
80.7%
84.7%
All-in Average Realized Prices1,3
$60 $54.41 $60 $57.18
$44.54 $47.97
$30 $39.00 $26.71 $41 .69 $29.43 $30
$15.41 $17.83 $15.49 $18.54
$0 $0
Q408 Q409 2008 2009
$58.86 $60.26
$60 $56.21 $56.66 $60
$31 .69 $37.45 $36.91 $34.77
$30 $30
$24.52 $21 .41 $23.35 $21 .89
$0 $0
Q408 Q409 2008 2009
Average realized gross margin ($/MWh)2 Average realized fuel cost ($/MWh)3
1 | | Includes the price of energy, capacity, ancillary services, etc. |
2 | | Average realized gross margin is equal to all-in average realized price less average fuel and emission costs. |
3 | | See Other Non-GAAP Reconciliations and Use of Non-GAAP Financial Measures in Appendix. |
March 1, 2010 7 EDISON INTERNATIONAL®
Leading the Way in Electricity SM
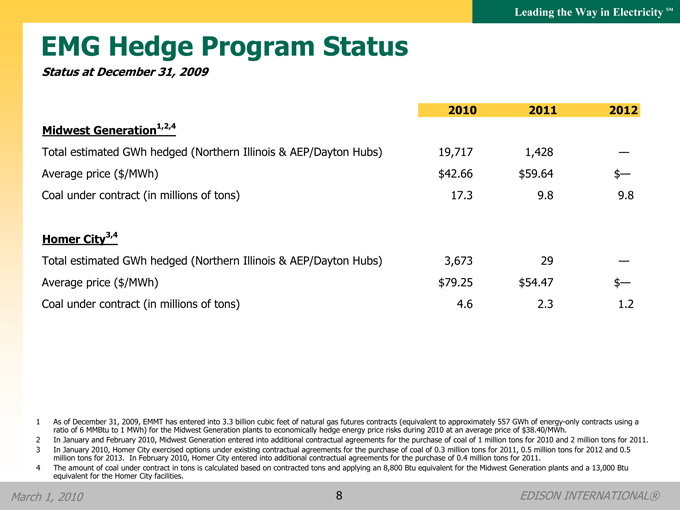
EMG Hedge Program Status
Status at December 31, 2009
Midwest Generation1,2,4
Total estimated GWh hedged (Northern Illinois & AEP/Dayton Hubs) Average price ($/MWh) Coal under contract (in millions of tons)
Homer City3,4
Total estimated GWh hedged (Northern Illinois & AEP/Dayton Hubs) Average price ($/MWh) Coal under contract (in millions of tons)
2010
2011
2012
19,717
1,428
—
$42.66
$59.64
$—
17.3
9.8
9.8
3,673
29
—
$79.25
$54.47
$—
4.6
2.3
1.2
1 As of December 31, 2009, EMMT has entered into 3.3 billion cubic feet of natural gas futures contracts (equivalent to approximately 557 GWh of energy-only contracts using a ratio of 6 MMBtu to 1 MWh) for the Midwest Generation plants to economically hedge energy price risks during 2010 at an average price of $38.40/MWh.
2 In January and February 2010, Midwest Generation entered into additional contractual agreements for the purchase of coal of 1 million tons for 2010 and 2 million tons for 2011.
3 In January 2010, Homer City exercised options under existing contractual agreements for the purchase of coal of 0.3 million tons for 2011, 0.5 million tons for 2012 and 0.5 million tons for 2013. In February 2010, Homer City entered into additional contractual agreements for the purchase of 0.4 million tons for 2011.
4 The amount of coal under contract in tons is calculated based on contracted tons and applying an 8,800 Btu equivalent for the Midwest Generation plants and a 13,000 Btu equivalent for the Homer City facilities.
March 1, 2010 8 EDISON INTERNATIONAL®
Leading the Way in Electricity SM
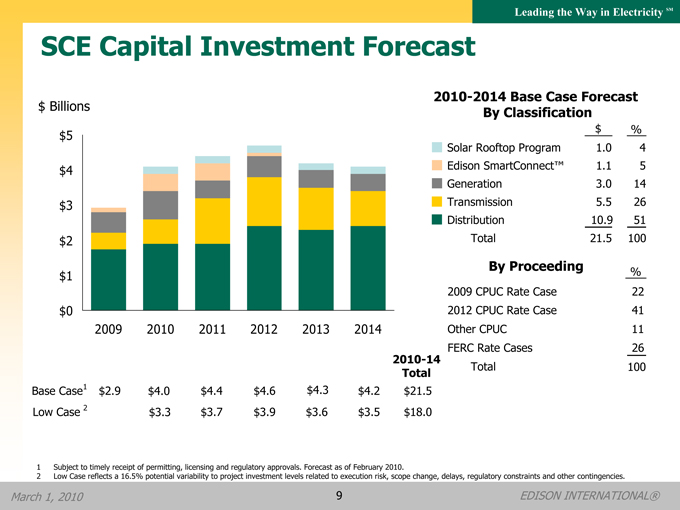
SCE Capital Investment Forecast
$ Billions $5
$4 $3 $2 $1 $0
2009 2010 2011 2012 2013 2014
2010-2014 Base Case Forecast By Classification
$
%
Solar Rooftop Program
1.0
4
Edison SmartConnect™
1.1
5
Generation
3.0
14
Transmission
5.5
26
Distribution
10.9
51
Total
21.5
100
By Proceeding
%
2009
CPUC Rate Case
22
2012
CPUC Rate Case
41
Other CPUC
11
FERC Rate Cases
26
Total
100
2010-14
Total
Base Case1
$2.9
$4.0
$4.4
$4.6
$4.3
$4.2
$21.5
Low Case 2
$3.3
$3.7
$3.9
$3.6
$3.5
$18.0
1 | | Subject to timely receipt of permitting, licensing and regulatory approvals. Forecast as of February 2010. |
2 | | Low Case reflects a 16.5% potential variability to project investment levels related to execution risk, scope change, delays, regulatory constraints and other contingencies. |
March 1, 2010 9 EDISON INTERNATIONAL®
Leading the Way in Electricity SM
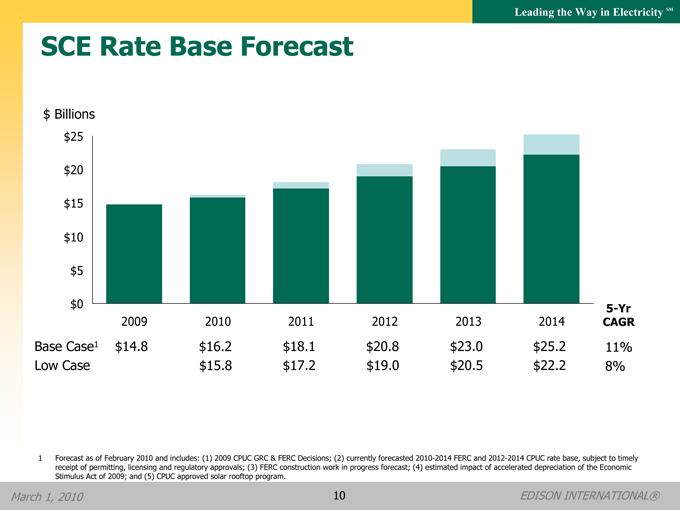
SCE Rate Base Forecast
$ Billions $25
$20 $15 $10 $5 $0
5-Yr
2009
2010
2011
2012
2013
2014
CAGR
Base Case1
$14.8
$16.2
$18.1
$20.8
$23.0
$25.2
11%
Low Case
$15.8
$17.2
$19.0
$20.5
$22.2
8%
1 Forecast as of February 2010 and includes: (1) 2009 CPUC GRC & FERC Decisions; (2) currently forecasted 2010-2014 FERC and 2012-2014 CPUC rate base, subject to timely receipt of permitting, licensing and regulatory approvals; (3) FERC construction work in progress forecast; (4) estimated impact of accelerated depreciation of the Economic Stimulus Act of 2009; and (5) CPUC approved solar rooftop program.
March 1, 2010 10 EDISON INTERNATIONAL®
Leading the Way in Electricity SM
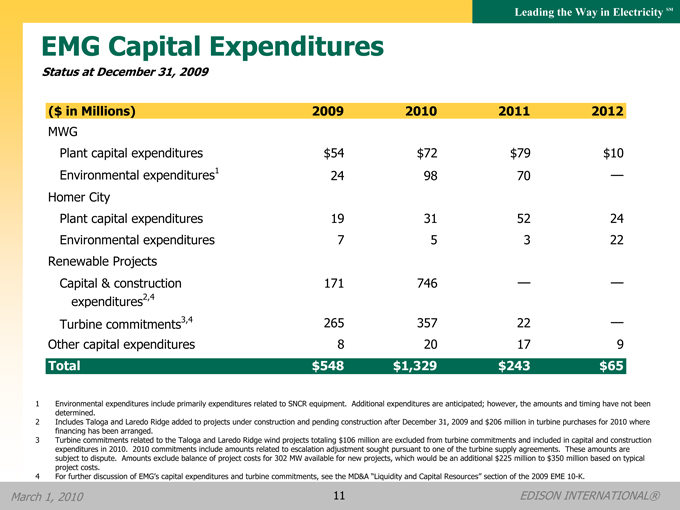
EMG Capital Expenditures
Status at December 31, 2009
($ in Millions)
2009
2010
2011
2012
MWG
Plant capital expenditures
$54
$72
$79
$10
Environmental expenditures1
24
98
70
—
Homer City
Plant capital expenditures
19
31
52
24
Environmental expenditures
7
5
3
22
Renewable Projects
Capital & construction
171
746
—
—
expenditures2,4
Turbine commitments3,4
265
357
22
—
Other capital expenditures
8
20
17
9
Total
$548
$1,329
$243
$65
1 Environmental expenditures include primarily expenditures related to SNCR equipment. Additional expenditures are anticipated; however, the amounts and timing have not been determined.
2 Includes Taloga and Laredo Ridge added to projects under construction and pending construction after December 31, 2009 and $206 million in turbine purchases for 2010 where financing has been arranged.
3 Turbine commitments related to the Taloga and Laredo Ridge wind projects totaling $106 million are excluded from turbine commitments and included in capital and construction expenditures in 2010. 2010 commitments include amounts related to escalation adjustment sought pursuant to one of the turbine supply agreements. These amounts are subject to dispute. Amounts exclude balance of project costs for 302 MW available for new projects, which would be an additional $225 million to $350 million based on typical project costs.
4 For further discussion of EMG’s capital expenditures and turbine commitments, see the MD&A “Liquidity and Capital Resources” section of the 2009 EME 10-K.
March 1, 2010 11 EDISON INTERNATIONAL®
Leading the Way in Electricity SM
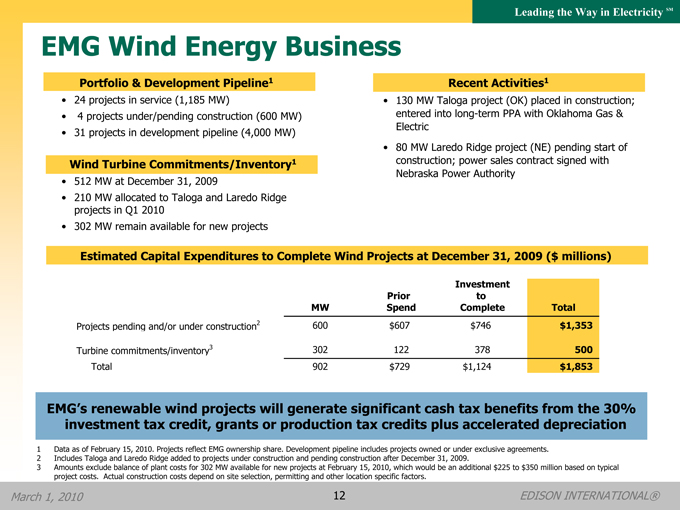
EMG Wind Energy Business
Portfolio & Development Pipeline1
• 24 projects in service (1,185 MW)
• | | 4 projects under/pending construction (600 MW) |
• 31 projects in development pipeline (4,000 MW)
Wind Turbine Commitments/Inventory1
• 512 MW at December 31, 2009
• 210 MW allocated to Taloga and Laredo Ridge projects in Q1 2010
• 302 MW remain available for new projects
Recent Activities1
130 MW Taloga project (OK) placed in construction; entered into long-term PPA with Oklahoma Gas & Electric
80 MW Laredo Ridge project (NE) pending start of construction; power sales contract signed with Nebraska Power Authority
Estimated Capital Expenditures to Complete Wind Projects at December 31, 2009 ($ millions)
MW
Prior Spend
Investment to Complete
Total
Projects pending and/or under construction2
600
$607
$746
$1,353
Turbine commitments/inventory3
302
122
378
500
Total
902
$729
$1,124
$1,853
EMG’s renewable wind projects will generate significant cash tax benefits from the 30% investment tax credit, grants or production tax credits plus accelerated depreciation
1 Data as of February 15, 2010. Projects reflect EMG ownership share. Development pipeline includes projects owned or under exclusive agreements.
2 Includes Taloga and Laredo Ridge added to projects under construction and pending construction after December 31, 2009.
3 Amounts exclude balance of plant costs for 302 MW available for new projects at February 15, 2010, which would be an additional $225 to $350 million based on typical project costs. Actual construction costs depend on site selection, permitting and other location specific factors.
March 1, 2010 12 EDISON INTERNATIONAL®
Leading the Way in Electricity SM
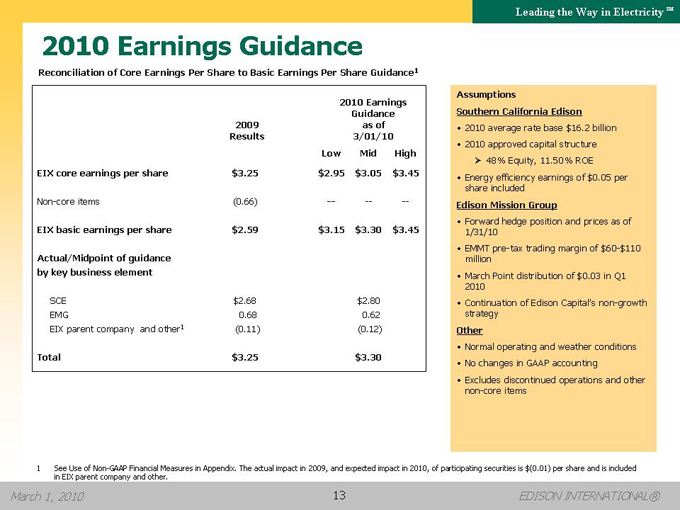
2010 Earnings Guidance
Reconciliation of Core Earnings Per Share to Basic Earnings Per Share Guidance1
2009 Results
2010 Earnings Guidance as of 3/01/10
Low
Mid
High
EIX core earnings per share
$3.25
$2.95
$3.05
$3.45
Non-core items
(0.66)
—
—
—
EIX basic earnings per share
$2.59
$3.15
$3.30
$3.45
Actual/Midpoint of guidance by key business element
SCE
$2.68
$2.80
EMG
0.68
0.62
EIX parent company and other1
(0.11)
(0.12)
Total
$3.25
$3.30
Assumptions
Southern California Edison
• 2010 average rate base $16.2 billion
• 2010 approved capital structure
??48% Equity, 11.50% ROE
• Energy efficiency earnings of $0.05 per share included
Edison Mission Group
• Forward hedge position and prices as of 1/31/10
• Increased plant outage activity at MWG
• March Point distribution of $0.03 in Q1 2010
• Continuation of Edison Capital’s non-growth strategy
Other
• Normal operating and weather conditions
• No changes in GAAP accounting
• Excludes discontinued operations and other non-core items
1 See Use of Non-GAAP Financial Measures in Appendix. The actual impact in 2009, and expected impact in 2010, of participating securities is $(0.01) per share and is included in EIX parent company and other.
March 1, 2010 13 EDISON INTERNATIONAL®
Leading the Way in Electricity SM
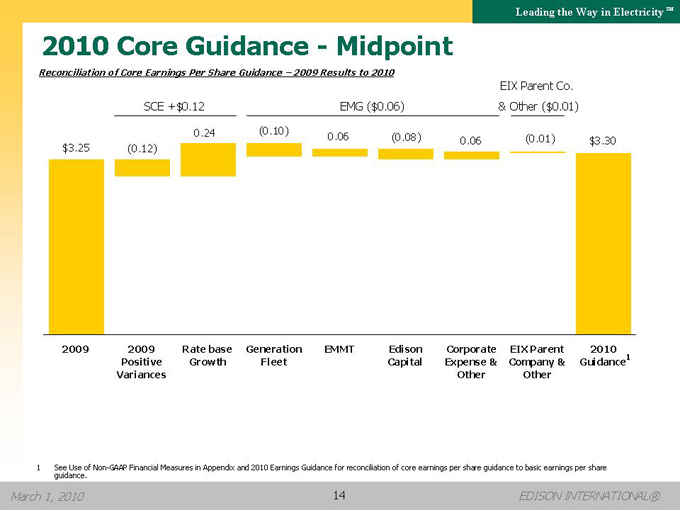
2010 Core Guidance—Midpoint
Reconciliation of Core Earnings Per Share Guidance – 2009 Results to 2010
SCE +$0.12
EMG ($0.06)
& Other ($0.01)
EIX Parent Co.
0.24
(0.10)
0.06
(0.08)
0.06
(0.01)
$3.30
$3.25
(0.12)
2009
2009 Positive Variances
Rate base Growth
Generation Fleet
EMMT
Edison Capital
Corporate Expense & Other
EIX Parent Company & Other
2010 Guidance1
1 See Use of Non-GAAP Financial Measures in Appendix and 2010 Earnings Guidance for reconciliation of core earnings per share guidance to basic earnings per share guidance.
March 1, 2010 14 EDISON INTERNATIONAL®
Leading the Way in Electricity SM
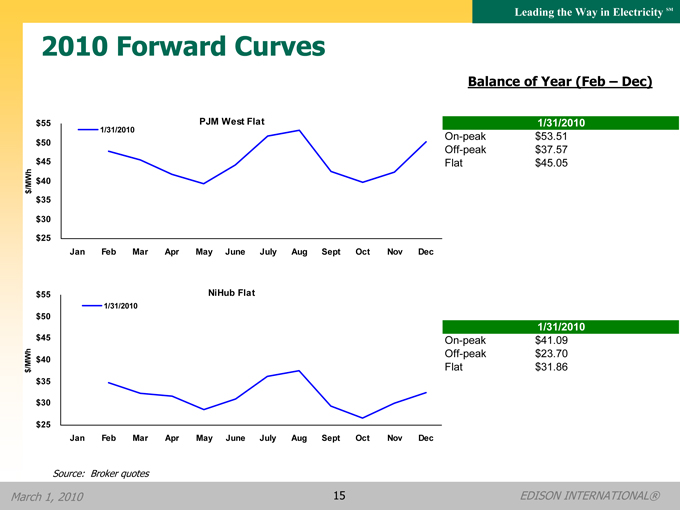
2010 Forward Curves
$55
$50
$45 /MWh $40 $ $35
$30
$25
PJM West Flat 1/31/2010
Jan Feb Mar Apr May June July Aug Sept Oct Nov Dec
$55
$50
$45 /MWh $40 $ $35
$30
$25
NiHub Flat 1/31/2010
Jan Feb Mar Apr May June July Aug Sept Oct Nov Dec
Balance of Year (Feb – Dec)
1/31/2010
On-peak
$53.51
Off-peak
$37.57
Flat
$45.05
1/31/2010
On-peak
$41.09
Off-peak
$23.70
Flat
$31.86
Source: Broker quotes
March 1, 2010 15 EDISON INTERNATIONAL®

Leading the Way in Electricity SM
Appendix
March 1, 2010 16 EDISON INTERNATIONAL®
Leading the Way in Electricity SM
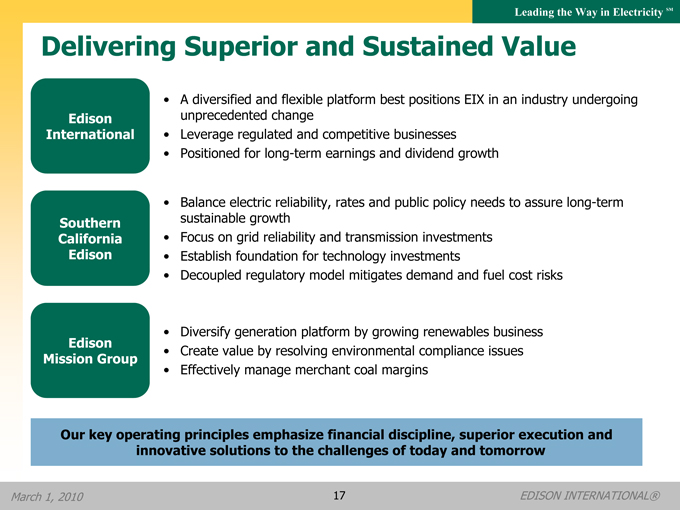
Delivering Superior and Sustained Value
Edison International
Southern California Edison
Edison Mission Group
A diversified and flexible platform best positions EIX in an industry undergoing unprecedented change Leverage regulated and competitive businesses Positioned for long-term earnings and dividend growth
Balance electric reliability, rates and public policy needs to assure long-term sustainable growth Focus on grid reliability and transmission investments Establish foundation for technology investments Decoupled regulatory model mitigates demand and fuel cost risks
Diversify generation platform by growing renewables business Create value by resolving environmental compliance issues Effectively manage merchant coal margins
Our key operating principles emphasize financial discipline, superior execution and innovative solutions to the challenges of today and tomorrow
March 1, 2010 17 EDISON INTERNATIONAL®
Leading the Way in Electricity SM
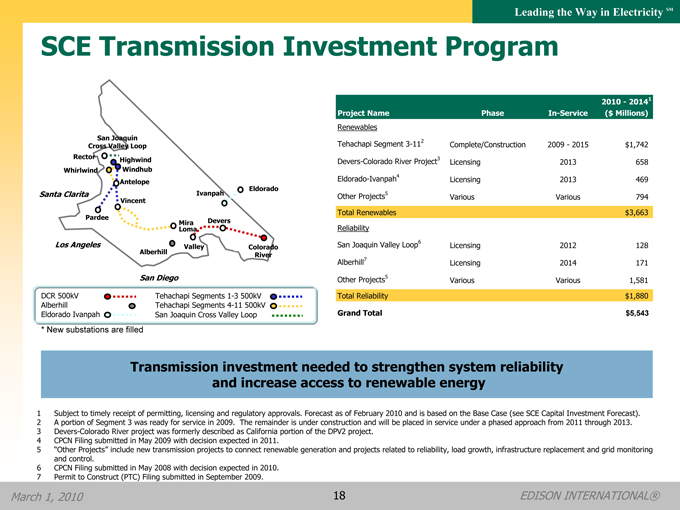
SCE Transmission Investment Program
San Joaquin
Cross Valley Loop
Rector
Highwind
Whirlwind
Windhub
Antelope
Santa Clarita
Ivanpah
Eldorado
Vincent
Pardee
MiraLoma Devers
Los Angeles
Valley
Colorado
Alberhill
River
San Diego
DCR 500kV
Tehachapi Segments 1-3 500kV
Alberhill
Tehachapi Segments 4-11 500kV
Eldorado Ivanpah
San Joaquin Cross Valley Loop
* New substations are filled
Project Name
Phase
In-Service
2010 - 20141 ($ Millions)
Renewables
Tehachapi Segment 3-112
Complete/Construction
2009 - 2015
$1,742
Devers-Colorado River Project3
Licensing
2013
658
Eldorado-Ivanpah4
Licensing
2013
469
Other Projects5
Various
Various
794
Total Renewables
$3,663
Reliability
San Joaquin Valley Loop6
Licensing
2012
128
Alberhill7
Licensing
2014
171
Other Projects5
Various
Various
1,581
Total Reliability
$1,880
Grand Total
$5,543
Transmission investment needed to strengthen system reliability and increase access to renewable energy
1 Subject to timely receipt of permitting, licensing and regulatory approvals. Forecast as of February 2010 and is based on the Base Case (see SCE Capital Investment Forecast).
2 A portion of Segment 3 was ready for service in 2009. The remainder is under construction and will be placed in service under a phased approach from 2011 through 2013.
3 Devers-Colorado River project was formerly described as California portion of the DPV2 project.
4 CPCN Filing submitted in May 2009 with decision expected in 2011.
5 “Other Projects” include new transmission projects to connect renewable generation and projects related to reliability, load growth, infrastructure replacement and grid monitoring and control.
6 CPCN Filing submitted in May 2008 with decision expected in 2010.
7 Permit to Construct (PTC) Filing submitted in September 2009.
March 1, 2010 18 EDISON INTERNATIONAL®
Leading the Way in Electricity SM
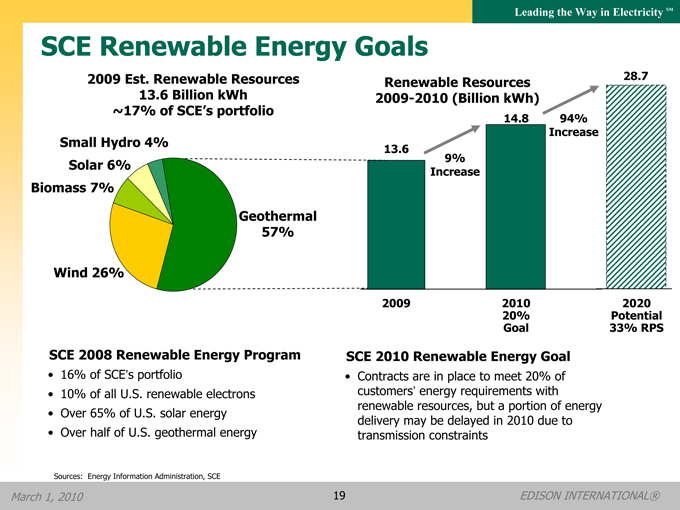
SCE Renewable Energy Goals
2009 Est. Renewable Resources 13.6 Billion kWh ~17% of SCE’s portfolio
Small Hydro 4% Solar 6% Biomass 7%
Geothermal 57%
Wind 26%
Renewable Resources 28.7 2009-2010 (Billion kWh)
28.7
13.6
9% Increase
14.8 94% Increase
2009
2010 20% Goal
2020 Potential 33% RPS
SCE 2008 Renewable Energy Program
• 16% of SCE’s portfolio
• 10% of all U.S. renewable electrons
• Over 65% of U.S. solar energy
• Over half of U.S. geothermal energy
SCE 2010 Renewable Energy Goal
• Contracts are in place to meet 20% of customers’ energy requirements with renewable resources, but a portion of energy delivery may be delayed in 2010 due to transmission constraints
Sources: Energy Information Administration, SCE
March 1, 2010 19 EDISON INTERNATIONAL®
Leading the Way in Electricity SM
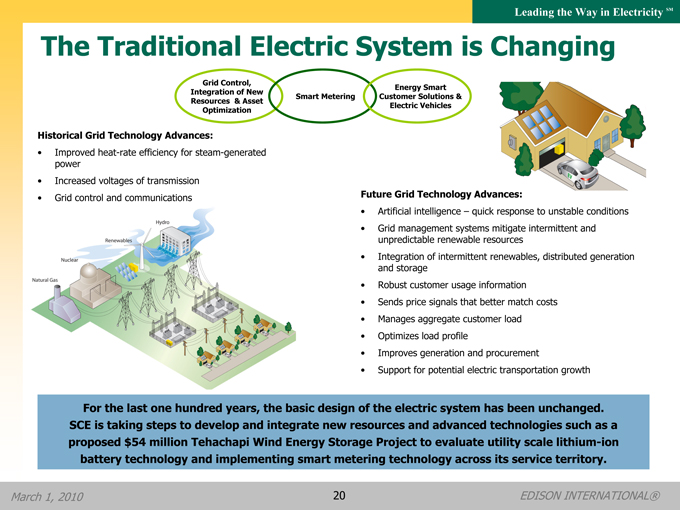
The Traditional Electric System is Changing
Grid Control, Integration of New Resources & Asset Optimization
Smart Metering
Energy Smart Customer Solutions & Electric Vehicles
Historical Grid Technology Advances:
• Improved heat-rate efficiency for steam-generated power
• Increased voltages of transmission
• Grid control and communications
Future Grid Technology Advances:
• Artificial intelligence – quick response to unstable conditions
• Grid management systems mitigate intermittent and unpredictable renewable resources
• Integration of intermittent renewables, distributed generation and storage
• Robust customer usage information
• Sends price signals that better match costs
• Manages aggregate customer load
• Optimizes load profile
• Improves generation and procurement
• Support for potential electric transportation growth
For the last one hundred years, the basic design of the electric system has been unchanged. SCE is taking steps to develop and integrate new resources and advanced technologies such as a proposed $54 million Tehachapi Wind Energy Storage Project to evaluate utility scale lithium-ion battery technology and implementing smart metering technology across its service territory.
March 1, 2010 20 EDISON INTERNATIONAL®
Leading the Way in Electricity SM
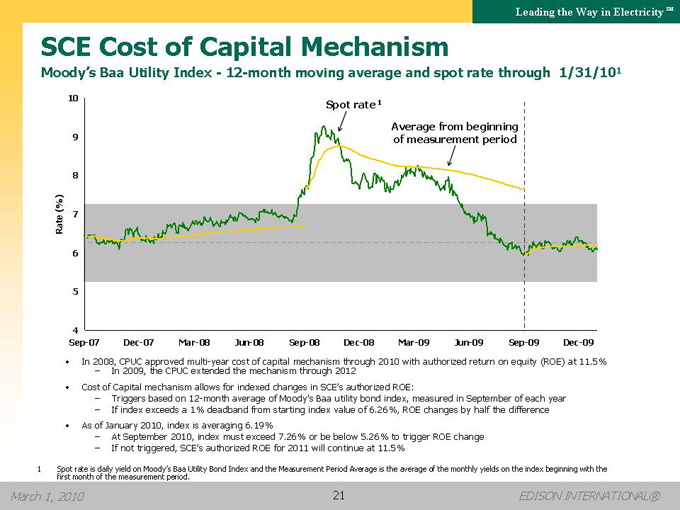
SCE Cost of Capital Mechanism
Moody’s Baa Utility Index - 12-month moving average and spot rate through 1/31/101
10
9
(%) 7 Rate 6
Spot rate
Average from beginning of measurement period
Sep-07 Dec-07 Mar-08 Jun-08 Sep-08 Dec-08 Mar-09 Jun-09 Sep-09 Dec-09
• In 2008, – In CPUC 2009, approved the CPUC multi extended -year cost the mechanism of capital mechanism through 2012 through 2010 with authorized return on equity (ROE) at 11.5%
• Cost of Capital mechanism allows for indexed changes in SCE’s authorized ROE:
– Triggers based on 12-month average of Moody’s Baa utility bond index, measured in September of each year
– If index exceeds a 1% deadband from starting index value of 6.26%, ROE changes by half the difference
• As of January 2010, index is averaging 6.19%
– At September 2010, index must exceed 7.26% or be below 5.26% to trigger ROE change
– If not triggered, SCE’s authorized ROE for 2011 will continue at 11.5%
1 Spot rate is daily yield on Moody’s Baa Utility Bond Index and the Measurement Period Average is the average of the monthly yields on the index beginning with the first month of the measurement period.
March 1, 2010 21 EDISON INTERNATIONAL®
Leading the Way in Electricity SM
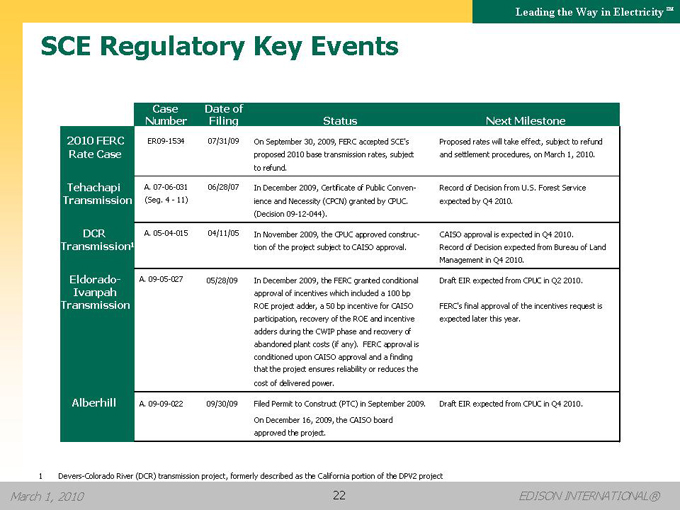
SCE Regulatory Key Events
Case Number
Date of Filing
Status
Next Milestone
2010 FERC Rate Case
ER09-1534
07/31/09
On September 30, 2009, FERC accepted SCE’s proposed 2010 base transmission rates, subject to refund.
Proposed rates will take effect, subject to refund and settlement procedures, on March 1, 2010.
Tehachapi Transmission
A. 07-06-031 (Seg. 4 - 11)
06/28/07
In December 2009, Certificate of Public Conven- ience and Necessity (CPCN) granted by CPUC. (Decision 09-12-044).
Record of Decision from U.S. Forest Service expected by Q4 2010.
DCR Transmission1
A.05— A.05-04— 015
04/11/05
In November 2009, the CPUC approved construc- tion of the project subject to CAISO approval.
CAISO approval is expected in Q4 2010. Record of Decision expected from Bureau of Land Management in Q4 2010.
Eldorado- Ivanpah Transmission1 Transmission
A.09— A.09-05— 027
05/28/09
In December 2009, the FERC granted conditional approval of incentives which included a 100 bp ROE project adder, a 50 bp incentive for CAISO participation, recovery of the ROE and incentive adders during the CWIP phase and recovery of abandoned plant costs (if any). FERC approval is conditioned upon CAISO approval and a finding that the project ensures reliability or reduces the cost of delivered power.
Draft EIR expected from CPUC in Q2 2010. FERC’s final approval of the incentives request is expected later this year.
Alberhill
A.09— A.09-09— 022
09/30/09
Filed Permit to Construct (PTC) in September 2009. On December 16, 2009, the CAISO board approved the project.
Draft EIR expected from CPUC in Q4 2010.
1 Devers-Colorado River (DCR) transmission project, formerly described as the California portion of the DPV2 project
March 1, 2010 22 EDISON INTERNATIONAL®
Leading the Way in Electricity SM
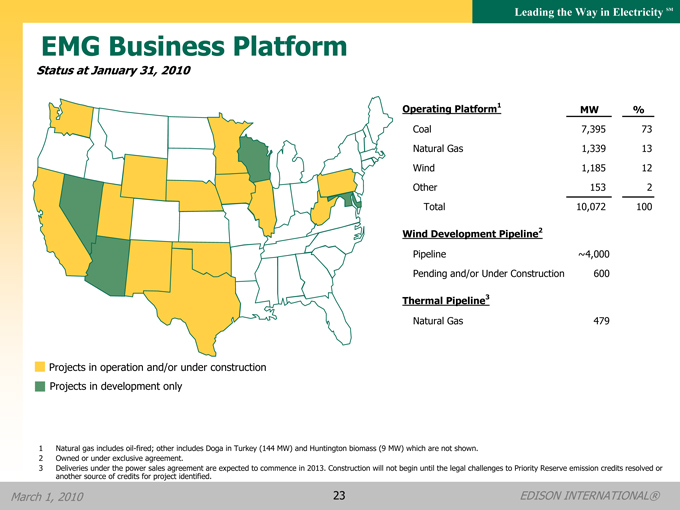
EMG Business Platform
Status at January 31, 2010
Projects in operation and/or under construction Projects in development only
Operating Platform1
MW
%
Coal
7,395
73
Natural Gas
1,339
13
Wind
1,185
12
Other
153
2
Total
10,072
100
Wind Development Pipeline2
Pipeline
~4,000
Pending and/or Under Construction
600
Thermal Pipeline3
Natural Gas
479
1 | | Natural gas includes oil-fired; other includes Doga in Turkey (144 MW) and Huntington biomass (9 MW) which are not shown. |
2 | | Owned or under exclusive agreement. |
3 | | Deliveries under the power sales agreement are expected to commence in 2013. Construction will not begin until the legal challenges to Priority Reserve emission credits resolved or another source of credits for project identified. |
March 1, 2010 23 EDISON INTERNATIONAL®
Leading the Way in Electricity SM
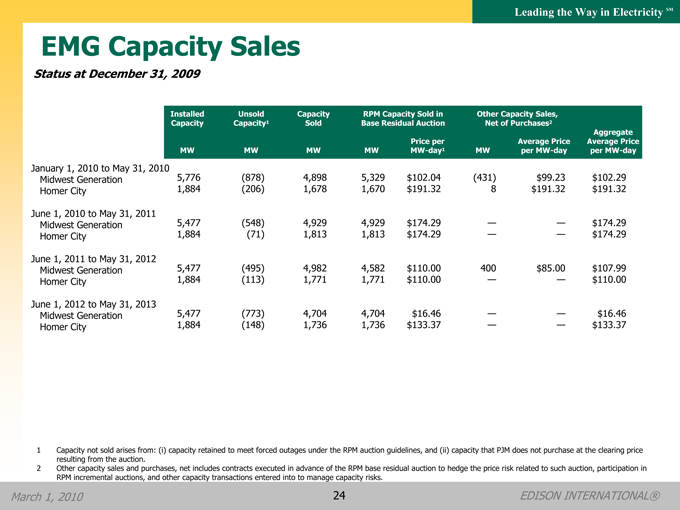
EMG Capacity Sales
Status at December 31, 2009
Installed Capacity
Unsold Capacity1
Capacity Sold
RPM Capacity Sold in Base Residual Auction
Other Capacity Sales, Net of Purchases2
MW
MW
MW
MW
Price per MW-day1
MW
Average Price per MW-day
Aggregate Average Price per MW-day
January 1, 2010 to May 31, 2010
Midwest Generation
5,776
(878)
4,898
5,329
$102.04
(431)
$99.23
$102.29
Homer City
1,884
(206)
1,678
1,670
$191.32
8
$191.32
$191.32
June 1, 2010 to May 31, 2011
Midwest Generation
5,477
(548)
4,929
4,929
$174.29
—
—
$174.29
Homer City
1,884
(71)
1,813
1,813
$174.29
—
—
$174.29
June 1, 2011 to May 31, 2012
Midwest Generation
5,477
(495)
4,982
4,582
$110.00
400
$85.00
$107.99
Homer City
1,884
(113)
1,771
1,771
$110.00
—
—
$110.00
June 1, 2012 to May 31, 2013
Midwest Generation
5,477
(773)
4,704
4,704
$16.46
—
—
$16.46
Homer City
1,884
(148)
1,736
1,736
$133.37
—
—
$133.37
1 Capacity not sold arises from: (i) capacity retained to meet forced outages under the RPM auction guidelines, and (ii) capacity that PJM does not purchase at the clearing price resulting from the auction.
2 Other capacity sales and purchases, net includes contracts executed in advance of the RPM base residual auction to hedge the price risk related to such auction, participation in RPM incremental auctions, and other capacity transactions entered into to manage capacity risks.
March 1, 2010 24 EDISON INTERNATIONAL®
Leading the Way in Electricity SM
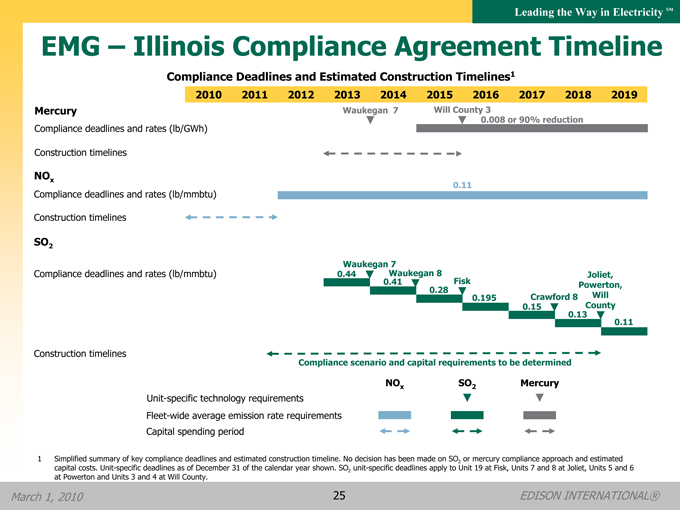
EMG – Illinois Compliance Agreement Timeline
Compliance Deadlines and Estimated Construction Timelines1
2010
2011
2012
2013
2014
2015
2016
2017
2018
2019
Mercury
Waukegan 7
Will County 3
0.008 or 90% reduction
Compliance deadlines and rates (lb/GWh)
Construction timelines
NOx
0.11
Compliance deadlines and rates (lb/mmbtu)
Construction timelines
SO2
Waukegan 7
Compliance deadlines and rates (lb/mmbtu)
0.44
Waukegan 8
Joliet,
0.41
Fisk
Powerton,
0.28
0.195
Crawford 8
Will
0.15
County
0.13
0.11
Construction timelines Compliance scenario and capital requirements to be determined
Unit-specific technology requirements
Fleet-wide average emission rate requirements Capital spending period
NOx SO2 Mercury
1 Simplified summary of key compliance deadlines and estimated construction timeline. No decision has been made on SO2 or mercury compliance approach and estimated capital costs. Unit-specific deadlines as of December 31 of the calendar year shown. SO2 unit-specific deadlines apply to Unit 19 at Fisk, Units 7 and 8 at Joliet, Units 5 and 6 at Powerton and Units 3 and 4 at Will County.
March 1, 2010 25 EDISON INTERNATIONAL®
Leading the Way in Electricity SM
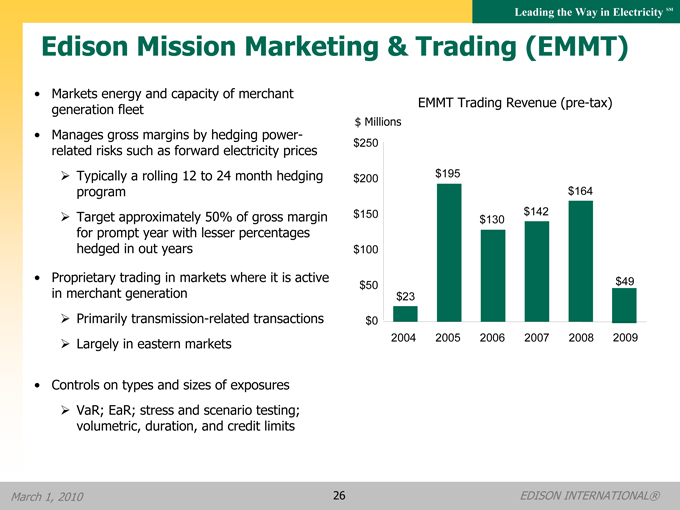
Edison Mission Marketing & Trading (EMMT)
• Markets energy and capacity of merchant generation fleet
• Manages gross margins by hedging power-related risks such as forward electricity prices
?Typically a rolling 12 to 24 month hedging program
?Target approximately 50% of gross margin for prompt year with lesser percentages hedged in out years
• Proprietary trading in markets where it is active in merchant generation
?Primarily transmission-related transactions
?Largely in eastern markets
• Controls on types and sizes of exposures
?VaR; EaR; stress and scenario testing; volumetric, duration, and credit limits
EMMT Trading Revenue (pre-tax)
$ Millions
$250
$200
$195
$164
$150
$142
$130
$100
$50
$49
$23
$0
2004
2005
2006
2007
2008
2009
March 1, 2010 26 EDISON INTERNATIONAL®
Leading the Way in Electricity SM
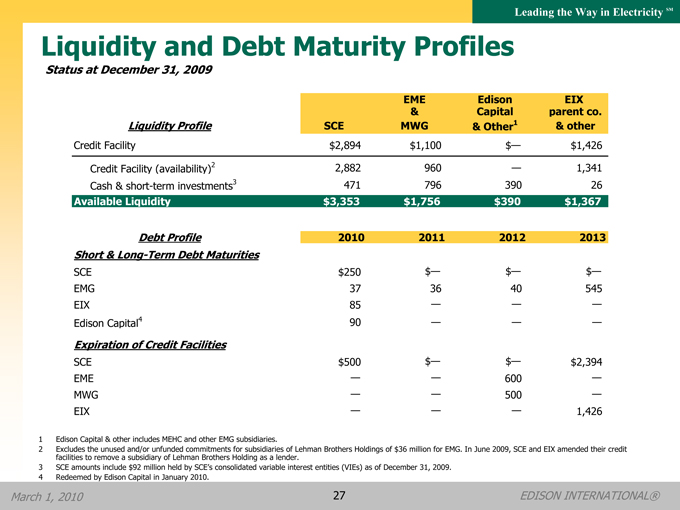
Liquidity and Debt Maturity Profiles
Status at December 31, 2009
Liquidity Profile
SCE
EME & MWG
Edison Capital & Other1
EIX parent co. & other
Credit Facility
$2,894
$1,100
$—
$1,426
Credit Facility (availability)2
2,882
960
—
1,341
Cash & short-term investments3
471
796
390
26
Available Liquidity
$3,353
$1,756
$390
$1,367
Debt Profile
2010
2011
2012
2013
Short & Long-Term Debt Maturities
SCE
$250
$—
$—
$—
EMG
37
36
40
545
EIX
85
—
—
—
Edison Capital4
90
—
—
—
Expiration of Credit Facilities
SCE
$500
$—
$—
$2,394
EME
—
—
600
—
MWG
—
—
500
—
EIX
—
—
—
1,426
1 Edison Capital & other includes MEHC and other EMG subsidiaries.
2 Excludes the unused and/or unfunded commitments for subsidiaries of Lehman Brothers Holdings of $36 million for EMG. In June 2009, SCE and EIX amended their credit facilities to remove a subsidiary of Lehman Brothers Holding as a lender.
3 SCE amounts include $92 million held by SCE’s consolidated variable interest entities (VIEs) as of December 31, 2009.
4 Redeemed by Edison Capital in January 2010.
March 1, 2010 27 EDISON INTERNATIONAL®
Leading the Way in Electricity SM
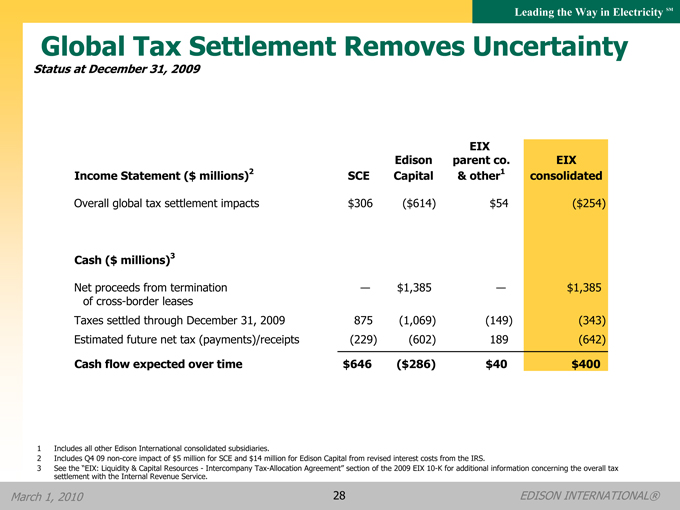
Global Tax Settlement Removes Uncertainty
Status at December 31, 2009
Income Statement ($ millions)2
SCE
Edison Capital
EIX parent co. & other1
EIX consolidated
Overall global tax settlement impacts
$306
($614)
$54
($254)
Cash ($ millions)3
Net proceeds from termination
—
$1,385
—
$1,385
of cross-border leases
Taxes settled through December 31, 2009
875
(1,069)
(149)
(343)
Estimated future net tax (payments)/receipts
(229)
(602)
189
(642)
Cash flow expected over time
$646
($286)
$40
$400
1 Includes all other Edison International consolidated subsidiaries.
2 Includes Q4 09 non-core impact of $5 million for SCE and $14 million for Edison Capital from revised interest costs from the IRS.
3 See the “EIX: Liquidity & Capital Resources—Intercompany Tax-Allocation Agreement” section of the 2009 EIX 10-K for additional information concerning the overall tax settlement with the Internal Revenue Service.
March 1, 2010 28 EDISON INTERNATIONAL®
Leading the Way in Electricity SM
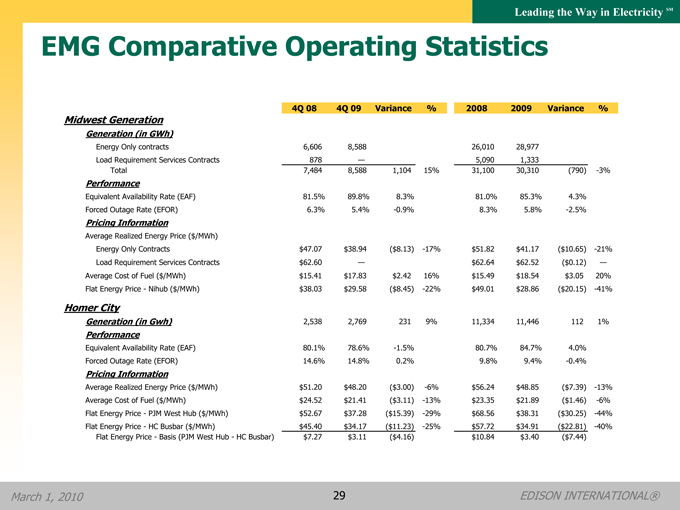
EMG Comparative Operating Statistics
4Q 08
4Q 09
Variance
%
2008
2009
Variance
% Midwest Generation
Generation (in GWh)
Energy Only contracts
6,606
8,588
26,010
28,977
Load Requirement Services Contracts
878
—
5,090
1,333
Total
7,484
8,588
1,104
15%
31,100
30,310
(790)
-3%
Performance
Equivalent Availability Rate (EAF)
81.5%
89.8%
8.3%
81.0%
85.3%
4.3%
Forced Outage Rate (EFOR)
6.3%
5.4%
-0.9%
8.3%
5.8%
-2.5%
Pricing Information
Average Realized Energy Price ($/MWh)
Energy Only Contracts
$47.07
$38.94
($8.13)
-17%
$51.82
$41.17
($10.65)
-21%
Load Requirement Services Contracts
$62.60
—
$62.64
$62.52
($0.12)
—
Average Cost of Fuel ($/MWh)
$15.41
$17.83
$2.42
16%
$15.49
$18.54
$3.05
20%
Flat Energy Price—Nihub ($/MWh)
$38.03
$29.58
($8.45)
-22%
$49.01
$28.86
($20.15)
-41%
Homer City
Generation (in Gwh)
2,538
2,769
231
9%
11,334
11,446
112
1%
Performance
Equivalent Availability Rate (EAF)
80.1%
78.6%
-1.5%
80.7%
84.7%
4.0%
Forced Outage Rate (EFOR)
14.6%
14.8%
0.2%
9.8%
9.4%
-0.4%
Pricing Information
Average Realized Energy Price ($/MWh)
$51.20
$48.20
($3.00)
-6%
$56.24
$48.85
($7.39)
-13%
Average Cost of Fuel ($/MWh)
$24.52
$21.41
($3.11)
-13%
$23.35
$21.89
($1.46)
-6%
Flat Energy Price—PJM West Hub ($/MWh)
$52.67
$37.28
($15.39)
-29%
$68.56
$38.31
($30.25)
-44%
Flat Energy Price—HC Busbar ($/MWh)
$45.40
$34.17
($11.23)
-25%
$57.72
$34.91
($22.81)
-40%
Flat Energy Price—Basis (PJM West Hub—HC Busbar)
$7.27
$3.11
($4.16)
$10.84
$3.40
($7.44)
March 1, 2010 29 EDISON INTERNATIONAL®
Leading the Way in Electricity SM
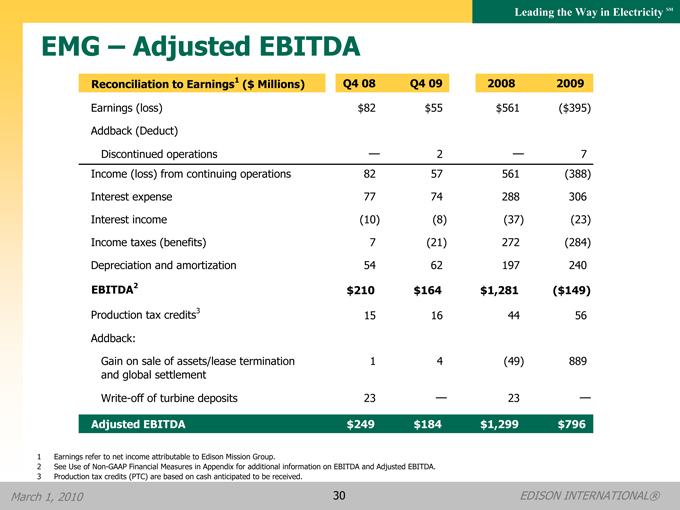
EMG – Adjusted EBITDA
Reconciliation to Earnings1 ($ Millions)
Q4 08
Q4 09
2008
2009
Earnings (loss)
$82
$55
$561
($395)
Addback (Deduct)
Discontinued operations
—
2
—
7
Income (loss) from continuing operations
82
57
561
(388)
Interest expense
77
74
288
306
Interest income
(10)
(8)
(37)
(23)
Income taxes (benefits)
7
(21)
272
(284)
Depreciation and amortization
54
62
197
240
EBITDA2
$210
$164
$1,281
($149)
Production tax credits3
15
16
44
56
Addback:
Gain on sale of assets/lease termination
1
4
(49)
889
and global settlement
Write-off of turbine deposits
23
—
23
—
Adjusted EBITDA
$249
$184
$1,299
$796
1 Earnings refer to net income attributable to Edison Mission Group.
2 See Use of Non-GAAP Financial Measures in Appendix for additional information on EBITDA and Adjusted EBITDA.
3 Production tax credits (PTC) are based on cash anticipated to be received.
March 1, 2010 30 EDISON INTERNATIONAL®
Leading the Way in Electricity SM
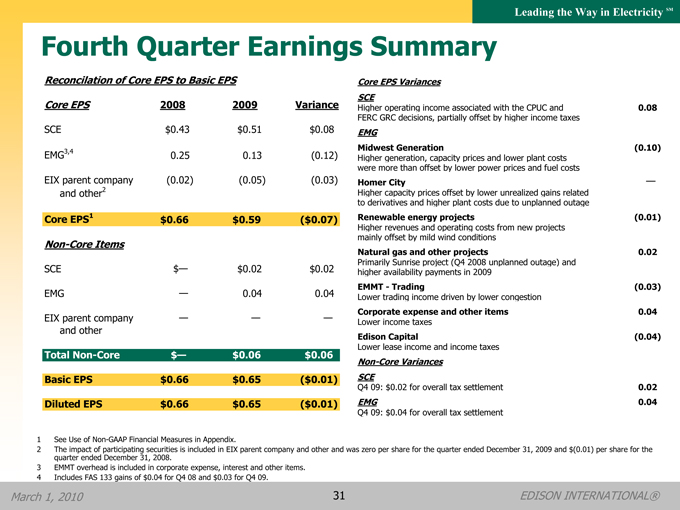
Fourth Quarter Earnings Summary
Reconcilation of Core EPS to Basic EPS
Core EPS
2008
2009
Variance
SCE
$0.43
$0.51
$0.08
EMG3,4
0.25
0.13
(0.12)
EIX parent company
(0.02)
(0.05)
(0.03)
and other2
Core EPS1
$0.66
$0.59
($0.07)
Non-Core Items
SCE
$—
$0.02
$0.02
EMG
—
0.04
0.04
EIX parent company and other
—
—
—
Total Non-Core
$—
$0.06
$0.06
Basic EPS
$0.66
$0.65
($0.01)
Diluted EPS
$0.66
$0.65
($0.01)
Core EPS Variances
SCE
Higher operating income associated with the CPUC and
0.08
FERC GRC decisions, partially offset by higher income taxes
EMG
Midwest Generation
(0.10)
Higher generation, capacity prices and lower plant costs were more than offset by lower power prices and fuel costs
Homer City
—
Higher capacity prices offset by lower unrealized gains related to derivatives and higher plant costs due to unplanned outage
Renewable energy projects
(0.01)
Higher revenues and operating costs from new projects mainly offset by mild wind conditions
Natural gas and other projects
0.02
Primarily Sunrise project (Q4 2008 unplanned outage) and higher availability payments in 2009
EMMT—Trading
(0.03)
Lower trading income driven by lower congestion
Corporate expense and other items
0.04
Lower income taxes
Edison Capital
(0.04)
Lower lease income and income taxes
Non-Core Variances
SCE
Q4 09: $0.02 for overall tax settlement
0.02
EMG
0.04
Q4 09: $0.04 for overall tax settlement
1 See Use of Non-GAAP Financial Measures in Appendix.
2 The impact of participating securities is included in EIX parent company and other and was zero per share for the quarter ended December 31, 2009 and $(0.01) per share for the quarter ended December 31, 2008.
3 EMMT overhead is included in corporate expense, interest and other items.
4 Includes FAS 133 gains of $0.04 for Q4 08 and $0.03 for Q4 09.
March 1, 2010 31 EDISON INTERNATIONAL®
Leading the Way in Electricity SM
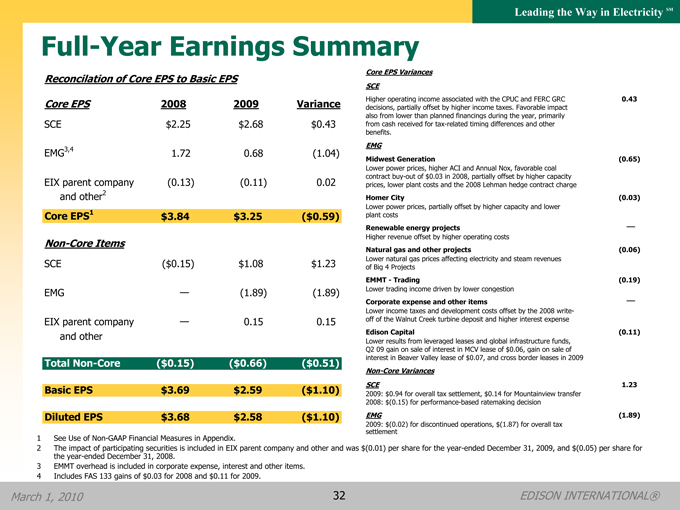
Full-Year Earnings Summary
Reconcilation of Core EPS to Basic EPS
Core EPS
2008
2009
Variance
SCE
$2.25
$2.68
$0.43
EMG3,4
1.72
0.68
(1.04)
EIX parent company and other2
(0.13)
(0.11)
0.02
Core EPS1
$3.84
$3.25
($0.59)
Non-Core Items
SCE
($0.15)
$1.08
$1.23
EMG
—
(1.89)
(1.89)
EIX parent company and other
—
0.15
0.15
Total Non-Core
($0.15)
($0.66)
($0.51)
Basic EPS
$3.69
$2.59
($1.10)
Diluted EPS
$3.68
$2.58
($1.10)
Core EPS Variances
SCE
Higher operating income associated with the CPUC and FERC GRC decisions, partially offset by higher income taxes. Favorable impact also from lower than planned financings during the year, primarily from cash received for tax-related timing differences and other benefits.
0.43
EMG
Midwest Generation
(0.65)
Lower power prices, higher ACI and Annual Nox, favorable coal contract buy-out of $0.03 in 2008, partially offset by higher capacity prices, lower plant costs and the 2008 Lehman hedge contract charge
Homer City
(0.03)
Lower power prices, partially offset by higher capacity and lower plant costs
Renewable energy projects
—
Higher revenue offset by higher operating costs
Natural gas and other projects
(0.06)
Lower natural gas prices affecting electricity and steam revenues of Big 4 Projects
EMMT—Trading
(0.19)
Lower trading income driven by lower congestion
Corporate expense and other items
—
Lower income taxes and development costs offset by the 2008 write- off of the Walnut Creek turbine deposit and higher interest expense
Edison Capital
(0.11)
Lower results from leveraged leases and global infrastructure funds, Q2 09 gain on sale of interest in MCV lease of $0.06, gain on sale of interest in Beaver Valley lease of $0.07, and cross border leases in 2009
Non-Core Variances
SCE
1.23
2009: $0.94 for overall tax settlement, $0.14 for Mountainview transfer
2008: $(0.15) for performance-based ratemaking decision
EMG
(1.89)
2009: $(0.02) for discontinued operations, $(1.87) for overall tax settlement
1 | | See Use of Non-GAAP Financial Measures in Appendix. |
2 | | The impact of participating securities is included in EIX parent company and other and was $(0.01) per share for the year-ended December 31, 2009, and $(0.05) per share for the year-ended December 31, 2008. |
3 | | EMMT overhead is included in corporate expense, interest and other items. |
4 | | Includes FAS 133 gains of $0.03 for 2008 and $0.11 for 2009. |
March 1, 2010 32 EDISON INTERNATIONAL®

Lea
Earnings Non-GAAP Reconciliations
Reconciliation of EIX Core Earnings to EIX GAAP Earnings
Earnings (Loss) (in millions)
Quarter Ended December 31,
Year-Ended December 31,
Attributable to Edison International (Unaudited)
2008
2009
2008
2009
Core Earnings1
SCE
$141
$167
$732
$874
EMG
81
42
561
222
EIX parent company and other
(5)
(15)
(29)
(32)
EIX core earnings
$217
$194
$1,264
$1,064
Non-core items
SCE—regulatory items
—
5
(49)
46
Global tax settlement:
SCE
—
—
—
306
EMG
—
14
—
(610)
EIX parent company and other
—
—
—
50
EMG—discontinued operations
—
(1)
—
(7)
Total non-core items
—
$18
($49)
($215)
EIX GAAP Earnings
$217
$212
$1,215
$849
1 See Use of Non-GAAP Financial Measures in Appendix.
March 1, 2010 33 EDISON INTERNATIONAL®
Leading the Way in Electricity SM
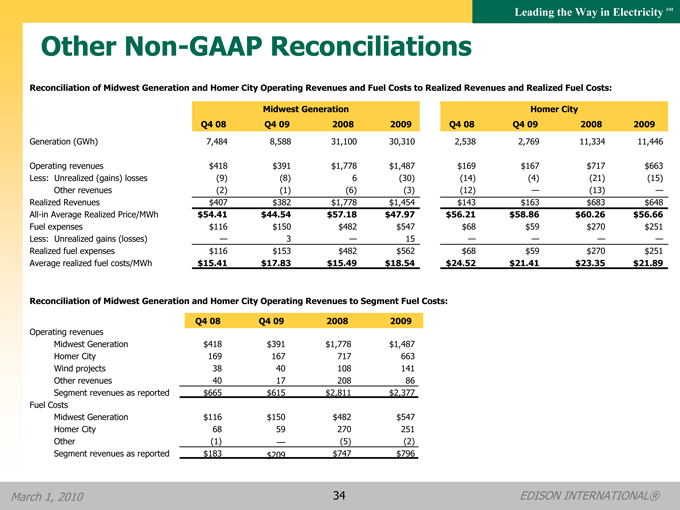
Other Non-GAAP Reconciliations
Reconciliation of Midwest Generation and Homer City Operating Revenues and Fuel Costs to Realized Revenues and Realized Fuel Costs:
Midwest Generation
Homer City
Q4 08
Q4 09
2008
2009
Q4 08
Q4 09
2008
2009
Generation (GWh)
7,484
8,588
31,100
30,310
2,538
2,769
11,334
11,446
Operating revenues
$418
$391
$1,778
$1,487
$169
$167
$717
$663
Less: Unrealized (gains) losses
(9)
(8)
6
(30)
(14)
(4)
(21)
(15)
Other revenues
(2)
(1)
(6)
(3)
(12)
—
(13)
—
Realized Revenues
$407
$382
$1,778
$1,454
$143
$163
$683
$648
All-in Average Realized Price/MWh
$54.41
$44.54
$57.18
$47.97
$56.21
$58.86
$60.26
$56.66
Fuel expenses
$116
$150
$482
$547
$68
$59
$270
$251
Less: Unrealized gains (losses)
—
3
—
15
—
—
—
—
Realized fuel expenses
$116
$153
$482
$562
$68
$59
$270
$251
Average realized fuel costs/MWh
$15.41
$17.83
$15.49
$18.54
$24.52
$21.41
$23.35
$21.89
Reconciliation of Midwest Generation and Homer City Operating Revenues to Segment Fuel Costs:
Q4 08
Q4 09
2008
2009
Operating revenues
Midwest Generation
$418
$391
$1,778
$1,487
Homer City
169
167
717
663
Wind projects
38
40
108
141
Other revenues
40
17
208
86
Segment revenues as reported
$665
$615
$2,811
$2,377
Fuel Costs
Midwest Generation
$116
$150
$482
$547
Homer City
68
59
270
251
Other
(1)
—
(5)
(2)
Segment revenues as reported
$183
$209
$747
$796
March 1, 2010 34 EDISON INTERNATIONAL®
Leading the Way in Electricity SM
Use of Non-GAAP Financial Measures
Edison International’s earnings are prepared in accordance with generally accepted accounting principles used in the United States and represent the company’s earnings as reported to the Securities and Exchange Commission. Our management uses core earnings and earnings per share (EPS) by principal operating subsidiary internally for financial planning and for analysis of performance. We also use core earnings and EPS by principal operating subsidiary when communicating with analysts and investors regarding our earnings results and outlook to facilitate comparisons of the Company’s performance from period to period.
Core earnings is a non-GAAP financial measure and may not be comparable to those of other companies. Core earnings are defined as earnings attributable to common shareholders less income or loss from discontinued operations and income or loss from significant discrete items that management does not consider representative of ongoing earnings. EPS by principal operating subsidiary is based on the principal operating subsidiary net income attributable to the common shareholders of each operating subsidiary, respectively, and Edison International’s weighted average outstanding common shares. The impact of participating securities (vested stock options that earn dividend equivalents that may participate in undistributed earnings with common stock) for each principal operating subsidiary is not material to each principal operating subsidiary’s EPS and is therefore reflected in the results of the Edison International holding company, which we refer to as EIX parent company and other. EIX core EPS and core EPS by principal operating subsidiary are reconciled to basic EPS.
EBITDA is defined as earnings before interest, income taxes, depreciation and amortization. Adjusted EBITDA includes production tax credits from EMG’s wind projects and excludes amounts from gain on the sale of assets, loss on early extinguishment of debt and leases, and impairment of assets and investments. Our management uses Adjusted EBITDA as an important financial measure for evaluating EMG.
The average realized energy price and average realized fuel cost is a non-GAAP performance measure since such statistical measures exclude unrealized gains or losses recorded as operating revenues and unrealized gains or losses recorded as fuel expenses. Management believes that the average realized energy price and average realized fuel cost is more meaningful for investors as it reflects the impact of hedge contracts at the time of actual generation in period-over-period comparisons or as compared to real-time market prices.
A reconciliation of Non-GAAP information to GAAP information, including the impact of participating securities, is included either on the slide where the information appears or on another slide referenced in this presentation.
March 1, 2010 35 EDISON INTERNATIONAL®