Exhibit 99.2

Leading the Way in Electricity SM
First Quarter 2010 Financial Teleconference
May 7, 2010 EDISON INTERNATIONAL®
Leading the Way in Electricity SM
Forward-Looking Statements
Statements contained in this presentation about future performance, including, without limitation, earnings, asset and rate base growth, load growth, capital investments, and other statements that are not purely historical, are forward-looking statements. These forward-looking statements reflect our current expectations; however, such statements involve risks and uncertainties. Actual results could differ materially from current expectations. These forward-looking statements represent our expectations only as of the date of this presentation, and Edison International assumes no duty to update them to reflect new information, events or circumstances. Important factors that could cause different results are discussed under the headings “Risk Factors,” and “Management’s Discussion and Analysis” in Edison International’s 2009 Form 10-K, most recent Form 10-Q and other reports filed with the Securities and Exchange Commission, which are available on our website: www.edisoninvestor.com. These filings also provide additional information on historical and other factual data contained in this presentation.
May 7, 2010
EDISON INTERNATIONAL®
Leading the Way in Electricity SM
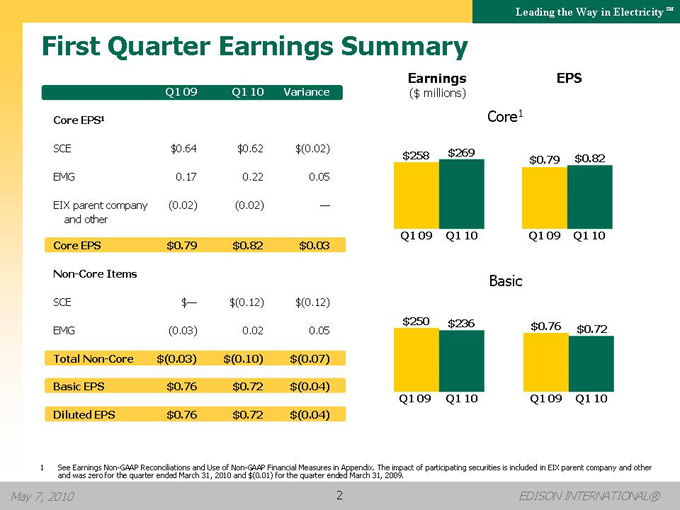
First Quarter Earnings Summary
Q1 09 Q1 10 Variance
Core EPS1
SCE $0.64 $0.62 $(0.02)
EMG 0.17 0.22 0.05
EIX parent company (0.02) (0.02) —and other
Core EPS $0.79 $0.82 $0.03
Non-Core Items
SCE $— $(0.12) $(0.12)
EMG (0.03) 0.02 0.05
Total Non-Core $(0.03) $(0.10) $(0.07)
Basic EPS $0.76 $0.72 $(0.04)
Diluted EPS $0.76 $0.72 $(0.04)
Earnings
($ millions)
EPS
Core1
$258 $269
$0.79 $0.82
Q1 09 Q1 10
Q1 09 Q1 10
Basic
$250 $236
$0.76 $0.72
Q1 09 Q1 10
Q1 09 Q1 10
1 See Earnings Non-GAAP Reconciliations and Use of Non-GAAP Financial Measures in Appendix. The impact of participating securities is included in EIX parent company and other and was zero for the quarter ended March 31, 2010 and $(0.01) for the quarter ended March 31, 2009.
May 7, 2010
EDISON INTERNATIONAL®
Leading the Way in Electricity SM
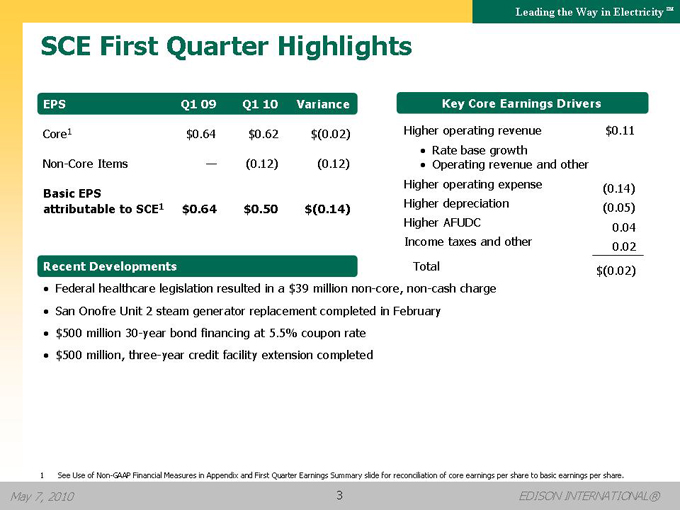
SCE First Quarter Highlights
EPS Q1 09 Q1 10 Variance
Core1 $0.64 $0.62 $(0.02)
Non-Core Items — (0.12) (0.12)
Basic EPS attributable to SCE1 $0.64 $0.50 $(0.14)
Recent Developments
Key Core Earnings Drivers
Higher operating revenue $0.11
Rate base growth
Operating revenue and other
Higher operating expense (0.14)
Higher depreciation (0.05)
Higher AFUDC 0.04
Income taxes and other 0.02
Total $(0.02)
Federal healthcare legislation resulted in a $39 million non-core, non-cash charge
San Onofre Unit 2 steam generator replacement completed in February
$500 million 30-year bond financing at 5.5% coupon rate
$500 million, three-year credit facility extension completed
1 See Use of Non-GAAP Financial Measures in Appendix and First Quarter Earnings Summary slide for reconciliation of core earnings per share to basic earnings per share.
May 7, 2010
EDISON INTERNATIONAL®
Leading the Way in Electricity SM
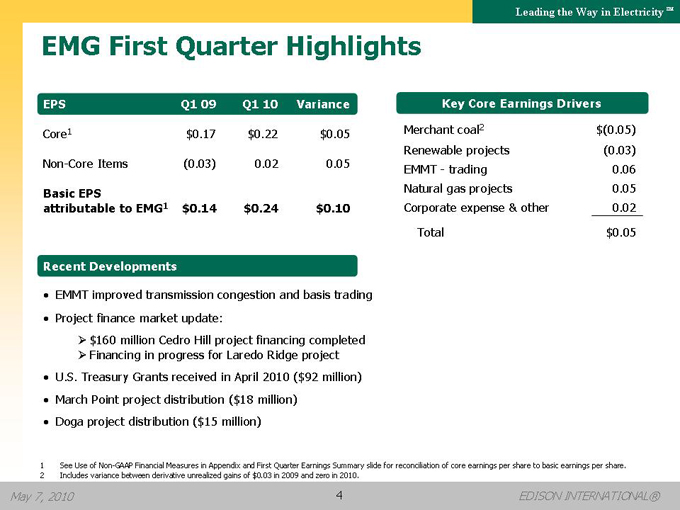
EMG First Quarter Highlights
EPS Q1 09 Q1 10 Variance
Core1 $0.17 $0.22 $0.05
Non-Core Items (0.03) 0.02 0.05
Basic EPS attributable to EMG1 $0.14 $0.24 $0.10
Key Core Earnings Drivers
Merchant coal2 $(0.05)
Renewable projects (0.03)
EMMT—trading 0.06
Natural gas projects 0.05
Corporate expense & other 0.02
Total $0.05
Recent Developments
• EMMT improved transmission congestion and basis trading
• Project finance market update:
?$160 million Cedro Hill project financing completed
?Financing in progress for Laredo Ridge project
• U.S. Treasury Grants received in April 2010 ($92 million)
• March Point project distribution ($18 million)
• Doga project distribution ($15 million)
1 See Use of Non-GAAP Financial Measures in Appendix and First Quarter Earnings Summary slide for reconciliation of core earnings per share to basic earnings per share.
2 | | Includes variance between derivative unrealized gains of $0.03 in 2009 and zero in 2010. |
May 7, 2010
EDISON INTERNATIONAL®
Leading the Way in Electricity SM
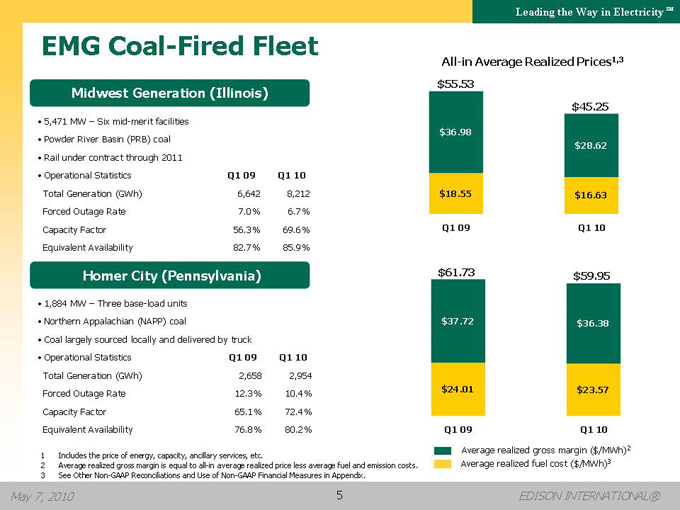
EMG Coal-Fired Fleet
Midwest Generation (Illinois)
• 5,471 MW – Six mid-merit facilities
• Powder River Basin (PRB) coal
• Rail under contract through 2011
• Operational Statistics Q1 09 Q1 10
Total Generation (GWh) 6,642 8,212
Forced Outage Rate 7.0% 6.7%
Capacity Factor 56.3% 69.6%
Equivalent Availability 82.7% 85.9%
Homer City (Pennsylvania)
• 1,884 MW – Three base-load units
• Northern Appalachian (NAPP) coal
• Coal largely sourced locally and delivered by truck
• Operational Statistics Q1 09 Q1 10
Total Generation (GWh) 2,658 2,954
Forced Outage Rate 12.3% 10.4%
Capacity Factor 65.1% 72.4%
Equivalent Availability 76.8% 80.2%
All-in Average Realized Prices1,3
$55.53
$36.98
$18.55
$45.25
$28.62
$16.63
Q1 09
Q1 10
$61.73
$37.72
$24.01
Q1 09
$59.95
$36.38
$23.57
Q1 10
Average realized gross margin ($/MWh)2 Average realized fuel cost ($/MWh)3
1 | | Includes the price of energy, capacity, ancillary services, etc. |
2 | | Average realized gross margin is equal to all-in average realized price less average fuel and emission costs. |
3 | | See Other Non-GAAP Reconciliations and Use of Non-GAAP Financial Measures in Appendix. |
May 7, 2010
EDISON INTERNATIONAL®
Leading the Way in Electricity SM
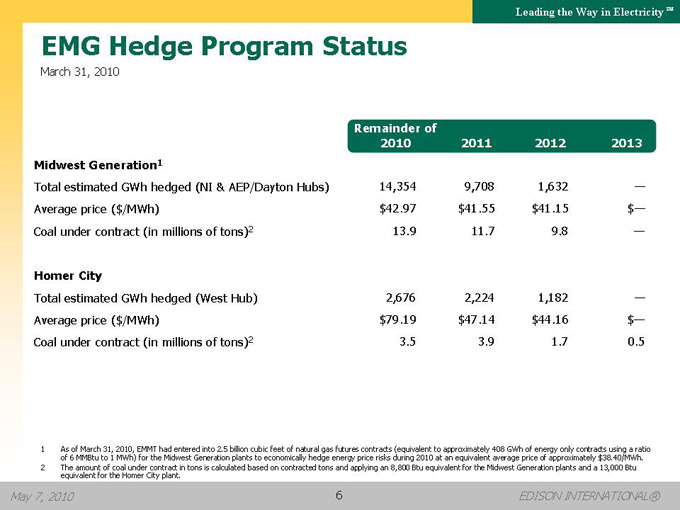
EMG Hedge Program Status
March 31, 2010
Remainder of
2010 2011 2012 2013
Midwest Generation1
Total estimated GWh hedged (NI & AEP/Dayton Hubs) 14,354 9,708 1,632 —
Average price ($/MWh) $42.97 $41.55 $41.15 $—
Coal under contract (in millions of tons)2 13.9 11.7 9.8 —
Homer City
Total estimated GWh hedged (West Hub) 2,676 2,224 1,182 —
Average price ($/MWh) $79.19 $47.14 $44.16 $—
Coal under contract (in millions of tons)2 3.5 3.9 1.7 0.5
1 As of March 31, 2010, EMMT had entered into 2.5 billion cubic feet of natural gas futures contracts (equivalent to approximately 408 GWh of energy only contracts using a ratio of 6 MMBtu to 1 MWh) for the Midwest Generation plants to economically hedge energy price risks during 2010 at an equivalent average price of approximately $38.40/MWh.
2 The amount of coal under contract in tons is calculated based on contracted tons and applying an 8,800 Btu equivalent for the Midwest Generation plants and a 13,000 Btu equivalent for the Homer City plant.
May 7, 2010
EDISON INTERNATIONAL®
Leading the Way in Electricity SM
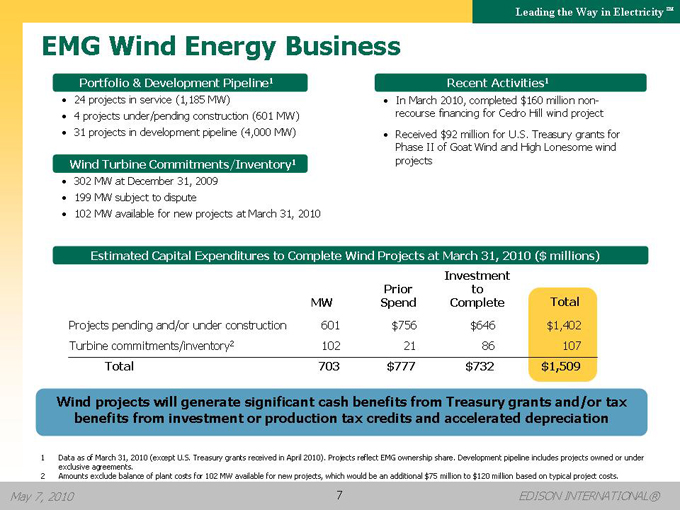
EMG Wind Energy Business
Portfolio & Development Pipeline1
• 24 projects in service (1,185 MW)
• 4 projects under/pending construction (601 MW)
• 31 projects in development pipeline (4,000 MW)
Wind Turbine Commitments/Inventory1
• 302 MW at December 31, 2009
• 199 MW subject to dispute
• 102 MW available for new projects at March 31, 2010
Recent Activities1
• In March 2010, completed $160 million non-recourse financing for Cedro Hill wind project
• Received $92 million for U.S. Treasury grants for Phase II of Goat Wind and High Lonesome wind projects
Estimated Capital Expenditures to Complete Wind Projects at March 31, 2010 ($ millions)
MW Prior Spend Investment to Complete Total
Projects pending and/or under construction 601 $756 $646 $1,402
Turbine commitments/inventory2 102 21 86 107
Total 703 $777 $732 $1,509
Wind projects will generate significant cash benefits from Treasury grants and/or tax benefits from investment or production tax credits and accelerated depreciation
1 Data as of March 31, 2010 (except U.S. Treasury grants received in April 2010). Projects reflect EMG ownership share. Development pipeline includes projects owned or under exclusive agreements.
2 Amounts exclude balance of plant costs for 102 MW available for new projects, which would be an additional $75 million to $120 million based on typical project costs.
May 7, 2010
EDISON INTERNATIONAL®
7
Leading the Way in Electricity SM
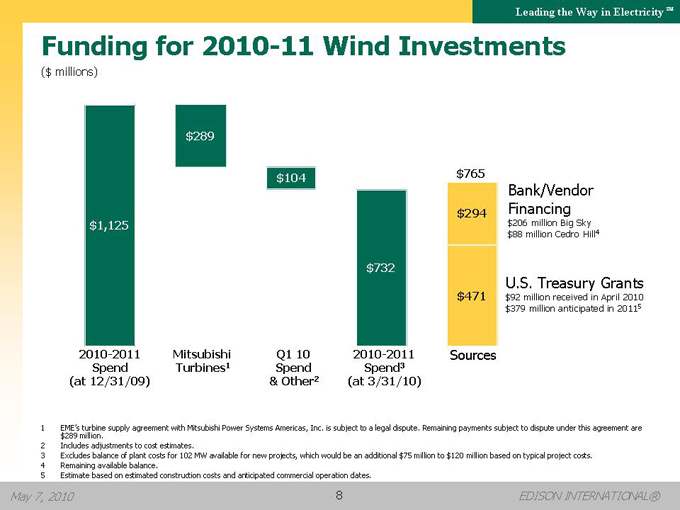
Funding for 2010-11 Wind Investments
($ millions)
$1,125 $289 $104 $732 $765 $294 $471
Bank/Vendor Financing $206 million Big Sky $88 million Cedro Hill4
U.S. Treasury Grants $92 million received in April 2010 $379 million anticipated in 20115
2010-2011 Spend (at 12/31/09) Mitsubishi Turbines1 Q1 10 Spend & Other2 2010-2011 Spend3 (at 3/31/10) Sources
1 EME’s turbine supply agreement with Mitsubishi Power Systems Americas, Inc. is subject to a legal dispute. Remaining payments subject to dispute under this agreement are $289 million.
2 Includes adjustments to cost estimates.
3 Excludes balance of plant costs for 102 MW available for new projects, which would be an additional $75 million to $120 million based on typical project costs.
4 Remaining available balance.
5 Estimate based on estimated construction costs and anticipated commercial operation dates.
May 7, 2010
EDISON INTERNATIONAL®
8
Leading the Way in Electricity SM
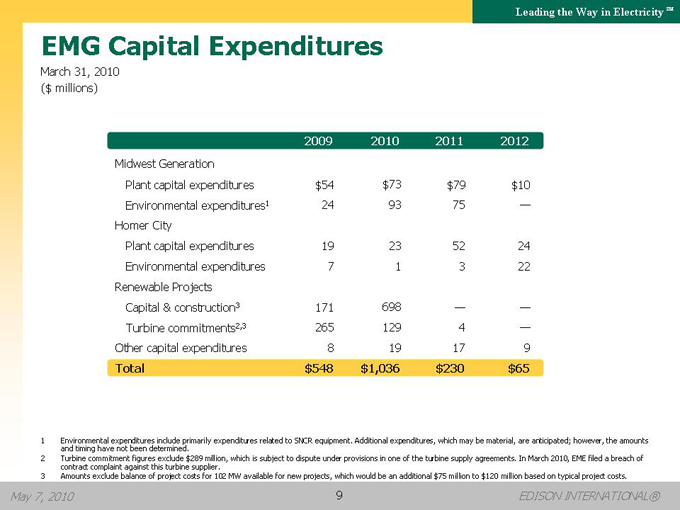
EMG Capital Expenditures
March 31, 2010 ($ millions)
2009 2010 2011 2012
Midwest Generation
Plant capital expenditures $54 $73 $79 $10
Environmental expenditures1 24 93 75 —
Homer City
Plant capital expenditures 19 23 52 24
Environmental expenditures 7 1 3 22
Renewable Projects
Capital & construction3 171 698 — —
Turbine commitments2,3 265 129 4 —
Other capital expenditures 8 19 17 9
Total $548 $1,036 $230 $65
1 Environmental expenditures include primarily expenditures related to SNCR equipment. Additional expenditures, which may be material, are anticipated; however, the amounts and timing have not been determined.
2 Turbine commitment figures exclude $289 million, which is subject to dispute under provisions in one of the turbine supply agreements. In March 2010, EME filed a breach of contract complaint against this turbine supplier.
3 Amounts exclude balance of project costs for 102 MW available for new projects, which would be an additional $75 million to $120 million based on typical project costs.
May 7, 2010
EDISON INTERNATIONAL®
9
Leading the Way in Electricity SM
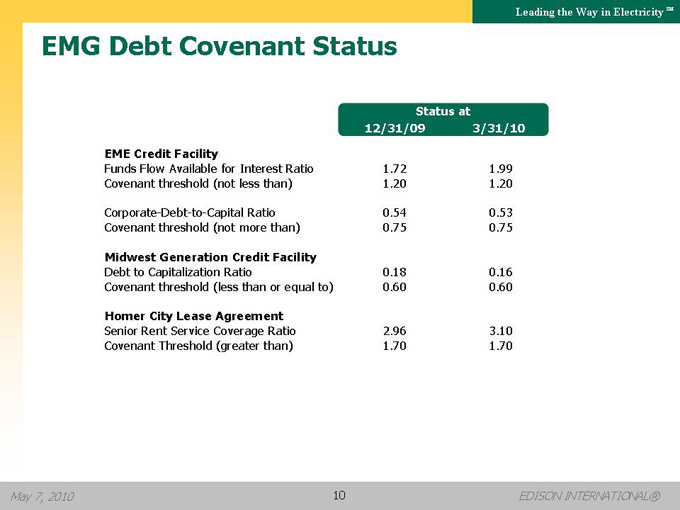
EMG Debt Covenant Status
Status at 12/31/09 3/31/10
EME Credit Facility
Funds Flow Available for Interest Ratio 1.72 1.99
Covenant threshold (not less than) 1.20 1.20
Corporate-Debt-to-Capital Ratio 0.54 0.53
Covenant threshold (not more than) 0.75 0.75
Midwest Generation Credit Facility
Debt to Capitalization Ratio 0.18 0.16
Covenant threshold (less than or equal to) 0.60 0.60
Homer City Lease Agreement
Senior Rent Service Coverage Ratio 2.96 3.10
Covenant Threshold (greater than) 1.70 1.70
May 7, 2010
EDISON INTERNATIONAL®
10
Leading the Way in Electricity SM
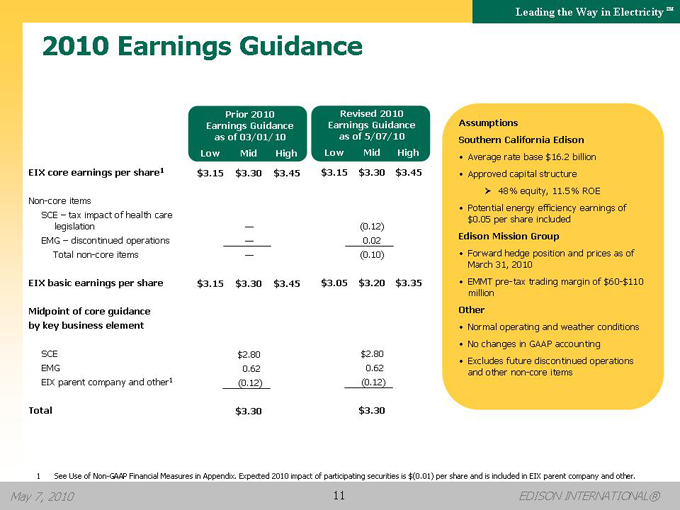
2010 Earnings Guidance
Prior 2010 Earnings Guidance as of 03/01/10 Low Mid High
Revised 2010 Earnings Guidance as of 5/07/10 Low Mid High
EIX core earnings per share1 $3.15 $3.30 $3.45 $3.15 $3.30 $3.45
Non-core items
SCE – tax impact of health care legislation — (0.12)
EMG – discontinued operations — 0.02
Total non-core items — (0.10)
EIX basic earnings per share $3.15 $3.30 $3.45 $3.05 $3.20 $3.35
Midpoint of core guidance by key business element
SCE $2.80 $2.80
EMG 0.62 0.62
EIX parent company and other1 (0.12) (0.12)
Total $3.30 $3.30
Assumptions
Southern California Edison
Average rate base $16.2 billion
Approved capital structure
48% equity, 11.5% ROE
Potential energy efficiency earnings of
$0.05 per share included
Edison Mission Group
Forward hedge position and prices as of March 31, 2010
EMMT pre-tax trading margin of $60-$110 million
Other
Normal operating and weather conditions
No changes in GAAP accounting
Excludes future discontinued operations and other non-core items
1 See Use of Non-GAAP Financial Measures in Appendix. Expected 2010 impact of participating securities is $(0.01) per share and is included in EIX parent company and other.
May 7, 2010
EDISON INTERNATIONAL®
11

Leading the Way in Electricity SM
Appendix
May 7, 2010
EDISON INTERNATIONAL®
12
Leading the Way in Electricity SM
Updates Since Our Last Presentation
• Q1 10 results and standard information
• EME wind funding (p. 8)
• EME financial covenant summary (p. 10)
• Reaffirmed core earnings guidance as of May 7, 2010 (p. 11)
• Financial strategies (p. 15)
• SCE regulatory information (p. 22)
May 7, 2010
EDISON INTERNATIONAL®
13
Leading the Way in Electricity SM
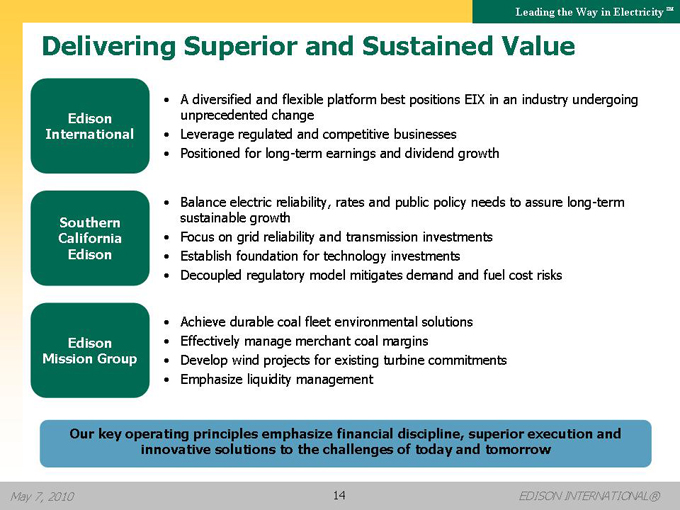
Delivering Superior and Sustained Value
Edison International
• A diversified and flexible platform best positions EIX in an industry undergoing unprecedented change
• Leverage regulated and competitive businesses
• Positioned for long-term earnings and dividend growth
Southern California Edison
• Balance electric reliability, rates and public policy needs to assure long-term sustainable growth
• Focus on grid reliability and transmission investments
• Establish foundation for technology investments
• Decoupled regulatory model mitigates demand and fuel cost risks
Edison Mission Group
• Achieve durable coal fleet environmental solutions
• Effectively manage merchant coal margins
• Develop wind projects for existing turbine commitments
• Emphasize liquidity management
Our key operating principles emphasize financial discipline, superior execution and innovative solutions to the challenges of today and tomorrow
May 7, 2010
EDISON INTERNATIONAL®
14
Leading the Way in Electricity SM
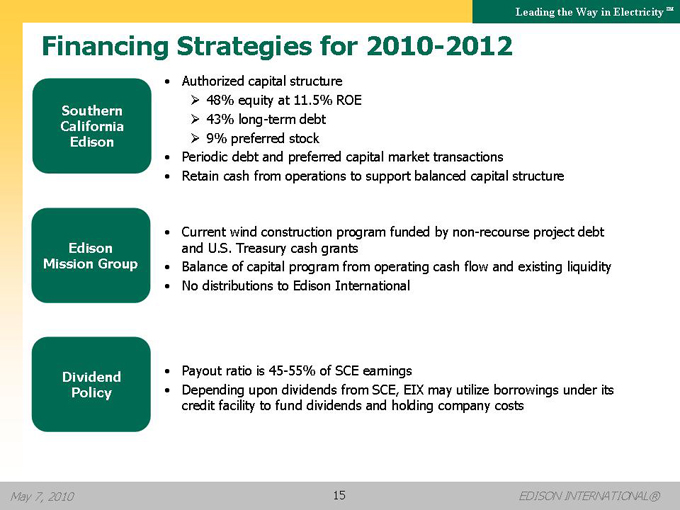
Financing Strategies for 2010-2012
Southern California Edison
• Authorized capital structure
??48% equity at 11.5% ROE
??43% long-term debt
??9% preferred stock
• Periodic debt and preferred capital market transactions
• Retain cash from operations to support balanced capital structure
Edison Mission Group
• Current wind construction program funded by non-recourse project debt and U.S. Treasury cash grants
• Balance of capital program from operating cash flow and existing liquidity
• No distributions to Edison International
Dividend Policy
• Payout ratio is 45-55% of SCE earnings
• Depending upon dividends from SCE, EIX may utilize borrowings under its credit facility to fund dividends and holding company costs
May 7, 2010
EDISON INTERNATIONAL®
15
Leading the Way in Electricity SM
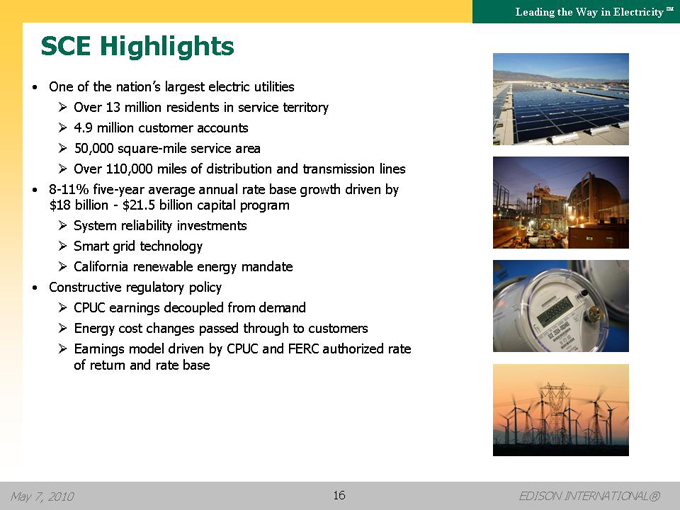
SCE Highlights
• One of the nation’s largest electric utilities
??Over 13 million residents in service territory
??4.9 million customer accounts
??50,000 square-mile service area
??Over 110,000 miles of distribution and transmission lines
• 8-11% five-year average annual rate base growth driven by $18 billion—$21.5 billion capital program
??System reliability investments
??Smart grid technology
??California renewable energy mandate
• Constructive regulatory policy
??CPUC earnings decoupled from demand
??Energy cost changes passed through to customers
??Earnings model driven by CPUC and FERC authorized rate of return and rate base
May 7, 2010
EDISON INTERNATIONAL®
16
Leading the Way in ElectricitySM
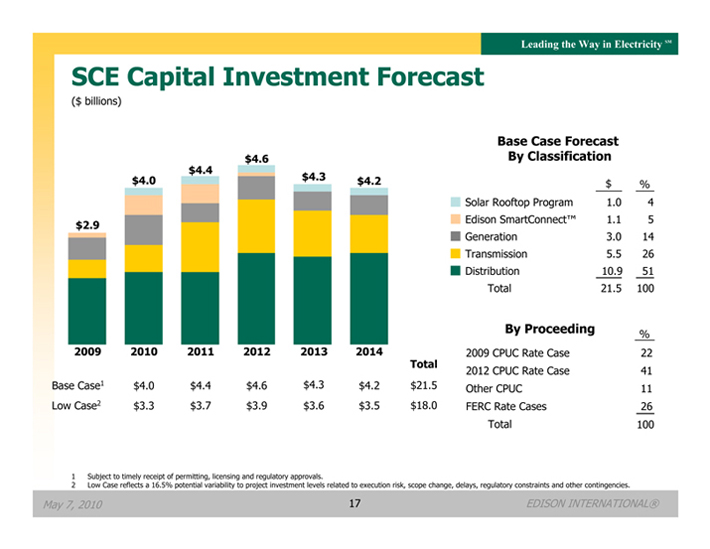
SCE Capital Investment Forecast
($ billions)
$2.9 2009
$4.0 2010
$4.4 2011
$4.6 2012
$4.3 2013
$4.2 2014
Total
Base Case1 $4.0 $4.4 $4.6 $4.3 $4.2 $21.5
Low Case2 $3.3 $3.7 $3.9 $3.6 $3.5 $18.0
Base Case Forecast
By Classification
$ %
Solar Rooftop Program 1.0 4
Edison SmartConnect™ 1.1 5
Generation 3.0 14
Transmission 5.5 26
Distribution 10.9 51
Total 21.5 100
By Proceeding
%
2009 CPUC Rate Case 22
2012 CPUC Rate Case 41
Other CPUC 11
FERC Rate Cases 26
Total 100
1 Subject to timely receipt of permitting, licensing and regulatory approvals.
2 Low Case reflects a 16.5% potential variability to project investment levels related to execution risk, scope change, delays, regulatory constraints and other contingencies.
May 7, 2010 17 EDISON INTERNATIONAL®
Leading the Way in ElectricitySM
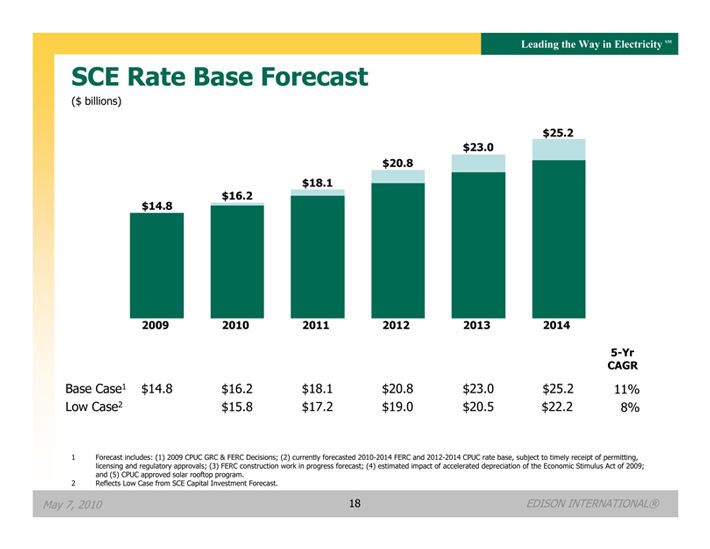
SCE Rate Base Forecast
($ billions)
$14.8 2009
$16.2 2010
$18.1 2011
$20.8 2012
$23.0 2013
$25.2 2014
5-Yr
CAGR
Base Case1 $14.8 $16.2 $18.1 $20.8 $23.0 $25.2 11%
Low Case2 $15.8 $17.2 $19.0 $20.5 $22.2 8%
1 Forecast includes: (1) 2009 CPUC GRC & FERC Decisions; (2) currently forecasted 2010-2014 FERC and 2012-2014 CPUC rate base, subject to timely receipt of permitting, licensing and regulatory approvals; (3) FERC construction work in progress forecast; (4) estimated impact of accelerated depreciation of the Economic Stimulus Act of 2009; and (5) CPUC approved solar rooftop program.
2 Reflects Low Case from SCE Capital Investment Forecast.
May 7, 2010 18 EDISON INTERNATIONAL®
Leading the Way in Electricity SM
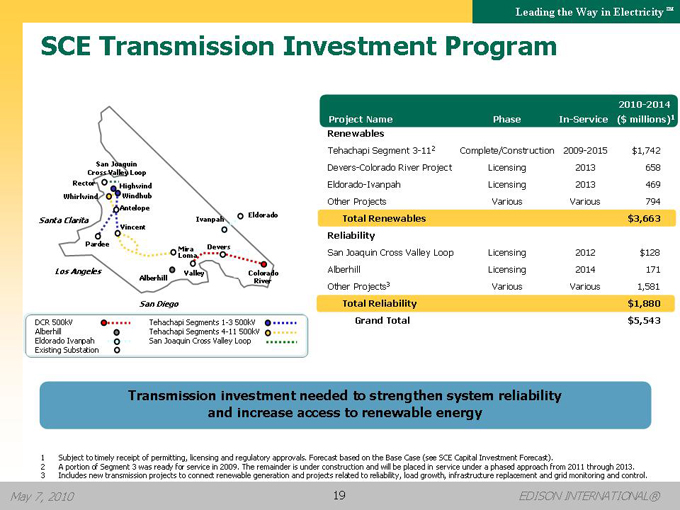
SCE Transmission Investment Program
2010-2014
Project Name Phase In-Service ($ millions)1
Renewables
Tehachapi Segment 3-112 Complete/Construction 2009-2015 $1,742
Devers-Colorado River Project Licensing 2013 658
Eldorado-Ivanpah Licensing 2013 469
Other Projects Various Various 794
Total Renewables $3,663
Reliability
San Joaquin Cross Valley Loop Licensing 2012 $128
Alberhill Licensing 2014 171
Other Projects3 Various Various 1,581
Total Reliability $1,880
Grand Total $5,543
DCR 500kV Alberhill Eldorado Ivanpah Existing Substation
Tehachapi Segments 1-3 500kV Tehachapi Segments 4-11 500kV San Joaquin Cross Valley Loop
Transmission investment needed to strengthen system reliability and increase access to renewable energy
1 Subject to timely receipt of permitting, licensing and regulatory approvals. Forecast based on the Base Case (see SCE Capital Investment Forecast).
2 A portion of Segment 3 was ready for service in 2009. The remainder is under construction and will be placed in service under a phased approach from 2011 through 2013.
3 Includes new transmission projects to connect renewable generation and projects related to reliability, load growth, infrastructure replacement and grid monitoring and control.
May 7, 2010
EDISON INTERNATIONAL®
19
Leading the Way in Electricity SM
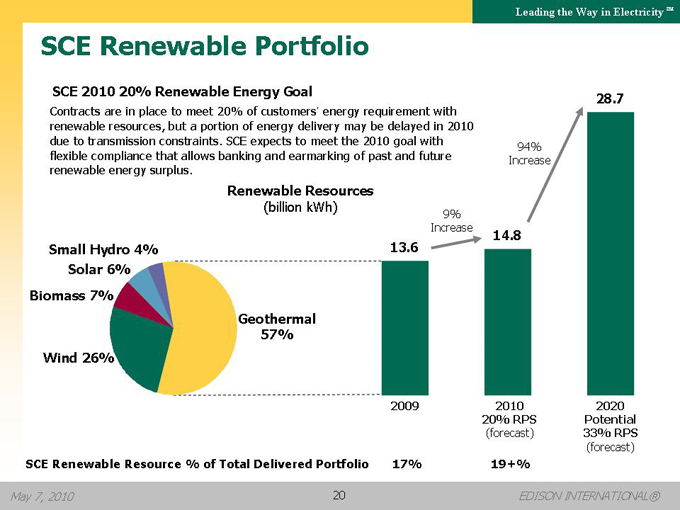
SCE Renewable Portfolio
SCE 2010 20% Renewable Energy Goal
Contracts are in place to meet 20% of customers’ energy requirement with renewable resources, but a portion of energy delivery may be delayed in 2010 due to transmission constraints. SCE expects to meet the 2010 goal with flexible compliance that allows banking and earmarking of past and future renewable energy surplus.
Renewable Resources
(billion kWh)
Small Hydro 4%
Solar 6%
Biomass 7%
Wind 26%
Geothermal 57%
13.6
9% Increase
94% Increase
28.7
14.8
2009
2010 20% RPS
(forecast)
2020 Potential 33% RPS
(forecast)
SCE Renewable Resource % of Total Delivered Portfolio
17%
19+%
May 7, 2010
EDISON INTERNATIONAL®
20
Leading the Way in Electricity SM
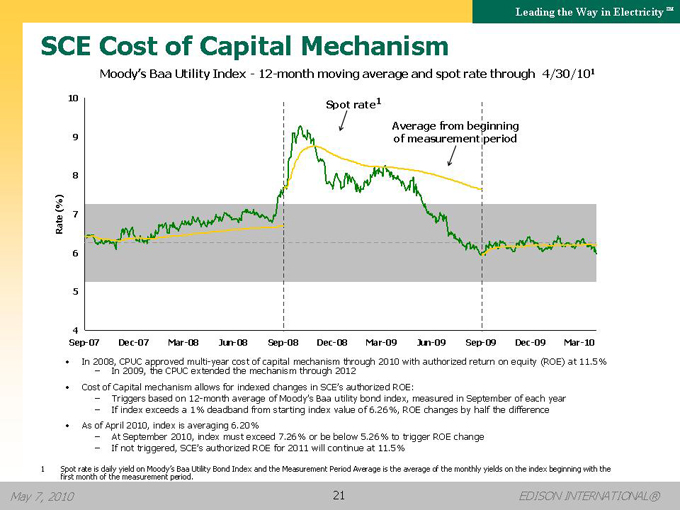
SCE Cost of Capital Mechanism
Moody’s Baa Utility Index—12-month moving average and spot rate through 4/30/101
Rate (%)
10
9
Sep-07 Dec-07 Mar-08 Jun-08 Sep-08 Dec-08 Mar-09 Jun-09 Sep-09 Dec-09 Mar-10
Spot rate1
Average from beginning of measurement period
• In 2008, – In CPUC 2009, approved the CPUC multi extended -year cost the mechanism of capital mechanism through 2012 through 2010 with authorized return on equity (ROE) at 11.5%
• Cost of Capital mechanism allows for indexed changes in SCE’s authorized ROE:
– Triggers based on 12-month average of Moody’s Baa utility bond index, measured in September of each year
– If index exceeds a 1% deadband from starting index value of 6.26%, ROE changes by half the difference
• As of April 2010, index is averaging 6.20%
– At September 2010, index must exceed 7.26% or be below 5.26% to trigger ROE change
– If not triggered, SCE’s authorized ROE for 2011 will continue at 11.5%
1 Spot rate is daily yield on Moody’s Baa Utility Bond Index and the Measurement Period Average is the average of the monthly yields on the index beginning with the first month of the measurement period.
May 7, 2010
EDISON INTERNATIONAL®
21
Leading the Way in Electricity SM
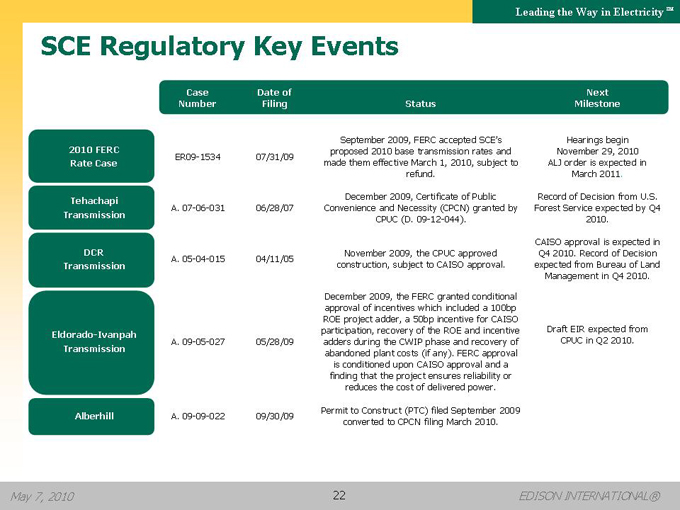
SCE Regulatory Key Events
Case Date of Next Number Filing Status Milestone
2010 FERC Rate Case
ER09-1534
07/31/09
September 2009, FERC accepted SCE’s proposed 2010 base transmission rates and made them effective March 1, 2010, subject to refund.
Hearings begin November 29, 2010 ALJ order is expected in March 2011.
Tehachapi Transmission
A. 07-06-031
06/28/07
December 2009, Certificate of Public Convenience and Necessity (CPCN) granted by CPUC (D. 09-12-044).
Record of Decision from U.S. Forest Service expected by Q4 2010.
DCR Transmission
A. 05-04-015
04/11/05
November 2009, the CPUC approved construction, subject to CAISO approval.
CAISO approval is expected in Q4 2010. Record of Decision expected from Bureau of Land Management in Q4 2010.
Eldorado-Ivanpah Transmission
A. 09-05-027
05/28/09
December 2009, the FERC granted conditional approval of incentives which included a 100bp ROE project adder, a 50bp incentive for CAISO participation, recovery of the ROE and incentive adders during the CWIP phase and recovery of abandoned plant costs (if any). FERC approval is conditioned upon CAISO approval and a finding that the project ensures reliability or reduces the cost of delivered power.
Draft EIR expected from CPUC in Q2 2010.
Alberhill
A. 09-09-022
09/30/09
Permit to Construct (PTC) filed September 2009 converted to CPCN filing March 2010.
May 7, 2010
EDISON INTERNATIONAL®
22
Leading the Way in Electricity SM
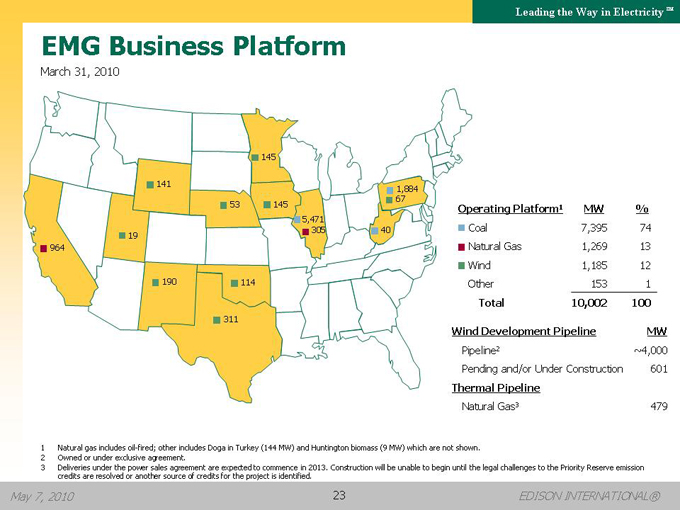
EMG Business Platform
March 31, 2010
Operating Platform1 MW %
Coal 7,395 74
Natural Gas 1,269 13
Wind 1,185 12
Other 153 1
Total 10,002 100
Wind Development Pipeline MW
Pipeline2 ~4,000
Pending and/or Under Construction 601
Thermal Pipeline
Natural Gas3 479
1 Natural gas includes oil-fired; other includes Doga in Turkey (144 MW) and Huntington biomass (9 MW) which are not shown.
2 | | Owned or under exclusive agreement. |
3 Deliveries under the power sales agreement are expected to commence in 2013. Construction will be unable to begin until the legal challenges to the Priority Reserve emission credits are resolved or another source of credits for the project is identified.
May 7, 2010
EDISON INTERNATIONAL®
23
Leading the Way in Electricity SM
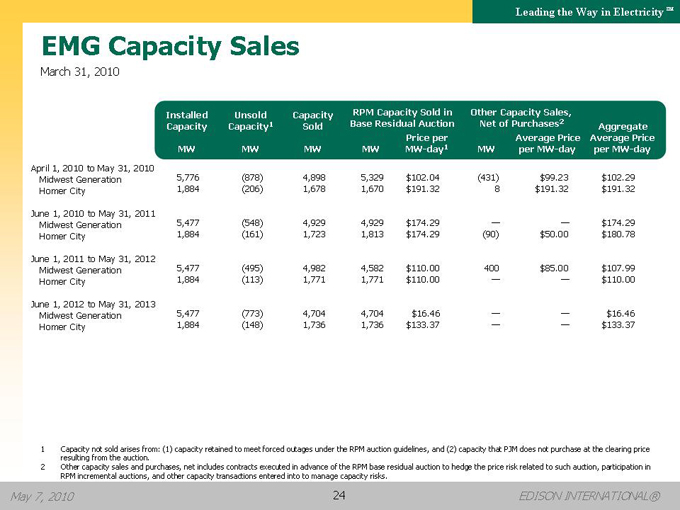
EMG Capacity Sales
March 31, 2010
Installed Capacity
MW
Unsold Capacity1
MW
Capacity Sold
MW
RPM Capacity Sold in Base Residual Auction
MW
Price per MW-day1
Other Capacity Sales, Net of Purchases2
MW
Average Price per MW-day
Aggregate Average Price per MW-day
April 1, 2010 to May 31, 2010 5,776 (878) 4,898 5,329 $102.04 (431) $99.23 $102.29 Midwest Generation 1,884 (206) 1,678 1,670 $191.32 8 $191.32 $191.32 Homer City
June 1, 2010 to May 31, 2011 5,477 (548) 4,929 4,929 $174.29 — — $174.29 Midwest Generation 1,884 (161) 1,723 1,813 $174.29 (90) $50.00 $180.78 Homer City
June 1, 2011 to May 31, 2012 5,477 (495) 4,982 4,582 $110.00 400 $85.00 $107.99 Midwest Generation 1,884 (113) 1,771 1,771 $110.00 — — $110.00 Homer City
June 1, 2012 to May 31, 2013 5,477 (773) 4,704 4,704 $16.46 — — $16.46 Midwest Generation 1,884 (148) 1,736 1,736 $133.37 — — $133.37 Homer City
1 Capacity not sold arises from: (1) capacity retained to meet forced outages under the RPM auction guidelines, and (2) capacity that PJM does not purchase at the clearing price resulting from the auction.
2 Other capacity sales and purchases, net includes contracts executed in advance of the RPM base residual auction to hedge the price risk related to such auction, participation in RPM incremental auctions, and other capacity transactions entered into to manage capacity risks.
May 7, 2010
EDISON INTERNATIONAL®
24
Leading the Way in Electricity SM
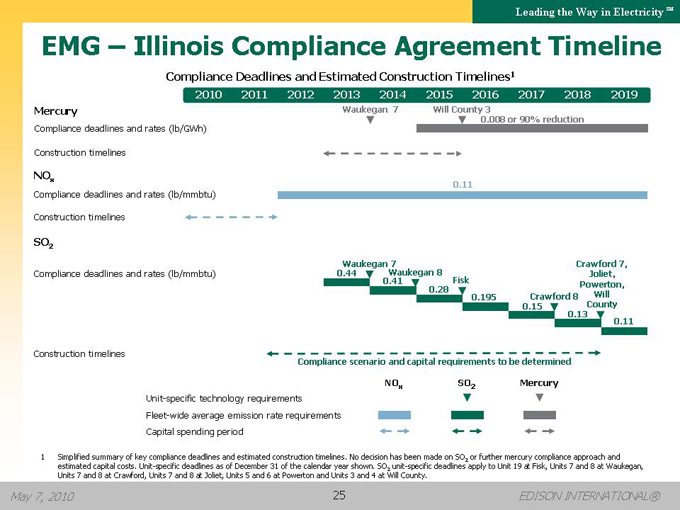
EMG – Illinois Compliance Agreement Timeline
Compliance Deadlines and Estimated Construction Timelines1
2010 2011 2012 2013 2014 2015 2016 2017 2018 2019
Mercury
Compliance deadlines and rates (lb/GWh)
Construction timelines
NOx
Compliance deadlines and rates (lb/mmbtu)
Construction timelines
SO2
Compliance deadlines and rates (lb/mmbtu)
Construction timelines
Compliance scenario and capital requirements to be determined
Unit-specific technology requirements
Fleet-wide average emission rate requirements Capital spending period
1 Simplified summary of key compliance deadlines and estimated construction timelines. No decision has been made on SO2 or further mercury compliance approach and estimated capital costs. Unit-specific deadlines as of December 31 of the calendar year shown. SO2 unit-specific deadlines apply to Unit 19 at Fisk, Units 7 and 8 at Waukegan, Units 7 and 8 at Crawford, Units 7 and 8 at Joliet, Units 5 and 6 at Powerton and Units 3 and 4 at Will County.
May 7, 2010
EDISON INTERNATIONAL®
25
Leading the Way in Electricity SM
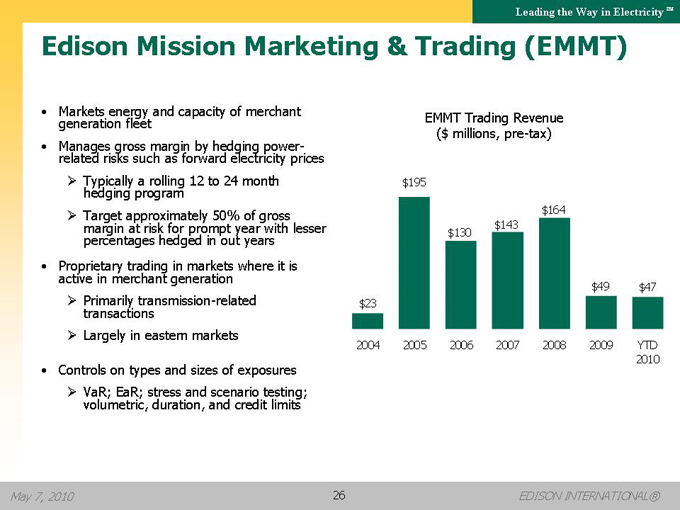
Edison Mission Marketing & Trading (EMMT)
• Markets energy and capacity of merchant generation fleet
• Manages gross margin by hedging power-related risks such as forward electricity prices
?Typically a rolling 12 to 24 month hedging program
?Target approximately 50% of gross margin at risk for prompt year with lesser percentages hedged in out years
• Proprietary trading in markets where it is active in merchant generation
?Primarily transmission-related transactions
?Largely in eastern markets
• Controls on types and sizes of exposures
?VaR; EaR; stress and scenario testing; volumetric, duration, and credit limits
EMMT Trading Revenue ($ millions, pre-tax)
$23
$195
$130
$143
$164
$49
$47
2004 2005 2006 2007 2008 2009 YTD
2010
May 7, 2010
EDISON INTERNATIONAL®
26
Leading the Way in Electricity SM
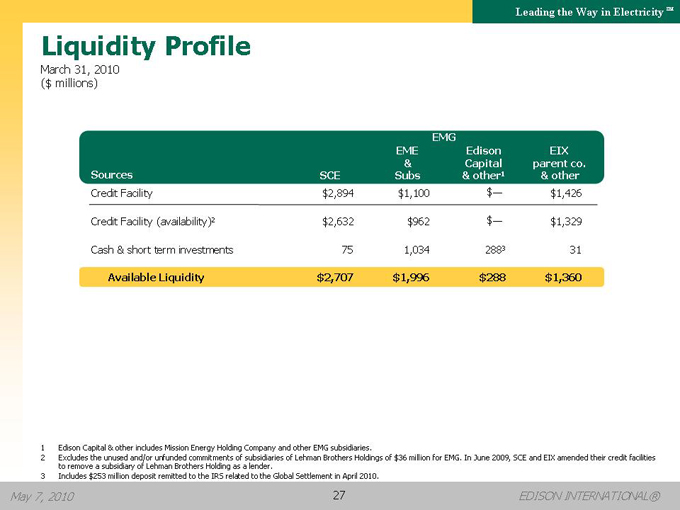
Liquidity Profile
March 31, 2010 ($ millions)
Sources
SCE
EME & Subs
EMG
Edison Capital & other1
EIX parent co.
& other
Credit Facility $2,894 $1,100 $??$1,426
Credit Facility (availability)2 $2,632 $962 $??$1,329
Cash & short term investments 75 1,034 2883 31
Available Liquidity $2,707 $1,996 $288 $1,360
1 | | Edison Capital & other includes Mission Energy Holding Company and other EMG subsidiaries. |
2 Excludes the unused and/or unfunded commitments of subsidiaries of Lehman Brothers Holdings of $36 million for EMG. In June 2009, SCE and EIX amended their credit facilities to remove a subsidiary of Lehman Brothers Holding as a lender.
3 | | Includes $253 million deposit remitted to the IRS related to the Global Settlement in April 2010. |
May 7, 2010
EDISON INTERNATIONAL®
27
Leading the Way in Electricity SM
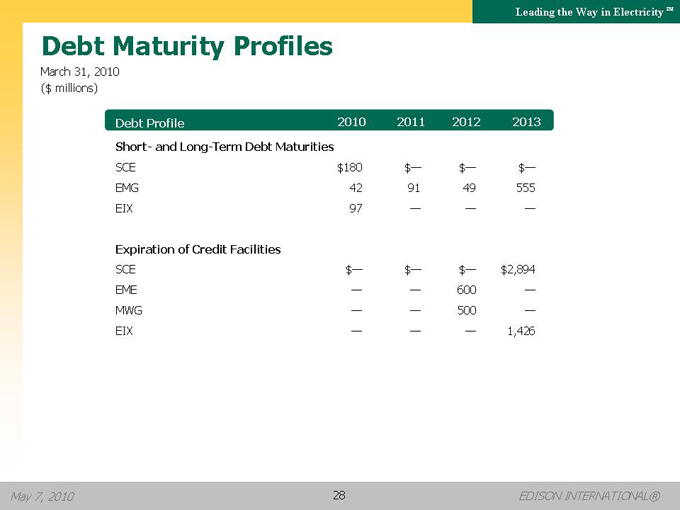
Debt Maturity Profiles
March 31, 2010 ($ millions)
Debt Profile 2010 2011 2012 2013
Short- and Long-Term Debt Maturities
SCE $180 $— $— $—
EMG 42 91 49 555
EIX 97 — — —
Expiration of Credit Facilities
SCE $— $— $— $2,894
EME — — 600 —
MWG — — 500 —
EIX — — — 1,426
May 7, 2010
EDISON INTERNATIONAL®
28
Leading the Way in Electricity SM
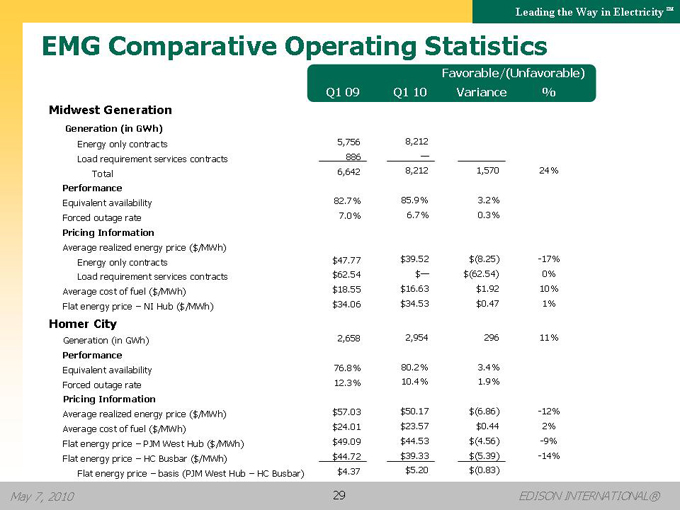
EMG Comparative Operating Statistics
Favorable/(Unfavorable)
Q1 09
Q1 10
Variance
%
Midwest Generation
Generation (in GWh)
Energy only contracts 5,756 8,212
Load requirement services contracts 886 —
Total 6,642 8,212 1,570 24%
Performance
Equivalent availability 82.7% 85.9% 3.2%
Forced outage rate 7.0% 6.7% 0.3%
Pricing Information
Average realized energy price ($/MWh)
Energy only contracts $47.77 $39.52 $(8.25) -17%
Load requirement services contracts $62.54 $— $(62.54) 0%
Average cost of fuel ($/MWh) $18.55 $16.63 $1.92 10%
Flat energy price – NI Hub ($/MWh) $34.06 $34.53 $0.47 1%
Homer City
Generation (in GWh) 2,658 2,954 296 11%
Performance
Equivalent availability 76.8% 80.2% 3.4%
Forced outage rate 12.3% 10.4% 1.9%
Pricing Information
Average realized energy price ($/MWh) $57.03 $50.17 $(6.86) -12%
Average cost of fuel ($/MWh) $24.01 $23.57 $0.44 2%
Flat energy price – PJM West Hub ($/MWh) $49.09 $44.53 $(4.56) -9%
Flat energy price – HC Busbar ($/MWh) $44.72 $39.33 $(5.39) -14%
Flat energy price – basis (PJM West Hub – HC Busbar) $4.37 $5.20 $(0.83)
May 7, 2010
EDISON INTERNATIONAL®
29
Leading the Way in Electricity SM
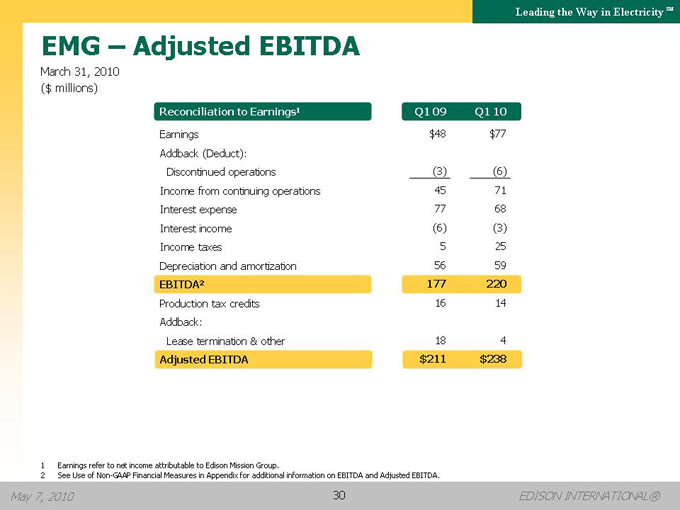
EMG – Adjusted EBITDA
March 31, 2010 ($ millions)
Reconciliation to Earnings1 Q1 09 Q1 10
Earnings $48 $77
Addback (Deduct):
Discontinued operations (3) (6)
Income from continuing operations 45 71
Interest expense 77 68
Interest income (6) (3)
Income taxes 5 25
Depreciation and amortization 56 59
EBITDA2 177 220
Production tax credits 16 14
Addback:
Lease termination & other 18 4
Adjusted EBITDA $211 $238
1 Earnings refer to net income attributable to Edison Mission Group.
2 See Use of Non-GAAP Financial Measures in Appendix for additional information on EBITDA and Adjusted EBITDA.
May 7, 2010
EDISON INTERNATIONAL®
30
Leading the Way in Electricity SM
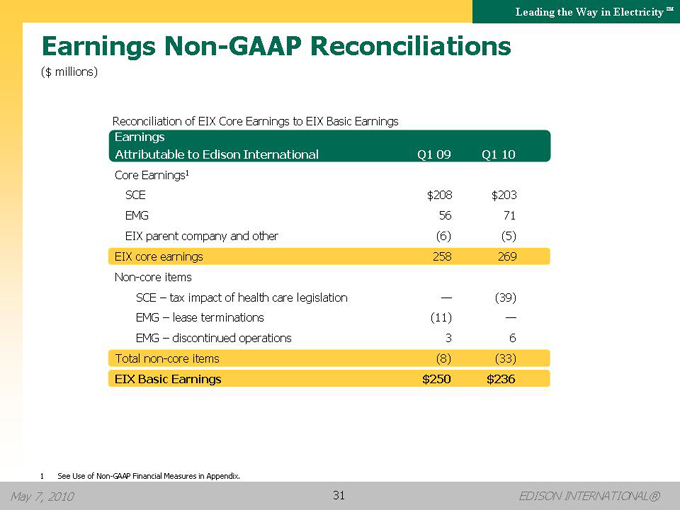
Earnings Non-GAAP Reconciliations
($ millions)
Reconciliation of EIX Core Earnings to EIX Basic Earnings
Earnings
Attributable to Edison International
Q1 09
Q1 10
Core Earnings1
SCE $208 $203
EMG 56 71
EIX parent company and other (6) (5)
EIX core earnings 258 269
Non-core items
SCE – tax impact of health care legislation — (39)
EMG – lease terminations (11) —
EMG – discontinued operations 3 6
Total non-core items (8) (33)
EIX Basic Earnings $250 $236
1 | | See Use of Non-GAAP Financial Measures in Appendix. |
May 7, 2010
EDISON INTERNATIONAL®
31
Leading the Way in Electricity SM
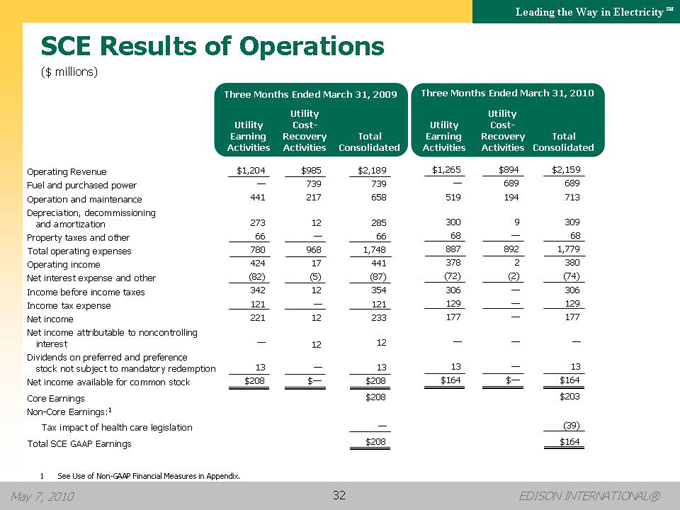
SCE Results of Operations
($ millions)
Three Months Ended March 31, 2009
Utility Earning Activities Utility Cost- Recovery Activities Total Consolidated
Three Months Ended March 31, 2010
Utility Earning Activities Utility Cost- Recovery Activities Total Consolidated
Operating Revenue $1,204 $985 $2,189 $1,265 $894 $2,159
Fuel and purchased power — 739 739 — 689 689
Operation and maintenance 441 217 658 519 194 713
Depreciation, decommissioning and amortization 273 12 285 300 9 309
Property taxes and other 66 — 66 68 — 68
Total operating expenses 780 968 1,748 887 892 1,779
Operating income 424 17 441 378 2 380
Net interest expense and other (82) (5) (87) (72) (2) (74)
Income before income taxes 342 12 354 306 — 306
Income tax expense 121 — 121 129 — 129
Net income 221 12 233 177 — 177
Net income attributable to noncontrolling interest — 12 12 — — —
Dividends on preferred and preference stock not subject to mandatory redemption 13 — 13 13 — 13
Net income available for common stock $208 $— $208 $164 $— $164
Core Earnings $208 $203
Non-Core Earnings:1
Tax impact of health care legislation — (39)
Total SCE GAAP Earnings $208 $164
1 See Use of Non-GAAP Financial Measures in Appendix.
EDISON INTERNATIONAL®
May 7, 2010
32
Leading the Way in Electricity SM
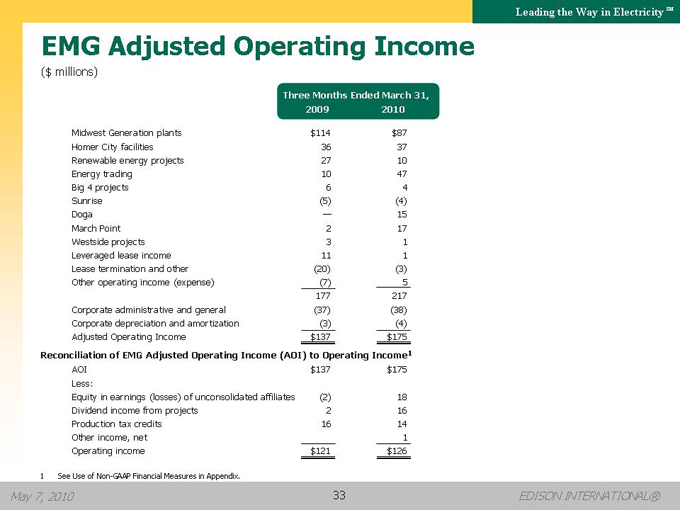
EMG Adjusted Operating Income
($ millions)
Three Months Ended March 31, 2009 2010
Midwest Generation plants $114 $87
Homer City facilities 36 37
Renewable energy projects 27 10
Energy trading 10 47
Big 4 projects 6 4
Sunrise (5) (4)
Doga — 15
March Point 2 17
Westside projects 3 1
Leveraged lease income 11 1
Lease termination and other (20) (3)
Other operating income (expense) (7) 5 177 217
Corporate administrative and general (37) (38)
Corporate depreciation and amortization (3) (4)
Adjusted Operating Income $137 $175
Reconciliation of EMG Adjusted Operating Income (AOI) to Operating Income1
AOI $137 $175
Less:
Equity in earnings (losses) of unconsolidated affiliates (2) 18
Dividend income from projects 2 16
Production tax credits 16 14
Other income, net 1
Operating income $121 $126
1 See Use of Non-GAAP Financial Measures in Appendix.
May 7, 2010 EDISON INTERNATIONAL®
33
Leading the Way in Electricity SM
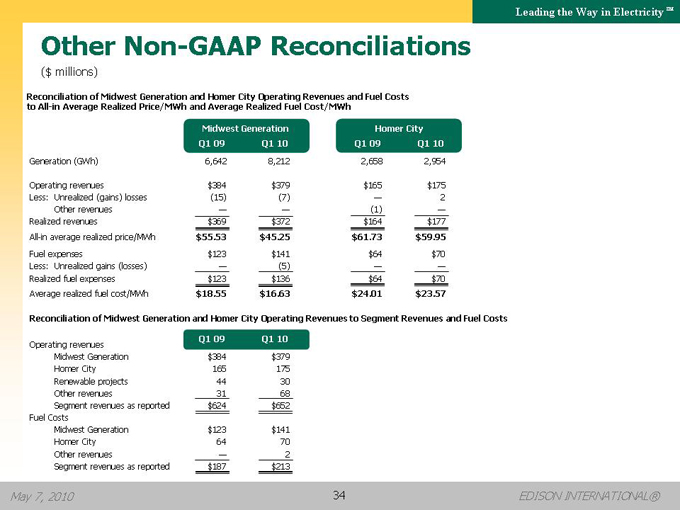
Other Non-GAAP Reconciliations
($ millions)
Reconciliation of Midwest Generation and Homer City Operating Revenues and Fuel Costs to All-in Average Realized Price/MWh and Average Realized Fuel Cost/MWh
Midwest Generation Homer City
Q1 09 Q1 10 Q1 09 Q1 10
Generation (GWh) 6,642 8,212 2,658 2,954
Operating revenues $384 $379 $165 $175
Less: Unrealized (gains) losses (15) (7) — 2
Other revenues — — (1) —
Realized revenues $369 $372 $164 $177
All-in average realized price/MWh $55.53 $45.25 $61.73 $59.95
Fuel expenses $123 $141 $64 $70
Less: Unrealized gains (losses) — (5) — —
Realized fuel expenses $123 $136 $64 $70
Average realized fuel cost/MWh $18.55 $16.63 $24.01 $23.57
Reconciliation of Midwest Generation and Homer City Operating Revenues to Segment Revenues and Fuel Costs
Operating revenues Q1 09 Q1 10
Midwest Generation $384 $379
Homer City 165 175
Renewable projects 44 30
Other revenues 31 68
Segment revenues as reported $624 $652
Fuel Costs
Midwest Generation $123 $141
Homer City 64 70
Other revenues — 2
Segment revenues as reported $187 $213
May 7, 2010 EDISON INTERNATIONAL®
34
Leading the Way in Electricity SM
Use of Non-GAAP Financial Measures
Edison International’s earnings are prepared in accordance with generally accepted accounting principles used in the management United States uses and represent core earnings the company’s and EPS by earnings principal as operating reported subsidiary to the Securities internally and for Exchange financial Commission. planning and Our for analysis of performance. We also use core earnings and EPS by principal operating subsidiary when communicating with analysts and investors regarding our earnings results and outlook, to facilitate the company’s performance from period to period.
Core and core earnings earnings is a per Non share -GAAP are financial defined measure as GAAP and earnings may not and be GAAP comparable earnings to per those share of other excluding companies. income Core or loss earnings from discontinued operations and income or loss from significant discrete items that management does not consider representative to the common of shareholders ongoing earnings. of each GAAP subsidiary earnings and refer Edison to International net income attributable GAAP earnings to Edison per share International refers to or basic attributable earnings per common share attributable to Edison International common shareholders. EPS by principal operating subsidiary is respectively, based on the and principal Edison operating International’s subsidiaries’ weighted net income average attributable outstanding to common the common shares. shareholders The impact of of each participating subsidiary, securities (vested stock options that earn dividend equivalents that may participate in undistributed earnings with common stock) reflected for in each the principal results of operating the Edison subsidiary International is not holding material company, to each principal which we operating refer to as subsidiary’s EIX parent EPS company and is and therefore other. production EBITDA is defined tax credits as earnings from EMG’s before wind interest, projects income and excludes taxes, depreciation amounts from and gain amortization. on the sale Adjusted of assets, EBITDA loss on includes early extinguishment of debt and leases, and impairment of assets and investments. Our management uses Adjusted EBITDA as an important financial measure for evaluating EMG.
The statistical average measures realized exclude energy unrealized price and average gains or realized losses recorded fuel costas is operating a non-GAAP revenues performance and unrealized measure gains since or such losses recorded as fuel expenses. Management believes that the average realized energy price and average realized fuel cost is period more meaningful comparisons for or investors as compared as it reflects to real- time the impact market of prices. hedge contracts at the time of actual generation in period-over-A either reconciliation on the slide of Non where -GAAP the information information to appears GAAP or information, on another including slide referenced the impact in this of participating presentation. securities, is included
May 7, 2010
EDISON INTERNATIONAL®
35