Exhibit 99.1
Exhibit 99.1
Leading the Way in Electricity SM
RBC Capital Markets Global Energy and Power Conference June 7, 2010
John R. Fielder
President, Southern California Edison
Linda G. Sullivan
Senior Vice President and Chief Financial Officer, Southern California Edison
June 7, 2010
EDISON INTERNATIONAL®
Leading the Way in Electricity SM
Forward-Looking Statements
Statements contained in this presentation about future performance, including, without limitation, earnings, asset and rate base growth, load growth, capital investments, and other statements that are not purely historical, are forward-looking statements. These forward-looking statements reflect our current expectations; however, such statements involve risks and uncertainties. Actual results could differ materially from current expectations. These forward-looking statements represent our expectations only as of the date of this presentation, and Edison International assumes no duty to update them to reflect new information, events or circumstances. Important factors that could cause different results are discussed under the headings “Risk Factors”, and “Management’s Discussion and Analysis” in Edison International’s 2009 Form 10-K, most recent Form 10-Q and other reports filed with the Securities and Exchange Commission, which are available on our website: www.edisoninvestor.com. These filings also provide additional information on historical and other factual data contained in this presentation.
June 7, 2010
EDISON INTERNATIONAL®
Leading the Way in Electricity SM
Delivering Superior and Sustained Value
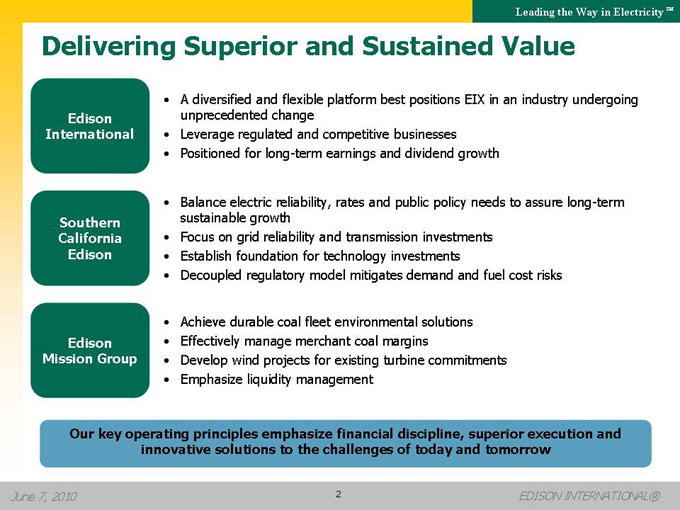
Edison International
Southern California Edison
Edison Mission Group
A diversified and flexible platform best positions EIX in an industry undergoing unprecedented change Leverage regulated and competitive businesses Positioned for long-term earnings and dividend growth
Balance electric reliability, rates and public policy needs to assure long-term sustainable growth Focus on grid reliability and transmission investments Establish foundation for technology investments Decoupled regulatory model mitigates demand and fuel cost risks
Achieve durable coal fleet environmental solutions Effectively manage merchant coal margins Develop wind projects for existing turbine commitments Emphasize liquidity management
Our key operating principles emphasize financial discipline, superior execution and innovative solutions to the challenges of today and tomorrow
June 7, 2010
EDISON INTERNATIONAL®
Leading the Way in Electricity SM
SCE Highlights
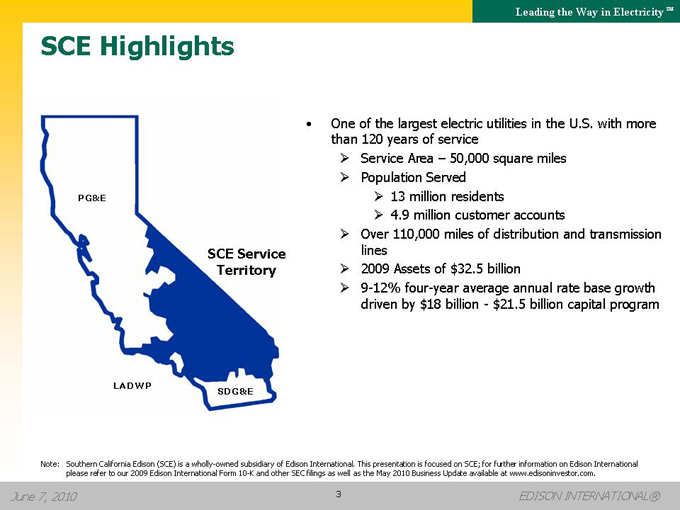
PG&E
SCE Service Territory
SDG&E
LADWP
One of the largest electric utilities in the U.S. with more than 120 years of service
Service Area – 50,000 square miles
Population Served
13 million residents
4.9 million customer accounts
Over 110,000 miles of distribution and transmission lines
2009 Assets of $32.5 billion
9-12% four-year average annual rate base growth driven by $18 billion—$21.5 billion capital program
Note: Southern California Edison (SCE) is a wholly-owned subsidiary of Edison International. This presentation is focused on SCE; for further information on Edison International please refer to our 2009 Edison International Form 10-K and other SEC filings as well as the May 2010 Business Update available at www.edisoninvestor.com.
June 7, 2010
EDISON INTERNATIONAL®
Leading the Way in Electricity SM
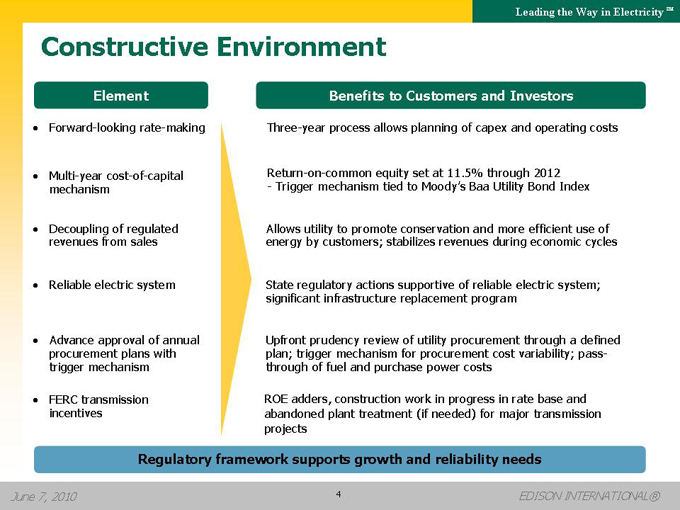
Constructive Environment
Element
Forward-looking rate-making
Multi-year cost-of-capital mechanism
Decoupling of regulated revenues from sales
Reliable electric system
Advance approval of annual procurement plans with trigger mechanism
FERC transmission incentives
Benefits to Customers and Investors
Three-year process allows planning of capex and operating costs
Return-on-common equity set at 11.5% through 2012
- Trigger mechanism tied to Moody’s Baa Utility Bond Index
Allows utility to promote conservation and more efficient use of energy by customers; stabilizes revenues during economic cycles
State regulatory actions supportive of reliable electric system; significant infrastructure replacement program
Upfront prudency review of utility procurement through a defined plan; trigger mechanism for procurement cost variability; pass-through of fuel and purchase power costs
ROE adders, construction work in progress in rate base and abandoned plant treatment (if needed) for major transmission projects
Regulatory framework supports growth and reliability needs
June 7, 2010
4
EDISON INTERNATIONAL®

Leading the Way in Electricity SM
2010 – 2014 Strategic Priorities
Grid Reliability Infrastructure replacement program and load growth
Transmission Reliability and renewable driven transmission
Generation SONGS Steam Generator Replacement and Solar Photovoltaic
Smart Grid/ Advanced Technologies Edison SmartConnect™ deployment, distributed generation, energy storage, energy management, and transportation electrification
June 7, 2010
EDISON INTERNATIONAL®
Leading the Way in Electricity SM
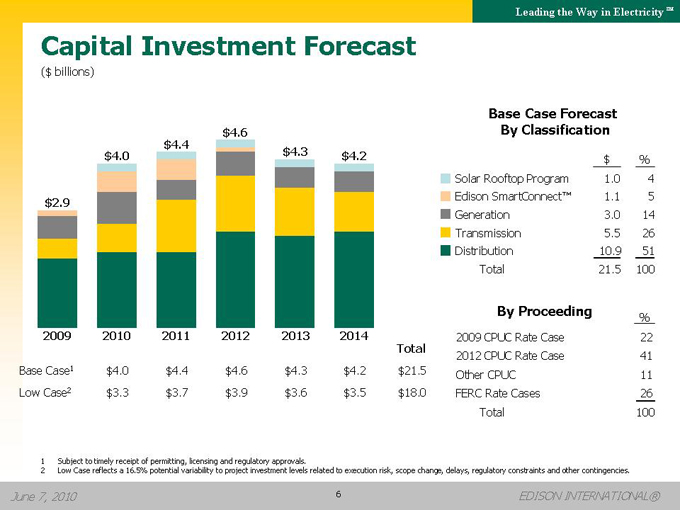
Capital Investment Forecast
($ billions)
$2.9
$4.0
$4.4
$4.6
$4.3
$4.2
2009
2010
2011
2012
2013
2014
Total
Base Case1 $4.0 $4.4 $4.6 $4.3 $4.2 $21.5
Low Case2 $3.3 $3.7 $3.9 $3.6 $3.5 $18.0
Base Case Forecast
By Classification
$ %
Solar Rooftop Program 1.0 4
Edison SmartConnect™ 1.1 5
Generation 3.0 14
Transmission 5.5 26
Distribution 10.9 51
Total 21.5 100
By Proceeding %
2009 CPUC Rate Case 22
2012 CPUC Rate Case 41
Other CPUC 11
FERC Rate Cases 26
Total 100
1 | | Subject to timely receipt of permitting, licensing and regulatory approvals. |
2 Low Case reflects a 16.5% potential variability to project investment levels related to execution risk, scope change, delays, regulatory constraints and other contingencies.
June 7, 2010
EDISON INTERNATIONAL®
Leading the Way in Electricity SM
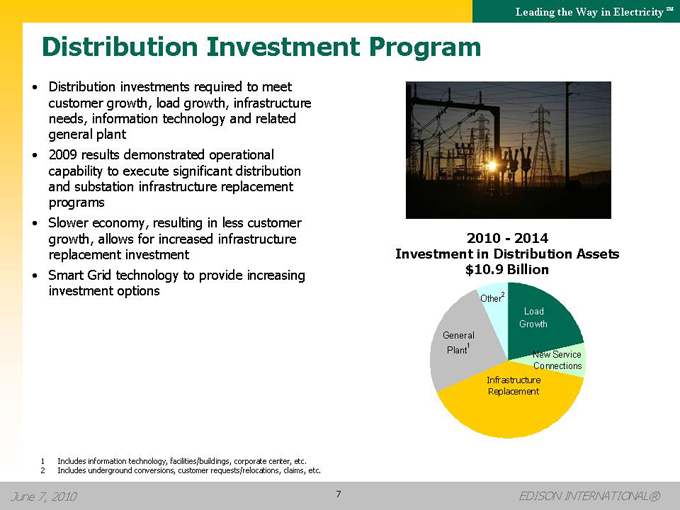
Distribution Investment Program
Distribution investments required to meet customer growth, load growth, infrastructure needs, information technology and related general plant
2009 results demonstrated operational capability to execute significant distribution and substation infrastructure replacement programs
Slower economy, resulting in less customer growth, allows for increased infrastructure replacement investment
Smart Grid technology to provide increasing investment options
2010—2014
Investment in Distribution Assets $10.9 Billion
General Plant1
Other2
Load Growth
New Service Connections
Infrastructure Replacement
1 | | Includes information technology, facilities/buildings, corporate center, etc. |
2 | | Includes underground conversions, customer requests/relocations, claims, etc. |
June 7, 2010
EDISON INTERNATIONAL®
Leading the Way in Electricity SM
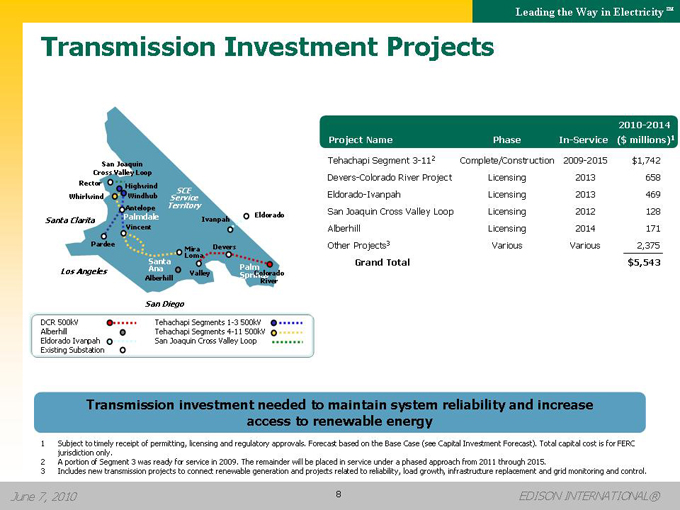
Transmission Investment Projects
San Joaquin Cross Valley Loop
Rector
Whirlwind
Santa Clarita
Los Angeles
San Diego
Eldorado
Highwind
Windhub
Antelope
Palmdale
Vincent
Pardee
SantaAna
Alberhill
MiraLoma
Valley
Devers
PalmSprings
Colorado River
Ivanpah
Service SCE Territory
DCR 500kV Alberhill Eldorado Ivanpah Existing Substation
Tehachapi Segments 1-3 500kV Tehachapi Segments 4-11 500kV San Joaquin Cross Valley Loop
2010-2014
Project Name Phase In-Service ($ millions)1
Tehachapi Segment 3-112 Complete/Construction 2009-2015 $1,742
Devers-Colorado River Project Licensing 2013 658
Eldorado-Ivanpah Licensing 2013 469
San Joaquin Cross Valley Loop Licensing 2012 128
Alberhill Licensing 2014 171
Other Projects3 Various Various 2,375
Grand Total $5,543
Transmission investment needed to maintain system reliability and increase access to renewable energy
1 Subject to timely receipt of permitting, licensing and regulatory approvals. Forecast based on the Base Case (see Capital Investment Forecast). Total capital cost is for FERC jurisdiction only.
2 A portion of Segment 3 was ready for service in 2009. The remainder will be placed in service under a phased approach from 2011 through 2015.
3 Includes new transmission projects to connect renewable generation and projects related to reliability, load growth, infrastructure replacement and grid monitoring and control.
June 7, 2010
EDISON INTERNATIONAL®
Leading the Way in Electricity SM
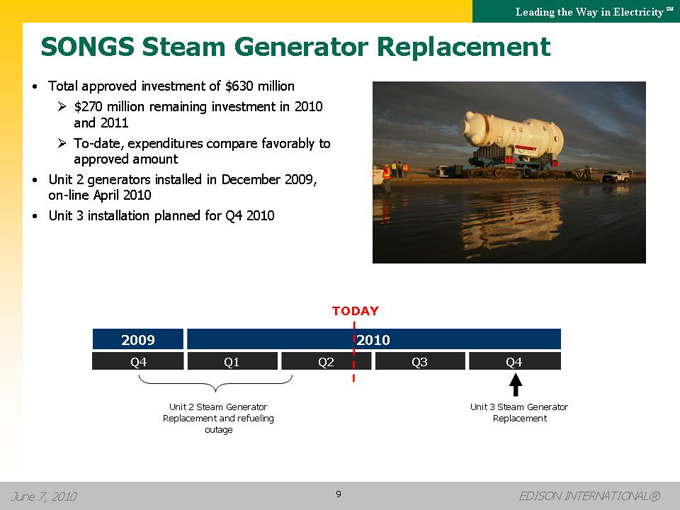
SONGS Steam Generator Replacement
Total approved investment of $630 million
??$270 million remaining investment in 2010 and 2011
??To-date, expenditures compare favorably to approved amount Unit 2 generators installed in December 2009, on-line April 2010 Unit 3 installation planned for Q4 2010
TODAY
2009 2010
Q4 Q1 Q2 Q3 Q4
Unit 2 Steam Generator Replacement and refueling outage
Unit 3 Steam Generator Replacement
June 7, 2010
9
EDISON INTERNATIONAL®
Leading the Way in Electricity SM
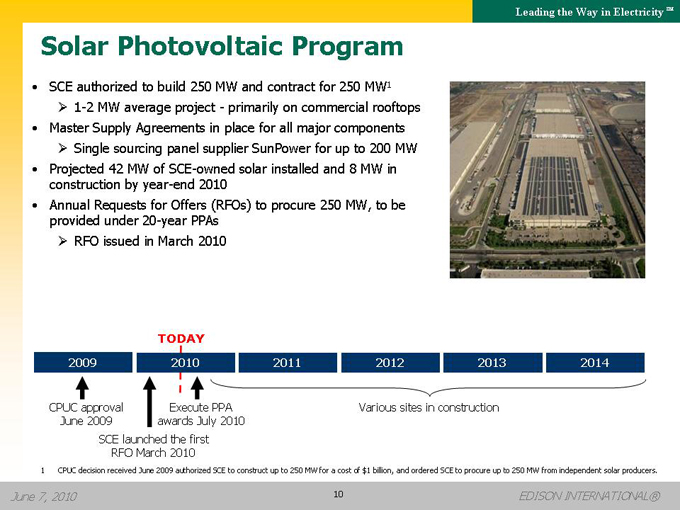
Solar Photovoltaic Program
SCE authorized to build 250 MW and contract for 250 MW1
1-2 MW average project—primarily on commercial rooftops
Master Supply Agreements in place for all major components
Single sourcing panel supplier SunPower for up to 200 MW
Projected 42 MW of SCE-owned solar installed and 8 MW in construction by year-end 2010
Annual Requests for Offers (RFOs) to procure 250 MW, to be provided under 20-year PPAs
RFO issued in March 2010
TODAY
2009 2010 2011 2012 2013 2014
CPUC approval Execute PPA Various sites in construction
June 2009 awards July 2010
SCE launched the first RFO March 2010
1 CPUC decision received June 2009 authorized SCE to construct up to 250 MW for a cost of $1 billion, and ordered SCE to procure up to 250 MW from independent solar producers.
June 7, 2010
10
EDISON INTERNATIONAL®
Leading the Way in Electricity SM
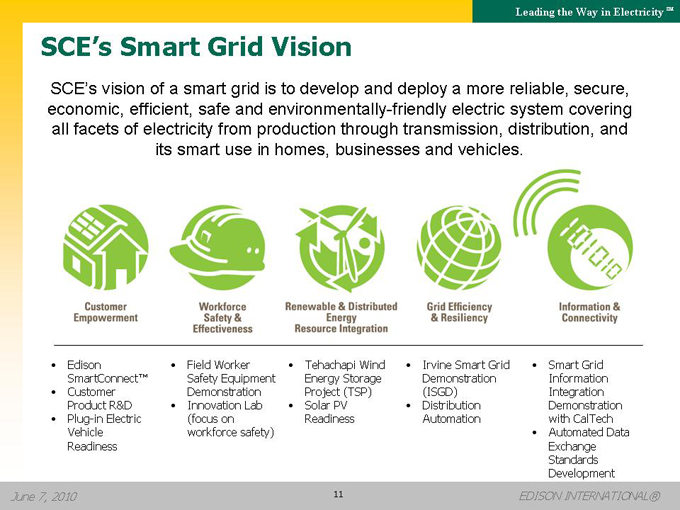
SCE’s Smart Grid Vision
SCE’s vision of a smart grid is to develop and deploy a more reliable, secure, economic, efficient, safe and environmentally-friendly electric system covering all facets of electricity from production through transmission, distribution, and its smart use in homes, businesses and vehicles.
Customer Empowerment
Workforce Safety & Effectiveness
Renewable & Distributed Energy Resource Integration
Grid Efficiency & Resiliency
Information & Connectivity
Edison SmartConnect™ Customer Product R&D
Plug-in Electric Vehicle
Readiness
Field Worker Safety Equipment Demonstration Innovation Lab (focus on workforce safety)
Tehachapi Wind Energy Storage Project (TSP) Solar PV Readiness
Irvine Smart Grid Demonstration (ISGD) Distribution Automation
Smart Grid Information Integration Demonstration with CalTech Automated Data Exchange Standards Development
June 7, 2010
11
EDISON INTERNATIONAL®
Leading the Way in Electricity SM
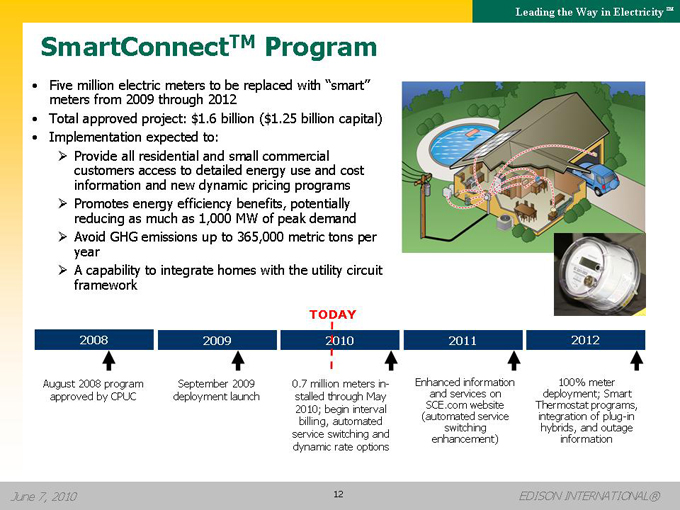
SmartConnectTM Program
Five million electric meters to be replaced with “smart” meters from 2009 through 2012 Total approved project: $1.6 billion ($1.25 billion capital) Implementation expected to:
Provide all residential and small commercial customers access to detailed energy use and cost information and new dynamic pricing programs
Promotes energy efficiency benefits, potentially reducing as much as 1,000 MW of peak demand
Avoid GHG emissions up to 365,000 metric tons per year
A capability to integrate homes with the utility circuit framework
TODAY
2008 2009 2010 2011 2012
August 2008 program approved by CPUC September 2009 deployment launch 0.7 million meters installed through May 2010; begin interval billing, automated service switching and dynamic rate options Enhanced information and services on SCE.com website (automated service switching enhancement) 100% meter deployment; Smart Thermostat programs, integration of plug-in hybrids, and outage information
June 7, 2010
12
EDISON INTERNATIONAL®
Leading the Way in Electricity SM
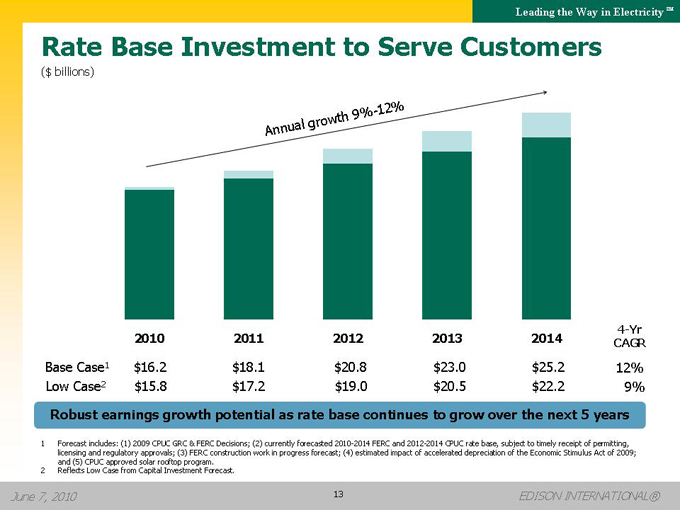
Rate Base Investment to Serve Customers
($ billions)
Annual growth 9%-12%
2010 2011 2012 2013 2014 4-Yr CAGR
Base Case1 $16.2 $18.1 $20.8 $23.0 $25.2 12%
Low Case2 $15.8 $17.2 $19.0 $20.5 $22.2 9%
Robust earnings growth potential as rate base continues to grow over the next 5 years
1 Forecast includes: (1) 2009 CPUC GRC & FERC Decisions; (2) currently forecasted 2010-2014 FERC and 2012-2014 CPUC rate base, subject to timely receipt of permitting, licensing and regulatory approvals; (3) FERC construction work in progress forecast; (4) estimated impact of accelerated depreciation of the Economic Stimulus Act of 2009; and (5) CPUC approved solar rooftop program.
2 | | Reflects Low Case from Capital Investment Forecast. |
June 7, 2010
13
EDISON INTERNATIONAL®
Leading the Way in Electricity SM
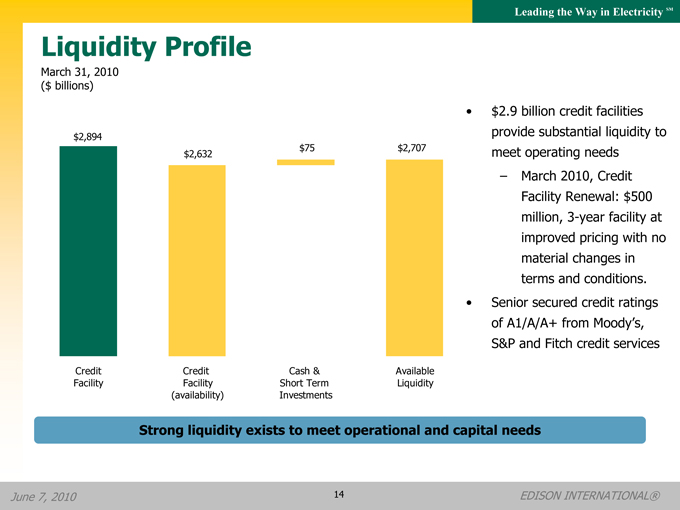
Liquidity Profile
March 31, 2010 ($ billions)
$2,894
$2,632
$75
$2,707
Credit Facility
Credit Facility (availability)
Cash & Short Term Investments
Available Liquidity
$2.9 billion credit facilities provide substantial liquidity to meet operating needs
March 2010, Credit Facility Renewal: $500 million, 3-year facility at improved pricing with no material changes in terms and conditions.
Senior secured credit ratings of A1/A/A+ from Moody’s, S&P and Fitch credit services
Strong liquidity exists to meet operational and capital needs
June 7, 2010
14
EDISON INTERNATIONAL®
Leading the Way in Electricity SM
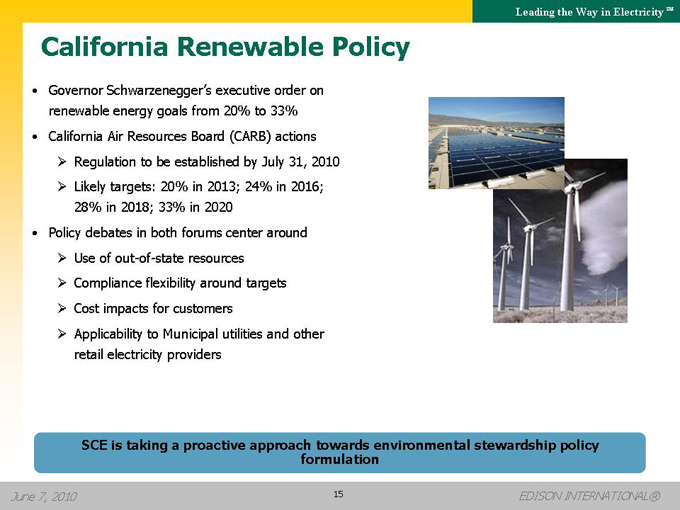
California Renewable Policy
Governor Schwarzenegger’s executive order on renewable energy goals from 20% to 33% California Air Resources Board (CARB) actions
Regulation to be established by July 31, 2010
Likely targets: 20% in 2013; 24% in 2016;
28% in 2018; 33% in 2020
Policy debates in both forums center around
Use of out-of-state resources
Compliance flexibility around targets
Cost impacts for customers
Applicability to Municipal utilities and other retail electricity providers
SCE is taking a proactive approach towards environmental stewardship policy formulation
June 7, 2010
15
EDISON INTERNATIONAL®
Leading the Way in Electricity SM
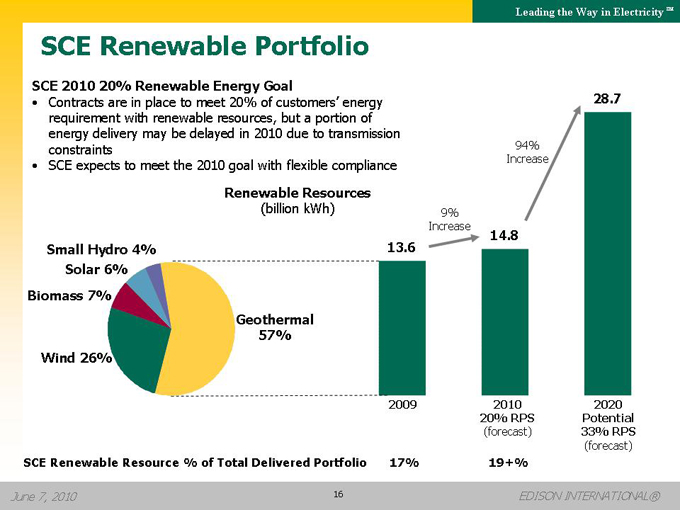
SCE Renewable Portfolio
SCE 2010 20% Renewable Energy Goal
Contracts are in place to meet 20% of customers’ energy requirement with renewable resources, but a portion of energy delivery may be delayed in 2010 due to transmission constraints SCE expects to meet the 2010 goal with flexible compliance
Renewable Resources
(billion kWh)
Small Hydro 4%
Solar 6%
Biomass 7%
Wind 26%
Geothermal 57%
13.6
9% Increase
14.8
94% Increase
28.7
2009
2010 20% RPS
(forecast)
2020 Potential 33% RPS
(forecast)
SCE Renewable Resource % of Total Delivered Portfolio
17%
19+%
June 7, 2010
16
EDISON INTERNATIONAL®
Leading the Way in Electricity SM
Power Mix Comparison
Other
Coal
Natural Gas
Nuclear
Large Hydroelectric
Renewables
100%
1%
49%
21%
20%
6% 3%
U.S. 20081
29%
100%
12%
46%
19%
7%
16%
SCE 20082
Low-GHG Resources 42%
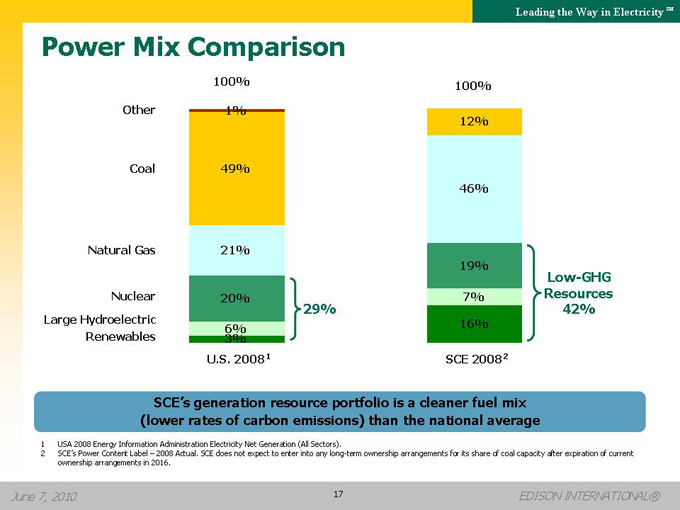
SCE’s generation resource portfolio is a cleaner fuel mix (lower rates of carbon emissions) than the national average
1 | | USA 2008 Energy Information Administration Electricity Net Generation (All Sectors). |
2 SCE’s Power Content Label – 2008 Actual. SCE does not expect to enter into any long-term ownership arrangements for its share of coal capacity after expiration of current ownership arrangements in 2016.
June 7, 2010
17
EDISON INTERNATIONAL®
Leading the Way in Electricity SM
Rates and Bills Comparison
2008 Average Residential Rates1 (¢/kWh)
15.0
SCE
30% Higher
11.6
U.S. Average
2008 Average Residential Bills1 ($ per Month)
90
SCE
9%
Lower
100
U.S. Average
1 | | EIA’s 2008 Electric Sales, Revenue, and Average Price Data. |
Key Factors
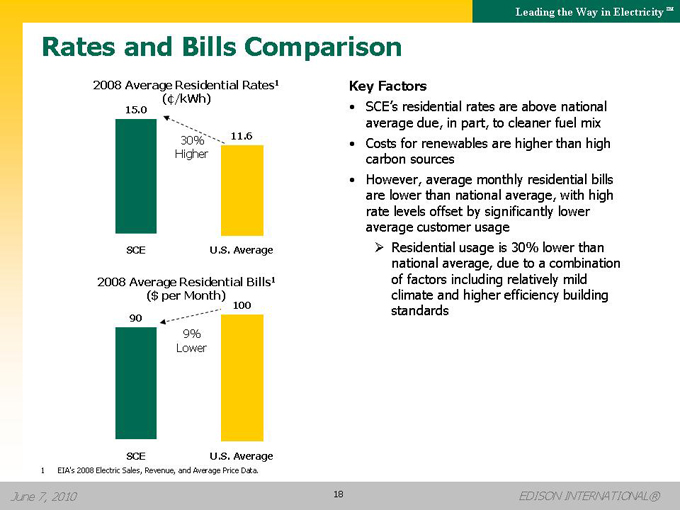
SCE’s residential rates are above national average due, in part, to cleaner fuel mix
Costs for renewables are higher than high carbon sources
However, average monthly residential bills are lower than national average, with high rate levels offset by significantly lower average customer usage
Residential usage is 30% lower than national average, due to a combination of factors including relatively mild climate and higher efficiency building standards
June 7, 2010
18
EDISON INTERNATIONAL®
Leading the Way in Electricity SM
Investment Rationale Summary
Value Drivers
Delivering on growth plan
Significant investment opportunity in wires franchise
Opportunity to earn compensatory return on invested capital
Pass through cost recovery mechanisms
Forward looking General Rate Cases
Strong liquidity to support business requirements
Complying with state-wide renewable policy objectives
Strong credit ratings
Experienced team
Opportunity for long-term shareholder value creation
June 7, 2010
19
EDISON INTERNATIONAL®

Leading the Way in Electricity SM
Appendix
June 7, 2010
20
EDISON INTERNATIONAL®
Leading the Way in Electricity SM
SCE Regulatory Key Events
Case Number Date of Filing Status Next Milestone
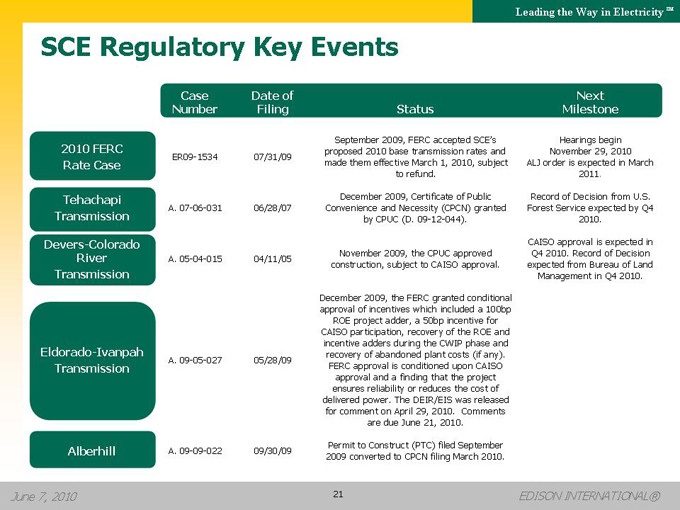
2010 FERC Rate Case ER09-1534 07/31/09 September 2009, FERC accepted SCE’s proposed 2010 base transmission rates and made them effective March 1, 2010, subject to refund. Hearings begin November 29, 2010 ALJ order is expected in March 2011.
Tehachapi Transmission Devers-Colorado River Transmission A. 07-06-031 A. 05-04-015 06/28/07 04/11/05 December 2009, Certificate of Public Convenience and Necessity (CPCN) granted by CPUC (D. 09-12-044). November 2009, the CPUC approved construction, subject to CAISO approval. Record of Decision from U.S. Forest Service expected by Q4 2010. CAISO approval is expected in Q4 2010. Record of Decision expected from Bureau of Land Management in Q4 2010.
Eldorado-Ivanpah Transmission A. 09-05-027 05/28/09 December 2009, the FERC granted conditional approval of incentives which included a 100bp ROE project adder, a 50bp incentive for CAISO participation, recovery of the ROE and incentive adders during the CWIP phase and recovery of abandoned plant costs (if any). FERC approval is conditioned upon CAISO approval and a finding that the project ensures reliability or reduces the cost of delivered power. The DEIR/EIS was released for comment on April 29, 2010. Comments are due June 21, 2010.
Alberhill A. 09-09-022 09/30/09 Permit to Construct (PTC) filed September 2009 converted to CPCN filing March 2010.
June 7, 2010
21
EDISON INTERNATIONAL®
Leading the Way in Electricity SM
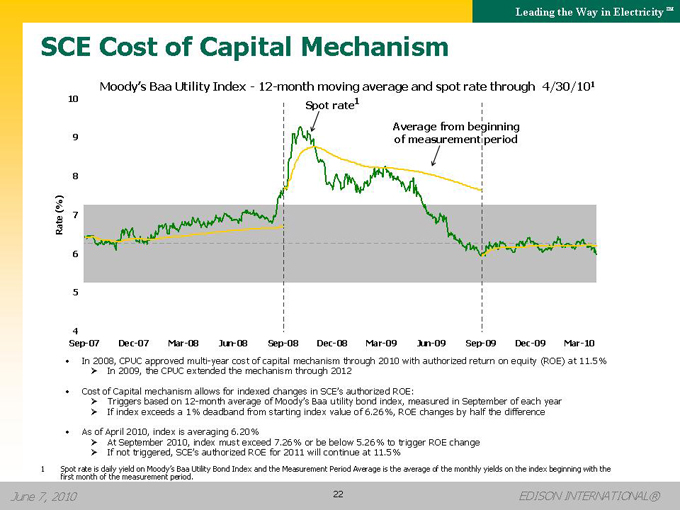
SCE Cost of Capital Mechanism
Moody’s Baa Utility Index—12-month moving average and spot rate through 4/30/101
Spot rate1
10
9
Average from beginning of measurement period
Sep-07
Dec-07
Mar-08
Jun-08
Sep-08
Dec-08
Mar-09
Jun-09
Sep-09
Dec-09
Mar-10
In 2008, CPUC approved multi-year cost of capital mechanism through 2010 with authorized return on equity (ROE) at 11.5%
??In 2009, the CPUC extended the mechanism through 2012
Cost of Capital mechanism allows for indexed changes in SCE’s authorized ROE:
??Triggers based on 12-month average of Moody’s Baa utility bond index, measured in September of each year
??If index exceeds a 1% deadband from starting index value of 6.26%, ROE changes by half the difference As of April 2010, index is averaging 6.20%
??At September 2010, index must exceed 7.26% or be below 5.26% to trigger ROE change
??If not triggered, SCE’s authorized ROE for 2011 will continue at 11.5%
1 Spot rate is daily yield on Moody’s Baa Utility Bond Index and the Measurement Period Average is the average of the monthly yields on the index beginning with the first month of the measurement period.
June 7, 2010
22
EDISON INTERNATIONAL®
Leading the Way in Electricity SM
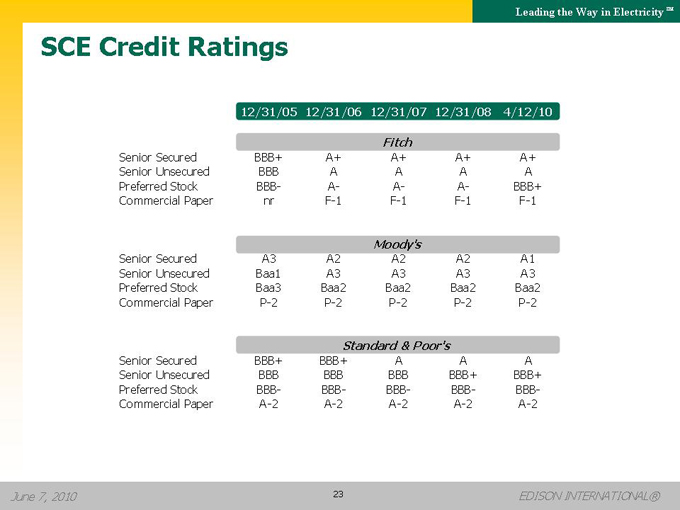
SCE Credit Ratings
12/31/05
12/31/06
12/31/07
12/31/08
4/12/10
Fitch
Senior Secured BBB+ A+ A+ A+ A+
Senior Unsecured BBB A A A A
Preferred Stock BBB- A- A- A- BBB+
Commercial Paper nr F-1 F-1 F-1 F-1
Moody’s
Senior Secured A3 A2 A2 A2 A1
Senior Unsecured Baa1 A3 A3 A3 A3
Preferred Stock Baa3 Baa2 Baa2 Baa2 Baa2
Commercial Paper P-2 P-2 P-2 P-2 P-2
Standard & Poor’s
Senior Secured BBB+ BBB+ A A A
Senior Unsecured BBB BBB BBB BBB+ BBB+
Preferred Stock BBB- BBB- BBB- BBB- BBB-
Commercial Paper A-2 A-2 A-2 A-2 A-2
June 7, 2010
23
EDISON INTERNATIONAL®
Leading the Way in Electricity SM
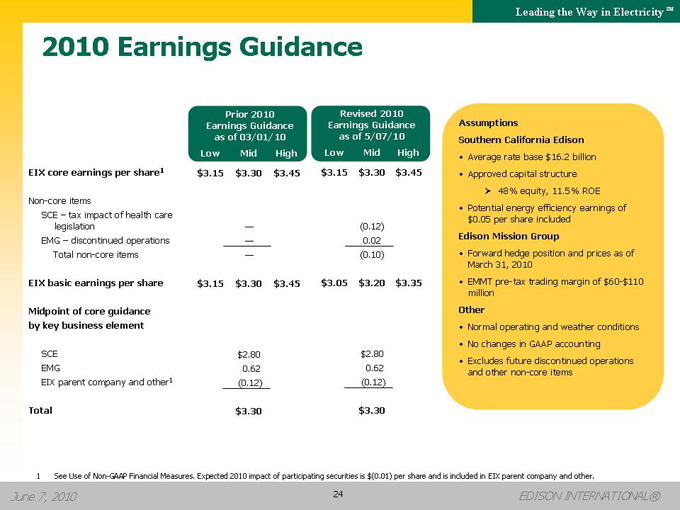
2010 Earnings Guidance
Prior 2010 Revised 2010
Earnings Guidance Earnings Guidance
as of 03/01/10 as of 5/07/10
Low Mid High Low Mid High
EIX core earnings per share1 $3.15 $3.30 $3.45 $3.15 $3.30 $3.45
Non-core items
SCE – tax impact of health care
legislation — (0.12)
EMG – discontinued operations — 0.02
Total non-core items — (0.10)
EIX basic earnings per share $3.15 $3.30 $3.45 $3.05 $3.20 $3.35
Midpoint of core guidance
by key business element
SCE $2.80 $2.80
EMG 0.62 0.62
EIX parent company and other1 (0.12) (0.12)
Total $3.30 $3.30
Assumptions
Southern California Edison
• Average rate base $16.2 billion
• Approved capital structure
??48% equity, 11.5% ROE
• Potential energy efficiency earnings of $0.05 per share included
Edison Mission Group
• Forward hedge position and prices as of March 31, 2010
• EMMT pre-tax trading margin of $60-$110 million
Other
• Normal operating and weather conditions
• No changes in GAAP accounting
• Excludes future discontinued operations and other non-core items
1 See Use of Non-GAAP Financial Measures. Expected 2010 impact of participating securities is $(0.01) per share and is included in EIX parent company and other.
June 7, 2010
24
EDISON INTERNATIONAL®
Leading the Way in Electricity SM
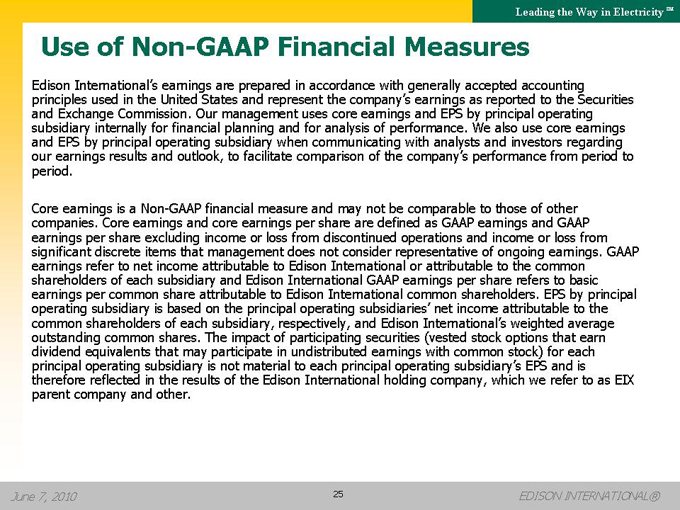
Use of Non-GAAP Financial Measures
Edison International’s earnings are prepared in accordance with generally accepted accounting principles used in the United States and represent the company’s earnings as reported to the Securities and Exchange Commission. Our management uses core earnings and EPS by principal operating subsidiary internally for financial planning and for analysis of performance. We also use core earnings and EPS by principal operating subsidiary when communicating with analysts and investors regarding our earnings results and outlook, to facilitate comparison of the company’s performance from period to period.
Core earnings is a Non-GAAP financial measure and may not be comparable to those of other companies. Core earnings and core earnings per share are defined as GAAP earnings and GAAP earnings per share excluding income or loss from discontinued operations and income or loss from significant discrete items that management does not consider representative of ongoing earnings. GAAP earnings refer to net income attributable to Edison International or attributable to the common shareholders of each subsidiary and Edison International GAAP earnings per share refers to basic earnings per common share attributable to Edison International common shareholders. EPS by principal operating subsidiary is based on the principal operating subsidiaries’ net income attributable to the common shareholders of each subsidiary, respectively, and Edison International’s weighted average outstanding common shares. The impact of participating securities (vested stock options that earn dividend equivalents that may participate in undistributed earnings with common stock) for each principal operating subsidiary is not material to each principal operating subsidiary’s EPS and is therefore reflected in the results of the Edison International holding company, which we refer to as EIX parent company and other.
June 7, 2010
25
EDISON INTERNATIONAL®


