Exhibit 99.2

Leading the Way in Electricity SM
Fourth Quarter 2010 Financial Teleconference
February 28, 2011 EDISON INTERNATIONAL®
Leading the Way in Electricity SM
Forward-Looking Statements
Statements contained in this presentation about future performance, including, without limitation, earnings, asset and rate base growth, load growth, capital expenditures, and other statements that are not purely historical, are forward-looking statements. These forward-looking statements reflect our current expectations; however, such statements involve risks and uncertainties. Actual results could differ materially from current expectations. These forward-looking statements represent our expectations only as of the date of this presentation, and Edison International assumes no duty to update them to reflect new information, events or circumstances. Important factors that could cause different results are discussed under the headings “Risk Factors,” and “Management’s Discussion and Analysis” in Edison International’s 2010 Form 10-K, most recent Form 10-Q and other reports filed with the Securities and Exchange Commission, which are available on our website: www.edisoninvestor.com. These filings also provide additional information on historical and other factual data contained in this presentation.
February 28, 2011 1 EDISON INTERNATIONAL®
Leading the Way in Electricity SM
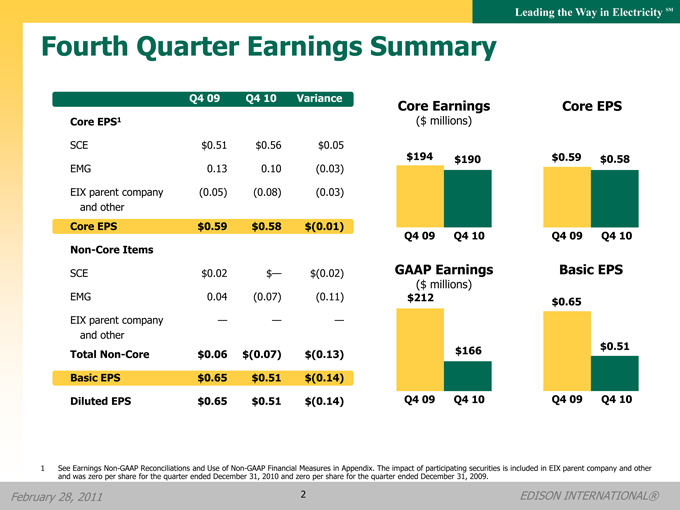
Fourth Quarter Earnings Summary
Q4 09 Q4 10 Variance
Core EPS1
SCE $0.51 $0.56 $0.05
EMG 0.13 0.10 (0.03)
EIX parent company (0.05) (0.08) (0.03)
and other
Core EPS $0.59 $0.58 $(0.01)
Non-Core Items
SCE $0.02 $— $(0.02)
EMG 0.04 (0.07) (0.11)
EIX parent company — — —
and other
Total Non-Core $0.06 $(0.07) $(0.13)
Basic EPS $0.65 $0.51 $(0.14)
Diluted EPS $0.65 $0.51 $(0.14)
Core Earnings Core EPS
($ millions)
$194 $190 $0.59 $0.58
Q4 09 Q4 10 Q4 09 Q4 10
GAAP Earnings Basic EPS
($ millions) $212 $0.65
$166 $0.51
Q4 09 Q4 10 Q4 09 Q4 10
1 See Earnings Non-GAAP Reconciliations and Use of Non-GAAP Financial Measures in Appendix. The impact of participating securities is included in EIX parent company and other and was zero per share for the quarter ended December 31, 2010 and zero per share for the quarter ended December 31, 2009.
February 28, 2011 2 EDISON INTERNATIONAL®
Leading the Way in Electricity SM
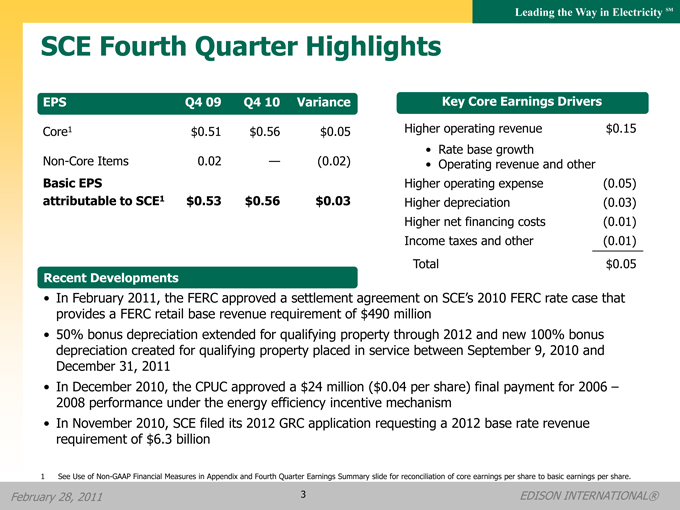
SCE Fourth Quarter Highlights
EPS Q4 09 Q4 10 Variance
Core1 $0.51 $0.56 $0.05
Non-Core Items 0.02 — (0.02)
Basic EPS
attributable to SCE1 $0.53 $0.56 $0.03
Key Core Earnings Drivers
Higher operating revenue $0.15
• Rate base growth
• Operating revenue and other
Higher operating expense (0.05)
Higher depreciation (0.03)
Higher net financing costs (0.01)
Income taxes and other (0.01)
Total $0.05
Recent Developments
• In February 2011, the FERC approved a settlement agreement on SCE’s 2010 FERC rate case that provides a FERC retail base revenue requirement of $490 million
• 50% bonus depreciation extended for qualifying property through 2012 and new 100% bonus depreciation created for qualifying property placed in service between September 9, 2010 and
December 31, 2011
• In December 2010, the CPUC approved a $24 million ($0.04 per share) final payment for 2006 – 2008 performance under the energy efficiency incentive mechanism
• In November 2010, SCE filed its 2012 GRC application requesting a 2012 base rate revenue requirement of $6.3 billion
1 See Use of Non-GAAP Financial Measures in Appendix and Fourth Quarter Earnings Summary slide for reconciliation of core earnings per share to basic earnings per share.
February 28, 2011 3 EDISON INTERNATIONAL®
Leading the Way in Electricity SM
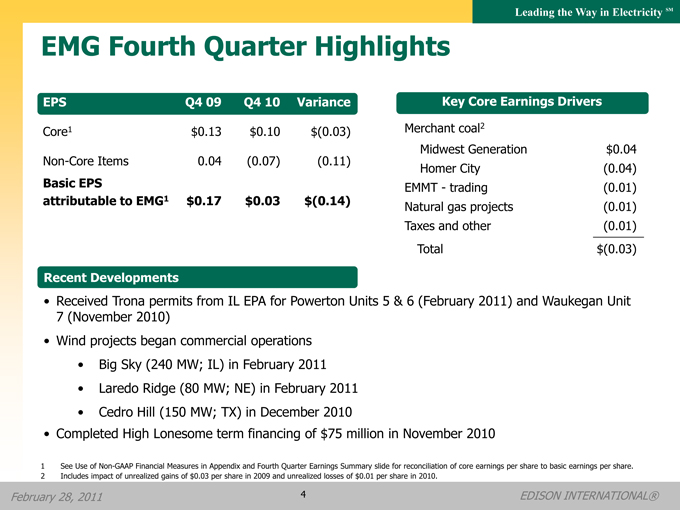
EMG Fourth Quarter Highlights
EPS Q4 09 Q4 10 Variance
Core1 $0.13 $0.10 $(0.03)
Non-Core Items 0.04 (0.07) (0.11)
Basic EPS
attributable to EMG1 $0.17 $0.03 $(0.14)
Key Core Earnings Drivers
Merchant coal2
Midwest Generation $0.04
Homer City (0.04)
EMMT - trading (0.01)
Natural gas projects (0.01)
Taxes and other (0.01)
Total $(0.03)
Recent Developments
• Received Trona permits from IL EPA for Powerton Units 5 & 6 (February 2011) and Waukegan Unit
• Wind projects began commercial operations
• Big Sky (240 MW; IL) in February 2011
• Laredo Ridge (80 MW; NE) in February 2011
• Cedro Hill (150 MW; TX) in December 2010
• Completed High Lonesome term financing of $75 million in November 2010
1 See Use of Non-GAAP Financial Measures in Appendix and Fourth Quarter Earnings Summary slide for reconciliation of core earnings per share to basic earnings per share.
2 | | Includes impact of unrealized gains of $0.03 per share in 2009 and unrealized losses of $0.01 per share in 2010. |
February 28, 2011 4 EDISON INTERNATIONAL®

Leading the Way in Electricity SM
Full-Year Earnings Summary
2009 2010 Variance
Core EPS1
SCE $2.68 $3.01 $0.33
EMG2 0.68 0.59 (0.09)
EIX parent company (0.11) (0.12) (0.01)
and other
Core EPS $3.25 $3.48 $0.23
Non-Core Items
SCE $1.08 $0.18 $(0.90)
EIX parent company 0.15 0.08 (0.07)
and other
Total Non-Core $(0.66) $0.36 $1.02
Basic EPS $2.59 $3.84 $1.25
Diluted EPS $2.58 $3.82 $1.24
Core Earnings Core EPS
($ millions) $1,140 $3.48 $1,064 $3.25
2009 2010 2009 2010
GAAP Earnings Basic EPS
($ millions) $1,256 $3.84
$849 $2.59
2009 2010 2009 2010
1 See Earnings Non-GAAP Reconciliations and Use of Non-GAAP Financial Measures in Appendix. The impact of participating securities is included in EIX parent company and other and was $(0.01) per share for the year-ended December 31, 2010 and $(0.01) per share for the year-ended December 31, 2009.
2 | | Includes impact of unrealized gains of $0.11 per share in 2009 and unrealized losses of $0.06 per share in 2010. |
February 28, 2011 5 EDISON INTERNATIONAL®
Leading the Way in Electricity SM
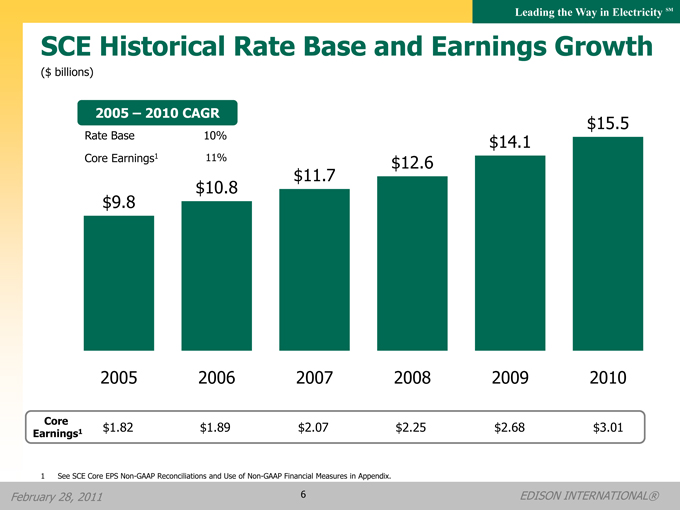
SCE Historical Rate Base and Earnings Growth
($ billions)
2005 – 2010 CAGR
$15.5
Rate Base 10% $14.1 Core Earnings1 11% $12.6
$11.7
$10.8
$9.8
2005 2006 2007 2008 2009 2010
Core $1.82 $1.89 $2.07 $2.25 $2.68 $3.01
Earnings1
1 | | See SCE Core EPS Non-GAAP Reconciliations and Use of Non-GAAP Financial Measures in Appendix. |
February 28, 2011 6 EDISON INTERNATIONAL®

Leading the Way in Electricity SM
SCE Capital Expenditures Forecast
($ billions)
$4.8
$4.4 $4.3
$4.0
$3.8
2010 2011 2012 2013 2014 Total
Forecast $4.4 $4.8 $4.3 $4.0 $17.5 Range1 $3.9 $4.3 $3.8 $3.6 $15.6
Forecast
By Classification
$%
Solar Photovoltaic 0.4 2
Edison SmartConnect™ 0.7 4
Generation 2.3 13
Transmission 5.0 29
Distribution 9.1 52
Total 17.5 100
By Proceeding%
2009 CPUC Rate Case 14
2012 CPUC Rate Case 51
Other CPUC 6
FERC Cases 29
Total 100
1 Currently forecasted 2011-2014 FERC and CPUC capital spending, subject to timely receipt of permitting, licensing and regulatory approvals. Forecast range reflects a 10.5% variability to annual expenditure levels related to execution risk, scope change, delays, regulatory constraints and other contingencies. 10.5% variability based on average level of actual variability experienced in 2009 and 2010.
February 28, 2011 7 EDISON INTERNATIONAL®
Leading the Way in Electricity SM
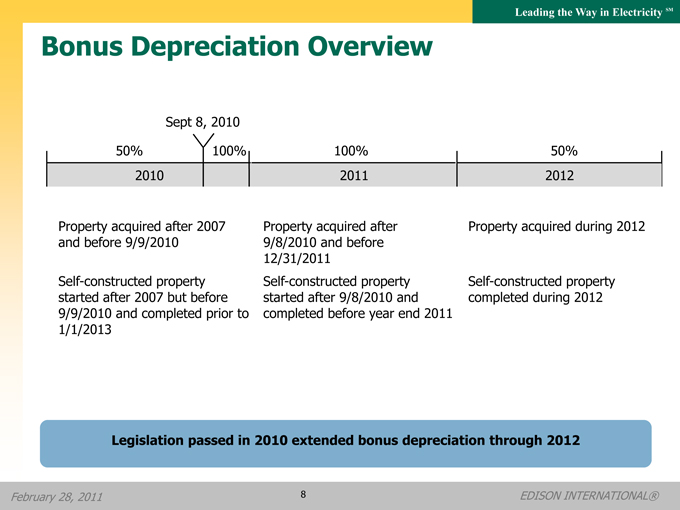
Bonus Depreciation Overview
Sept 8, 2010
50% 100% 100% 50% 2010 2011 2012
Property acquired after 2007 and before 9/9/2010
Self-constructed property started after 2007 but before 9/9/2010 and completed prior to 1/1/2013
Property acquired after 9/8/2010 and before 12/31/2011 Self-constructed property started after 9/8/2010 and completed before year end 2011
Property acquired during 2012
Self-constructed property completed during 2012
Legislation passed in 2010 extended bonus depreciation through 2012
February 28, 2011 8 EDISON INTERNATIONAL®
Leading the Way in Electricity SM
Summary of Bonus Depreciation Impact
• Bonus depreciation expected to have the following impacts on Edison International
Results in an EIX consolidated net operating loss for federal income tax purposes for 2010 and 2011
Increases deferred taxes and reduces SCE’s rate base and revenue requirement
Provides additional cash flow benefits during 2011 to SCE of approximately $550 million
Delays tax allocation payments to EMG until tax benefits are utilized by EIX on a consolidated basis which may be for several years
Eliminates income tax benefits from the domestic production activities deduction (also known as Section 199 deductions) of $16 million in 2011. The negative impact on 2010 net income was $15 million from the recapture of the 2008 Section 199 deductions taken in prior years resulting from the carry back of net operating losses
February 28, 2011 9 EDISON INTERNATIONAL®
Leading the Way in Electricity SM
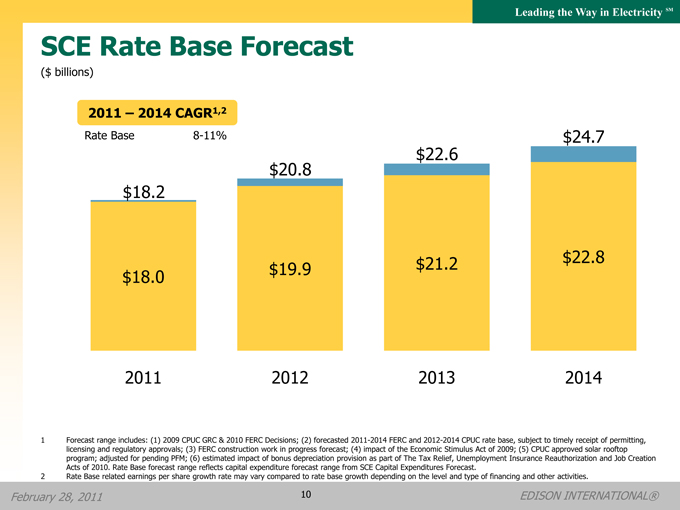
SCE Rate Base Forecast
($ billions)
2011 – 2014 CAGR1,2
Rate Base 8-11% $24.7
$22.6
$20.8
$18.2
$21.2 $22.8
$18.0 $19.9
2011 2012 2013 2014
1 Forecast range includes: (1) 2009 CPUC GRC & 2010 FERC Decisions; (2) forecasted 2011-2014 FERC and 2012-2014 CPUC rate base, subject to timely receipt of permitting, licensing and regulatory approvals; (3) FERC construction work in progress forecast; (4) impact of the Economic Stimulus Act of 2009; (5) CPUC approved solar rooftop program; adjusted for pending PFM; (6) estimated impact of bonus depreciation provision as part of The Tax Relief, Unemployment Insurance Reauthorization and Job Creation Acts of 2010. Rate Base forecast range reflects capital expenditure forecast range from SCE Capital Expenditures Forecast.
2 Rate Base related earnings per share growth rate may vary compared to rate base growth depending on the level and type of financing and other activities.
February 28, 2011 10 EDISON INTERNATIONAL®
Leading the Way in Electricity SM
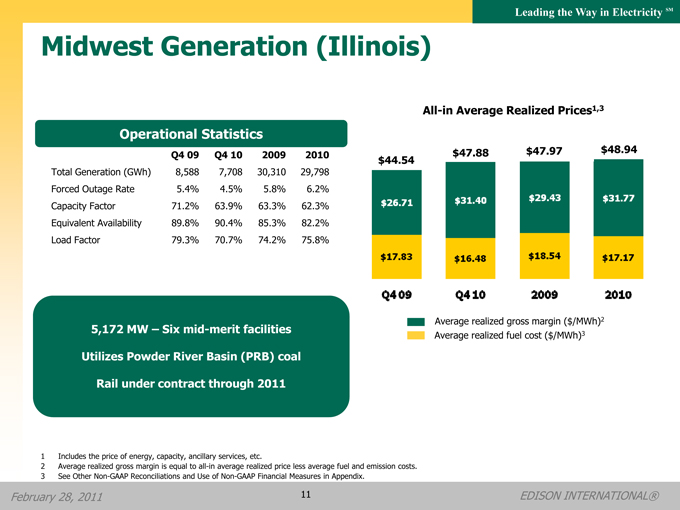
Midwest Generation (Illinois)
Operational Statistics
Q4 09 Q4 10 2009 2010
• Total Generation (GWh) 8,588 7,708 30,310 29,798
• Forced Outage Rate 5.4% 4.5% 5.8% 6.2%
• Capacity Factor 71.2% 63.9% 63.3% 62.3%
• Equivalent Availability 89.8% 90.4% 85.3% 82.2%
• Load Factor 79.3% 70.7% 74.2% 75.8%
All-in Average Realized Prices1,3
$44.54 $47.88 $47.97 $48.94
Average realized gross margin ($/MWh)2 Average realized fuel cost ($/MWh)3
5,172 MW – Six mid-merit facilities Utilizes Powder River Basin (PRB) coal Rail under contract through 2011
1 | | Includes the price of energy, capacity, ancillary services, etc. |
2 | | Average realized gross margin is equal to all-in average realized price less average fuel and emission costs. |
3 | | See Other Non-GAAP Reconciliations and Use of Non-GAAP Financial Measures in Appendix. |
February 28, 2011 11 EDISON INTERNATIONAL®

Leading the Way in Electricity SM
Homer City (Pennsylvania)
Operational Statistics
Q4 09 Q4 10 2009 2010
Total Generation (GWh) 2,769 2,801 11,446 11,028
Forced Outage Rate 14.8% 3.8% 9.4% 10.8%
Capacity Factor 66.4% 67.3% 69.2% 66.8%
Equivalent Availability 78.6% 92.2% 84.7% 79.7%
Load Factor 84.7% 73.0% 81.7% 83.8%
All-in Average Realized Prices1,3
$58.86 $59.25 $59.42
$56.66
Average realized gross margin ($/MWh)2 Average realized fuel cost ($/MWh)3
1,884 MW – Three base-load units Utilizes Northern Appalachian (NAPP) coal Coal largely sourced locally and delivered by truck Homer City Units 1 and 2 offline until Q2 2011
1 | | Includes the price of energy, capacity, ancillary services, etc. |
2 | | Average realized gross margin is equal to all-in average realized price less average fuel and emission costs. |
3 | | See Other Non-GAAP Reconciliations and Use of Non-GAAP Financial Measures in Appendix. |
February 28, 2011 12 EDISON INTERNATIONAL®
Leading the Way in Electricity SM
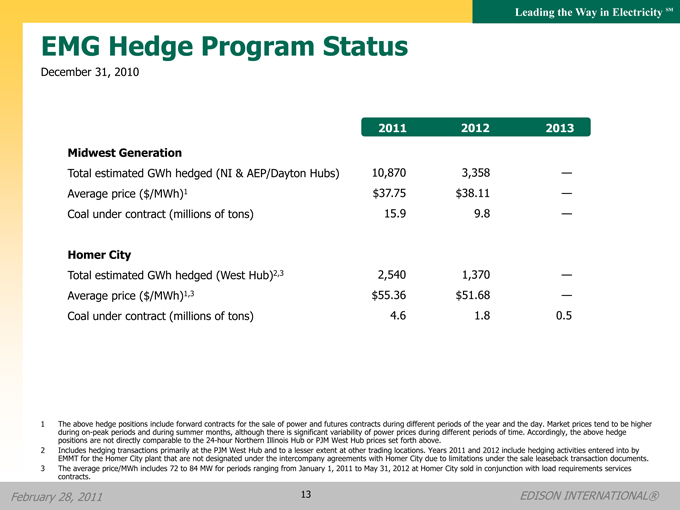
EMG Hedge Program Status
December 31, 2010
2011 2012 2013
Midwest Generation
Total estimated GWh hedged (NI & AEP/Dayton Hubs) 10,870 3,358 —
Average price ($/MWh)1 $37.75 $38.11 —
Coal under contract (millions of tons) 15.9 9.8 —
Homer City
Total estimated GWh hedged (West Hub)2,3 2,540 1,370 —
Average price ($/MWh)1,3 $55.36 $51.68 —
Coal under contract (millions of tons) 4.6 1.8 0.5
1 The above hedge positions include forward contracts for the sale of power and futures contracts during different periods of the year and the day. Market prices tend to be higher during on-peak periods and during summer months, although there is significant variability of power prices during different periods of time. Accordingly, the above hedge positions are not directly comparable to the 24-hour Northern Illinois Hub or PJM West Hub prices set forth above.
2 Includes hedging transactions primarily at the PJM West Hub and to a lesser extent at other trading locations. Years 2011 and 2012 include hedging activities entered into by EMMT for the Homer City plant that are not designated under the intercompany agreements with Homer City due to limitations under the sale leaseback transaction documents.
3 The average price/MWh includes 72 to 84 MW for periods ranging from January 1, 2011 to May 31, 2012 at Homer City sold in conjunction with load requirements services contracts.
February 28, 2011 13 EDISON INTERNATIONAL®
Leading the Way in Electricity SM
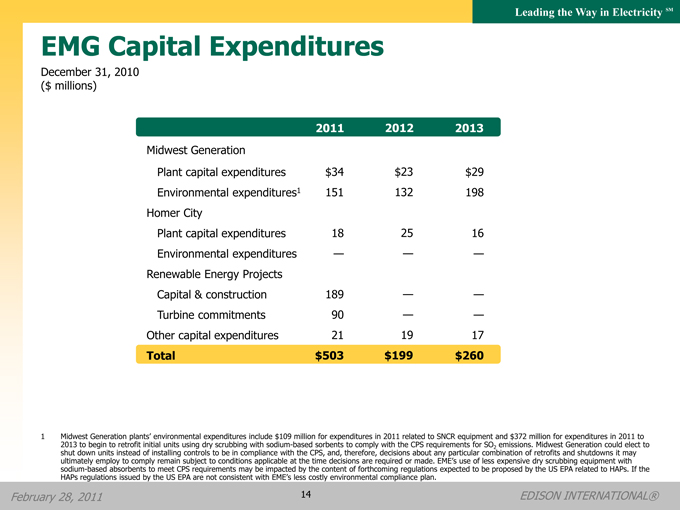
EMG Capital Expenditures
December 31, 2010
($ millions)
2011 2012 2013
Midwest Generation
Plant capital expenditures $34 $23 $29
Environmental expenditures1 151 132 198
Homer City
Plant capital expenditures 18 25 16
Environmental expenditures — — —
Renewable Energy Projects
Capital & construction 189 — —
Turbine commitments 90 — —
Other capital expenditures 21 19 17
Total $503 $199 $260
1 Midwest Generation plants’ environmental expenditures include $109 million for expenditures in 2011 related to SNCR equipment and $372 million for expenditures in 2011 to 2013 to begin to retrofit initial units using dry scrubbing with sodium-based sorbents to comply with the CPS requirements for SO2 emissions. Midwest Generation could elect to shut down units instead of installing controls to be in compliance with the CPS, and, therefore, decisions about any particular combination of retrofits and shutdowns it may ultimately employ to comply remain subject to conditions applicable at the time decisions are required or made. EME’s use of less expensive dry scrubbing equipment with sodium-based absorbents to meet CPS requirements may be impacted by the content of forthcoming regulations expected to be proposed by the US EPA related to HAPs. If the HAPs regulations issued by the US EPA are not consistent with EME’s less costly environmental compliance plan.
February 28, 2011 14 EDISON INTERNATIONAL®
Leading the Way in Electricity SM
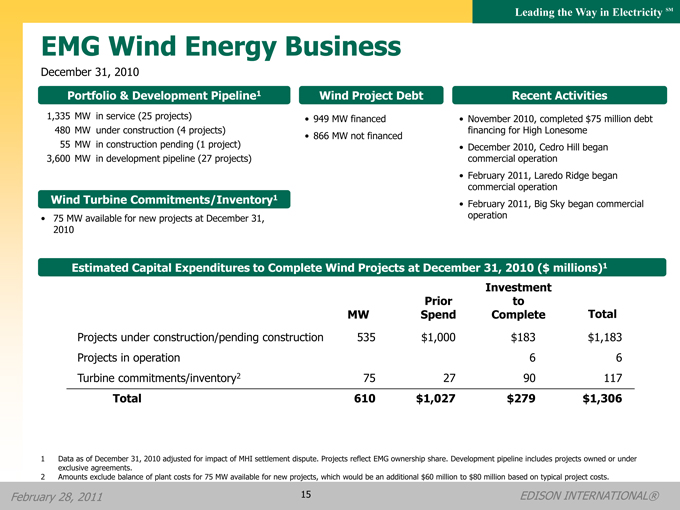
EMG Wind Energy Business
December 31, 2010
Portfolio & Development Pipeline1
1,335 MW in service (25 projects) 480 MW under construction (4 projects)
55 MW in construction pending (1 project)
3,600 MW in development pipeline (27 projects)
Wind Project Debt
• 949 MW financed
• 866 MW not financed
Recent Activities
• November 2010, completed $75 million debt financing for High Lonesome
• December 2010, Cedro Hill began commercial operation
• February 2011, Laredo Ridge began commercial operation
• February 2011, Big Sky began commercial operation
Wind Turbine Commitments/Inventory1
• 75 MW available for new projects at December 31, 2010
Estimated Capital Expenditures to Complete Wind Projects at December 31, 2010 ($ millions)1
Investment
Prior to
MW Spend Complete Total
Projects under construction/pending construction 535 $1,000 $183 $1,183
Projects in operation 6 6
Turbine commitments/inventory2 75 27 90 117
Total 610 $1,027 $279 $1,306
1 Data as of December 31, 2010 adjusted for impact of MHI settlement dispute. Projects reflect EMG ownership share. Development pipeline includes projects owned or under exclusive agreements.
2 Amounts exclude balance of plant costs for 75 MW available for new projects, which would be an additional $60 million to $80 million based on typical project costs.
February 28, 2011 15 EDISON INTERNATIONAL®

Leading the Way in Electricity SM
Funding for 2010-11 Wind Expenditures
($ millions)
$20 $242
$394 $48 million Bank/Vendor $346 million Treasury Grants2
$1,125 $624
$551 $459 million Bank/Vendor $92 million Treasury Grants
$279
12/31/09 New Mitsubishi 2010 2011 Sources Sources Estimated Projects3 Turbines1 Spend4 Remaining Received Pending Spend Spend (12/31/10)
1 EME’s turbine supply agreement with Mitsubishi Power Systems Americas, Inc. was adjusted for the impact of the settlement agreement.
2 Estimate based on estimated construction costs and anticipated commercial operation dates. Grants anticipated are reduced by the Laredo Ridge bridge loan where repayment is due when grant funds are received.
3 Community Wind North and Pinnacle projects were moved to construction and construction pending. Lower than anticipated costs for new projects.
4 Including accruals.
February 28, 2011 16 EDISON INTERNATIONAL®
Leading the Way in Electricity SM
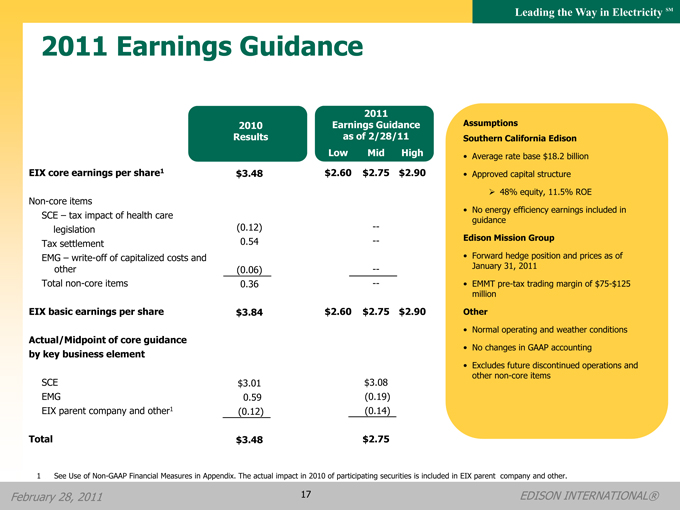
2011 Earnings Guidance
2011
2010 Earnings Guidance
Results as of 2/28/11
Low Mid High
EIX core earnings per share1 $3.48 $2.60 $2.75 $2.90
Non-core items
SCE – tax impact of health care
legislation (0.12) —
Tax settlement 0.54 —
EMG – write-off of capitalized costs and other(0.06) —
Total non-core items 0.36 —
EIX basic earnings per share $3.84 $2.60 $2.75 $2.90
Actual/Midpoint of core guidance
by key business element
SCE $3.01 $3.08
EMG 0.59 (0.19)
EIX parent company and other1 (0.12) (0.14)
Total $3.48 $2.75
Assumptions
Southern California Edison
• Average rate base $18.2 billion
• Approved capital structure
48% equity, 11.5% ROE
• No energy efficiency earnings included in guidance
Edison Mission Group
• Forward hedge position and prices as of January 31, 2011
• EMMT pre-tax trading margin of $75-$125 million
Other
• Normal operating and weather conditions
• No changes in GAAP accounting
• Excludes future discontinued operations and other non-core items
1 See Use of Non-GAAP Financial Measures in Appendix. The actual impact in 2010 of participating securities is included in EIX parent company and other.
February 28, 2011 17 EDISON INTERNATIONAL®

Leading the Way in Electricity SM
2011 Core Guidance - Midpoint
Reconciliation of Core Earnings Per Share Guidance – 2010 Results to 2011
EIX Parent Co. SCE +0.07 EMG (0.78) (0.02)
0.33 (0.71)
$3.48 (0.04)
(0.22)
(0.01) (0.06) (0.02)
$2.75
2010 2010 2010 Rate Base Generation EMMT Corporate EIX Parent 2011 Results Energy Positive Growth Fleet Expense, Company Guidance1 Efficiency Variances Taxes & Other
1 See Use of Non-GAAP Financial Measures in Appendix.
February 28, 2011 18 EDISON INTERNATIONAL®

Leading the Way in Electricity SM
Appendix
February 28, 2011 19 EDISON INTERNATIONAL®
Leading the Way in Electricity SM
Updates Since Our Last Presentation
• Q4 10 results and standard information
• SCE Capital Expenditures, Rate Base and Core Earnings (pp. 6, 7 & 10)
• Bonus Depreciation (pp. 8 & 9)
• 2011 Earnings Guidance and Forward Curves (pp. 17, 18 & 30)
February 28, 2011 20 EDISON INTERNATIONAL®
Leading the Way in Electricity SM
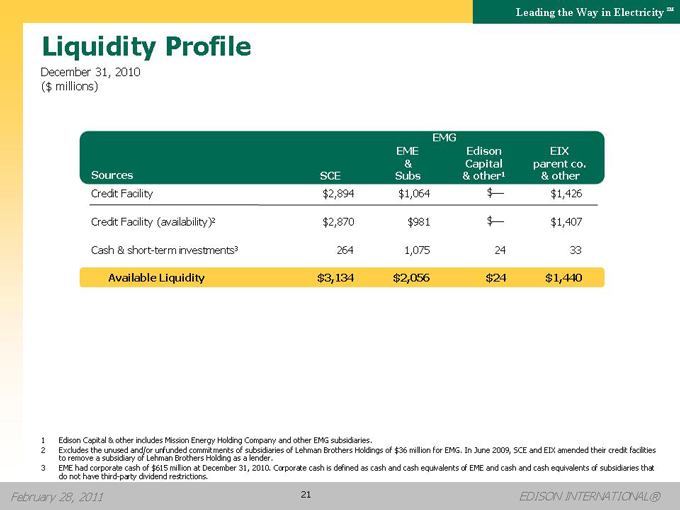
Liquidity Profile
December 31, 2010
($ millions)
EMG
EME Edison EIX
& Capital parent co.
Sources SCE Subs & other1 & other
Credit Facility $2,894 $1,064 $— $1,426
Credit Facility (availability)2 $2,870 $981 $— $1,407
Cash & short-term investments3 264 1,075 24 33
Available Liquidity $3,134 $2,056 $24 $1,440
1 Edison Capital & other includes Mission Energy Holding Company and other EMG subsidiaries.
2 Excludes the unused and/or unfunded commitments of subsidiaries of Lehman Brothers Holdings of $36 million for EMG. In June 2009, SCE and EIX amended their credit facilities to remove a subsidiary of Lehman Brothers Holding as a lender.
3 EME had corporate cash of $615 million at December 31, 2010. Corporate cash is defined as cash and cash equivalents of EME and cash and cash equivalents of subsidiaries that do not have third-party dividend restrictions.
February 28, 2011 21 EDISON INTERNATIONAL®
Leading the Way in Electricity SM
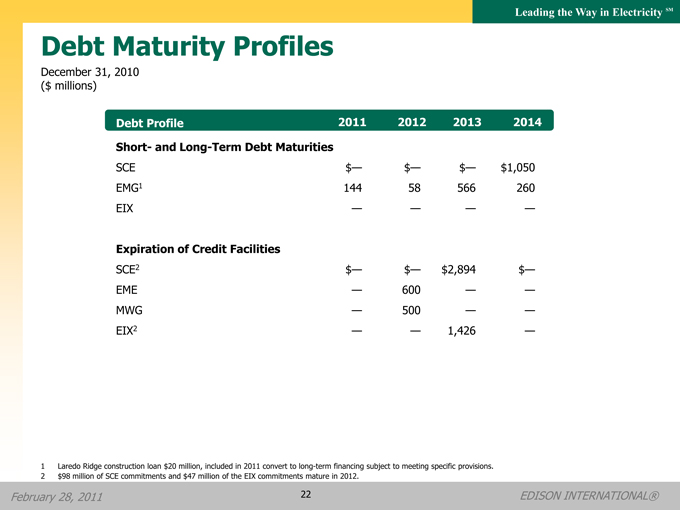
Debt Maturity Profiles
December 31, 2010
($ millions)
Debt Profile 2011 2012 2013 2014
Short- and Long-Term Debt Maturities
SCE $— $— $— $1,050
EMG1 144 58 566 260
EIX — — — —
Expiration of Credit Facilities
SCE2 $— $— $2,894 $—
EME — 600 — —
MWG — 500 — —
EIX2 — — 1,426 —
1 Laredo Ridge construction loan $20 million, included in 2011 convert to long-term financing subject to meeting specific provisions.
2 | | $98 million of SCE commitments and $47 million of the EIX commitments mature in 2012. |
February 28, 2011 22 EDISON INTERNATIONAL®
Leading the Way in Electricity SM
SCE Appendix
February 28, 2011 23 EDISON INTERNATIONAL®

Leading the Way in Electricity SM
SCE Cost of Capital Mechanism
Moody’s Baa Utility Index - 12-month moving average and spot rate through 01/31/111
10
Spot rate1
9
Moving Average for (%) measurement period
7 Starting Index=6.22% Rate 6
Sep-07 Dec-07 Mar-08 Jun-08 Sep-08 Dec-08 Mar-09 Jun-09 Sep-09 Dec-09 Mar-10 Jun-10 Sep-10 Dec-10
• In 2008 In , CPUC 2009, approved the CPUC multi extended -year cost the of capital mechanism through 2010 with authorized return on equity (ROE) at 11.5%
mechanism through 2012
• Cost of Capital mechanism allows for indexed changes in SCE’s authorized ROE
Triggers based on 12-month average of Moody’s Baa utility bond index, measured in September of each year
If index exceeds a 1% deadband from starting index value of 6.26%, authorized ROE changes by half the difference
• As of January 2011, index averaged 5.89%
At September 2010, index did not exceed 7.26% and was not below 5.26% to trigger a ROE change
SCE’s authorized ROE for 2011 will continue at 11.5%
1 Spot rate is daily yield on Moody’s Baa Utility Bond Index and the Measurement Period Average is the average of the monthly yields on the index beginning with the first month of the measurement period.
February 28, 2011 24 EDISON INTERNATIONAL®
Leading the Way in Electricity SM
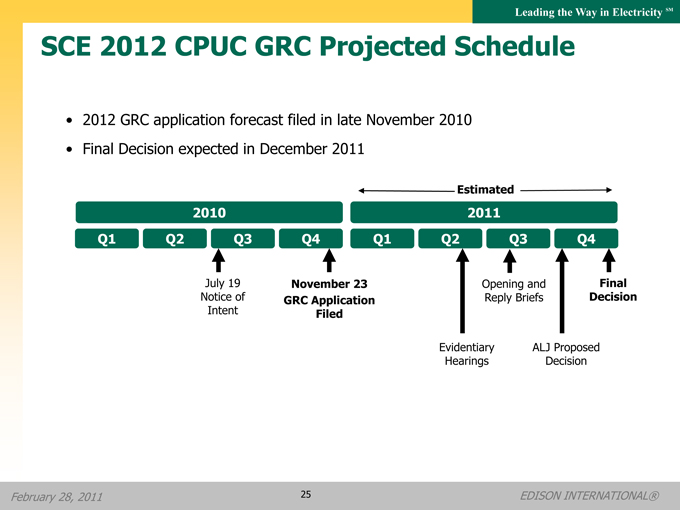
SCE 2012 CPUC GRC Projected Schedule
• 2012 GRC application forecast filed in late November 2010
• Final Decision expected in December 2011
Estimated 2010 2011
Q1 Q2 Q3 Q4 Q1 Q2 Q3 Q4
July 19 November 23 Opening and Final
Notice of GRC Application Reply Briefs Decision
Intent Filed
Evidentiary ALJ Proposed Hearings Decision
February 28, 2011 25 EDISON INTERNATIONAL®

Leading the Way in Electricity SM
SCE Regulatory Key Events
Case Date of Status Next Number Filing Milestone
September 2009, FERC accepted SCE’s
2010 FERC ER09-1534 proposed 2010 base transmission rates FERC approved a settlement 07/31/09 Rate Case ER11-2405 and made them effective March 1, 2010, agreement in February 2011 subject to refund
Special Use Permit expected
Tehachapi October 2010, Federal Record of Decision
A. 07-06-031 06/28/07 from the U. S. Forest Service Transmission (ROD) obtained from U.S. Forest Service in Q1 2011
Federal ROD from the Bureau DCR August 2010, SCE obtained final approval A. 05-04-015 04/11/05 of Land Management (BLM) Transmission from the CPUC to commence construction expected in Q2 2011
Eldorado-Ivanpah Federal ROD from the BLM and December 2010, SCE obtained CPCN
Transmission Final Approval from Nevada PUC A. 09-05-027 05/28/09 from the CPUC, approving SCE’s project expected in Q2 2011
Alberhill Permit to Construct (PTC) filed in
September 2009 and converted to a Draft EIR is expected from the A. 09-09-022 09/30/09 CPCN filing in March 2010 CPUC in Q4 2011
February 28, 2011 26 EDISON INTERNATIONAL®
Leading the Way in Electricity SM
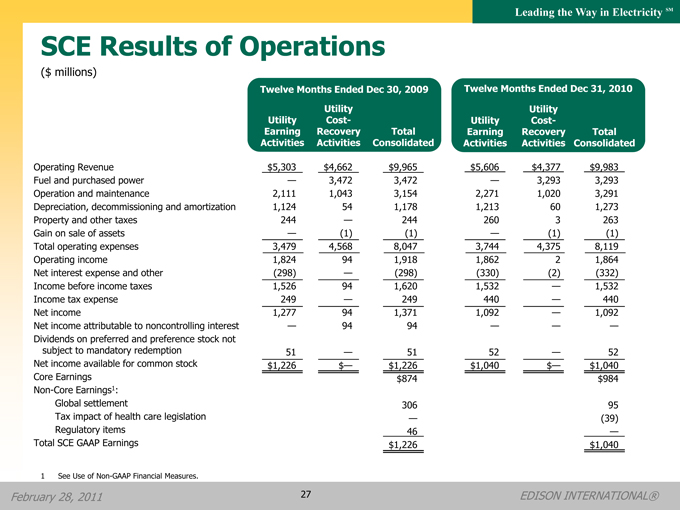
SCE Results of Operations
($ millions)
Twelve Months Ended Dec 30, 2009 Twelve Months Ended Dec 31, 2010
Utility Utility
Utility Cost- Utility Cost-
Earning Recovery Total Earning Recovery Total
Activities Activities Consolidated Activities Activities Consolidated
Operating Revenue $5,303 $4,662 $9,965 $5,606 $4,377 $9,983
Fuel and purchased power — 3,472 3,472 — 3,293 3,293
Operation and maintenance 2,111 1,043 3,154 2,271 1,020 3,291
Depreciation, decommissioning and amortization 1,124 54 1,178 1,213 60 1,273
Property and other taxes 244 — 244 260 3 263
Gain on sale of assets — (1) (1) — (1) (1)
Total operating expenses 3,479 4,568 8,047 3,744 4,375 8,119
Operating income 1,824 94 1,918 1,862 2 1,864
Net interest expense and other (298) — (298) (330) (2) (332)
Income before income taxes 1,526 94 1,620 1,532 — 1,532
Income tax expense 249 — 249 440 — 440
Net income 1,277 94 1,371 1,092 — 1,092
Net income attributable to noncontrolling interest — 94 94 — — —
Dividends on preferred and preference stock not
subject to mandatory redemption 51 — 51 52 — 52
Net income available for common stock $1,226 $— $1,226 $1,040 $— $1,040
Core Earnings $874 $984
Non-Core Earnings1:
Global settlement 306 95
Tax impact of health care legislation — (39)
Regulatory items 46 —
Total SCE GAAP Earnings $1,226 $1,040
1 | | See Use of Non-GAAP Financial Measures. |
February 28, 2011 27 EDISON INTERNATIONAL®
Leading the Way in Electricity SM
EMG Appendix
February 28, 2011 28 EDISON INTERNATIONAL®

Leading the Way in Electricity SM
EMG Business Platform
December 31, 2010
145
141
1,884 67
53 145
5,172
305 40 19 964
190 114
461
Operating Platform1 MW%
Coal 7,096 72
Natural Gas 1,269 13
Wind 1,335 14
Other 153 1
Total 9,853 100
Wind Development Pipeline MW
Pipeline2 ~3,600
Under Construction and Pending 535
Thermal Pipeline
Natural Gas3 479
1 Natural gas includes oil-fired; other includes Doga in Turkey (144 MW) and Huntington biomass (9 MW) which are not shown.
2 Owned or under exclusive agreement.
3 Deliveries under the power sales agreement are expected to commence in 2013. Construction will be unable to begin until the legal challenges to the Priority Reserve emission credits are resolved or another source of credits for the project is identified.
February 28, 2011 29 EDISON INTERNATIONAL®
Leading the Way in Electricity SM
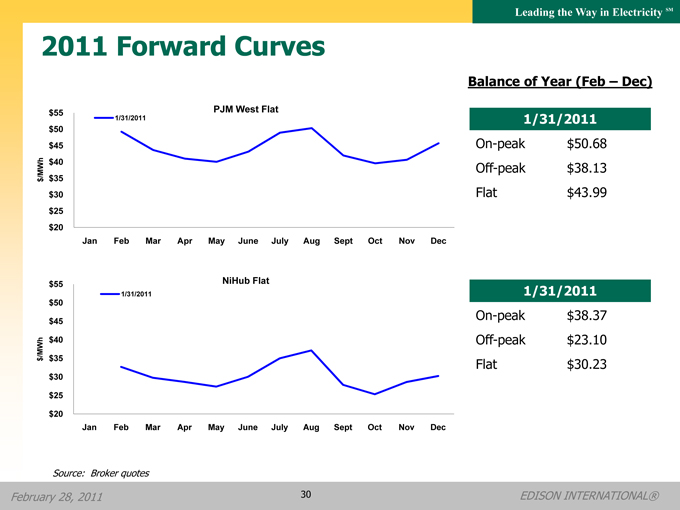
2011 Forward Curves
$55 PJM West Flat
1/31/2011 $50 $45 /MWh $40 $ $35 $30 $25 $20
Jan Feb Mar Apr May June July Aug Sept Oct Nov Dec
Balance of Year (Feb – Dec)
1/31/2011
-On peak $50.68
Off-peak $38.13
Flat $43.99
1/31/2011
On-peak
$38.37
Off-peak
$23.10
Flat
$30.23
$55 NiHub Flat
1/31/2011 $50
$45
/MWh $40 $ $35
$30
$25
$20
Jan Feb Mar Apr May June July Aug Sept Oct Nov Dec
Source: Broker quotes
February 28, 2011 30 EDISON INTERNATIONAL®
Leading the Way in Electricity SM
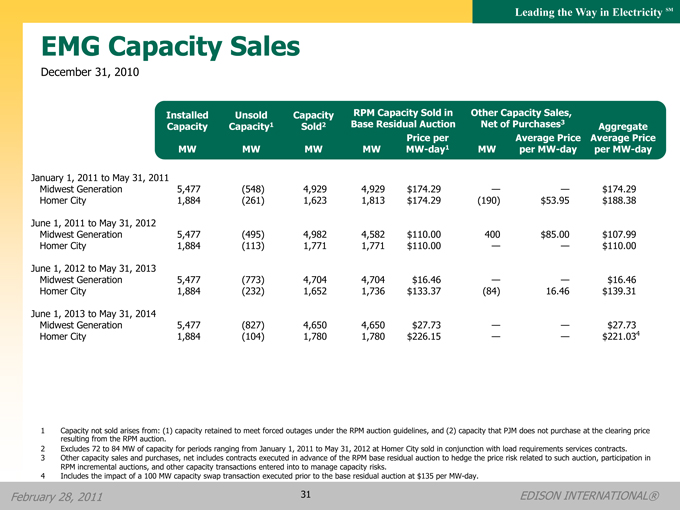
EMG Capacity Sales
December 31, 2010
Installed Unsold Capacity RPM Capacity Sold in Other Capacity Sales,
Capacity Capacity1 Sold2 Base Residual Auction Net of Purchases3 Aggregate
Price per Average Price Average Price
MW MW MW MW MW-day1 MW per MW-day per MW-day
January 1, 2011 to May 31, 2011
Midwest Generation 5,477 (548) 4,929 4,929 $174.29 — — $174.29
Homer City 1,884 (261) 1,623 1,813 $174.29 (190) $53.95 $188.38
June 1, 2011 to May 31, 2012
Midwest Generation 5,477 (495) 4,982 4,582 $110.00 400 $85.00 $107.99
Homer City 1,884 (113) 1,771 1,771 $110.00 — — $110.00
June 1, 2012 to May 31, 2013
Midwest Generation 5,477 (773) 4,704 4,704 $16.46 — — $16.46
Homer City 1,884 (232) 1,652 1,736 $133.37 (84) 16.46 $139.31
June 1, 2013 to May 31, 2014
Midwest Generation 5,477 (827) 4,650 4,650 $27.73 — — $27.73
Homer City 1,884 (104) 1,780 1,780 $226.15 — — $221.034
1 Capacity not sold arises from: (1) capacity retained to meet forced outages under the RPM auction guidelines, and (2) capacity that PJM does not purchase at the clearing price resulting from the RPM auction.
2 Excludes 72 to 84 MW of capacity for periods ranging from January 1, 2011 to May 31, 2012 at Homer City sold in conjunction with load requirements services contracts.
3 Other capacity sales and purchases, net includes contracts executed in advance of the RPM base residual auction to hedge the price risk related to such auction, participation in RPM incremental auctions, and other capacity transactions entered into to manage capacity risks.
4 Includes the impact of a 100 MW capacity swap transaction executed prior to the base residual auction at $135 per MW-day.
February 28, 2011 31 EDISON INTERNATIONAL®
Leading the Way in Electricity SM
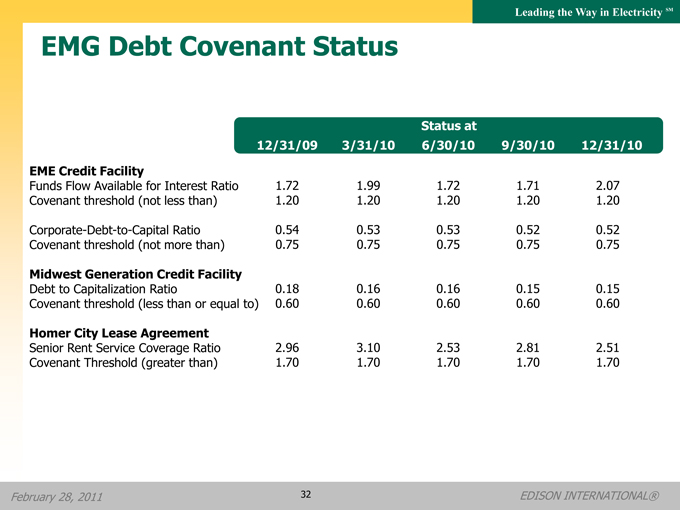
EMG Debt Covenant Status
Status at
12/31/09 3/31/10 6/30/10 9/30/10 12/31/10
EME Credit Facility
Funds Flow Available for Interest Ratio 1.72 1.99 1.72 1.71 2.07
Covenant threshold (not less than) 1.20 1.20 1.20 1.20 1.20
Corporate-Debt-to-Capital Ratio 0.54 0.53 0.53 0.52 0.52
Covenant threshold (not more than) 0.75 0.75 0.75 0.75 0.75
Midwest Generation Credit Facility
Debt to Capitalization Ratio 0.18 0.16 0.16 0.15 0.15
Covenant threshold (less than or equal to) 0.60 0.60 0.60 0.60 0.60
Homer City Lease Agreement
Senior Rent Service Coverage Ratio 2.96 3.10 2.53 2.81 2.51
Covenant Threshold (greater than) 1.70 1.70 1.70 1.70 1.70
February 28, 2011 32 EDISON INTERNATIONAL®

Leading the Way in Electricity SM
EMG – Illinois Compliance Agreement Timeline
Compliance Deadlines and Estimated Construction Timelines1
Completed 2010 2011 2012 2013 2014 2015 2016 2017 2018 2019 Mercury ACI ($45 million) Waukegan 7 Will County 3 Compliance deadlines 0.008 or 90% reduction2 and rates (lb/GWh) Construction timelines
(Cost included in SO2 spend) NOx 0.11
Compliance deadlines and rates (lb/mmbtu)
Construction timelines $137 million SO2
Compliance deadlines Waukegan Waukegan 7 8 Crawford 7,
0.44 Joliet, and rates (lb/mmbtu) 0.41 Fisk Powerton,
0.28
0.195 Crawford 8 Will
0.15 County
0.13
0.11
Construction timelines Up to $1.2 billion
NOx SO2 Mercury
Unit-specific technology requirements
Fleet-wide average emission rate requirements Capital spending period
1 Simplified summary of key compliance deadlines and estimated construction timelines. Unit-specific deadlines as of December 31 of the calendar year shown. SO2 unit-specific deadlines apply to Unit 19 at Fisk, Units 7 and 8 at Waukegan, Units 7 and 8 at Crawford, Units 7 and 8 at Joliet, Units 5 and 6 at Powerton and Units 3 and 4 at Will County.
2 Requirement relates to individual units (for example, Powerton Units 5 and 6 must meet individually).
February 28, 2011 33 EDISON INTERNATIONAL®
Leading the Way in Electricity SM
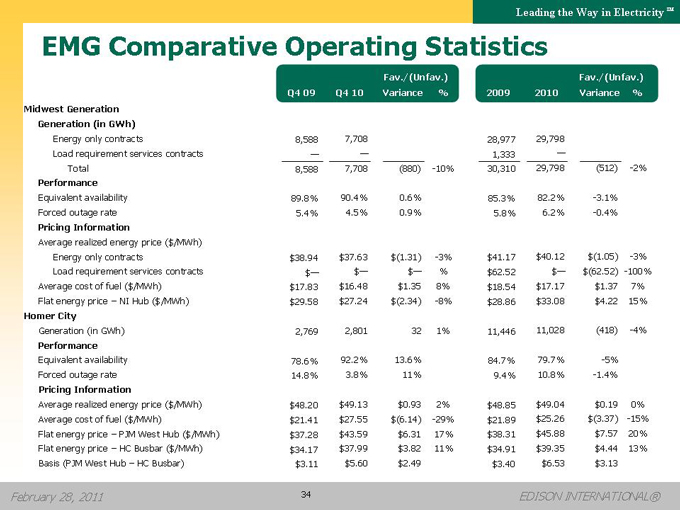
EMG Comparative Operating Statistics
Fav./(Unfav.) Fav./(Unfav.)
Q4 09 Q4 10 Variance % 2009 2010 Variance %
Midwest Generation
Generation (in GWh)
Energy only contracts 8,588 7,708 28,977 29,798
Load requirement services contracts — — 1,333 —
Total 8,588 7,708 (880) -10% 30,310 29,798 (512) -2%
Performance
Equivalent availability 89.8% 90.4% 0.6% 85.3% 82.2% -3.1%
Forced outage rate 5.4% 4.5% 0.9% 5.8% 6.2% -0.4%
Pricing Information
Average realized energy price ($/MWh)
Energy only contracts $38.94 $37.63 $(1.31) -3% $41.17 $40.12 $(1.05) -3%
Load requirement services contracts $— $— $— % $62.52 $— $(62.52) -100%
Average cost of fuel ($/MWh) $17.83 $16.48 $1.35 8% $18.54 $17.17 $1.37 7%
Flat energy price – NI Hub ($/MWh) $29.58 $27.24 $(2.34) -8% $28.86 $33.08 $4.22 15%
Homer City
Generation (in GWh) 2,769 2,801 32 1% 11,446 11,028 (418) -4%
Performance
Equivalent availability 78.6% 92.2% 13.6% 84.7% 79.7% -5%
Forced outage rate 14.8% 3.8% 11% 9.4% 10.8% -1.4%
Pricing Information
Average realized energy price ($/MWh) $48.20 $49.13 $0.93 2% $48.85 $49.04 $0.19 0%
Average cost of fuel ($/MWh) $21.41 $27.55 $(6.14) -29% $21.89 $25.26 $(3.37) -15%
Flat energy price – PJM West Hub ($/MWh) $37.28 $43.59 $6.31 17% $38.31 $45.88 $7.57 20%
Flat energy price – HC Busbar ($/MWh) $34.17 $37.99 $3.82 11% $34.91 $39.35 $4.44 13%
Basis (PJM West Hub – HC Busbar) $3.11 $5.60 $2.49 $3.40 $6.53 $3.13
February 28, 2011 34 EDISON INTERNATIONAL®

Leading the Way in Electricity SM
EMG – Adjusted EBITDA
December 31, 2010
($ millions)
Reconciliation to Earnings1 Q4 09 Q4 10 2009 2010
Earnings $55 $10 $(395) $224
Addback (Deduct):
Discontinued operations 2 (1) 7 (4)
Income from continuing operations 57 9 (388) 220
Interest expense 74 65 306 264
Interest income (8) — (23) (9)
Income taxes (benefits) (21) (13) (284) (36)
Depreciation and amortization 62 68 240 249
EBITDA2 164 129 (149) 688
Production tax credits 16 17 56 62
Addback:
Lease termination & other — — 885 —
Adjusted EBITDA $184 $187 $796 $798
1 | | Earnings refer to net income attributable to Edison Mission Group. |
2 | | See Use of Non-GAAP Financial Measures for additional information on EBITDA and Adjusted EBITDA. |
February 28, 2011 35 EDISON INTERNATIONAL®
Leading the Way in Electricity SM
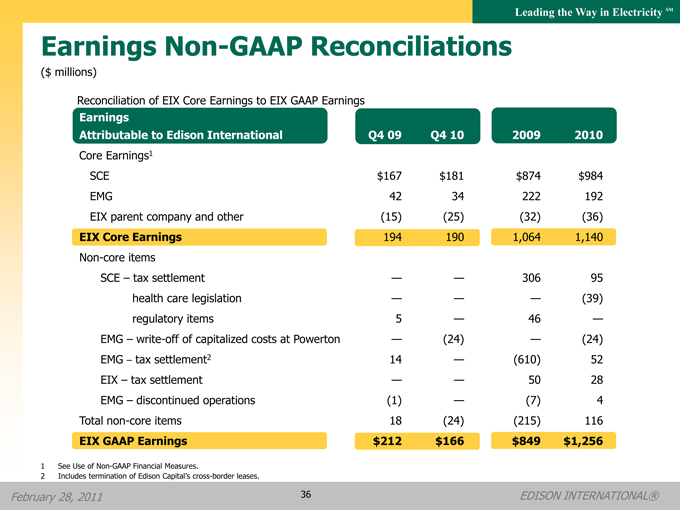
Earnings Non-GAAP Reconciliations
($ millions)
Reconciliation of EIX Core Earnings to EIX GAAP Earnings
Earnings
Attributable to Edison International Q4 09 Q4 10 2009 2010
Core Earnings1
SCE $167 $181 $874 $984
EMG 42 34 222 192
EIX parent company and other (15) (25) (32) (36)
EIX Core Earnings 194 190 1,064 1,140
Non-core items
SCE – tax settlement — — 306 95
health care legislation — — — (39)
regulatory items 5 — 46 —
EMG – write-off of capitalized costs at Powerton — (24) — (24)
EMG – tax settlement2 14 — (610) 52
EIX – tax settlement — — 50 28
EMG – discontinued operations (1) — (7) 4
Total non-core items 18 (24) (215) 116
EIX GAAP Earnings $212 $166 $849 $1,256
1 | | See Use of Non-GAAP Financial Measures. |
2 | | Includes termination of Edison Capital’s cross-border leases. |
February 28, 2011 36 EDISON INTERNATIONAL®

Leading the Way in Electricity SM
SCE Core EPS Non-GAAP Reconciliations
Reconciliation of SCE Core Earnings Per Share to SCE GAAP Earnings Per Share
Earnings Per Share
Attributable to SCE 2006 2007 2008 2009 2010
SCE Core Earnings Per Share1 $1.82 $1.89 $2.07 $2.25 $2.68 $3.01 11%
Non-core items
Tax settlement — — — 0.94 0.30
Health care legislation — — — — (0.12)
Regulatory and tax items 0.36 0.40 0.10 (0.15) 0.14 —
Generator settlement/refund incentive 0.04 0.09 — — — —
Total non-core items 0.40 0.49 0.10 (0.15) 1.08 0.18
SCE GAAP Earnings Per Share 42.22 $2.38 $2.17 $2.10 $3.76 $3.19 8%
1 | | See Use of Non-GAAP Financial Measures. |
February 28, 2011 37 EDISON INTERNATIONAL®
Leading the Way in Electricity SM
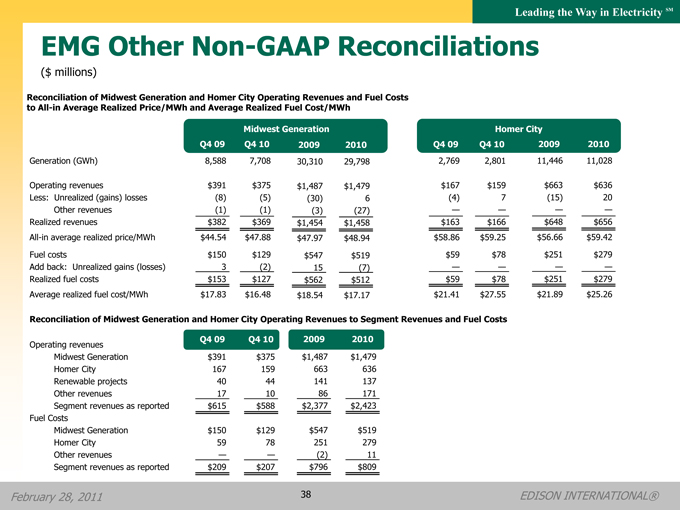
EMG Other Non-GAAP Reconciliations
($ millions)
Reconciliation of Midwest Generation and Homer City Operating Revenues and Fuel Costs to All-in Average Realized Price/MWh and Average Realized Fuel Cost/MWh
Midwest Generation Homer City
Q4 09 Q4 10 2009 2010 Q4 09 Q4 10 2009 2010
Generation (GWh) 8,588 7,708 30,310 29,798 2,769 2,801 11,446 11,028
Operating revenues $391 $375 $1,487 $1,479 $167 $159 $663 $636
Less: Unrealized (gains) losses (8) (5) (30) 6 (4) 7 (15) 20
Other revenues (1) (1) (3) (27) — — — —
Realized revenues $382 $369 $1,454 $1,458 $163 $166 $648 $656
All-in average realized price/MWh $44.54 $47.88 $47.97 $48.94 $58.86 $59.25 $56.66 $59.42
Fuel costs $150 $129 $547 $519 $59 $78 $251 $279
Add back: Unrealized gains (losses) 3 (2) 15 (7) — — — —
Realized fuel costs $153 $127 $562 $512 $59 $78 $251 $279
Average realized fuel cost/MWh $17.83 $16.48 $18.54 $17.17 $21.41 $27.55 $21.89 $25.26
Reconciliation of Midwest Generation and Homer City Operating Revenues to Segment Revenues and Fuel Costs
Operating revenues Q4 09 Q4 10 2009 2010
Midwest Generation $391 $375 $1,487 $1,479
Homer City 167 159 663 636
Renewable projects 40 44 141 137
Other revenues 17 10 86 171
Segment revenues as reported $615 $588 $2,377 $2,423
Fuel Costs
Midwest Generation $150 $129 $547 $519
Homer City 59 78 251 279
Other revenues — — (2) 11
Segment revenues as reported $209 $207 $796 $809
February 28, 2011 38 EDISON INTERNATIONAL®
Leading the Way in Electricity SM
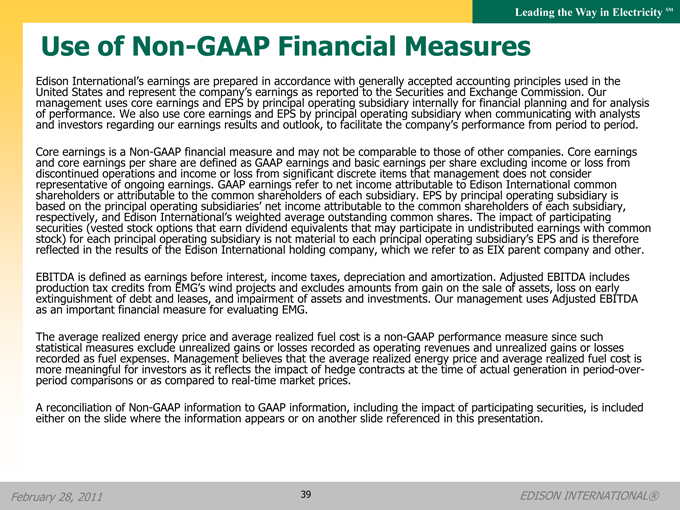
Use of Non-GAAP Financial Measures
United Edison States International’s and represent earnings the are company’s prepared earnings in accordance as reported with generally to the Securities accepted and accounting Exchange principles Commission used . Our in the management of performance uses . We core also earnings use core and earnings EPS by and principal EPS by operating principal subsidiary operating subsidiary internally for when financial communicating planning and with for analysts analysis and investors regarding our earnings results and outlook, to facilitate the company’s performance from period to period.
Core and core earnings earnings is a per Non share -GAAP are financial defined measure as GAAP and earnings may not and be basic comparable earnings to per those share of other excluding companies income . Core or loss earnings from representative discontinued operations of ongoing and earnings income . GAAP or loss earnings from significant refer to net discrete income items attributable that management to Edison does International not consider common shareholders based on the or principal attributable operating to the subsidiaries’ common shareholders net income attributable of each subsidiary to the . common EPS by principal shareholders operating of each subsidiary subsidiary, is securities respectively (vested , and Edison stock options International that earn ‘s weighted dividend average equivalents outstanding that may common participate shares in undistributed . The impact of earnings participating with common stock) reflected for in each the principal results of operating the Edison subsidiary International is not holding material company, to each principal which we operating refer to as subsidiary’s EIX parent EPS company and is and therefore other . production EBITDA is defined tax credits as earnings from EMG before ‘s wind interest, projects income and excludes taxes, depreciation amounts from and gain amortization on the sale . Adjusted of assets, EBITDA loss on includes early extinguishment as an important of financial debt and measure leases, for and evaluating impairment EMG of. assets and investments. Our management uses Adjusted EBITDA statistical The average measures realized exclude energy unrealized price and average gains or realized losses recorded fuel cost as is operating a non-GAAP revenues performance and unrealized measure gains since or such losses more recorded meaningful as fuel ex for penses investors . Mana asg it ement reflects believes the impact that the of hedge avera g contracts e realized at ener thegy time price of actual and avera generation ge realized in period fuel cost -over is- period comparisons or as compared to real-time market prices.
A either reconciliation on the slide of Non where -GAAP the information information to appears GAAP or information, on another including slide referenced the impact in this of participating presentation securities, . is included
February 28, 2011 39 EDISON INTERNATIONAL®