Exhibit 99.2
Leading the Way in Electricity SM
Second Quarter 2011 Financial Teleconference
August 4, 2011
EDISON INTERNATIONAL®
Leading the Way in Electricity SM
Forward-Looking Statements
Statements contained in this presentation about future performance, including, without limitation, earnings, asset and rate base growth, load growth, capital expenditures, and other statements that are not purely historical, are forward-looking statements. These forward-looking statements reflect our current expectations; however, such statements involve risks and uncertainties. Actual results could differ materially from current expectations. These forward-looking statements represent our expectations only as of the date of this presentation, and Edison International assumes no duty to update them to reflect new information, events or circumstances. Important factors that could cause different results are discussed under the headings “Risk Factors,” and “Management’s Discussion and Analysis” in Edison International’s 2010 Form 10-K, most recent Form 10-Q and other reports filed with the Securities and Exchange Commission, which are available on our website: www.edisoninvestor.com. These filings also provide additional information on historical and other factual data contained in this presentation.
August 4, 2011
1
EDISON INTERNATIONAL®
Leading the Way in Electricity SM
Second Quarter Earnings Summary
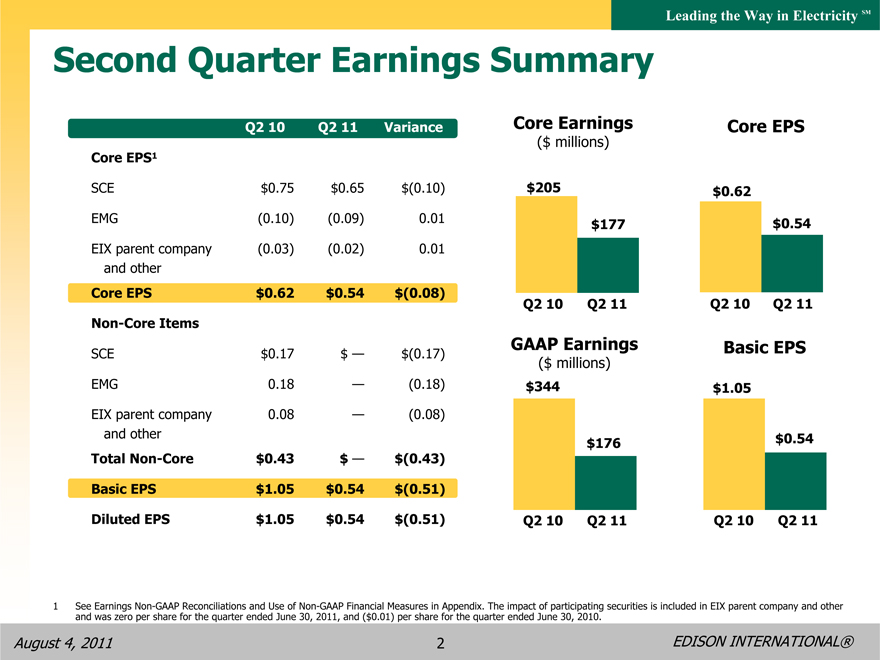
Q2 10 Q2 11 Variance
Core EPS1
SCE $0.75 $0.65 $(0.10)
EMG (0.10) (0.09) 0.01
EIX parent company (0.03) (0.02) 0.01 and other
Core EPS $0.62 $0.54 $(0.08)
Non-Core Items
SCE $0.17 $ — $(0.17)
EMG 0.18 — (0.18)
EIX parent company 0.08 — (0.08) and other
Total Non-Core $0.43 $ — $(0.43) Basic EPS $1.05 $0.54 $(0.51) Diluted EPS $1.05 $0.54 $(0.51)
Core Earnings Core EPS
($ millions)
$205 $0.62 $177 $0.54
Q2 10 Q2 11 Q2 10 Q2 11
GAAP Earnings
($ millions)
Basic EPS
$344 $1.05
$176 $0.54
Q2 10 Q2 11 Q2 10 Q2 11
1 See Earnings Non-GAAP Reconciliations and Use of Non-GAAP Financial Measures in Appendix. The impact of participating securities is included in EIX parent company and other and was zero per share for the quarter ended June 30, 2011, and ($0.01) per share for the quarter ended June 30, 2010.
August 4, 2011
EDISON INTERNATIONAL®
2
Leading the Way in Electricity SM
SCE Second Quarter Highlights
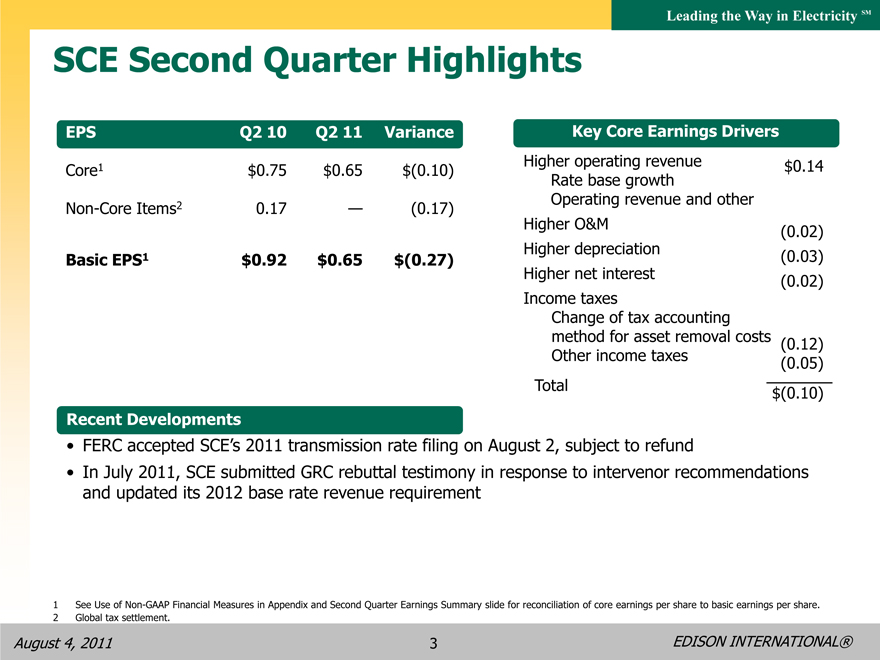
EPS Q2 10 Q2 11 Variance
Core1 $0.75 $0.65 $(0.10)
Non-Core Items2 0.17 — (0.17)
Basic EPS1 $0.92 $0.65 $(0.27)
Key Core Earnings Drivers
Higher operating revenue $0.14
Rate base growth
Operating revenue and other
Higher O&M (0.02) Higher depreciation (0.03)
Higher net interest (0.02)
Income taxes
Change of tax accounting method for asset removal costs (0.12) Other income taxes (0.05) Total $(0.10)
Recent Developments
• FERC accepted SEC’s 2011 transmission rate filling on August, subject to refund
• In July 2011, SCE submitted GRC rebuttal testimony in response to intervenor recommendations and updated its 2012 base rate revenue requirement
1 See Use of Non-GAAP Financial Measures in Appendix and Second Quarter Earnings Summary slide for reconciliation of core earnings per share to basic earnings per share.
2 Global tax settlement.
August 4, 2011
EDISON INTERNATIONAL®
3
Leading the Way in Electricity SM
EMG Second Quarter Highlights
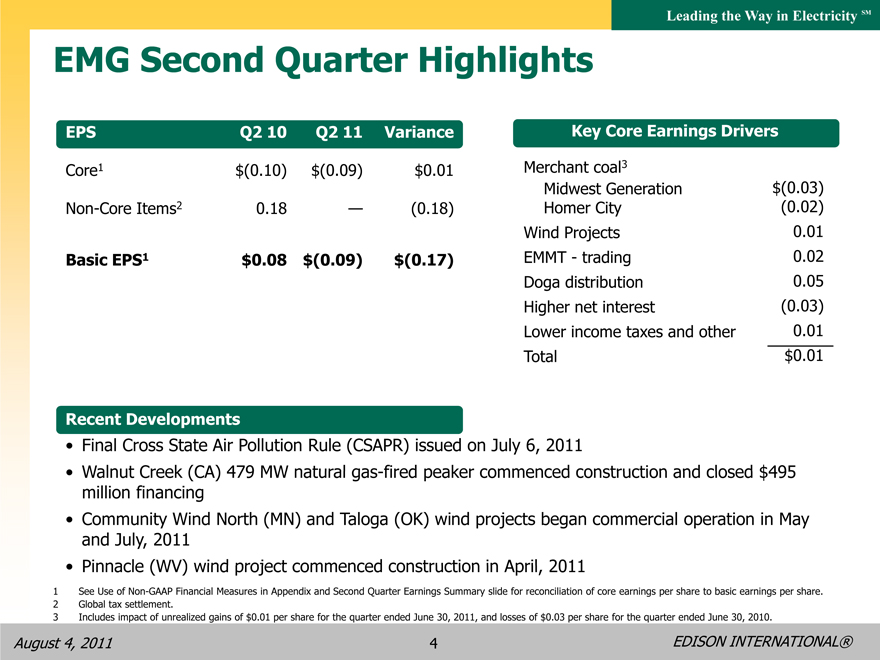
EPS Q2 10 Q2 11 Variance
Core1 $(0.10) $(0.09) $0.01
Non-Core Items2 0.18 — (0.18)
Basic EPS1 $0.08 $(0.09) $(0.17)
Key Core Earnings Drivers
Merchant coal3
Midwest Generation $(0.03)
Homer City (0.02) Wind Projects 0.01 EMMT—trading 0.02
Doga distribution 0.05 Higher net interest (0.03) Lower income taxes and other 0.01 Total $0.01
Recent Developments
• Final Cross State Air Pollution Rule (CSAPR) issued on July 6, 2011
• Walnut Creek (CA) 479 MW natural gas-fired peaker commenced construction and closed $495 million financing
• Community Wind North (MN) and Taloga (OK) wind projects began commercial operation in May and July, 2011
• Pinnacle (WV) wind project commenced construction in April, 2011
1 See Use of Non-GAAP Financial Measures in Appendix and Second Quarter Earnings Summary slide for reconciliation of core earnings per share to basic earnings per share.
2 Global tax settlement.
3 Includes impact of unrealized gains of $0.01 per share for the quarter ended June 30, 2011, and losses of $0.03 per share for the quarter ended June 30, 2010.
August 4, 2011
EDISON INTERNATIONAL®
4
Leading the Way in Electricity SM
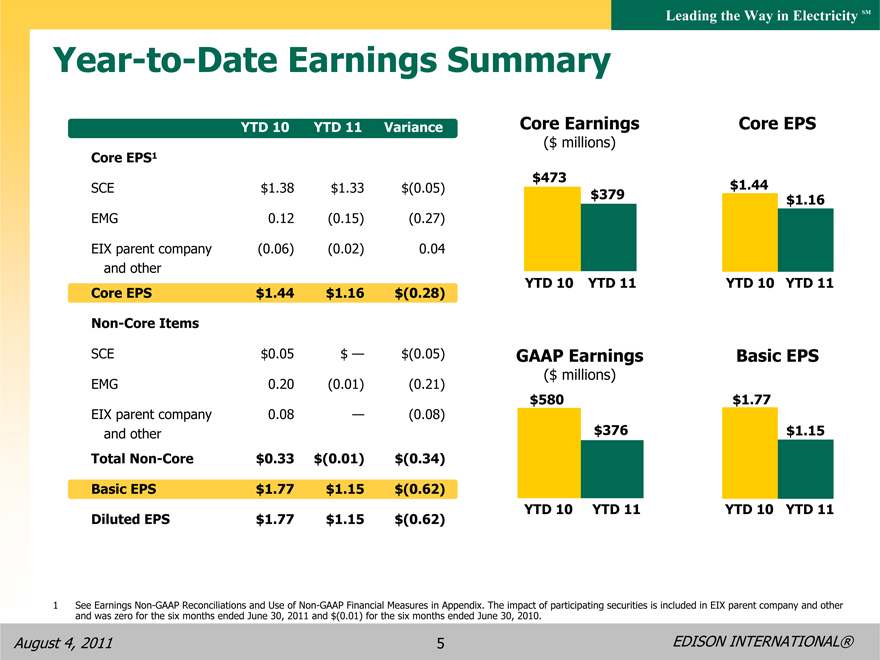
Year-to-Date Earnings Summary
YTD 10 YTD 11 Variance
Core EPS1
SCE $1.38 $1.33 $(0.05)
EMG 0.12 (0.15) (0.27)
EIX parent company (0.06) (0.02) 0.04 and other
Core EPS $1.44 $1.16 $(0.28)
Non-Core Items
SCE $0.05 $ — $(0.05)
EMG 0.20 (0.01) (0.21)
EIX parent company 0.08 — (0.08) and other
Total Non-Core $0.33 $(0.01) $(0.34) Basic EPS $1.77 $1.15 $(0.62) Diluted EPS $1.77 $1.15 $(0.62)
Core Earnings
($ millions)
Core EPS
$473
$1.44 $379 $1.16
YTD 10 YTD 11 YTD 10 YTD 11
GAAP Earnings
($ millions)
Basic EPS
$580 $1.77
$376 $1.15
YTD 10 YTD 11 YTD 10 YTD 11
1 See Earnings Non-GAAP Reconciliations and Use of Non-GAAP Financial Measures in Appendix. The impact of participating securities is included in EIX parent company and other and was zero for the six months ended June 30, 2011 and $(0.01) for the six months ended June 30, 2010.
August 4, 2011
EDISON INTERNATIONAL®
5
Leading the Way in Electricity SM
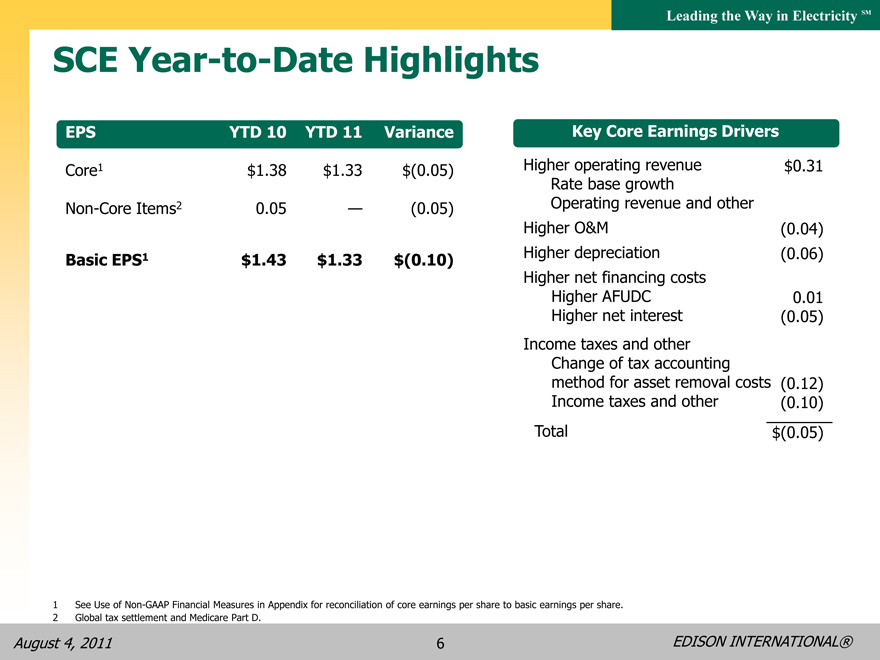
SCE Year-to-Date Highlights
EPS YTD 10 YTD 11 Variance
Core1 $1.38 $1.33 $(0.05)
Non-Core Items2 0.05 — (0.05)
Basic EPS1 $1.43 $1.33 $(0.10)
Key Core Earnings Drivers
Higher operating revenue $0.31
Rate base growth
Operating revenue and other
Higher O&M (0.04) Higher depreciation (0.06) Higher net financing costs Higher AFUDC 0.01 Higher net interest (0.05) Income taxes and other Change of tax accounting method for asset removal costs (0.12) Income taxes and other (0.10) Total $(0.05)
1 See Use of Non-GAAP Financial Measures in Appendix for reconciliation of core earnings per share to basic earnings per share.
2 Global tax settlement and Medicare Part D.
August 4, 2011
6
EDISON INTERNATIONAL®
Leading the Way in Electricity SM
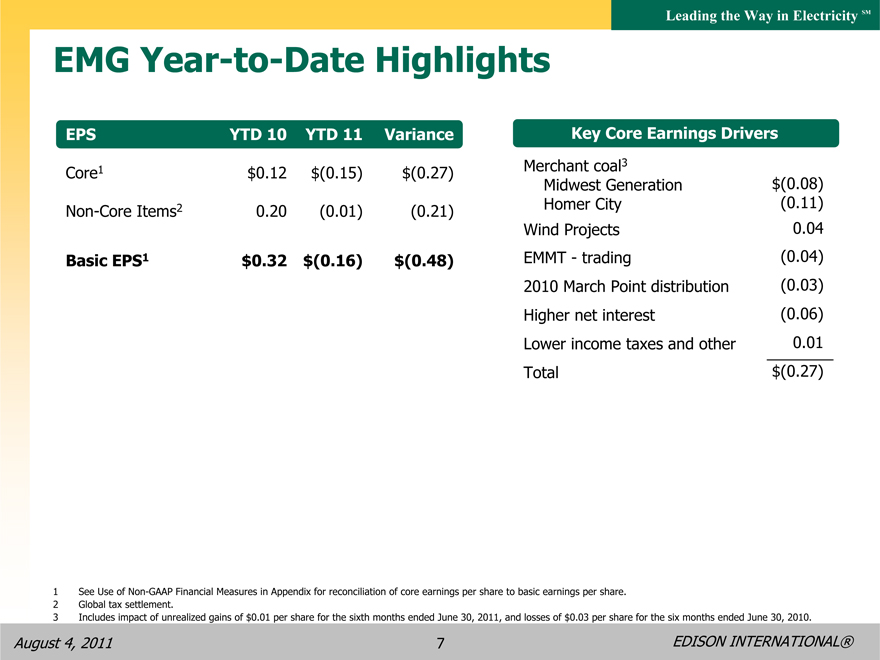
EMG Year-to-Date Highlights
EPS YTD 10 YTD 11 Variance
Core1 $0.12 $(0.15) $(0.27)
Non-Core Items2 0.20 (0.01) (0.21)
Basic EPS1 $0.32 $(0.16) $(0.48)
Key Core Earnings Drivers
Merchant coal3
Midwest Generation $(0.08) Homer City (0.11) Wind Projects 0.04 EMMT—trading (0.04)
2010 March Point distribution (0.03)
Higher net interest (0.06) Lower income taxes and other 0.01 Total $(0.27)
1 See Use of Non-GAAP Financial Measures in Appendix for reconciliation of core earnings per share to basic earnings per share.
2 Global tax settlement.
3 Includes impact of unrealized gains of $0.01 per share for the sixth months ended June 30, 2011, and losses of $0.03 per share for the six months ended June 30, 2010.
August 4, 2011
EDISON INTERNATIONAL®
7
Leading the Way in Electricity SM
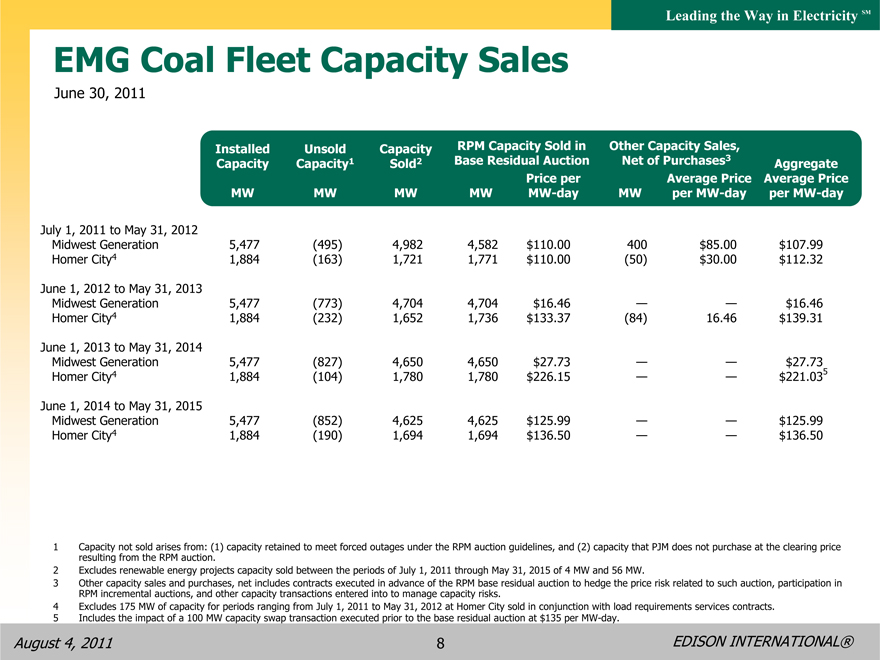
EMG Coal Fleet Capacity Sales
June 30, 2011
Installed Unsold Capacity RPM Capacity Sold in Other Capacity Sales,
Capacity Capacity1 Sold2 Base Residual Auction Net of Purchases3 Aggregate
Price per Average Price Average Price
MW MW MW MW MW-day MW per MW-day per MW-day
July 1, 2011 to May 31, 2012
Midwest Generation 5,477 (495) 4,982 4,582 $110.00 400 $85.00 $107.99
Homer City4 1,884 (163) 1,721 1,771 $110.00 (50) $30.00 $112.32
June 1, 2012 to May 31, 2013
Midwest Generation 5,477 (773) 4,704 4,704 $16.46 — — $16.46
Homer City4 1,884 (232) 1,652 1,736 $133.37 (84) 16.46 $139.31
June 1, 2013 to May 31, 2014
Midwest Generation 5,477 (827) 4,650 4,650 $27.73 — — $27.73
Homer City4 1,884 (104) 1,780 1,780 $226.15 — — $221.035
June 1, 2014 to May 31, 2015
Midwest Generation 5,477 (852) 4,625 4,625 $125.99 — — $125.99
Homer City4 1,884 (190) 1,694 1,694 $136.50 — — $136.50
1 Capacity not sold arises from: (1) capacity retained to meet forced outages under the RPM auction guidelines, and (2) capacity that PJM does not purchase at the clearing price resulting from the RPM auction.
2 Excludes renewable energy projects capacity sold between the periods of July 1, 2011 through May 31, 2015 of 4 MW and 56 MW.
3 Other capacity sales and purchases, net includes contracts executed in advance of the RPM base residual auction to hedge the price risk related to such auction, participation in RPM incremental auctions, and other capacity transactions entered into to manage capacity risks.
4 Excludes 175 MW of capacity for periods ranging from July 1, 2011 to May 31, 2012 at Homer City sold in conjunction with load requirements services contracts.
5 Includes the impact of a 100 MW capacity swap transaction executed prior to the base residual auction at $135 per MW-day.
August 4, 2011
EDISON INTERNATIONAL®
8
Leading the Way in Electricity SM
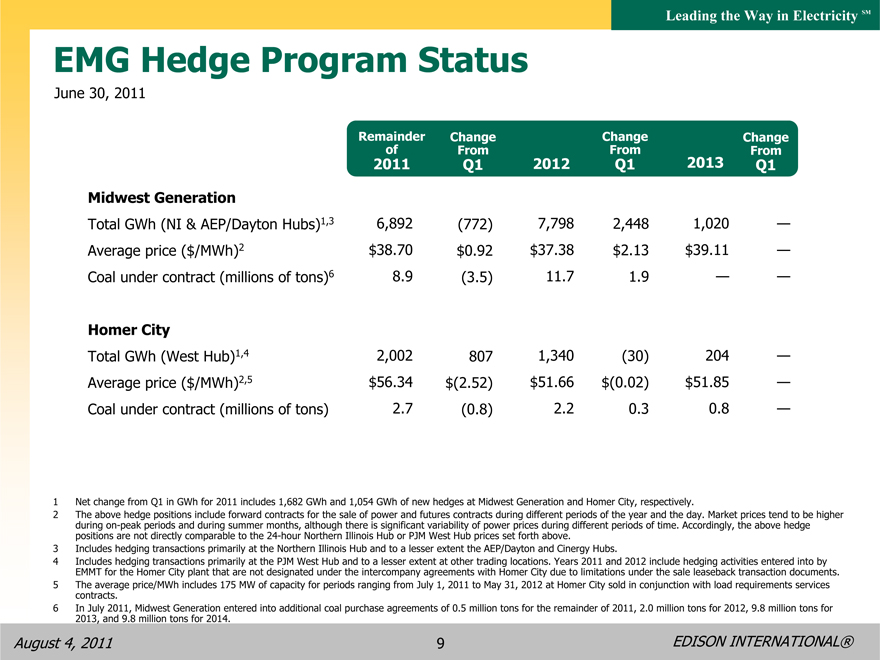
EMG Hedge Program Status
June 30, 2011
Remainder
Change
Change
Change of From From From
2011
Q1
2012
Q1
2013
Q1
Midwest Generation
Total GWh (NI & AEP/Dayton Hubs)1,3
6,892
(772)
7,798
2,448
1,020
—
Average price ($/MWh)2
$38.70
$0.92
$37.38
$2.13
$39.11
—
Coal under contract (millions of tons)6
8.9
(3.5)
11.7
1.9
—
—
Homer City
Total GWh (West Hub)1,4
2,002
807
1,340
(30)
204
—
Average price ($/MWh)2,5
$56.34
$(2.52)
$51.66
$(0.02)
$51.85
—
Coal under contract (millions of tons)
2.7
(0.8)
2.2
0.3
0.8
—
1 Net change from Q1 in GWh for 2011 includes 1,682 GWh and 1,054 GWh of new hedges at Midwest Generation and Homer City, respectively.
2 The above hedge positions include forward contracts for the sale of power and futures contracts during different periods of the year and the day. Market prices tend to be higher during on-peak periods and during summer months, although there is significant variability of power prices during different periods of time. Accordingly, the above hedge positions are not directly comparable to the 24-hour Northern Illinois Hub or PJM West Hub prices set forth above.
3 Includes hedging transactions primarily at the Northern Illinois Hub and to a lesser extent the AEP/Dayton and Cinergy Hubs.
4 Includes hedging transactions primarily at the PJM West Hub and to a lesser extent at other trading locations. Years 2011 and 2012 include hedging activities entered into by EMMT for the Homer City plant that are not designated under the intercompany agreements with Homer City due to limitations under the sale leaseback transaction documents.
5 The average price/MWh includes 175 MW of capacity for periods ranging from July 1, 2011 to May 31, 2012 at Homer City sold in conjunction with load requirements services contracts.
6 In July 2011, Midwest Generation entered into additional coal purchase agreements of 0.5 million tons for the remainder of 2011, 2.0 million tons for 2012, 9.8 million tons for 2013, and 9.8 million tons for 2014.
August 4, 2011
EDISON INTERNATIONAL®
9
Leading the Way in Electricity SM
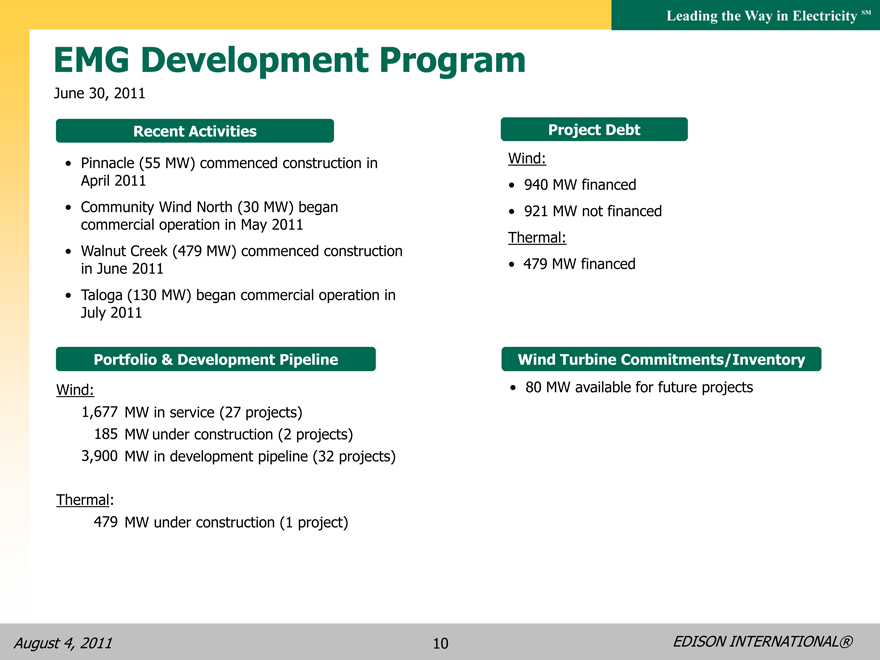
EMG Development Program
June 30, 2011
Recent Activities
• Pinnacle (55 MW) commenced construction in April 2011
• Community Wind North (30 MW) began commercial operation in May 2011
• Walnut Creek (479 MW) commenced construction in June 2011
• Taloga (130 MW) began commercial operation in July 2011
Portfolio & Development Pipeline
Wind:
1,677 MW in service (27 projects) 185 MW under construction (2 projects) 3,900 MW in development pipeline (32 projects)
Thermal:
479 MW under construction (1 project)
Project Debt
Wind:
• 940 MW financed
• 921 MW not financed Thermal:
• 479 MW financed
Wind Turbine Commitments/Inventory
• 80 MW available for future projects
August 4, 2011
EDISON INTERNATIONAL®
10
Leading the Way in
Electricity SM
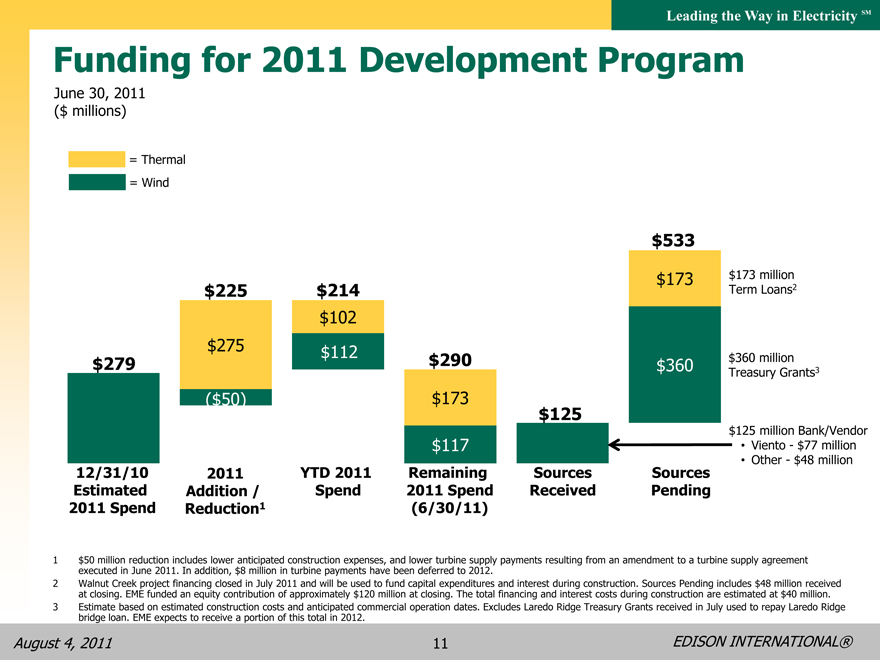
Funding for 2011 Development Program
June 30, 2011
($ millions)
= Thermal
= Wind
$279
$225
$275
($50)
$214 $102 $112
$290 $173
$117
$125
$533
$173
$360
$173 million
Term Loans2
$360 million Treasury Grants3
$125 million Bank/Vendor
• Viento—$77 million
• Other—$48 million
12/31/10 Estimated 2011 Spend
2011 Spending Addition / Reduction1
YTD 2011 Spend
Remaining 2011 Spend (6/30/11)
Sources Received
Sources Pending
1 $50 million reduction includes lower anticipated construction expenses, and lower turbine supply payments resulting from an amendment to a turbine supply agreement executed in June 2011. In addition, $8 million in turbine payments have been deferred to 2012.
2 $495 million Walnut Creek financing closed in July 2011. Sources Pending include $48 million received at closing. Term Loan amounts will be used to fund Walnut Creek development costs of $257 million in 2012 and $43 million in 2013.
3 Estimate based on estimated construction costs and anticipated commercial operation dates. Excludes Laredo Ridge Treasury Grants received in July used to repay Laredo Ridge bridge loan. EME expects to receive a portion of this total in 2012.
August 4, 2011
11
EDISON INTERNATIONAL®
Leading the Way in Electricity SM
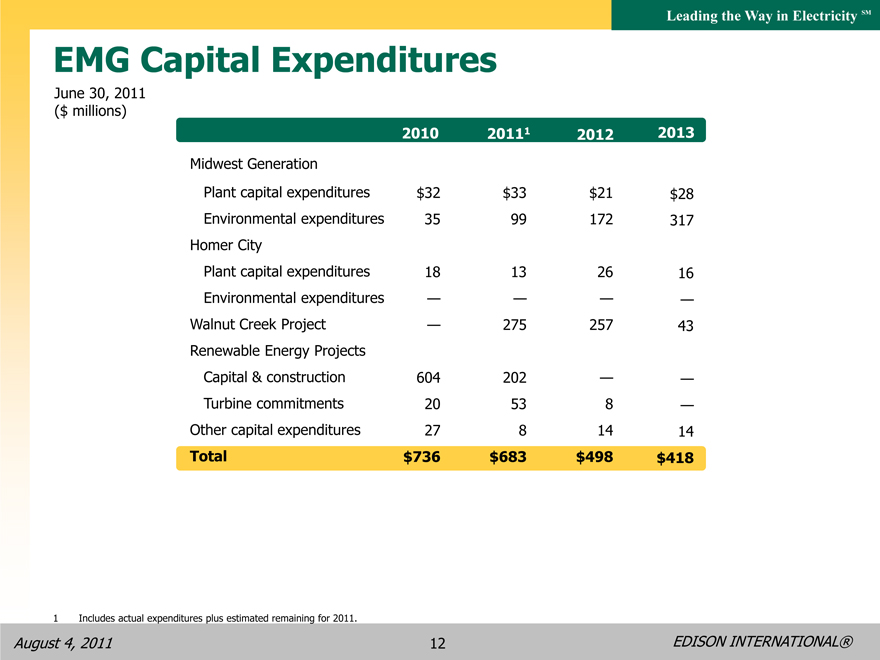
EMG Capital Expenditures
June 30, 2011
($ millions)
2010 20111 2012 2013
Midwest Generation
Plant capital expenditures $32 $33 $21 $28
Environmental expenditures 35 99 172 317
Homer City
Plant capital expenditures 18 13 26 16
Environmental expenditures — — — —
Walnut Creek Project — 275 257 43
Renewable Energy Projects
Capital & construction 604 202 — —
Turbine commitments 20 53 8 —
Other capital expenditures 27 8 14 14
Total $736 $683 $498 $418
1 Includes actual expenditures plus estimated remaining for 2011.
August 4, 2011
12
EDISON INTERNATIONAL®
Leading the Way in Electricity SM
Maximizing EMG Option Value
• Finalize durable solution for coal fleet environmental challenges
??Midwest Generation: Activated Carbon (Mercury), Selective Non-Catalytic Reduction (NOx), Dry Sorbent Injection & particulate removal upgrades (SO2, Acid Gases)
??Homer City: under discussion with Owner-Lessors
• Address upcoming maturities
??Credit Facilities: 2012
??Unsecured Notes: 2013
• Continue generation portfolio diversification
??Seeking external capital for wind business
??Constructing 479 MW Walnut Creek “peaking” project
• Need recovery of energy and capacity prices
??2014 – 15 RPM auction results demonstrated improving RTO price trend
August 4, 2011
EDISON INTERNATIONAL®
13
Leading the Way in Electricity SM
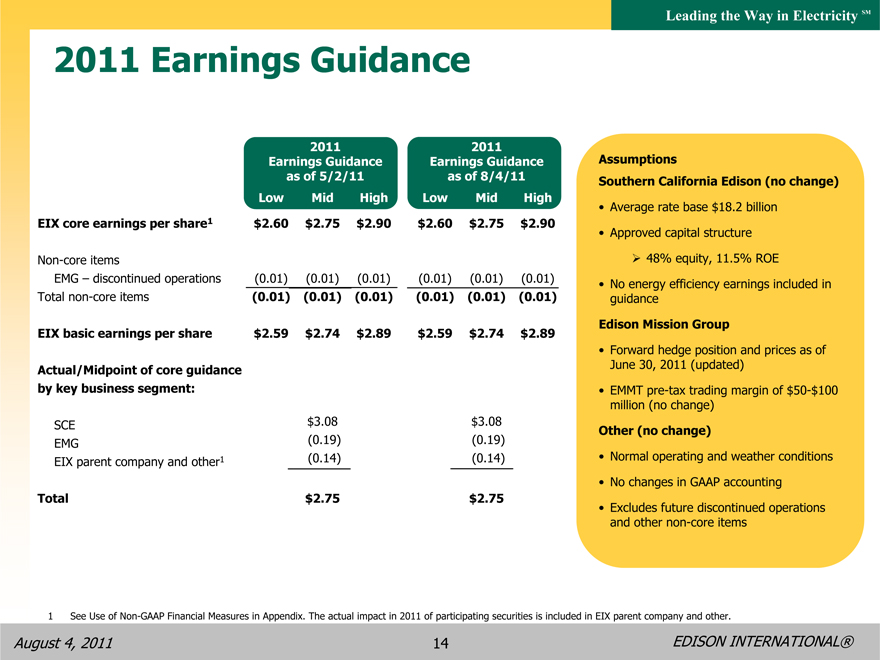
2011 Earnings Guidance
2011 2011
Earnings Guidance Earnings Guidance
as of 5/2/11 as of 8/4/11
Low Mid High Low Mid High
EIX core earnings per share1 $2.60 $2.75 $2.90 $2.60 $2.75 $2.90
Non-core items
EMG – discontinued operations (0.01) (0.01) (0.01) (0.01) (0.01) (0.01)
Total non-core items (0.01) (0.01) (0.01) (0.01) (0.01) (0.01)
EIX basic earnings per share $2.59 $2.74 $2.89 $2.59 $2.74 $2.89
Actual/Midpoint of core guidance
by key business segment:
SCE $3.08 $3.08
EMG (0.19) (0.19)
EIX parent company and other1 (0.14) (0.14)
Total $2.75 $2.75
Assumptions
Southern California Edison (no change)
• Average rate base $18.2 billion
• Approved capital structure
?48% equity, 11.5% ROE
• No energy efficiency earnings included in guidance
Edison Mission Group
• Forward hedge position and prices as of June 30, 2011 (updated)
• EMMT pre-tax trading margin of $50-$100 million (no change)
Other (no change)
• Normal operating and weather conditions
• No changes in GAAP accounting
• Excludes future discontinued operations and other non-core items
1 See Use of Non-GAAP Financial Measures in Appendix. The actual impact in 2011 of participating securities is included in EIX parent company and other.
August 4, 2011
EDISON INTERNATIONAL®
14
Leading the Way in Electricity SM
Appendix
August 4, 2011
EDISON INTERNATIONAL®
15
Leading the Way in Electricity SM
Updates Since Our Last Presentation
• Q2 11 results and standard information
• EMG Coal Fleet Capacity Sales (p. 8)
• EMG Hedge Program Status (p. 9)
• EMG Development Program (p. 10)
• Funding for 2011 Development Program (p. 11)
• EMG Capital Expenditures (p. 12)
• SCE 2012 CPUC General Rate Case (p. 26)
• SCE Cost of Capital Mechanism (p. 27)
• SCE Transmission Program (p. 28)
• SCE Key Regulatory Events (p. 29)
• EMG 2006 Illinois CPS Agreement (p. 36)
August 4, 2011
EDISON INTERNATIONAL®
16
Leading the Way in Electricity SM
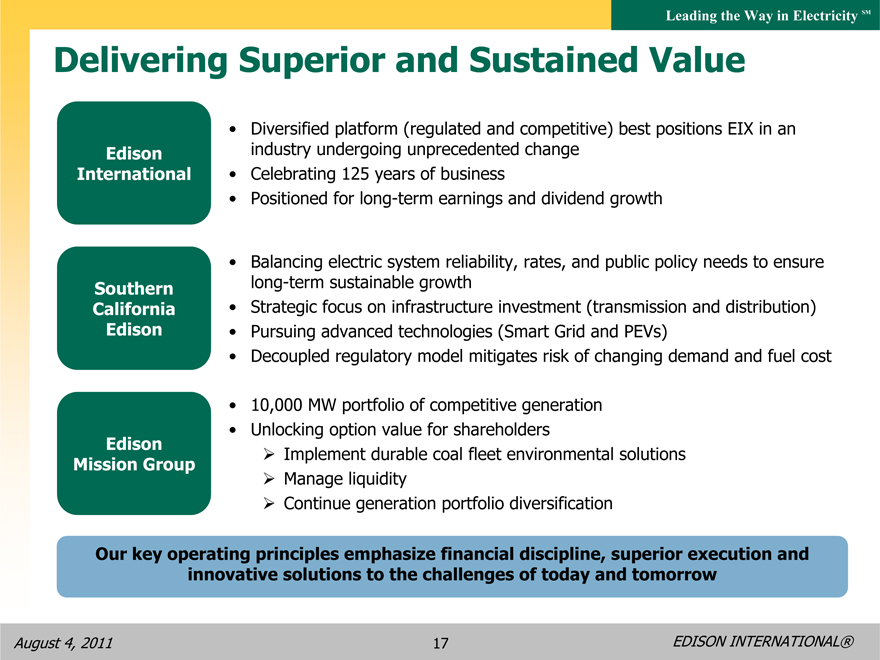
Delivering Superior and Sustained Value
Edison International
• Diversified platform (regulated and competitive) best positions EIX in an industry undergoing unprecedented change
• Celebrating 125 years of business
• Positioned for long-term earnings and dividend growth
Southern California Edison
• Balancing electric system reliability, rates, and public policy needs to ensure long-term sustainable growth
• Strategic focus on infrastructure investment (transmission and distribution)
• Pursuing advanced technologies (Smart Grid and PEVs)
• Decoupled regulatory model mitigates risk of changing demand and fuel cost
Edison Mission Group
• 10,000 MW portfolio of competitive generation
• Unlocking option value for shareholders
??Implement durable coal fleet environmental solutions
??Manage liquidity
??Continue generation portfolio diversification
Our key operating principles emphasize financial discipline, superior execution and innovative solutions to the challenges of today and tomorrow
August 4, 2011
EDISON INTERNATIONAL®
17
Leading the Way in Electricity SM
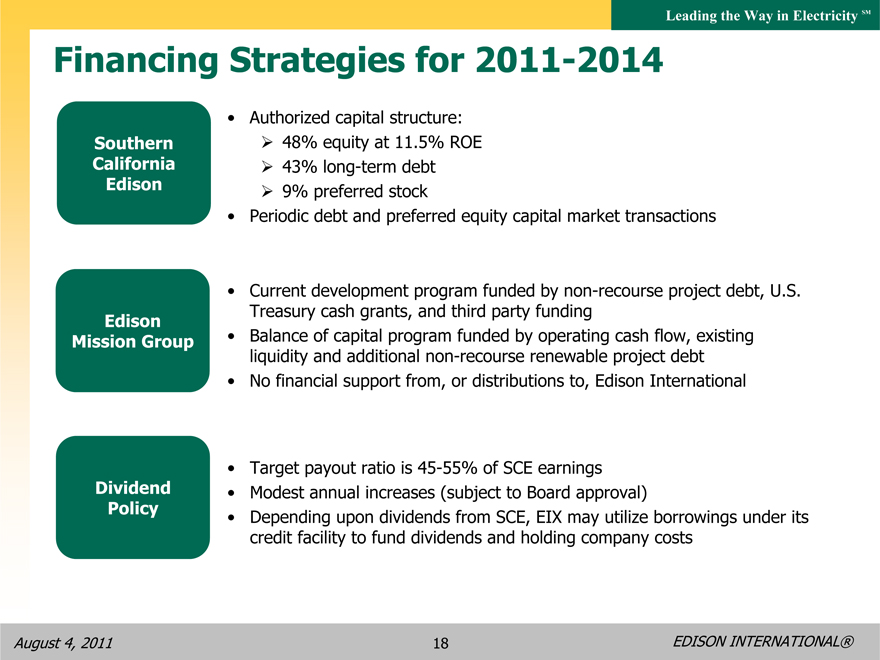
Financing Strategies for 2011-2014
Southern California Edison
• Authorized capital structure:
??48% equity at 11.5% ROE
??43% long-term debt
??9% preferred stock
• Periodic debt and preferred equity capital market transactions
Edison Mission Group
• Current development program funded by non-recourse project debt, U.S. Treasury cash grants, and third party funding
• Balance of capital program funded by operating cash flow, existing liquidity and additional non-recourse renewable project debt
• No financial support from, or distributions to, Edison International
Dividend Policy
• Target payout ratio is 45-55% of SCE earnings
• Modest annual increases (subject to Board approval)
• Depending upon dividends from SCE, EIX may utilize borrowings under its credit facility to fund dividends and holding company costs
August 4, 2011
EDISON INTERNATIONAL®
18
Leading the Way in Electricity SM
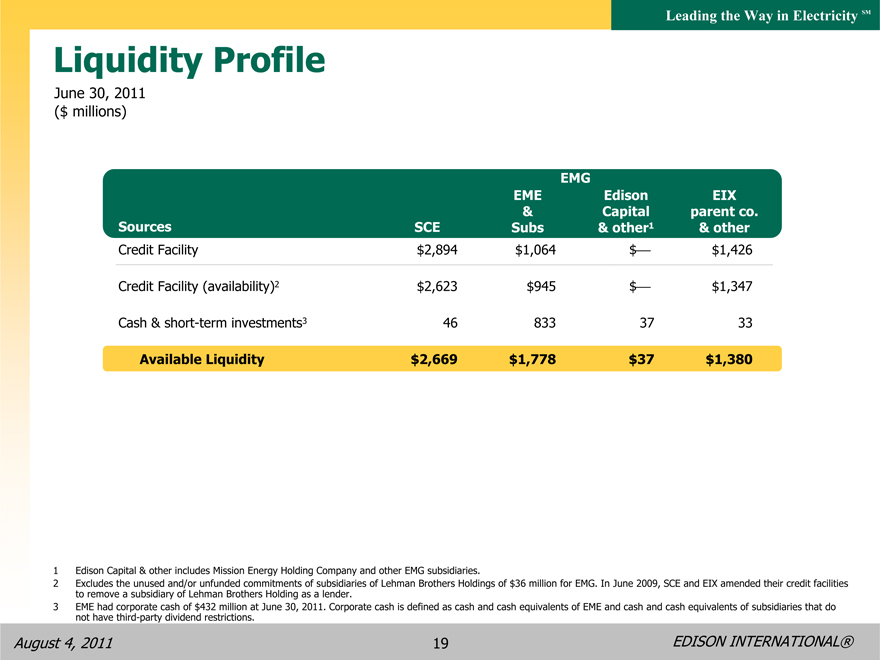
Liquidity Profile
June 30, 2011
($ millions)
EMG
EME Edison EIX
& Capital parent co.
Sources SCE Subs & other1 & other
Credit Facility $2,894 $1,064 $? $1,426
Credit Facility (availability)2 $2,623 $945 $? $1,347
Cash & short-term investments3 46 833 37 33
Available Liquidity $2,669 $1,778 $37 $1,380
1 Edison Capital & other includes Mission Energy Holding Company and other EMG subsidiaries.
2 Excludes the unused and/or unfunded commitments of subsidiaries of Lehman Brothers Holdings of $36 million for EMG. In June 2009, SCE and EIX amended their credit facilities to remove a subsidiary of Lehman Brothers Holding as a lender.
3 EME had corporate cash of $432 million at June 30, 2011. Corporate cash is defined as cash and cash equivalents of EME and cash and cash equivalents of subsidiaries that do not have third-party dividend restrictions.
August 4, 2011
EDISON INTERNATIONAL®
19
Leading the Way in Electricity SM
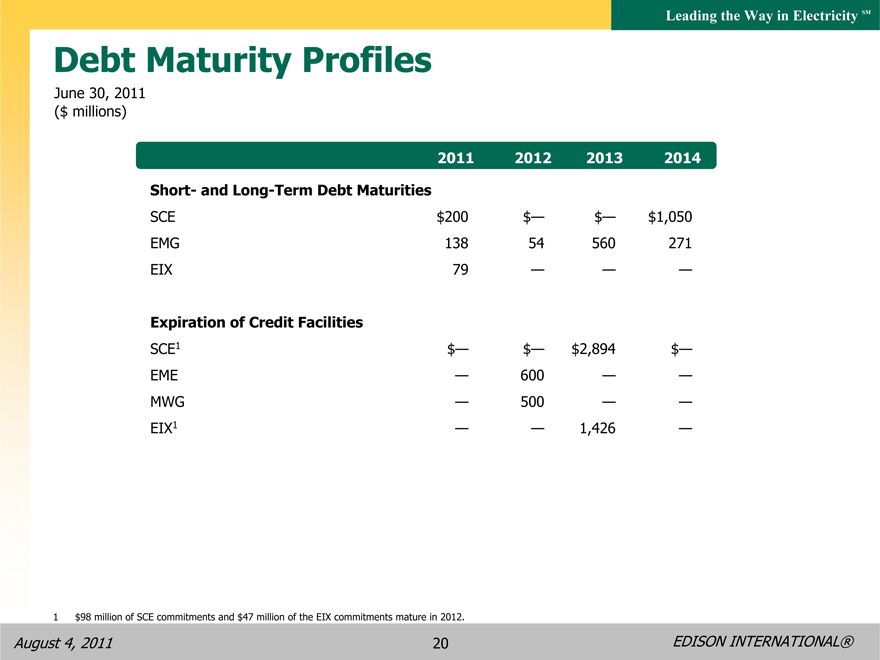
Debt Maturity Profiles
June 30, 2011
($ millions)
2011 2012 2013 2014
Short- and Long-Term Debt Maturities
SCE $200 $— $— $1,050
EMG 138 54 560 271
EIX 79 — — —
Expiration of Credit Facilities
SCE1 $— $— $2,894 $—
EME — 600 — —
MWG — 500 — —
EIX1 — — 1,426 —
1 $98 million of SCE commitments and $47 million of the EIX commitments mature in 2012.
August 4, 2011
EDISON INTERNATIONAL®
20
Leading the Way in Electricity SM
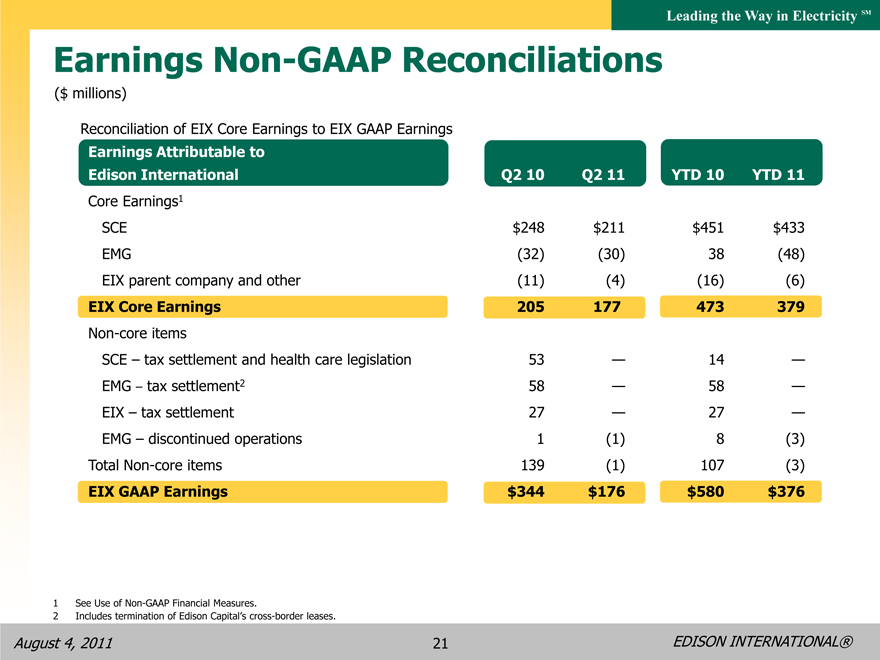
Earnings Non-GAAP Reconciliations
($ millions)
Reconciliation of EIX Core Earnings to EIX GAAP Earnings
Earnings Attributable to Edison International
Core Earnings1 SCE
EMG
EIX parent company and other
EIX Core Earnings
Non-core items
SCE – tax settlement and health care legislation EMG – tax settlement2 EIX – tax settlement EMG – discontinued operations Total Non-core items
EIX GAAP Earnings
Q2 10 Q2 11
YTD 10 YTD 11
$248 $211 $451 $433 (32) (30) 38 (48) (11) (4) (16) (6)
205 177 473 379
53 — 14 —
58 — 58 —
27 — 27 —
1 (1) 8 (3) 139 (1) 107 (3) $344 $176 $580 $376
1 See Use of Non-GAAP Financial Measures.
2 Includes termination of Edison Capital’s cross-border leases.
August 4, 2011
EDISON INTERNATIONAL®
21
Leading the Way in Electricity SM
Our Shareholder Value Proposition
• Dual platform operating across the full spectrum of the electricity industry
• Southern California Edison
Among the best domestic electric utility growth platforms
Supportive regulatory framework
Leadership in renewable energy, energy efficiency, electric vehicles and Smart Grid development
• Edison Mission Group
See real equity value in the portfolio
Working coal fleet environmental compliance issues
Current wind construction program is self-funding
• Commitment to long-term shareholder value creation
• Incentive compensation and stock ownership guidelines consistent with shareholder interests
• Edison people committed to safety, customer service, and operational excellence
August 4, 2011
EDISON INTERNATIONAL®
22
Leading the Way in Electricity SM
SCE Appendix
August 4, 2011
EDISON INTERNATIONAL®
23
Leading the Way in Electricity SM
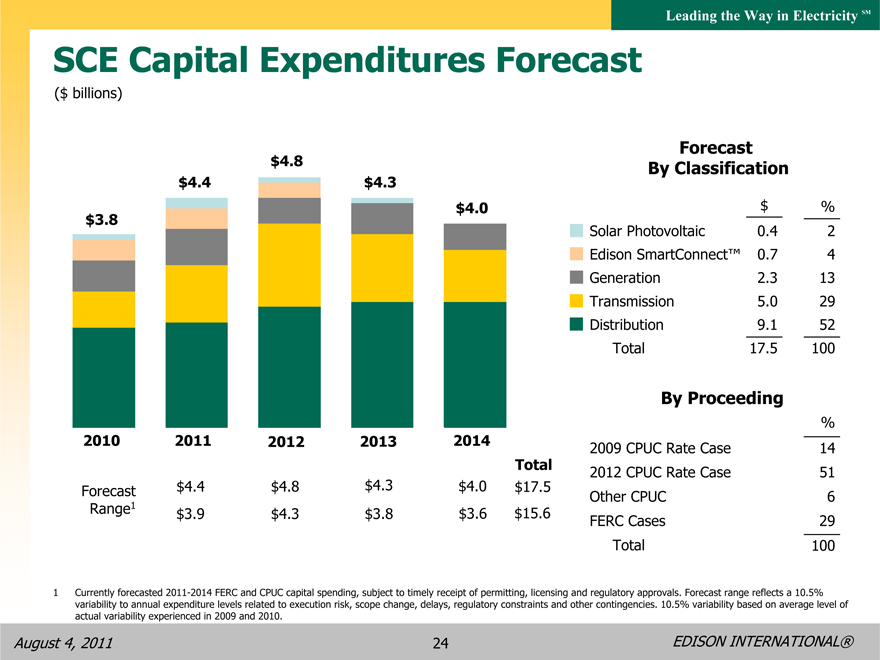
SCE Capital Expenditures Forecast
($ billions)
$4.8
$4.4 $4.3
$4.0
$3.8
2010 2011 2012 2013 2014
Forecast $4.4 $4.8 $4.3 $4.0
Range1 $3.9 $4.3 $3.8 $3.6
Forecast By Classification
$ %
Solar Photovoltaic 0.4 2
Edison SmartConnect™ 0.7 4
Generation 2.3 13
Transmission 5.0 29
Distribution 9.1 52
Total 17.5 100
By Proceeding
% 2009 CPUC Rate Case 14
Total $17.5 2012 CPUC Rate Case 51 Other CPUC 6 $15.6 FERC Cases 29 Total 100
1 Currently forecasted 2011-2014 FERC and CPUC capital spending, subject to timely receipt of permitting, licensing and regulatory approvals. Forecast range reflects a 10.5% variability to annual expenditure levels related to execution risk, scope change, delays, regulatory constraints and other contingencies. 10.5% variability based on average level of actual variability experienced in 2009 and 2010.
August 4, 2011
EDISON INTERNATIONAL®
24
Leading the Way in Electricity SM
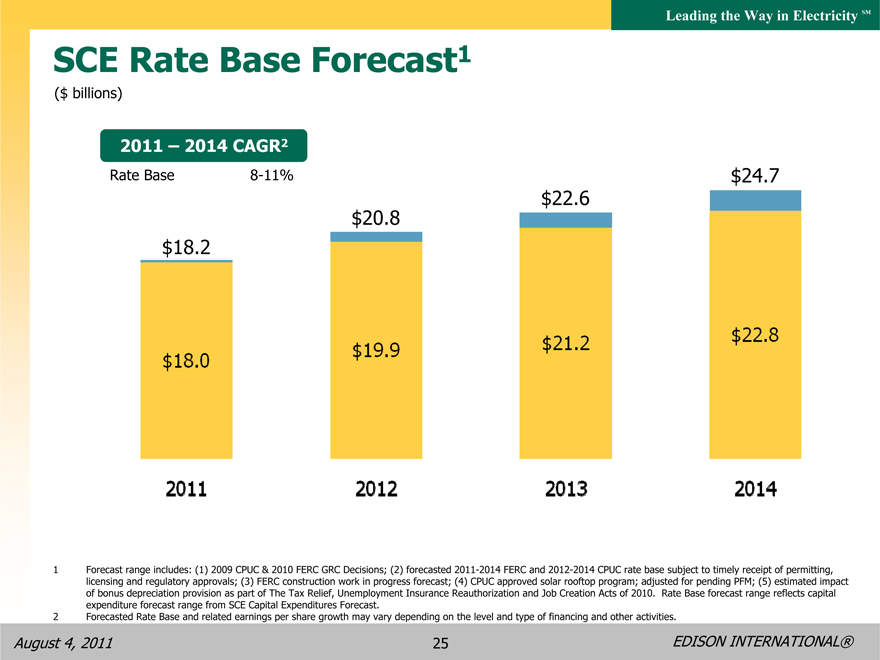
SCE Rate Base Forecast1
($ billions)
2011 – 2014 CAGR2
Rate Base 8-11%
$20.8
$18.2
$19.9
$18.0
2011 2012
$24.7
$22.6
$21.2 $22.8
2013 2014
1 Forecast range includes: (1) 2009 CPUC & 2010 FERC GRC Decisions; (2) forecasted 2011-2014 FERC and 2012-2014 CPUC rate base subject to timely receipt of permitting, licensing and regulatory approvals; (3) FERC construction work in progress forecast; (4) CPUC approved solar rooftop program; adjusted for pending PFM; (5) estimated impact of bonus depreciation provision as part of The Tax Relief, Unemployment Insurance Reauthorization and Job Creation Acts of 2010. Rate Base forecast range reflects capital expenditure forecast range from SCE Capital Expenditures Forecast.
2 Forecasted Rate Base and related earnings per share growth may vary depending on the level and type of financing and other activities.
4, 2011 25 EDISON INTERNATIONAL®
August 4, 2011
EDISON INTERNATIONAL®
25
Leading the Way in Electricity SM
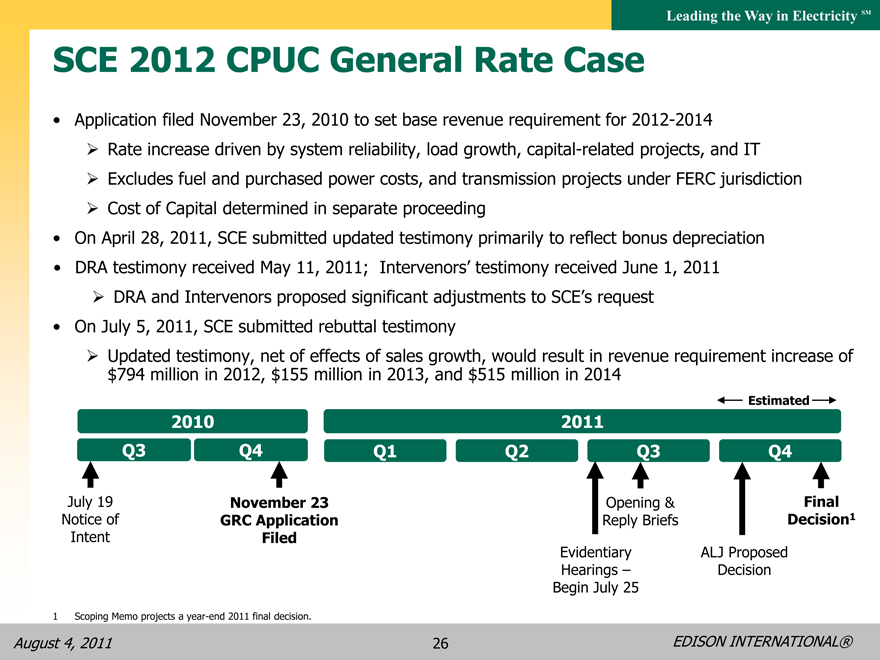
SCE 2012 CPUC General Rate Case
• Application filed November 23, 2010 to set base revenue requirement for 2012-2014
Rate increase driven by system reliability, load growth, capital-related projects, and IT
Excludes fuel and purchased power costs, and transmission projects under FERC jurisdiction
Cost of Capital determined in separate proceeding
• On April 28, 2011, SCE submitted updated testimony primarily to reflect bonus depreciation
• DRA testimony received May 11, 2011; Intervenors’ testimony received June 1, 2011
DRA and Intervenors proposed significant adjustments to SCE’s request
• On July 5, 2011, SCE submitted rebuttal testimony
Updated testimony, net of effects of sales growth, would result in revenue requirement increase of $794 million in 2012, $155 million in 2013, and $515 million in 2014
Estimated
2010 2011
Q3 Q4 Q1 Q2 Q3 Q4
July 19 Notice of Intent
November 23 GRC Application Filed
Opening & Reply Briefs
Final Decision1
Evidentiary Hearings –Begin July 25
ALJ Proposed Decision
1 Scoping Memo projects a year-end 2011 final decision.
August 4, 2011
EDISON INTERNATIONAL®
26
Leading the Way in Electricity SM
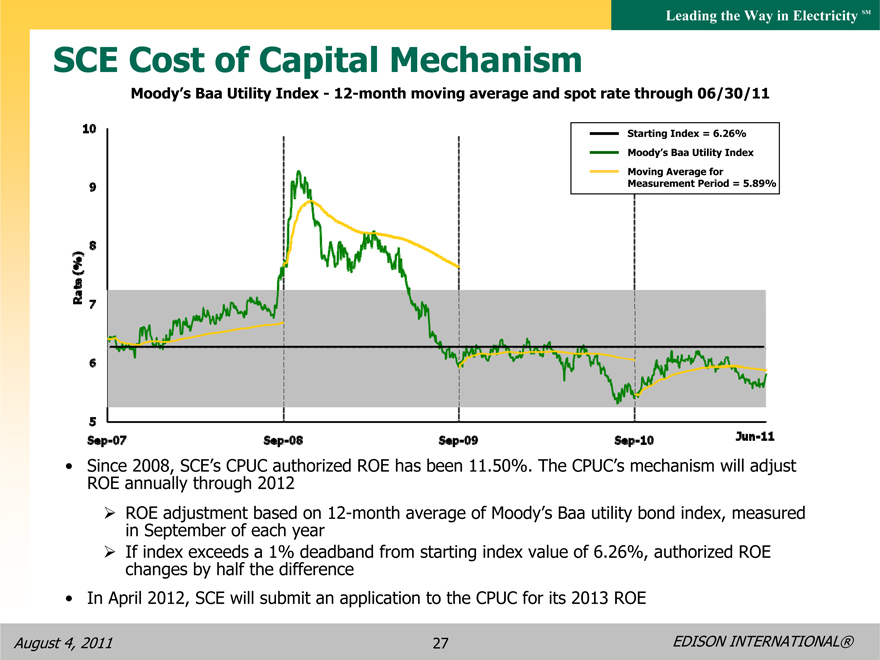
SCE Cost of Capital Mechanism
Moody’s Baa Utility Index—12-month moving average and spot rate through 06/30/11
Starting Index = 6.26% Moody’s Baa Utility Index Moving Average for Measurement Period = 5.89%
Sep-07 Sep-08 Sep-09 Sep-10 Jun-11
10 9 8 7 6 5
Rate (%)
• ROE Since annually 2008, SC through E’s CPUC 2012 authorized ROE has been 11.50%. The CPUC’s mechanism will adjust
ROE September adjustment of each based year on 12-month average of Moody’s Baa utility bond index, measured in by If index half the exceeds difference a 1% deadband from starting index value of 6.26%, authorized ROE changes
• In April 2012, SCE will submit an application to the CPUC for its 2013 ROE
August 4, 2011
EDISON INTERNATIONAL®
27
Leading the Way in Electricity SM
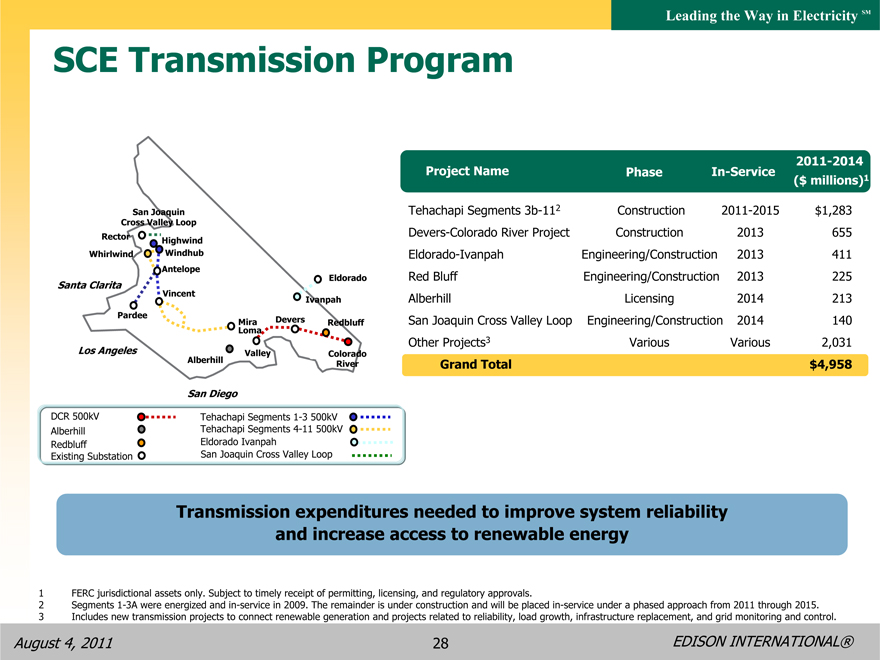
SCE Transmission Program
2011-2014
Project Name Phase In-Service ($ millions)1
Tehachapi Segments 3b-112 Construction 2011-2015 $1,283
Devers-Colorado River Project Construction 2013 655
Eldorado-Ivanpah Engineering/Construction 2013 411
Red Bluff Engineering/Construction 2013 225
Alberhill Licensing 2014 213
San Joaquin Cross Valley Loop Engineering/Construction 2014 140
Other Projects3 Various Various 2,031
Grand Total $4,958
San Joaquin Cross Valley Loop
Rector SCE Highwind Service Whirlwind WindhubTerritory
Antelope Eldorado
Santa Clarita Palmdale
Vincent
Ivanpah Pardee Devers MiraLoma Redbluff Los Angeles SantaAna Valley PalmSprings Colorado Alberhill River
San Diego
DCR 500kV Tehachapi Segments 1-3 500kV Alberhill Tehachapi Segments 4-11 500kV Redbluff Eldorado Ivanpah Existing Substation San Joaquin Cross Valley Loop
Transmission expenditures needed to improve system reliability and increase access to renewable energy
1 FERC jurisdictional assets only. Subject to timely receipt of permitting, licensing, and regulatory approvals.
2 Segments 1-3A were energized and in-service in 2009. The remainder is under construction and will be placed in-service under a phased approach from 2011 through 2015.
3 Includes new transmission projects to connect renewable generation and projects related to reliability, load growth, infrastructure replacement, and grid monitoring and control.
August 4, 2011
EDISON INTERNATIONAL®
28
Leading the Way in Electricity SM
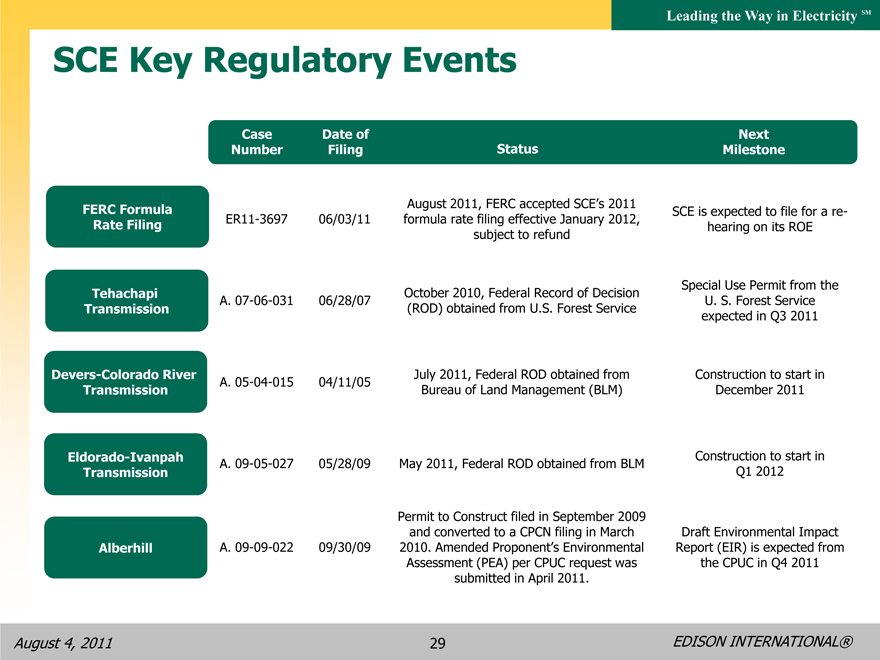
SCE Key Regulatory Events
FERC Formula Rate Filing
Tehachapi Transmission
Devers-Colorado River Transmission
Eldorado-Ivanpah Transmission
Alberhill
August 2011, FERC accepted SCE’s 2011 formula rate filing effective Janunary 2012, subject to refund
Case Date of Next
Number Filing Status Milestone
ER11-3697 06/03/11
October 2010, Federal Record of Decision Special Use Permit from the
A. 07-06-031 06/28/07 U. S. Forest Service
(ROD) obtained from U.S. Forest Service expected in Q3 2011
July 2011, Federal ROD obtained from Construction to start in
A. 05-04-015 04/11/05 Bureau of Land Management (BLM) December 2011
Construction to start in
A. 09-05-027 05/28/09 May 2011, Federal ROD obtained from BLM Q1 2012
Permit to Construct filed in September 2009
and converted to a CPCN filing in March Draft Environmental Impact
A. 09-09-022 09/30/09 2010. Amended Proponent’s Environmental Report (EIR) is expected from
Assessment (PEA) per CPUC request was the CPUC in Q4 2011
submitted in April 2011.
August 4, 2011
EDISON INTERNATIONAL®
29
Leading the Way in Electricity SM
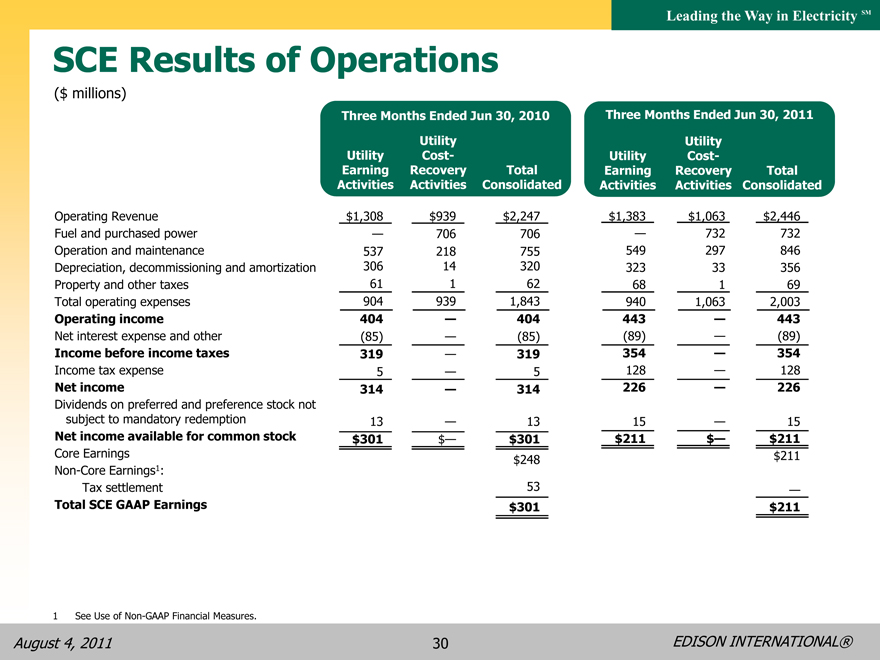
SCE Results of Operations
($ millions)
Three Months Ended Jun 30, 2010 Three Months Ended Jun 30, 2011
Utility Utility
Utility Cost- Utility Cost-
Earning Recovery Total Earning Recovery Total
Activities Activities Consolidated Activities Activities Consolidated
Operating Revenue $1,308 $939 $2,247 $1,383 $1,063 $2,446
Fuel and purchased power — 706 706 — 732 732
Operation and maintenance 537 218 755 549 297 846
Depreciation, decommissioning and amortization 306 14 320 323 33 356
Property and other taxes 61 1 62 68 1 69
Total operating expenses 904 939 1,843 940 1,063 2,003
Operating income 404 — 404 443 — 443
Net interest expense and other (85) — (85) (89) — (89)
Income before income taxes 319 — 319 354 — 354
Income tax expense 5 — 5 128 — 128
Net income 314 — 314 226 — 226
Dividends on preferred and preference stock not
subject to mandatory redemption 13 — 13 15 — 15
Net income available for common stock $301 $— $301 $211 $— $211
Core Earnings $248 $211
Non-Core Earnings1:
Tax settlement 53 —
Total SCE GAAP Earnings $301 $211
1 See Use of Non-GAAP Financial Measures.
August 4, 2011
EDISON INTERNATIONAL®
30
Leading the Way in Electricity SM
SCE Core EPS Non-GAAP Reconciliations
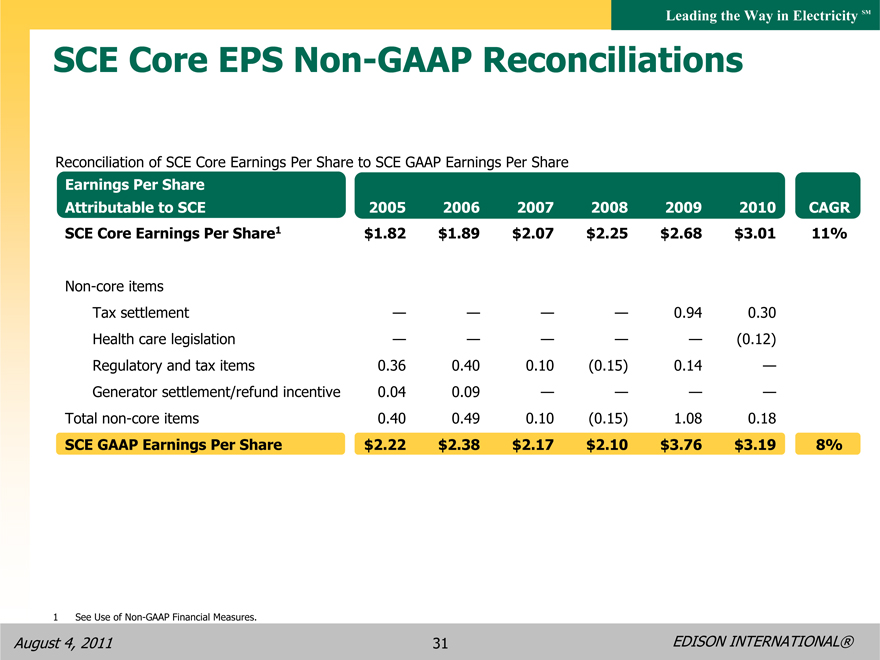
Reconciliation of SCE Core Earnings Per Share to SCE GAAP Earnings Per Share
Earnings Per Share
Attributable to SCE 2005 2006 2007 2008 2009 2010 CAGR
SCE Core Earnings Per Share1 $1.82 $1.89 $2.07 $2.25 $2.68 $3.01 11%
Non-core items
Tax settlement — — — — 0.94 0.30
Health care legislation — — — — — (0.12)
Regulatory and tax items 0.36 0.40 0.10 (0.15) 0.14 —
Generator settlement/refund incentive 0.04 0.09 — — — —
Total non-core items 0.40 0.49 0.10 (0.15) 1.08 0.18
SCE GAAP Earnings Per Share $2.22 $2.38 $2.17 $2.10 $3.76 $3.19 8%
1 See Use of Non-GAAP Financial Measures.
August 4, 2011
EDISON INTERNATIONAL®
31
Leading the Way in Electricity SM
EMG Appendix
August 4, 2011
EDISON INTERNATIONAL®
32
Leading the Way in Electricity SM
EMG Business Platform
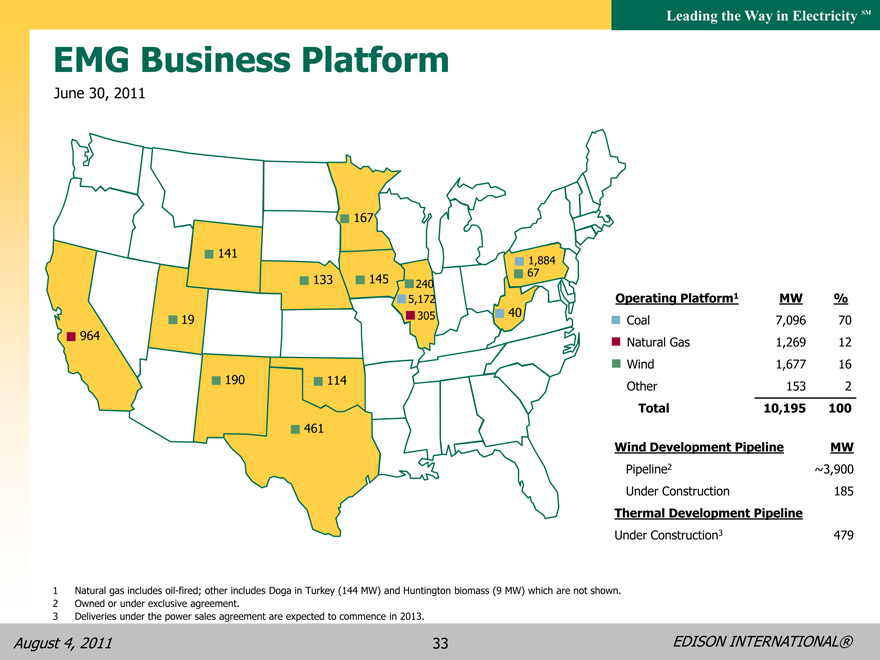
June 30, 2011
964 141 19 190 461
114
133 167 145 240 5,172 305 1,884 67
40
1 Natural gas includes oil-fired; other includes Doga in Turkey (144 MW) and Huntington biomass (9 MW) which are not shown.
2 Owned or under exclusive agreement.
3 Deliveries under the power sales agreement are expected to commence in 2013.
Operating Platform1 MW %
Coal 7,096 70
Natural Gas 1,269 12
Wind 1,677 16
Other 153 2
Total 10,195 100
Wind Development Pipeline MW
Pipeline2 ~3,900
Under Construction 185
Thermal Development Pipeline
Under Construction3 479
August 4, 2011
33
EDISON INTERNATIONAL®
Leading the Way in Electricity SM
Midwest Generation (Illinois)
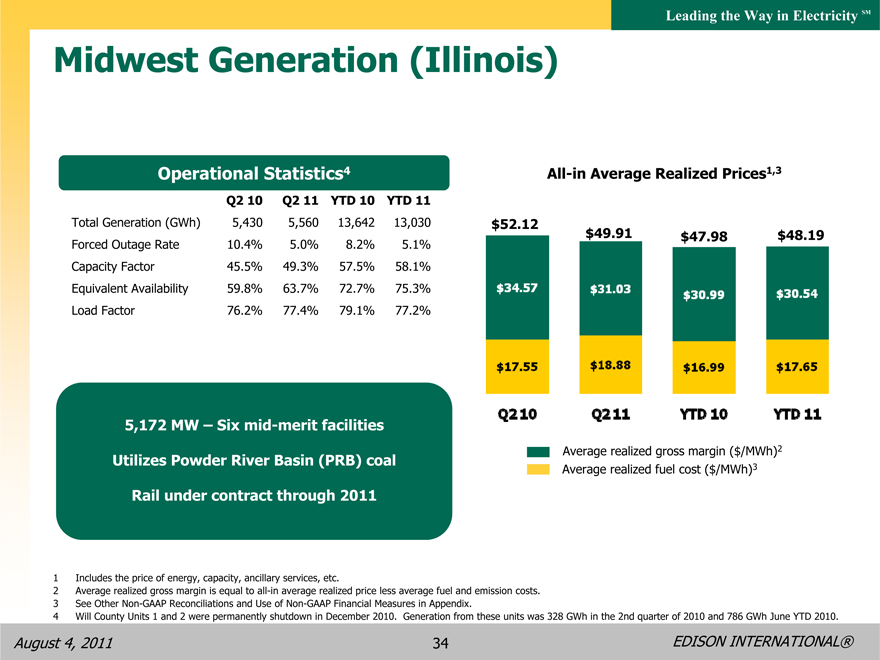
Operational Statistics4
Q2 10 Q2 11 YTD 10 YTD 11
• Total Generation (GWh) 5,430 5,560 13,642 13,030
• Forced Outage Rate 10.4% 5.0% 8.2% 5.1%
• Capacity Factor 45.5% 49.3% 57.5% 58.1%
• Equivalent Availability 59.8% 63.7% 72.7% 75.3%
• Load Factor 76.2% 77.4% 79.1% 77.2%
5,172 MW – Six mid-merit facilities Utilizes Powder River Basin (PRB) coal Rail under contract through 2011
1 Includes the price of energy, capacity, ancillary services, etc.
2 Average realized gross margin is equal to all-in average realized price less average fuel and emission costs.
3 See Other Non-GAAP Reconciliations and Use of Non-GAAP Financial Measures in Appendix.
4 Will County Units 1 and 2 were permanently shutdown in December 2010. Generation from these units was 328 GWh in the 2nd quarter of 2010 and 786 GWh June YTD 2010.
All-in Average Realized Prices1,3
$52.12 $49.91 $47.98 $48.19
$34.57 $31.03 $30.99 $30.54
$17.55 $18.88 $16.99 $17.65
Q2 10 Q2 11 YTD 10 YTD 11
Average realized gross margin ($/MWh)2
Average realized fuel cost ($/MWh)3
August 4, 2011
EDISON INTERNATIONAL®
34
Leading the Way in Electricity SM
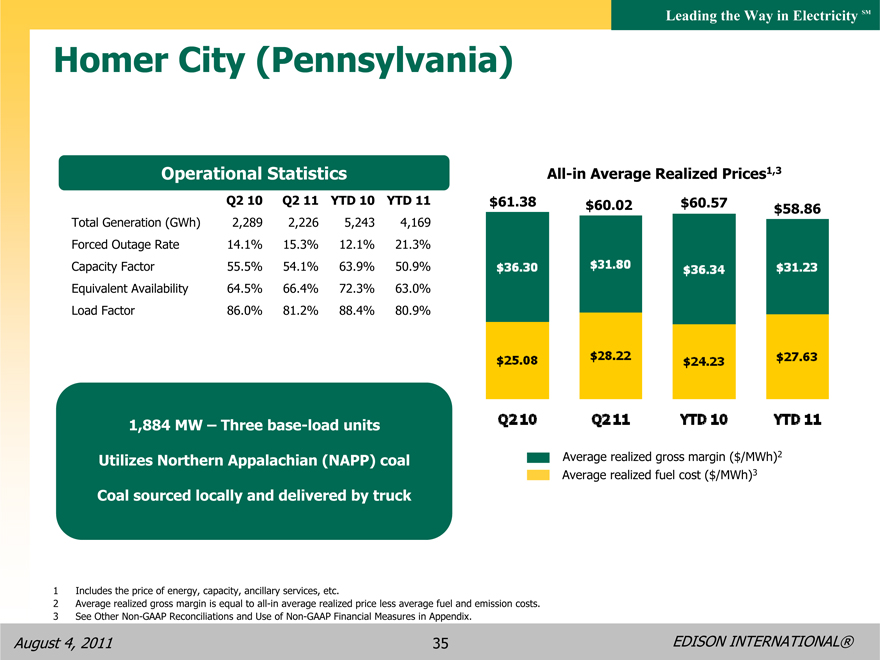
Homer City (Pennsylvania)
Operational Statistics
Q2 10 Q2 11 YTD 10 YTD 11
• Total Generation (GWh) 2,289 2,226 5,243 4,169
• Forced Outage Rate 14.1% 15.3% 12.1% 21.3%
• Capacity Factor 55.5% 54.1% 63.9% 50.9%
• Equivalent Availability 64.5% 66.4% 72.3% 63.0%
• Load Factor 86.0% 81.2% 88.4% 80.9%
1,884 MW – Three base-load units Utilizes Northern Appalachian (NAPP) coal Coal sourced locally and delivered by truck
1 Includes the price of energy, capacity, ancillary services, etc.
2 Average realized gross margin is equal to all-in average realized price less average fuel and emission costs.
3 See Other Non-GAAP Reconciliations and Use of Non-GAAP Financial Measures in Appendix.
All-in Average Realized Prices1,3
$61.38 $60.02 $60.57 $58.86
$36.30 $31.80 $36.34 $31.23
$25.08 $28.22 $27.63 $24.23
Q2 10 Q2 11 YTD 10 YTD 11
Average realized gross margin ($/MWh)2 Average realized fuel cost ($/MWh)3
August 4, 2011
EDISON INTERNATIONAL®
35
Leading the Way in Electricity SM
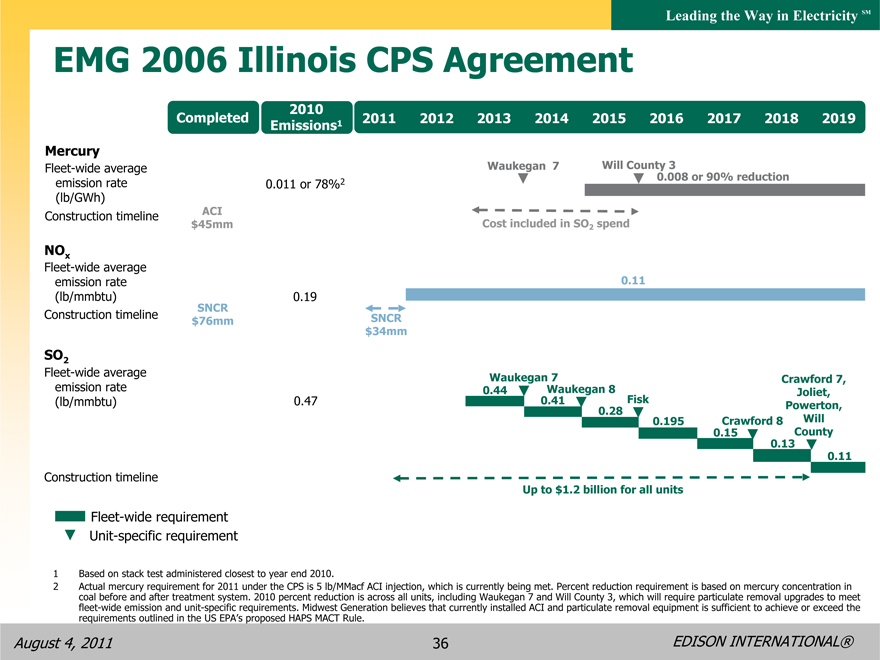
EMG 2006 Illinois CPS Agreement
2010
Completed 1 2011 2012 2013 2014 2015 2016 2017 2018 2019 Emissions
Mercury
Fleet-wide average Waukegan 7 Will County 3
emission rate 0.011 or 78%2 0.008 or 90% reduction
(lb/GWh)
Construction timeline ACI
$45mm Cost included in SO2 spend
NOx
Fleet-wide average
emission rate 0.11
(lb/mmbtu) 0.19
SNCR
Construction timeline $76mm SNCR
$34mm
SO2
Fleet-wide average Waukegan 7
emission rate 0.44 Waukegan 8 Crawford 7,
(lb/mmbtu) 0.47 0.41 Fisk Joliet, Pow
0.28 0.195 Crawford 8 erton, Will
0.15 County
0.13
0.11
Construction timeline
Up to $1.2 billion for all units
Fleet-wide requirement Unit-specific requirement
1 Based on stack test administered closest to year end 2010.
2 Actual mercury requirement for 2011 under the CPS is 5 lb/MMacf ACI injection, which is currently being met. Percent reduction requirement is based on mercury concentration in coal before and after treatment system. 2010 percent reduction is across all units, including Waukegan 7 and Will County 3, which will require particulate removal upgrades to meet fleet-wide emission and unit-specific requirements. Midwest Generation believes that currently installed ACI and particulate removal equipment is sufficient to achieve or exceed the requirements outlined in the US EPA’s proposed HAPS MACT Rule.
August 4, 2011
EDISON INTERNATIONAL®
36
Leading the Way in Electricity SM
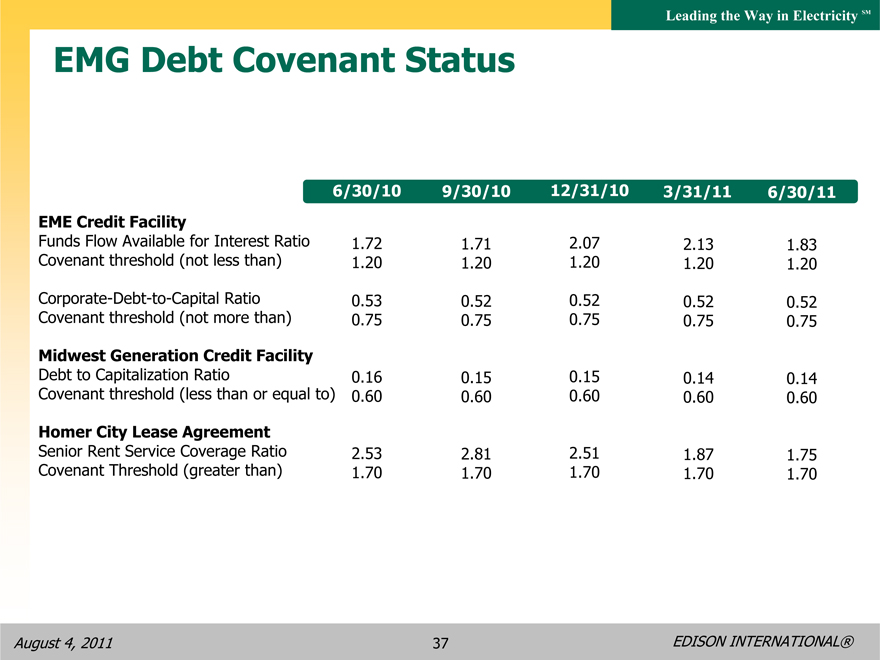
EMG Debt Covenant Status
6/30/10 9/30/10 12/31/10 3/31/11 6/30/11
EME Credit Facility
Funds Flow Available for Interest Ratio 1.72 1.71 2.07 2.13 1.83
Covenant threshold (not less than) 1.20 1.20 1.20 1.20 1.20
Corporate-Debt-to-Capital Ratio 0.53 0.52 0.52 0.52 0.52
Covenant threshold (not more than) 0.75 0.75 0.75 0.75 0.75
Midwest Generation Credit Facility
Debt to Capitalization Ratio 0.16 0.15 0.15 0.14 0.14
Covenant threshold (less than or equal to) 0.60 0.60 0.60 0.60 0.60
Homer City Lease Agreement
Senior Rent Service Coverage Ratio 2.53 2.81 2.51 1.87 1.75
Covenant Threshold (greater than) 1.70 1.70 1.70 1.70 1.70
August 4, 2011
EDISON INTERNATIONAL®
37
Leading the Way in Electricity SM
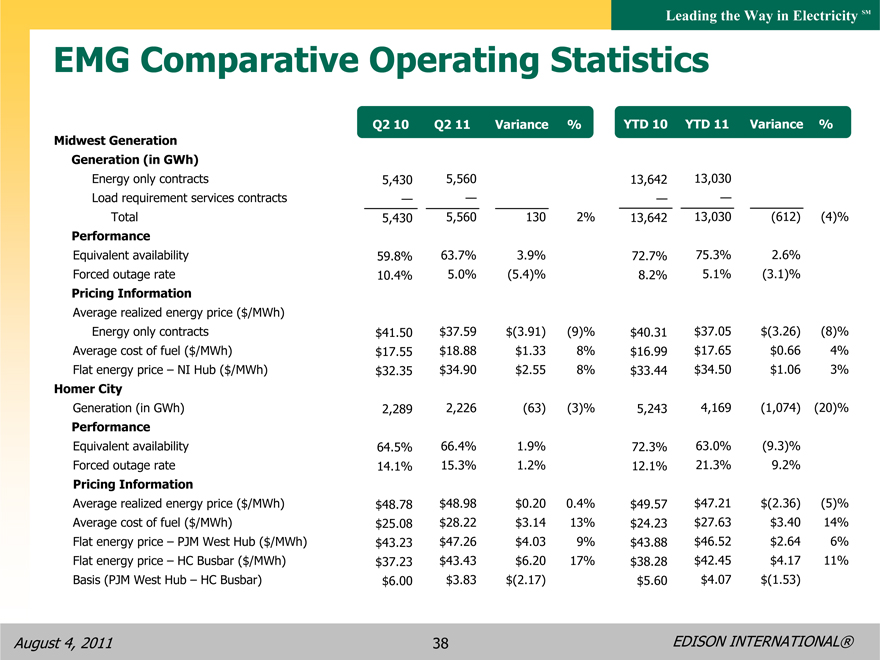
EMG Comparative Operating Statistics
Q2 10 Q2 11 Variance % YTD 10 YTD 11 Variance %
Midwest Generation
Generation (in GWh)
Energy only contracts 5,430 5,560 13,642 13,030
Load requirement services contracts — — — —
Total 5,430 5,560 130 2% 13,642 13,030 (612) (4)%
Performance
Equivalent availability 59.8% 63.7% 3.9% 72.7% 75.3% 2.6%
Forced outage rate 10.4% 5.0% (5.4)% 8.2% 5.1% (3.1)%
Pricing Information
Average realized energy price ($/MWh)
Energy only contracts $41.50 $37.59 $(3.91) (9)% $40.31 $37.05 $(3.26) (8)%
Average cost of fuel ($/MWh) $17.55 $18.88 $1.33 8% $16.99 $17.65 $0.66 4%
Flat energy price – NI Hub ($/MWh) $32.35 $34.90 $2.55 8% $33.44 $34.50 $1.06 3%
Homer City
Generation (in GWh) 2,289 2,226 (63) (3)% 5,243 4,169 (1,074) (20)%
Performance
Equivalent availability 64.5% 66.4% 1.9% 72.3% 63.0% (9.3)%
Forced outage rate 14.1% 15.3% 1.2% 12.1% 21.3% 9.2%
Pricing Information
Average realized energy price ($/MWh) $48.78 $48.98 $0.20 0.4% $49.57 $47.21 $(2.36) (5)%
Average cost of fuel ($/MWh) $25.08 $28.22 $3.14 13% $24.23 $27.63 $3.40 14%
Flat energy price – PJM West Hub ($/MWh) $43.23 $47.26 $4.03 9% $43.88 $46.52 $2.64 6%
Flat energy price – HC Busbar ($/MWh) $37.23 $43.43 $6.20 17% $38.28 $42.45 $4.17 11%
Basis (PJM West Hub – HC Busbar) $6.00 $3.83 $(2.17) $5.60 $4.07 $(1.53)
August 4, 2011
EDISON INTERNATIONAL®
38
Leading the Way in Electricity SM
EMG – Adjusted EBITDA
June 30, 2011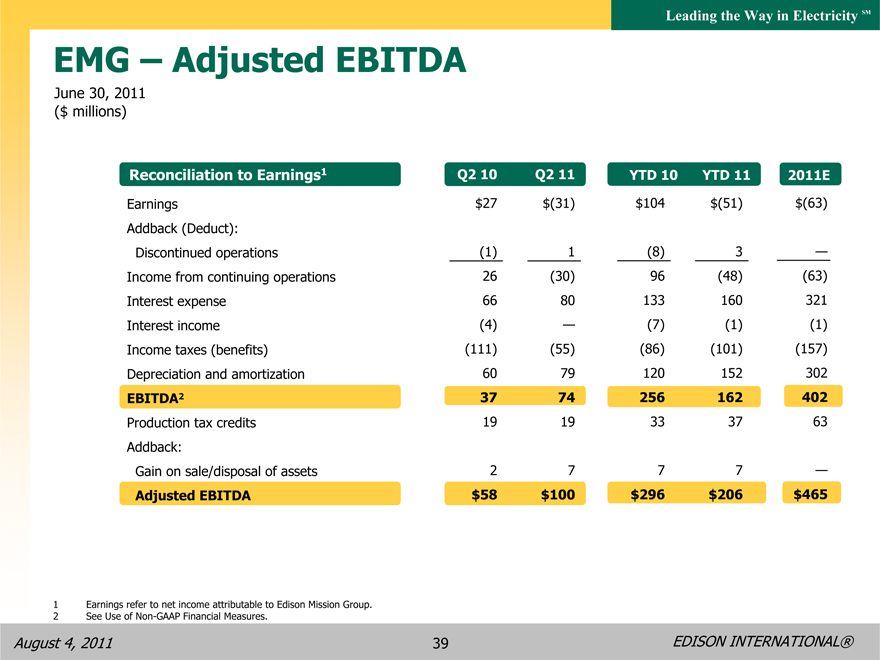
($ millions)
Reconciliation to Earnings1 Q4Q2 0910 Q4Q2 1011 YTD200910 YTD201011 2011E
Earnings $27 $(31) $104 $(51) $(63)
Addback (Deduct):
Discontinued operations (1) 1 (8) 3 —
Income from continuing operations 26 (30) 96 (48) (63)
Interest expense 66 80 133 160 321
Interest income (4) — (7) (1) (1)
Income taxes (benefits) (111) (55) (86) (101) (157)
Depreciation and amortization 60 79 120 152 302
EBITDA2 37 74 256 162 402
Production tax credits 19 19 33 37 63
Addback:
Gain on sale/disposal of assets 2 7 7 7 —
Adjusted EBITDA $58 $100 $296 $206 $465
1 Earnings refer to net income attributable to Edison Mission Group.
2 See Use of Non-GAAP Financial Measures.
August 4, 2011
EDISON INTERNATIONAL®
39
Leading the Way in Electricity SM
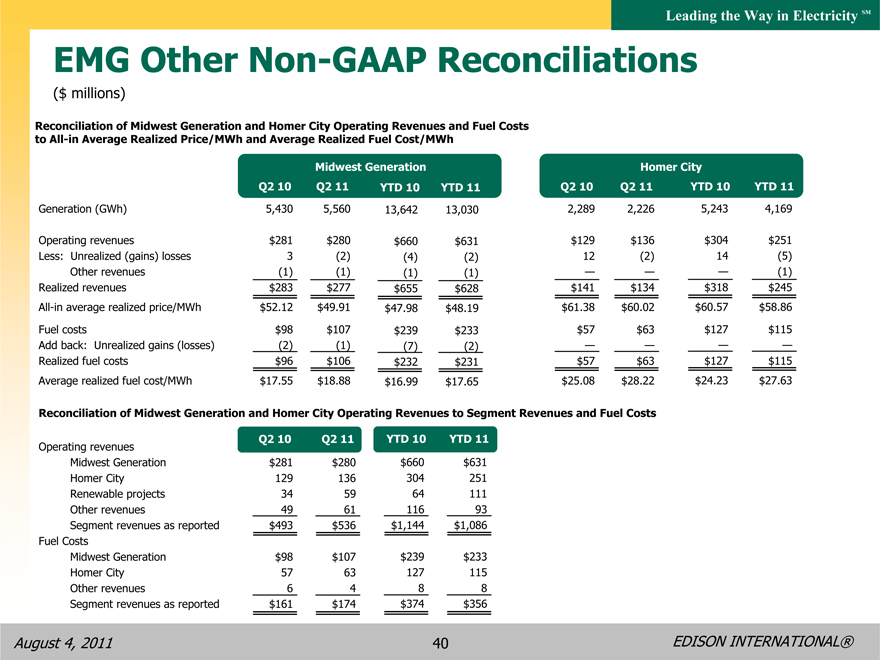
EMG Other Non-GAAP Reconciliations
($ millions)
Reconciliation of Midwest Generation and Homer City Operating Revenues and Fuel Costs to All-in Average Realized Price/MWh and Average Realized Fuel Cost/MWh
Midwest Generation Homer City
Q2 10 Q2 11 YTD 10 YTD 11 Q2 10 Q2 11 YTD 10 YTD 11
Generation (GWh) 5,430 5,560 13,642 13,030 2,289 2,226 5,243 4,169
Operating revenues $281 $280 $660 $631 $129 $136 $304 $251
Less: Unrealized (gains) losses 3 (2) (4) (2) 12 (2) 14 (5)
Other revenues (1) (1) (1) (1) — — — (1)
Realized revenues $283 $277 $655 $628 $141 $134 $318 $245
All-in average realized price/MWh $52.12 $49.91 $47.98 $48.19 $61.38 $60.02 $60.57 $58.86
Fuel costs $98 $107 $239 $233 $57 $63 $127 $115
Add back: Unrealized gains (losses) (2) (1) (7) (2) — — — —
Realized fuel costs $96 $106 $232 $231 $57 $63 $127 $115
Average realized fuel cost/MWh $17.55 $18.88 $16.99 $17.65 $25.08 $28.22 $24.23 $27.63
Reconciliation of Midwest Generation and Homer City Operating Revenues to Segment Revenues and Fuel Costs
Operating revenues Q2 10 Q2 11 YTD 10 YTD 11
Midwest Generation $281 $280 $660 $631
Homer City 129 136 304 251
Renewable projects 34 59 64 111
Other revenues 49 61 116 93
Segment revenues as reported $493 $536 $1,144 $1,086
Fuel Costs
Midwest Generation $98 $107 $239 $233
Homer City 57 63 127 115
Other revenues 6 4 8 8
Segment revenues as reported $161 $174 $374 $356
August 4, 2011
EDISON INTERNATIONAL®
40
Leading the Way in Electricity SM
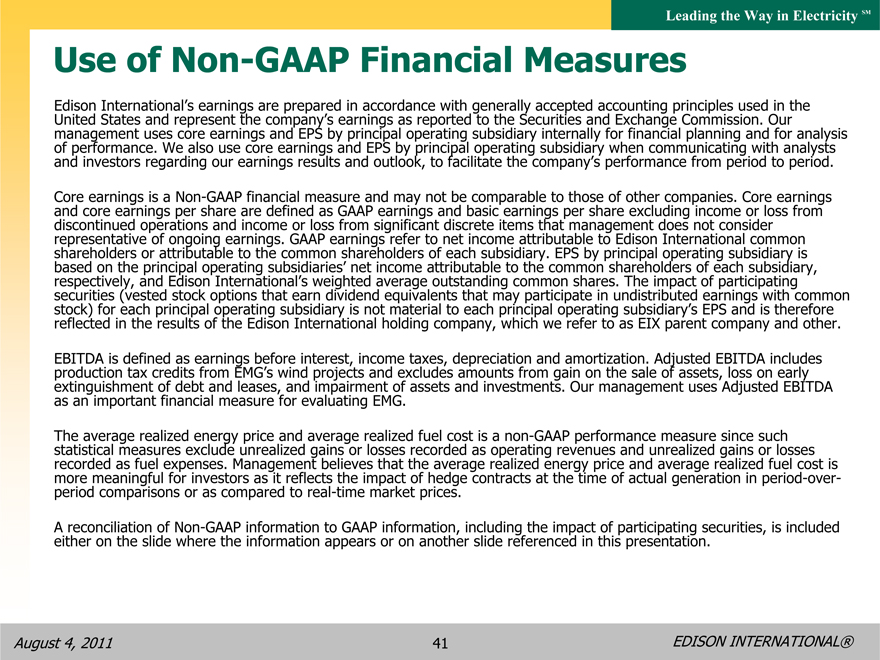
Use of Non-GAAP Financial Measures
United Edison States International’s and represent earnings the are company’s prepared earnings in accordance as reported with generally to the Securities accepted and accounting Exchange principles Commission. used Our in the management of performance. uses We core also earnings use core and earnings EPS by and principal EPS by operating principal subsidiary operating subsidiary internally for when financial communicating planning and with for analysts analysis and investors regarding our earnings results and outlook, to facilitate the company’s performance from period to period.
Core and core earnings earnings is a per Non share -GAAP are financial defined measure as GAAP and earnings may not and be basic comparable earnings to per those share of other excluding companies. income Core or loss earnings from representative discontinued operations of ongoing and earnings. income GAAP or loss earnings from significant refer to net discrete income items attributable that management to Edison does International not consider common shareholders based on the or principal attributable operating to the subsidiaries’ common shareholders net income attributable of each subsidiary. to the common EPS by principal shareholders operating of each subsidiary is participating subsidiary, respectively, securities (vested and Edison stock International’s options that earn weighted dividend average equivalents outstanding that may common participate shares. in undistributed The impact of earnings with is therefore common reflected stock) for in the each results principal of the operating Edison subsidiary International is not holding material company, to each which principal we refer operating to as subsidiary’s EIX parent company EPS and and other.
production EBITDA is defined tax credits as earnings from EMG’s before wind interest, projects income and excludes taxes, depreciation amounts from and gain amortization. on the sale Adjusted of assets, EBITDA loss on includes early extinguishment as an important of financial debt and measure leases, for and evaluating impairment EMG. of assets and investments. Our management uses Adjusted EBITDA as an important financial measure for evaluating EMG.
statistical The average measures realized exclude energy unrealized price and average gains or realized losses recorded fuel cost as is o ap non eratin -GAAP g revenues performance and unrealized measure g since ains or such losses more recorded meaningful as fuel expenses. for investors Management as it reflects believes the impact that the of hedge average contracts realized at energy the time price of actual and average generation realized in period fuel cost -over is- period comparisons or as compared to real-time market prices.
A either reconciliation on the slide of Non where -GAAP the information information to appears GAAP or information, on another including slide referenced the impact in this of participating presentation. securities, is included either on the slide where the information appears or on another slide referenced in this presentation.
August 4, 2011
EDISON INTERNATIONAL®
41