The U.S. economy (as measured by gross domestic product – GDP) grew at a moderate rate during the fiscal year. The annualized “real” rate of GDP growth (factoring out inflation) ranged from 3.3% to 4.3%. Energy costs and short-term interest rates soared, but “core” inflation (excluding food and energy prices) remained relatively stable.
Energy costs jumped 35% in the Consumer Price Index (CPI) for the year ended September 30, 2005 (reported in October 2005) as crude oil futures flirted with $70 a barrel. But the one-year percentage change in core CPI fell back to the same 2% level as a year earlier. Attempting to keep inflation under control, the Federal Reserve, in eight quarter-point increments, raised its overnight interest rate target two full percentage points to 3.75% by October 2005 from 1.75% in October 2004.
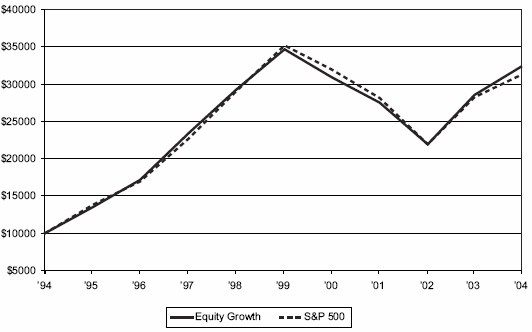
Overcoming rising fuel and interest costs, corporate earnings for the Standard & Poor’s 500 Index (through the third quarter of 2005) extended their string of double-digit growth to 12 straight quarters. The S&P 500, a key benchmark for larger-capitalization companies, returned 8.72% in the fiscal year. That performance trailed its smaller-cap counterparts, the S&P MidCap 400 and SmallCap 600 indices, which gained 17.65% and 15.27%, respectively.
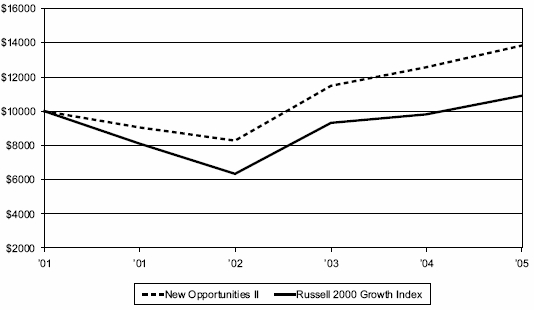
As a group, small-cap value stocks outpaced small-cap growth issues, as the Russell 2000 Value Index gained 13.04%, 213 bps more than the 10.91% return of the Russell 2000 Growth.
Solid security selection in the materials sector, especially in the metals and mining industry, contributed significantly to New Opportunities II’s fiscal-year return. Titanium Metals Corp., a maker of titanium parts used in aircraft and the portfolio’s largest average individual weighting during the year, exemplified the type of investment the New Opportunities II team targets.
Benefiting from surging demand as aircraft makers sought more lightweight materials, in part to combat rising jet fuel costs, Titanium Metals exhibited both solid earnings acceleration and strong relative price strength – two key attributes for portfolio inclusion. The company’s share price increased almost five-fold in the 12-month period, composing about a third of the portfolio’s total return.
In the consumer discretionary sector, sound stock picks among specialty retailers and an avoidance of struggling media companies and multi-line retailers boosted relative performance for New Opportunities II. As a whole, the sector ranked second only to materials in positive absolute contributions to the portfolio.
Stock selection in industrials also generated positive results. The portfolio bought a stake in Administaff, a provider of human resources staffing to small and medium-sized businesses, and that company’s shares surged along with its earnings.
TRIPPING ON TECHNOLOGY
The information technology sector stripped more than any other from New Opportunities II’s return. The portfolio’s underweight position couldn’t overcome weak stock selection in software, semiconductors and information technology services. Six of the portfolio’s 10 leading individual relative detractors came from the IT sector. However, the portfolio did enjoy substantial contributions from Itron, a maker of electronic meter and data collection equipment for the utility industry.
The portfolio’s biggest decliner, Able Laboratories, lost 90% of its value in a two-month period in mid-2005. The generic drug maker abruptly suspended all manufacturing and shipping operations as regulatory questions arose about its laboratory and production procedures. Shortly after the second quarter of 2005 ended, the company lost its second chief executive in two months and has since decided to auction all its assets. New Opportunities II shed the stock, but not before incurring some of its damage.
An overweight in financials – in large part reflecting a decision to avoid bigger weights in IT and health care – also hurt the portfolio’s performance as rising short-term interest rates and a flattening yield curve challenged commercial banks, thrifts and other lenders.
INVESTMENT PHILOSOPHY
We remain committed to pursuing an investment approach of identifying small companies that appear to have accelerating earnings and revenue growth. We believe this approach provides the optimum potential for long-term investment rewards.
| Top Five Industries as of October 31, 2005 |
| as a % of Net Assets |
| | | 10/31/05 | | 4/30/05 |
| Health Care Equipment & Supplies | | 10.9 | % | | 5.6 | % |
| Capital Markets | | 8.7 | % | | 0.8 | % |
| Commercial Banks | | 6.2 | % | | 3.5 | % |
| Commercial Services & Supplies | | 5.5 | % | | 2.0 | % |
| Semiconductors & Semiconductor Equipment | | 5.1 | % | | 1.2 | % |
| |
| Types of Investments in Portfolio |
| as a % of Net Assets |
| | | 10/31/05 | | 4/30/05 |
| Common Stocks | | 100.1 | % | | 97.7 | % |
| Temporary Cash Investments | | 1.7 | % | | 1.2 | % |
| Other Assets and Liabilities | | (1.8 | )% | | 1.1 | % |
D-7
EXHIBIT E
FINANCIAL INFORMATION
AC EQUITY GROWTH FUND
Financial Highlights–Annual
AC Equity Growth Fund – Financial Highlights
For a share outstanding throughout the years ended December 31
| | Investor Class |
| | 2005 | | 2004 | | 2003 | | 2002 | | 2001 |
| PER-SHARE DATA | | | | | | | | | | | | | | | | | | | |
| Net Asset Value, Beginning of | | | | | | | | | | | | | | | | | | | |
| Period | $ | 22.08 | | | $ | 19.60 | | | $ | 15.19 | | | $ | 19.24 | | | $ | 21.77 | |
| Income From Investment Operations | | | | | | | | | | | | | | | | | | | |
| Net Investment Income | | | | | | | | | | | | | | | | | | | |
| (Loss)(1) | | 0.22 | | | | 0.25 | | | | 0.17 | | | | 0.15 | | | | 0.13 | |
| Net Realized and Unrealized | | | | | | | | | | | | | | | | | | | |
| Gain (Loss) | | 1.39 | | | | 2.47 | | | | 4.41 | | | | (4.05 | ) | | | (2.53 | ) |
| Total From Investment | | | | | | | | | | | | | | | | | | | |
| Operations | | 1.61 | | | | 2.72 | | | | 4.58 | | | | (3.90 | ) | | | (2.40 | ) |
| Distributions | | | | | | | | | | | | | | | | | | | |
| From Net Investment Income | | (0.22 | ) | | | (0.24 | ) | | | (0.17 | ) | | | (0.15 | ) | | | (0.13 | ) |
| From Net Realized Gains | | (0.10 | ) | | | — | | | | — | | | | — | | | | — | |
| Total Distributions | | (0.32 | ) | | | (0.24 | ) | | | (0.17 | ) | | | (0.15 | ) | | | (0.13 | ) |
| Net Asset Value, End of Period | $ | 23.37 | | | $ | 22.08 | | | $ | 19.60 | | | $ | 15.19 | | | $ | 19.24 | |
| TOTAL RETURN(2) | | 7.30 | % | | | 13.98 | % | | | 30.27 | % | | | (20.32 | )% | | | (11.01 | )% |
| |
| RATIOS/SUPPLEMENTAL DATA | | | | | | | | | | | | | | | | | | | |
| Ratio of Operating Expenses to | | | | | | | | | | | | | | | | | | | |
| Average Net Assets | | 0.67 | % | | | 0.68 | % | | | 0.69 | % | | | 0.69 | % | | | 0.68 | % |
| Ratio of Net Investment Income | | | | | | | | | | | | | | | | | | | |
| (Loss) to Average Net Assets | | 0.98 | % | | | 1.24 | % | | | 1.00 | % | | | 0.86 | % | | | 0.64 | % |
| Portfolio Turnover Rate | | 106 | % | | | 97 | % | | | 95 | % | | | 100 | % | | | 79 | % |
| Net Assets, End of Period | | | | | | | | | | | | | | | | | | | |
| (in thousands) | $ | 1,962,596 | | | $ | 1,547,062 | | | $ | 1,188,103 | | | $ | 979,959 | | | $ | 1,465,026 | |
____________________
| (1) | Computed using average shares outstanding throughout the period. |
| |
| (2) | Total return assumes reinvestment of net investment income and capital gains distributions, if any. The total return of the classes may not precisely reflect the class expense differences because of the impact of calculating the net asset values to two decimal places. If net asset values were calculated to three decimal places, the total return differences would more closely reflect the class expense differences. The calculation of net asset values to two decimal places is made in accordance with SEC guidelines and does not result in any gain or loss of value between one class and another. |
| |
| | See Notes to Financial Statements. |
E-1
AC Equity Growth Fund – Financial Highlights
For a share outstanding throughout the years ended December 31
| | | Advisor Class |
| | | 2005 | | 2004 | | 2003 | | 2002 | | 2001 |
| PER-SHARE DATA | | | | | | | | | | | | | | | | | | | | |
| Net Asset Value, Beginning of Period | | $ | 22.07 | | | $ | 19.59 | | | $ | 15.17 | | | $ | 19.23 | | | $ | 21.77 | |
| Income From Investment Operations | | | | | | | | | | | | | | | | | | | | |
| Net Investment Income (Loss)(1) | | | 0.17 | | | | 0.20 | | | | 0.13 | | | | 0.11 | | | | 0.08 | |
| Net Realized and Unrealized Gain | | | | | | | | | | | | | | | | | | | | |
| (Loss) | | | 1.37 | | | | 2.47 | | | | 4.41 | | | | (4.06 | ) | | | (2.54 | ) |
| Total From Investment Operations | | | 1.54 | | | | 2.67 | | | | 4.54 | | | | (3.95 | ) | | | (2.46 | ) |
| Distributions | | | | | | | | | | | | | | | | | | | | |
| From Net Investment Income | | | (0.16 | ) | | | (0.19 | ) | | | (0.12 | ) | | | (0.11 | ) | | | (0.08 | ) |
| From Net Realized Gains | | | (0.10 | ) | | | — | | | | — | | | | — | | | | — | |
| Total Distributions | | | (0.26 | ) | | | (0.19 | ) | | | (0.12 | ) | | | (0.11 | ) | | | (0.08 | ) |
| Net Asset Value, End of Period | | $ | 23.35 | | | $ | 22.07 | | | $ | 19.59 | | | $ | 15.17 | | | $ | 19.23 | |
| TOTAL RETURN(2) | | | 6.99 | % | | | 13.71 | % | | | 30.05 | % | | | (20.60 | )% | | | (11.28 | )% |
| |
| RATIOS/SUPPLEMENTAL DATA | | | | | | | | | | | | | | | | | | | | |
| Ratio of Operating Expenses to | | | | | | | | | | | | | | | | | | | | |
| Average Net Assets | | | 0.92 | % | | | 0.93 | % | | | 0.94 | % | | | 0.94 | % | | | 0.93 | % |
| Ratio of Net Investment Income (Loss) to | | | | | | | | | | | | | | | | | | | | |
| Average Net Assets | | | 0.73 | % | | | 0.99 | % | | | 0.75 | % | | | 0.61 | % | | | 0.39 | % |
| Portfolio Turnover Rate | | | 106 | % | | | 97 | % | | | 95 | % | | | 100 | % | | | 79 | % |
| Net Assets, End of Period (in thousands) | | $ | 265,812 | | | $ | 160,427 | | | $ | 114,404 | | | $ | 99,615 | | | $ | 132,214 | |
__________________
| (1) | Computed using average shares outstanding throughout the period. |
| |
| (2) | Total return assumes reinvestment of net investment income and capital gains distributions, if any. The total return of the classes may not precisely reflect the class expense differences because of the impact of calculating the net asset values to two decimal places. If net asset values were calculated to three decimal places, the total return differences would more closely reflect the class expense differences. The calculation of net asset values to two decimal places is made in accordance with SEC guidelines and does not result in any gain or loss of value between one class and another. |
| |
| | See Notes to Financial Statements. |
E-2
AC Equity Growth Fund – Financial Highlights
For a share outstanding throughout the years ended December 31 (except as noted)
| | | C Class |
| | | 2005 | | 2004 | | 2003 | | 2002 | | 2001(1) |
| PER-SHARE DATA | | | | | | | | | | | | | | | | | | | | |
| Net Asset Value, Beginning of Period | | $ | 22.03 | | | $ | 19.55 | | | $ | 15.14 | | | $ | 19.23 | | | $ | 20.26 | |
| Income From Investment Operations | | | | | | | | | | | | | | | | | | | | |
| Net Investment Income (Loss)(2) | | | — | (3) | | | 0.05 | | | | (0.01 | ) | | | (0.02 | ) | | | (0.04 | ) |
| Net Realized and Unrealized Gain (Loss) | | | 1.37 | | | | 2.47 | | | | 4.43 | | | | (4.07 | ) | | | (0.99 | ) |
| Total From Investment Operations | | | 1.37 | | | | 2.52 | | | | 4.42 | | | | (4.09 | ) | | | (1.03 | ) |
| Distributions | | | | | | | | | | | | | | | | | | | | |
| From Net Investment Income | | | (0.02 | ) | | | (0.04 | ) | | | (0.01 | ) | | | — | | | | — | |
| From Net Realized Gains | | | (0.10 | ) | | | — | | | | — | | | | — | | | | — | |
| Total Distributions | | | (0.12 | ) | | | (0.04 | ) | | | (0.01 | ) | | | — | | | | — | |
| Net Asset Value, End of Period | | $ | 23.28 | | | $ | 22.03 | | | $ | 19.55 | | | $ | 15.14 | | | $ | 19.23 | |
| TOTAL RETURN(4) | | | 6.23 | % | | | 12.89 | % | | | 29.20 | % | | | (21.23 | )% | | | (5.13 | )% |
| |
| RATIOS/SUPPLEMENTAL DATA | | | | | | | | | | | | | | | | | | | | |
| Ratio of Operating Expenses to Average Net | | | | | | | | | | | | | | | | | | | | |
| Assets | | | 1.67 | % | | | 1.68 | % | | | 1.69 | % | | | 1.69 | % | | | 1.68 | %(5) |
| Ratio of Net Investment Income (Loss) to Average | | | | | | | | | | | | | | | | | | | | |
| Net Assets | | | (0.02 | )% | | | 0.24 | % | | | 0.00 | % | | | (0.14 | )% | | | (0.44 | )%(5) |
| Portfolio Turnover Rate | | | 106 | % | | | 97 | % | | | 95 | % | | | 100 | % | | | 79 | %(6) |
| Net Assets, End of Period (in thousands) | | $ | 4,536 | | | $ | 2,088 | | | $ | 1,076 | | | $ | 268 | | | $ | 139 | |
__________________
| (1) | July 18, 2001 (commencement of sale) through December 31, 2001. |
| |
| (2) | Computed using average shares outstanding throughout the period. |
| |
| (3) | Per-share amount was less than $0.005. |
| |
| (4) | Total return assumes reinvestment of net investment income and capital gains distributions, if any, and does not reflect applicable sales charges. Total returns for periods less than one year are not annualized. The total return of the classes may not precisely reflect the class expense differences because of the impact of calculating the net asset values to two decimal places. If net asset values were calculated to three decimal places, the total return differences would more closely reflect the class expense differences. The calculation of net asset values to two decimal places is made in accordance with SEC guidelines and does not result in any gain or loss of value between one class and another. |
| |
| (5) | Annualized. |
| | |
| (6) | Portfolio turnover is calculated at the fund level. Percentage indicated was calculated for the year ended December 31, 2001. |
| | |
| | See Notes to Financial Statements. |
E-3
AC Equity Growth Fund- Financial Highlights – Semiannual
AC Equity Growth Fund – Financial Highlights
For a share outstanding throughout the years ended December 31 (except as noted)
| | | Investor Class |
| | | 2006(1) | | 2005 | | 2004 | | 2003 | | 2002 | | 2001 |
| PER-SHARE DATA | | | | | | | | | | | | | | | | | | | | | | | | |
| Net Asset Value, Beginning of | | | | | | | | | | | | | | | | | | | | | | | | |
| Period | | $ | 23.37 | | | $ | 22.08 | | | $ | 19.60 | | | $ | 15.19 | | | $ | 19.24 | | | $ | 21.77 | |
| Income From Investment Operations | | | | | | | | | | | | | | | | | | | | | | | | |
| Net Investment Income | | | | | | | | | | | | | | | | | | | | | | | | |
| (Loss)(2) | | | 0.11 | | | | 0.22 | | | | 0.25 | | | | 0.17 | | | | 0.15 | | | | 0.13 | |
| Net Realized and Unrealized | | | | | | | | | | | | | | | | | | | | | | | | |
| Gain (Loss) | | | 0.57 | | | | 1.39 | | | | 2.47 | | | | 4.41 | | | | (4.05 | ) | | | (2.53 | ) |
| Total From Investment | | | | | | | | | | | | | | | | | | | | | | | | |
| Operations | | | 0.68 | | | | 1.61 | | | | 2.72 | | | | 4.58 | | | | (3.90 | ) | | | (2.40 | ) |
| Distributions | | | | | | | | | | | | | | | | | | | | | | | | |
| From Net Investment | | | | | | | | | | | | | | | | | | | | | | | | |
| Income | | | (0.09 | ) | | | (0.22 | ) | | | (0.24 | ) | | | (0.17 | ) | | | (0.15 | ) | | | (0.13 | ) |
| From Net Realized Gains | | | (0.03 | ) | | | (0.10 | ) | | | — | | | | — | | | | — | | | | — | |
| Total Distributions | | | (0.12 | ) | | | (0.32 | ) | | | (0.24 | ) | | | (0.17 | ) | | | (0.15 | ) | | | (0.13 | ) |
| Net Asset Value, End of Period | | $ | 23.93 | | | $ | 23.37 | | | $ | 22.08 | | | $ | 19.60 | | | $ | 15.19 | | | $ | 19.24 | |
| TOTAL RETURN(3) | | | 2.95 | % | | | 7.30 | % | | | 13.98 | % | | | 30.27 | % | | | (20.32 | )% | | | (11.01 | )% |
| |
| RATIOS/SUPPLEMENTAL DATA | | | | | | | | | | | | | | | | | | | | | | | | |
| Ratio of Operating Expenses to | | | | | | | | | | | | | | | | | | | | | | | | |
| Average Net Assets | | | 0.67 | %(4) | | | 0.67 | % | | | 0.68 | % | | | 0.69 | % | | | 0.69 | % | | | 0.68 | % |
| Ratio of Net Investment Income | | | | | | | | | | | | | | | | | | | | | | | | |
| (Loss) to Average Net Assets | | | 0.87 | %(4) | | | 0.98 | % | | | 1.24 | % | | | 1.00 | % | | | 0.86 | % | | | 0.64 | % |
| Portfolio Turnover Rate | | | 54 | % | | | 106 | % | | | 97 | % | | | 95 | % | | | 100 | % | | | 79 | % |
| Net Assets, End of Period | | | | | | | | | | | | | | | | | | | | | | | | |
| (in thousands) | | $ | 2,210,452 | | | $ | 1,962,596 | | | $ | 1,547,062 | | | $ | 1,188,103 | | | $ | 979,959 | | | $ | 1,465,026 | |
____________________
| (1) | Six months ended June 30, 2006 (unaudited). |
| |
| (2) | Computed using average shares outstanding throughout the period. |
| |
| (3) | Total return assumes reinvestment of net investment income and capital gains distributions, if any. Total returns for periods less than one year are not annualized. The total return of the classes may not precisely reflect the class expense differences because of the impact of calculating the net asset values to two decimal places. If net asset values were calculated to three decimal places, the total return differences would more closely reflect the class expense differences. The calculation of net asset values to two decimal places is made in accordance with SEC guidelines and does not result in any gain or loss of value between one class and another. |
| |
| (4) | Annualized. |
| |
| | See Notes to Financial Statements. |
E-4
AC Equity Growth Fund – Financial Highlights
For a share outstanding throughout the years ended December 31 (except as noted)
| | | Advisor Class |
| | | 2006(1) | | 2005 | | 2004 | | 2003 | | 2002 | | 2001 |
| PER-SHARE DATA | | | | | | | | | | | | | | | | | | | | | | | | |
| Net Asset Value, Beginning of Period | | $ | 23.35 | | | $ | 22.07 | | | $ | 19.59 | | | $ | 15.17 | | | $ | 19.23 | | | $ | 21.77 | |
| Income From Investment Operations | | | | | | | | | | | | | | | | | | | | | | | | |
| Net Investment Income | | | | | | | | | | | | | | | | | | | | | | | | |
| (Loss)(2) | | | 0.08 | | | | 0.17 | | | | 0.20 | | | | 0.13 | | | | 0.11 | | | | 0.08 | |
| Net Realized and Unrealized | | | | | | | | | | | | | | | | | | | | | | | | |
| Gain (Loss) | | | 0.58 | | | | 1.37 | | | | 2.47 | | | | 4.41 | | | | (4.06 | ) | | | (2.54 | ) |
| Total From Investment | | | | | | | | | | | | | | | | | | | | | | | | |
| Operations | | | 0.66 | | | | 1.54 | | | | 2.67 | | | | 4.54 | | | | (3.95 | ) | | | (2.46 | ) |
| Distributions | | | | | | | | | | | | | | | | | | | | | | | | |
| From Net Investment Income | | | (0.07 | ) | | | (0.16 | ) | | | (0.19 | ) | | | (0.12 | ) | | | (0.11 | ) | | | (0.08 | ) |
| From Net Realized Gains | | | (0.03 | ) | | | (0.10 | ) | | | — | | | | — | | | | — | | | | — | |
| Total Distributions | | | (0.10 | ) | | | (0.26 | ) | | | (0.19 | ) | | | (0.12 | ) | | | (0.11 | ) | | | (0.08 | ) |
| Net Asset Value, End of Period | | $ | 23.91 | | | $ | 23.35 | | | $ | 22.07 | | | $ | 19.59 | | | $ | 15.17 | | | $ | 19.23 | |
| TOTAL RETURN(3) | | | 2.83 | % | | | 6.99 | % | | | 13.71 | % | | | 30.05 | % | | | (20.60 | )% | | | (11.28 | )% |
| |
| RATIOS/SUPPLEMENTAL DATA | | | | | | | | | | | | | | | | | | | | | | | | |
| Ratio of Operating Expenses to | | | | | | | | | | | | | | | | | | | | | | | | |
| Average Net Assets | | | 0.92 | %(4) | | | 0.92 | % | | | 0.93 | % | | | 0.94 | % | | | 0.94 | % | | | 0.93 | % |
| Ratio of Net Investment Income | | | | | | | | | | | | | | | | | | | | | | | | |
| (Loss) to Average Net Assets | | | 0.62 | %(4) | | | 0.73 | % | | | 0.99 | % | | | 0.75 | % | | | 0.61 | % | | | 0.39 | % |
| Portfolio Turnover Rate | | | 54 | % | | | 106 | % | | | 97 | % | | | 95 | % | | | 100 | % | | | 79 | % |
| Net Assets, End of Period (in thousands) | | $ | 351,466 | | | $ | 265,812 | | | $ | 160,427 | | | $ | 114,404 | | | $ | 99,615 | | | $ | 132,214 | |
____________________
| (1) | Six months ended June 30, 2006 (unaudited). |
| |
| (2) | Computed using average shares outstanding throughout the period. |
| |
| (3) | Total return assumes reinvestment of net investment income and capital gains distributions, if any. Total returns for periods less than one year are not annualized. The total return of the classes may not precisely reflect the class expense differences because of the impact of calculating the net asset values to two decimal places. If net asset values were calculated to three decimal places, the total return differences would more closely reflect the class expense differences. The calculation of net asset values to two decimal places is made in accordance with SEC guidelines and does not result in any gain or loss of value between one class and another. |
| |
| (4) | Annualized. |
| |
| | See Notes to Financial Statements. |
E-5
AC Equity Growth Fund – Financial Highlights
For a share outstanding throughout the years ended December 31 (except as noted)
| | | C Class |
| | | 2006(1) | | 2005 | | 2004 | | 2003 | | 2002 | | 2001(2) |
| PER-SHARE DATA | | | | | | | | | | | | | | | | | | | | | | | | |
| Net Asset Value, Beginning of Period | | $ | 23.28 | | | $ | 22.03 | | | $ | 19.55 | | | $ | 15.14 | | | $ | 19.23 | | | $ | 20.26 | |
| Income From Investment Operations | | | | | | | | | | | | | | | | | | | | | | | | |
| Net Investment Income (Loss)(3) | | | (0.01 | ) | | | — | (4) | | | 0.05 | | | | (0.01 | ) | | | (0.02 | ) | | | (0.04 | ) |
| Net Realized and Unrealized Gain | | | | | | | | | | | | | | | | | | | | | | | | |
| (Loss) | | | 0.57 | | | | 1.37 | | | | 2.47 | | | | 4.43 | | | | (4.07 | ) | | | (0.99 | ) |
| Total From Investment Operations | | | 0.56 | | | | 1.37 | | | | 2.52 | | | | 4.42 | | | | (4.09 | ) | | | (1.03 | ) |
| Distributions | | | | | | | | | | | | | | | | | | | | | | | | |
| From Net Investment Income | | | — | | | | (0.02 | ) | | | (0.04 | ) | | | (0.01 | ) | | | — | | | | — | |
| From Net Realized Gains | | | (0.03 | ) | | | (0.10 | ) | | | — | | | | — | | | | — | | | | — | |
| Total Distributions | | | (0.03 | ) | | | (0.12 | ) | | | (0.04 | ) | | | (0.01 | ) | | | — | | | | — | |
| Net Asset Value, End of Period | | $ | 23.81 | | | $ | 23.28 | | | $ | 22.03 | | | $ | 19.55 | | | $ | 15.14 | | | $ | 19.23 | |
| TOTAL RETURN(5) | | | 2.42 | % | | | 6.23 | % | | | 12.89 | % | | | 29.20 | % | | | (21.23 | )% | | | (5.13 | )% |
| |
| RATIOS/SUPPLEMENTAL DATA | | | | | | | | | | | | | | | | | | | | | | | | |
| Ratio of Operating Expenses to Average | | | | | | | | | | | | | | | | | | | | | | | | |
| Net Assets | | | 1.67 | %(6) | | | 1.67 | % | | | 1.68 | % | | | 1.69 | % | | | 1.69 | % | | | 1.68 | %(6) |
| Ratio of Net Investment Income (Loss) to | | | | | | | | | | | | | | | | | | | | | | | | |
| Average Net Assets | | | (0.13 | )%(6) | | | (0.02 | )% | | | 0.24 | % | | | 0.00 | % | | | (0.14 | )% | | | (0.44 | )%(6) |
| Portfolio Turnover Rate | | | 54 | % | | | 106 | % | | | 97 | % | | | 95 | % | | | 100 | % | | | 79 | %(7) |
| Net Assets, End of Period (in thousands) | | $ | 7,235 | | | $ | 4,536 | | | $ | 2,088 | | | $ | 1,076 | | | $ | 268 | | | $ | 139 | |
____________________
| (1) | Six months ended June 30, 2006 (unaudited). |
| |
| (2) | July 18, 2001 (commencement of sale) through December 31, 2001. |
| |
| (3) | Computed using average shares outstanding throughout the period. |
| | |
| (4) | Per-share amount is less than $0.005. |
| | |
| (5) | Total return assumes reinvestment of net investment income and capital gains distributions, if any, and does not reflect applicable sales charges. Total returns for periods less than one year are not annualized. The total return of the classes may not precisely reflect the class expense differences because of the impact of calculating the net asset values to two decimal places. If net asset values were calculated to three decimal places, the total return differences would more closely reflect the class expense differences. The calculation of net asset values to two decimal places is made in accordance with SEC guidelines and does not result in any gain or loss of value between one class and another. |
| |
| (6) | Annualized. |
| |
| (7) | Portfolio turnover is calculated at the fund level. Percentage indicated was calculated for the year ended December 31, 2001. |
| | |
| | See Notes to Financial Statements. |
E-6
AC NEW OPPORTUNITIES II FUND
Financial Highlights – Annual
AC New Opportunities II Fund – Financial Highlights
For a share outstanding throughout the years ended October 31 (except as noted)
| | | Investor Class |
| | | 2005 | | 2004 | | 2003 | | 2002 | | 2001(1) |
| PER-SHARE DATA | | | | | | | | | | | | | | | | | | | | |
| Net Asset Value, Beginning of Period | | $ | 6.29 | | | $ | 5.75 | | | $ | 4.15 | | | $ | 4.52 | | | $ | 5.00 | |
| Income From Investment Operations | | | | | | | | | | | | | | | | | | | | |
| Net Investment Income (Loss)(2) | | | (0.06 | ) | | | (0.07 | ) | | | (0.05 | ) | | | (0.05 | ) | | | (0.01 | ) |
| Net Realized and Unrealized Gain | | | | | | | | | | | | | | | | | | | | |
| (Loss) | | | 0.69 | | | | 0.61 | | | | 1.65 | | | | (0.32 | ) | | | (0.47 | ) |
| Total From Investment Operations | | | 0.63 | | | | 0.54 | | | | 1.60 | | | | (0.37 | ) | | | (0.48 | ) |
| Distributions | | | | | | | | | | | | | | | | | | | | |
| From Net Realized Gains | | | (0.17 | ) | | | — | | | | — | | | | — | | | | — | |
| Net Asset Value, End of Period | | $ | 6.75 | | | $ | 6.29 | | | $ | 5.75 | | | $ | 4.15 | | | $ | 4.52 | |
| TOTAL RETURN(3) | | | 10.14 | % | | | 9.39 | % | | | 38.55 | % | | | (8.19 | )% | | | (9.60 | )% |
| |
| RATIOS/SUPPLEMENTAL DATA | | | | | | | | | | | | | | | | | | | | |
| Ratio of Operating Expenses to Average | | | | | | | | | | | | | | | | | | | | |
| Net Assets | | | 1.50 | % | | | 1.50 | % | | | 1.50 | % | | | 1.50 | % | | | 1.50 | %(4) |
| Ratio of Net Investment Income (Loss) to | | | | | | | | | | | | | | | | | | | | |
| Average Net Assets | | | (0.93 | )% | | | (1.09 | )% | | | (1.11 | )% | | | (1.02 | )% | | | (0.81 | )%(4) |
| Portfolio Turnover Rate | | | 269 | % | | | 255 | % | | | 236 | % | | | 182 | % | | | 89 | % |
| Net Assets, End of Period (in thousands) | | $ | 43,157 | | | $ | 38,917 | | | $ | 32,512 | | | $ | 25,479 | | | $ | 18,217 | |
____________________
| (1) | June 1, 2001 (fund inception) through October 31, 2001. |
| |
| (2) | Computed using average shares outstanding throughout the period. |
| |
| (3) | Total return assumes reinvestment of net investment income and capital gains distributions, if any. Total returns for periods less than one year are not annualized. The total return of the classes may not precisely reflect the class expense differences because of the impact of calculating the net asset values to two decimal places. If net asset values were calculated to three decimal places, the total return differences would more closely reflect the class expense differences. The calculation of net asset values to two decimal places is made in accordance with SEC guidelines and does not result in any gain or loss of value between one class and another. |
| |
| (4) | Annualized. |
E-7
AC New Opportunities II Fund – Financial Highlights
For a share outstanding throughout the years ended October 31 (except as noted)
| | A Class |
| | 2005 | | 2004 | | 2003(1) |
| PER-SHARE DATA | | | | | | | | | | | |
| Net Asset Value, Beginning of Period | $ | 6.26 | | | $ | 5.74 | | | $ | 4.15 | |
| Income From Investment Operations | | | | | | | | | | | |
| Net Investment Income (Loss)(2) | | (0.08 | ) | | | (0.08 | ) | | | (0.05 | ) |
| Net Realized and Unrealized Gain (Loss) | | 0.70 | | | | 0.60 | | | | 1.64 | |
| Total From Investment Operations | | 0.62 | | | | 0.52 | | | | 1.59 | |
| Distributions | | | | | | | | | | | |
| From Net Realized Gains | | (0.16 | ) | | | — | | | | — | |
| Net Asset Value, End of Period | $ | 6.72 | | | $ | 6.26 | | | $ | 5.74 | |
| TOTAL RETURN(3) | | 9.91 | % | | | 9.06 | % | | | 38.31 | % |
| |
| RATIOS/SUPPLEMENTAL DATA | | | | | | | | | | | |
| Ratio of Operating Expenses to Average Net Assets | | 1.75 | % | | | 1.75 | % | | | 1.75 | %(4) |
| Ratio of Net Investment Income (Loss) to Average Net Assets | | (1.18 | )% | | | (1.34 | )% | | | (1.47 | )%(4) |
| Portfolio Turnover Rate | | 269 | % | | | 255 | % | | | 236 | %(5) |
| Net Assets, End of Period (in thousands) | $ | 47,937 | | | $ | 20,337 | | | $ | 891 | |
____________________
| (1) | | January 31, 2003 (commencement of sale) through October 31, 2003. |
| |
| (2) | | Computed using average shares outstanding throughout the period. |
| |
| (3) | | Total return assumes reinvestment of net investment income and capital gains distributions, if any, and does not reflect applicable sales charges. Total returns for periods less than one year are not annualized. The total return of the classes may not precisely reflect the class expense differences because of the impact of calculating the net asset values to two decimal places. If net asset values were calculated to three decimal places, the total return differences would more closely reflect the class expense differences. The calculation of net asset values to two decimal places is made in accordance with SEC guidelines and does not result in any gain or loss of value between one class and another. |
| |
| (4) | | Annualized. |
| |
| (5) | | Portfolio turnover is calculated at the fund level. Percentage indicated was calculated for the year ended October 31, 2003. |
| |
| | | See Notes to Financial Statements. |
E-8
AC New Opportunities II Fund – Financial Highlights
For a share outstanding throughout the years ended October 31 (except as noted)
| | C Class |
| | 2005 | | 2004 | | 2003(1) |
| PER-SHARE DATA | | | | | | | | | | | |
| Net Asset Value, Beginning of Period | $ | 6.20 | | | $ | 5.73 | | | $ | 4.15 | |
| Income From Investment Operations | | | | | | | | | | | |
| Net Investment Income (Loss)(2) | | (0.13 | ) | | | (0.13 | ) | | | (0.07 | ) |
| Net Realized and Unrealized Gain (Loss) | | 0.70 | | | | 0.60 | | | | 1.65 | |
| Total From Investment Operations | | 0.57 | | | | 0.47 | | | | 1.58 | |
| Distributions | | | | | | | | | | | |
| From Net Realized Gains | | (0.11 | ) | | | — | | | | — | |
| Net Asset Value, End of Period | $ | 6.66 | | | $ | 6.20 | | | $ | 5.73 | |
| TOTAL RETURN(3) | | 9.16 | % | | | 8.20 | % | | | 38.07 | % |
| |
| RATIOS/SUPPLEMENTAL DATA | | | | | | | | | | | |
| Ratio of Operating Expenses to Average Net Assets | | 2.50 | % | | | 2.50 | % | | | 2.22 | %(4)(5) |
| Ratio of Net Investment Income (Loss) to Average Net Assets | | (1.93 | )% | | | (2.09 | )% | | | (1.97 | )%(4)(5) |
| Portfolio Turnover Rate | | 269 | % | | | 255 | % | | | 236 | %(6) |
| Net Assets, End of Period (in thousands) | $ | 3,414 | | | $ | 1,294 | | | $ | 34 | |
____________________
| (1) | | January 31, 2003 (commencement of sale) through October 31, 2003. |
| |
| (2) | | Computed using average shares outstanding throughout the period. |
| |
| (3) | | Total return assumes reinvestment of net investment income and capital gains distributions, if any, and does not reflect applicable sales charges. Total returns for periods less than one year are not annualized. The total return of the classes may not precisely reflect the class expense differences because of the impact of calculating the net asset values to two decimal places. If net asset values were calculated to three decimal places, the total return differences would more closely reflect the class expense differences. The calculation of net asset values to two decimal places is made in accordance with SEC guidelines and does not result in any gain or loss of value between one class and another. |
| |
| (4) | | Annualized. |
| |
| (5) | | During a portion of the period ended October 31, 2003, the distributor agreed to voluntarily waive the distribution and service fees. Had fees not been waived the annualized ratio of operating expenses to average net assets and the annualized ratio of net investment loss to average net assets would have been 2.50% and (2.25)%, respectively. |
| |
| (6) | | Portfolio turnover is calculated at the fund level. Percentage indicated was calculated for the year ended October 31, 2003. |
| |
| | | See Notes to Financial Statements. |
E-9
AC New Opportunities II Fund Financial Highlights – Semiannual
AC New Opportunities II Fund – Financial Highlights
For a share outstanding throughout the years ended October 31 (except as noted)
| | Investor Class |
| | 2006(1) | | 2005 | | 2004 | | 2003 | | 2002 | | 2001(2) |
| PER-SHARE DATA | | | | | | | | | | | | | | | | | | | | | | | |
| Net Asset Value, Beginning of Period | $ | 6.75 | | | $ | 6.29 | | | $ | 5.75 | | | $ | 4.15 | | | $ | 4.52 | | | $ | 5.00 | |
| Income From Investment Operations | | | | | | | | | | | | | | | | | | | | | | | |
| Net Investment Income (Loss)(3) | | (0.04 | ) | | | (0.06 | ) | | | (0.07 | ) | | | (0.05 | ) | | | (0.05 | ) | | | (0.01 | ) |
| Net Realized and Unrealized Gain (Loss) | | 1.60 | | | | 0.69 | | | | 0.61 | | | | 1.65 | | | | (0.32 | ) | | | (0.47 | ) |
| Total From Investment Operations | | 1.56 | | | | 0.63 | | | | 0.54 | | | | 1.60 | | | | (0.37 | ) | | | (0.48 | ) |
| Distributions | | | | | | | | | | | | | | | | | | | | | | | |
| From Net Realized Gains | | (0.22 | ) | | | (0.17 | ) | | | — | | | | — | | | | — | | | | — | |
| Net Asset Value, End of Period | $ | 8.09 | | | $ | 6.75 | | | $ | 6.29 | | | $ | 5.75 | | | $ | 4.15 | | | $ | 4.52 | |
| TOTAL RETURN(4) | | 23.55 | % | | | 10.14 | % | | | 9.39 | % | | | 38.55 | % | | | (8.19 | )% | | | (9.60 | )% |
| |
| RATIOS/SUPPLEMENTAL DATA | | | | | | | | | | | | | | | | | | | | | | | |
| Ratio of Operating Expenses to Average Net Assets | | 1.50 | %(5) | | | 1.50 | % | | | 1.50 | % | | | 1.50 | % | | | 1.50 | % | | | 1.50 | %(5) |
| Ratio of Net Investment Income (Loss) to Average Net | | | | | | | | | | | | | | | | | | | | | | | |
| Assets | | (1.21 | )%(5) | | | (0.93 | )% | | | (1.09 | )% | | | (1.11 | )% | | | (1.02 | )% | | | (0.81 | )%(5) |
| Portfolio Turnover Rate | | 120 | % | | | 269 | % | | | 255 | % | | | 236 | % | | | 182 | % | | | 89 | % |
| Net Assets, End of Period (in thousands) | $ | 51,169 | | | $ | 43,157 | | | $ | 38,917 | | | $ | 32,512 | | | $ | 25,479 | | | $ | 18,217 | |
____________________
| (1) | | Six months ended April 30, 2006 (unaudited). |
| |
| (2) | | June 1, 2001 (fund inception) through October 31, 2001. |
| |
| (3) | | Computed using average shares outstanding throughout the period. |
| |
| (4) | | Total return assumes reinvestment of net investment income and capital gains distributions, if any. Total returns for periods less than one year are not annualized. The total return of the classes may not precisely reflect the class expense differences because of the impact of calculating the net asset values to two decimal places. If net asset values were calculated to three decimal places, the total return differences would more closely reflect the class expense differences. The calculation of net asset values to two decimal places is made in accordance with SEC guidelines and does not result in any gain or loss of value between one class and another. |
| |
| (5) | | Annualized. |
| |
| | | See Notes to Financial Statements. |
E-10
AC New Opportunities II Fund – Financial Highlights
For a share outstanding throughout the years ended October 31 (except as noted)
| | A Class |
| | 2006(1) | | 2005 | | 2004 | | 2003(2) |
| PER-SHARE DATA | | | | | | | | | | | | | | | |
| Net Asset Value, Beginning of Period | $ | 6.72 | | | $ | 6.26 | | | $ | 5.74 | | | $ | 4.15 | |
| Income From Investment Operations | | | | | | | | | | | | | | | |
| Net Investment Income (Loss)(3) | | (0.05 | ) | | | (0.08 | ) | | | (0.08 | ) | | | (0.05 | ) |
| Net Realized and Unrealized Gain (Loss) | | 1.60 | | | | 0.70 | | | | 0.60 | | | | 1.64 | |
| Total From Investment Operations | | 1.55 | | | | 0.62 | | | | 0.52 | | | | 1.59 | |
| Distributions | | | | | | | | | | | | | | | |
| From Net Realized Gains | | (0.21 | ) | | | (0.16 | ) | | | — | | | | — | |
| Net Asset Value, End of Period | $ | 8.06 | | | $ | 6.72 | | | $ | 6.26 | | | $ | 5.74 | |
| TOTAL RETURN(4) | | 23.42 | % | | | 9.91 | % | | | 9.06 | % | | | 38.31 | % |
| |
| RATIOS/SUPPLEMENTAL DATA | | | | | | | | | | | | | | | |
| Ratio of Operating Expenses to Average Net Assets | | 1.75 | %(5) | | | 1.75 | % | | | 1.75 | % | | | 1.75 | %(5) |
| Ratio of Net Investment Income (Loss) to Average Net | | | | | | | | | | | | | | | |
| Assets | | (1.46 | )%(5) | | | (1.18 | )% | | | (1.34 | )% | | | (1.47 | )%(5) |
| Portfolio Turnover Rate | | 120 | % | | | 269 | % | | | 255 | % | | | 236 | %(6) |
| Net Assets, End of Period (in thousands) | $ | 60,590 | | | $ | 47,937 | | | $ | 20,337 | | | $ | 891 | |
____________________
| (1) | | Six months ended April 30, 2006 (unaudited). |
| |
| (2) | | January 31, 2003 (commencement of sale) through October 31, 2003. |
| |
| (3) | | Computed using average shares outstanding throughout the period. |
| |
| (4) | | Total return assumes reinvestment of net investment income and capital gains distributions, if any, and does not reflect applicable sales charges. Total returns for periods less than one year are not annualized. The total return of the classes may not precisely reflect the class expense differences because of the impact of calculating the net asset values to two decimal places. If net asset values were calculated to three decimal places, the total return differences would more closely reflect the class expense differences. The calculation of net asset values to two decimal places is made in accordance with SEC guidelines and does not result in any gain or loss of value between one class and another. |
| |
| (5) | | Annualized. |
| |
| (6) | | Portfolio turnover is calculated at the fund level. Percentage indicated was calculated for the year ended October 31, 2003. |
| |
| | | See Notes to Financial Statements. |
E-11
AC New Opportunities II Fund – Financial Highlights
For a share outstanding throughout the years ended October 31 (except as noted)
| | C Class |
| | 2006(1) | | 2005 | | 2004 | | 2003(2) |
| PER-SHARE DATA | | | | | | | | | | | | | | | |
| Net Asset Value, Beginning of Period | $ | 6.66 | | | $ | 6.20 | | | $ | 5.73 | | | $ | 4.15 | |
| Income From Investment Operations | | | | | | | | | | | | | | | |
| Net Investment Income (Loss)(3) | | (0.08 | ) | | | (0.13 | ) | | | (0.13 | ) | | | (0.07 | ) |
| Net Realized and Unrealized Gain (Loss) | | 1.60 | | | | 0.70 | | | | 0.60 | | | | 1.65 | |
| Total From Investment Operations | | 1.52 | | | | 0.57 | | | | 0.47 | | | | 1.58 | |
| Distributions | | | | | | | | | | | | | | | |
| From Net Realized Gains | | (0.15 | ) | | | (0.11 | ) | | | — | | | | — | |
| Net Asset Value, End of Period | $ | 8.03 | | | $ | 6.66 | | | $ | 6.20 | | | $ | 5.73 | |
| TOTAL RETURN(4) | | 22.90 | % | | | 9.16 | % | | | 8.20 | % | | | 38.07 | % |
| |
| RATIOS/SUPPLEMENTAL DATA | | | | | | | | | | | | | | | |
| Ratio of Operating Expenses to Average Net Assets | | 2.50 | %(5) | | | 2.50 | % | | | 2.50 | % | | | 2.22 | %(5)(6) |
| Ratio of Net Investment Income (Loss) to Average Net | | | | | | | | | | | | | | | |
| Assets | | (2.21 | )%(5) | | | (1.93 | )% | | | (2.09 | )% | | | (1.97 | )%(5)(6) |
| Portfolio Turnover Rate | | 120 | % | | | 269 | % | | | 255 | % | | | 236 | %(7) |
| Net Assets, End of Period (in thousands) | $ | 4,084 | | | $ | 3,414 | | | $ | 1,294 | | | $ | 34 | |
____________________
| (1) | | Six months ended April 30, 2006 (unaudited). |
| |
| (2) | | January 31, 2003 (commencement of sale) through October 31, 2003. |
| |
| (3) | | Computed using average shares outstanding throughout the period. |
| |
| (4) | | Total return assumes reinvestment of net investment income and capital gains distributions, if any, and does not reflect applicable sales charges. Total returns for periods less than one year are not annualized. The total return of the classes may not precisely reflect the class expense differences because of the impact of calculating the net asset values to two decimal places. If net asset values were calculated to three decimal places, the total return differences would more closely reflect the class expense differences. The calculation of net asset values to two decimal places is made in accordance with SEC guidelines and does not result in any gain or loss of value between one class and another. |
| |
| (5) | | Annualized. |
| |
| (6) | | During a portion of the period ended October 31, 2003, the distributor agreed to voluntarily waive the distribution and service fees. Had fees not been waived the annualized ratio of operating expenses to average net assets and the annualized ratio of net investment income (loss) to average net assets would have been 2.50% and (2.25)%, respectively. |
| |
| (7) | | Portfolio turnover is calculated at the fund level. Percentage indicated was calculated for the year ended October 31, 2003. |
| |
| | | See Notes to Financial Statements. |
E-12
                       STATEMENT OF ADDITIONAL INFORMATION

                                NOVEMBER 13, 2006


                          ACQUISITION OF THE ASSETS OF

                       KOPP TOTAL QUALITY MANAGEMENT FUND,
                          A SERIES OF KOPP FUNDS, INC.

                       7701 France Avenue South, Suite 500
                             Edina, Minnesota 55435
                          Telephone No: 1-888-533-KOPP


                        BY AND IN EXCHANGE FOR SHARES OF

                      AMERICAN CENTURY EQUITY GROWTH FUND,
          A SERIES OF AMERICAN CENTURY QUANTITATIVE EQUITY FUNDS, INC.

                                4500 Main Street
                           Kansas City, MO 64111-7709
                          Telephone No: 1-877-345-8836

This  Statement of  Additional  Information  dated  November 13, 2006,  is not a
prospectus. A Proxy Statement/Prospectus dated November 13, 2006, related to the
above-referenced  matter may be  obtained,  by  writing  or calling  Kopp at the
address  and  telephone  number  shown  above.   This  Statement  of  Additional
Information should be read in conjunction with such Proxy Statement/Prospectus.


                                TABLE OF CONTENTS

1.   Statement of Additional Information of American Century Equity Growth Fund,
     a series of American Century  Quantitative Equity Funds, Inc., dated May 1,
     2006, as supplemented on August 1, 2006.

2.   Statement of Additional  Information of Kopp Total Quality Management Fund,
     a series of Kopp Funds,  Inc.,  dated January 30, 2006, as  supplemented on
     September 13, 2006.

3.   Audited  Financial  Statements  of American  Century  Equity Growth Fund, a
     series of American Century  Quantitative Equity Funds, Inc., dated December
     31, 2005.

4.   Audited  Financial  Statements  of Kopp Total  Quality  Management  Fund, a
     series of Kopp Funds, Inc., dated September 30, 2005.

5.   Unaudited  Financial  Statements of American  Century Equity Growth Fund, a
     series of American Century  Quantitative Equity Funds, Inc., dated June 30,
     2006.

6.   Unaudited  Financial  Statements of Kopp Total Quality  Management  Fund, a
     series of Kopp Funds, Inc., dated March 31, 2006.

Pursuant to Item 14(a) of Form N-14, the pro forma financial statements required
by Rule 11-01 of Regulation S-X are not prepared for the  reorganization of Kopp
Total Quality  Management Fund into American  Century Equity Growth Fund because
the net asset value of Kopp Total  Quality  Management  Fund does not exceed ten
percent of American  Century Equity Growth Fund net asset value,  measured as of
October 20, 2006.


                      INFORMATION INCORPORATED BY REFERENCE

1.   The Statement of Additional  Information of American  Century Equity Growth
     Fund, a series of American  Century  Quantitative  Equity Funds,  Inc. ("AC
     Equity Growth Fund") dated May 1, 2006, as  supplemented on August 1, 2006,
     is incorporated by reference to the AC Equity Growth Fund's  Post-Effective
     Amendment  No. 44 to its  Registration  Statement  on Form  N-1A  (File No.
     811-5447),  which was filed with the Securities and Exchange  Commission on
     April  28,  2006.  A  copy  may  be  obtained  from  American   Century  at
     1-877-345-8836.

2.   The  Statement  of  Additional   Information  of  the  Kopp  Total  Quality
     Management  Fund,  a series of Kopp  Funds,  Inc.  ("Kopp TQM Fund")  dated
     January 30, 2006, as  supplemented  September 13, 2006, is  incorporated by
     reference  to the Kopp TQM Fund's  Post-Effective  Amendment  No. 15 to its
     Registration  Statement on Form N-1A (File No.  811-8267),  which was filed
     with the Securities and Exchange Commission on January 27, 2006. A copy may
     be obtained from the Kopp TQM Fund at 1-888-533-KOPP.

3.   The audited  financial  statements of AC Equity Growth Fund dated  December
     31,  2005,  are   incorporated   by  reference  to  the  Annual  Report  to
     shareholders of AC Equity Growth Fund,  which was filed with the Securities
     and Exchange Commission pursuant to Section 30(b) of the Investment Company
     Act of 1940, as amended, on March 1, 2006.

4.   The audited financial statements of Kopp TQM Fund dated September 30, 2005,
     are  incorporated by reference to the Annual Report to shareholders of Kopp
     TQM Fund,  which was filed  with the  Securities  and  Exchange  Commission
     pursuant  to  Section  30(b) of the  Investment  Company  Act of  1940,  as
     amended, on December 8, 2005.

5.   The unaudited financial  statements of AC Equity Growth Fund dated June 30,
     2006,  are   incorporated  by  reference  to  the  Semi-Annual   Report  to
     shareholders of AC Equity Growth Fund,  which was filed with the Securities
     and Exchange Commission pursuant to Section 30(b) of the Investment Company
     Act of 1940, as amended, on August 29, 2006.

6.   The unaudited  financial  statements of Kopp TQM Fund dated March 31, 2006,
     are incorporated by reference to the Semi-Annual  Report to shareholders of
     Kopp TQM Fund, which was filed with the Securities and Exchange  Commission
     pursuant  to  Section  30(b) of the  Investment  Company  Act of  1940,  as
     amended, on June 6, 2006.


AMERICAN CENTURY EQUITY GROWTH FUND,
A SERIES OF AMERICAN CENTURY QUANTITATIVE EQUITY FUNDS, INC.


INVESTMENT ADVISOR

American Century Investment Management, Inc.
4500 Main Street

Kansas City, Missouri  64111


DISTRIBUTOR

American Century Investment Services, Inc.
4500 Main Street
Kansas City, Missouri  64111


TRANSFER AGENT

American Century Services, LLC
4500 Main Street
Kansas City, Missouri  64111


KOPP TOTAL QUALITY MANAGEMENT FUND,
A SERIES OF KOPP FUNDS, INC.


INVESTMENT ADVISOR

KOPP INVESTMENT ADVISORS, LLC
7701 France Avenue South, Suite 500
Edina, Minnesota  55435


DISTRIBUTOR

CENTENNIAL LAKES CAPITAL, LLC
7701 France Avenue South, Suite 500
Edina, Minnesota  55435


TRANSFER AGENT AND ADMINISTRATOR


U.S. BANCORP FUND SERVICES, LLC

   For overnight deliveries, use:          For regular mail deliveries, use:
   Kopp Funds, Inc.                        Kopp Funds, Inc.
   c/o U.S. Bancorp Fund Services, LLC     c/o U.S. Bancorp Fund Services, LLC
   615 East Michigan Street                P.O. Box 701
   Third Floor
   Milwaukee, Wisconsin  53201-0701
   Milwaukee, Wisconsin  53202-5207


AMERICAN CENTURY QUANTITATIVE EQUITY FUNDS, INC.

PART C    OTHER INFORMATION

Item 15.  Indemnification

     The  Registrant  is  a  Maryland   corporation.   Under  Maryland   General
Corporation   Law,  a  corporation  is  permitted  to  indemnify  its  officers,
directors, employees and agents to the extent provided in applicable statutes.

     Article  Ninth of  Registrant's  Articles  of  Incorporation  requires  the
indemnification  of the  Registrant's  directors and officers to the full extent
permitted by Maryland  General  Corporation  Law, the Investment  Company Act of
1940 and all other applicable laws.

     The Registrant has purchased an insurance  policy insuring its officers and
directors  against  certain  liabilities  which such  officers and directors may
incur  while  acting  in such  capacities  and  providing  reimbursement  to the
Registrant for sums which it may be permitted or required to pay to its officers
and directors by way of  indemnification  against such  liabilities,  subject in
either case to clauses respecting deductibility and participation.

Item 16.  Exhibits

     (1)  (a) Articles of Incorporation of American Century  Quantitative Equity
Funds,  Inc.,  dated  February  26, 2004 (filed  electronically  as Exhibit a to
Post-Effective  Amendment No. 34 to the Registration Statement of the Registrant
on March 1, 2004, File No. 33-19589, and incorporated herein by reference).

          (b) Articles  Supplementary  of American Century  Quantitative  Equity
Funds,  Inc.,  dated  April 22,  2004  (filed  electronically  as  Exhibit a2 to
Post-Effective  Amendment No. 35 to the Registration Statement of the Registrant
on April 29, 2004, File No. 33-19589, and incorporated herein by reference).

          (c) Articles  Supplementary  of American Century  Quantitative  Equity
Funds,  Inc.,  dated  May  4,  2004  (filed  electronically  as  Exhibit  a3  to
Post-Effective  Amendment No. 38 to the Registration Statement of the Registrant
on February 17, 2005, File No. 33-19589, and incorporated herein by reference).

          (d) Articles  Supplementary  of American Century  Quantitative  Equity
Funds,  Inc.,  dated  August 29,  2005  (filed  electronically  as Exhibit a4 to
Post-Effective  Amendment No. 41 to the Registration Statement of the Registrant
on September 29, 2005, File No. 33-19589, and incorporated herein by reference).

          (e) Articles  Supplementary  of American Century  Quantitative  Equity
Funds,  Inc.,  dated  March 15,  2006  (filed  electronically  as  Exhibit a5 to
Post-Effective  Amendment No. 44 to the Registration Statement of the Registrant
on April 28, 2006, File No. 33-19589, and incorporated herein by reference).

          (f) Articles  Supplementary  of American Century  Quantitative  Equity
Funds,  Inc.,  dated  August 25,  2006  (filed  electronically  as Exhibit a6 to
Post-Effective  Amendment No. 45 to the Registration Statement of the Registrant
on September 1, 2006, File No. 33-19589, and incorporated herein by reference).

     (2)   Amended  and   Restated   Bylaws,   dated   August  26,  2004  (filed
electronically  as  Exhibit  b  to  Post-Effective   Amendment  No.  38  to  the
Registration  Statement  of the  Registrant  on  February  17,  2005,  File  No.
33-19589, and incorporated herein by reference).

     (3) Not applicable.

     (4) Form of  Agreement  and Plan of  Reorganization  with Kopp Funds,  Inc.
(filed electronically as Exhibit 4 to the Registration Statement on Form N-14 of
the Registrant on October 2, 2006, File No. 33-19589, and incorporated herein by
reference).

     (5) Registrant hereby incorporates by reference,  as though set forth fully
herein,  the Fifth and  Seventh  declarations  of the  Registrant's  Articles of
Incorporation,  incorporated  herein by  reference  as  Exhibit  1  hereto,  and
Sections  3  through  11 of the  Registrant's  Bylaws,  incorporated  herein  by
reference as Exhibit 2 hereto.

     (6)  (a) Management Agreement with American Century Investment  Management,
Inc., dated August 1, 2006 (filed electronically as Exhibit d1 to Post-Effective
Amendment No. 45 to the Registration Statement of the Registrant on September 1,
2006, File No. 33-19589, and incorporated herein by reference).

          (b) Management Agreement with American Century Investment  Management,
Inc., dated April 28, 2006 (filed electronically as Exhibit d2 to Post-Effective
Amendment No. 44 to the  Registration  Statement of the  Registrant on April 28,
2006, File No. 33-19589, and incorporated herein by reference).

     (7)  (a) Amended and Restated Distribution  Agreement with American Century
Investment  Services,  Inc., dated September 29, 2005 (filed  electronically  as
Exhibit e to  Post-Effective  Amendment No. 41 to the Registration  Statement of
the Registrant on September 29, 2005, File No. 33-19589, and incorporated herein
by reference).

          (b) Form of Dealer/Agency  Agreement (filed  electronically as Exhibit
e2 to Pre-Effective  Amendment No. 1 to the  Registration  Statement of American
Century  Growth  Funds,  Inc.  on  May  30,  2006,  File  No.  333-132114,   and
incorporated herein by reference).

     (8)  Not applicable.

     (9)  (a) Master Agreement with Commerce Bank, N. A., dated January 22, 1997
(filed  electronically as Exhibit b8e to Post-Effective  Amendment No. 76 to the
Registration  Statement of American  Century Mutual Funds,  Inc. on February 28,
1997, File No. 2-14213, and incorporated herein by reference).

          (b) Global Custody  Agreement  with The Chase  Manhattan  Bank,  dated
August 9, 1996 (filed  electronically as Exhibit b8 to Post-Effective  Amendment
No. 31 to the Registration Statement of American Century Government Income Trust
on February 7, 1997, File No. 2-99222, and incorporated herein by reference).

          (c) Amendment to the Global Custody Agreement with The Chase Manhattan
Bank,   dated  December  9,  2000  (filed   electronically   as  Exhibit  g2  to
Pre-Effective  Amendment No. 2 to the Registration Statement of American Century
Variable  Portfolios  II,  Inc.  on  January 9, 2001,  File No.  333-46922,  and
incorporated herein by reference).

          (d) Amendment No. 2 to the Global Custody  Agreement  between American
Century  Investments and the JPMorgan Chase Bank, dated as of May 1, 2004 (filed
electronically  as  Exhibit  g4  to  Post-Effective  Amendment  No.  35  to  the
Registration  Statement of the Registrant on April 29, 2004, File No.  33-19589,
and incorporated herein by reference).

          (e) Chase Manhattan Bank Custody Fee Schedule,  dated October 19, 2000
(filed  electronically as Exhibit g5 to  Post-Effective  Amendment No. 35 to the
Registration  Statement of the Registrant on April 29, 2004, File No.  33-19589,
and incorporated herein by reference).

          (f) Amendment No. 3 to the Global Custody  Agreement  between American
Century Investments and the JPMorgan Chase Bank, dated as of May 31, 2006 (filed
electronically   as  Exhibit  g6  to  Pre-Effective   Amendment  No.  1  to  the
Registration  Statement of American Century Growth Funds,  Inc. on May 30, 2006,
File No. 333-132114, and incorporated herein by reference).

          (g) Special Custody and Pledge Agreement with Goldman, Sachs & Co. and
State  Street  Bank  and  Trust  Company,   dated   September  29,  2005  (filed
electronically  as  Exhibit  g6  to  Post-Effective  Amendment  No.  41  to  the
Registration  Statement  of the  Registrant  on  September  29,  2005,  File No.
33-19589, and incorporated herein by reference).

          (h) Custodian and  Investment  Accounting  Agreement with State Street
Bank and Trust Company,  dated May 27, 2005 (filed  electronically as Exhibit g6
to  Post-Effective  Amendment No. 27 to the  Registration  Statement of American
Century  Investment Trust on May 27, 2005, File No.  33-65170,  and incorporated
herein by reference).

          (i) Amendment No. 1 to Custodian and Investment  Accounting  Agreement
with State Street Bank and Trust  Company,  effective  September 30, 2005 (filed
electronically  as  Exhibit  g8  to  Post-Effective  Amendment  No.  41  to  the
Registration  Statement  of the  Registrant  on  September  29,  2005,  File No.
33-19589, and incorporated herein by reference).

          (j) Amendment No. 2 to Custodian and Investment  Accounting  Agreement
with State  Street  Bank and Trust  Company,  effective  March 31,  2006  (filed
electronically  as  Exhibit  g9  to  Post-Effective  Amendment  No.  32  to  the
Registration  Statement of American Century  Investment Trust on March 31, 2006,
File No. 33-65170, and incorporated herein by reference).

          (k)  Registered  Investment  Company  Custody  Agreement with Goldman,
Sachs & Co.,  dated  February  6, 2006 (filed  electronically  as Exhibit g10 to
Post-Effective  Amendment No. 44 to the Registration Statement of the Registrant
on April 28, 2006, File No. 33-19589, and incorporated herein by reference).

          (l) Amendment to Futures and Options Account  Agreement and Registered
Investment  Company Custody Agreement with Goldman,  Sachs & Co.,  effective May
12, 2006 (filed electronically as Exhibit g11 to Post-Effective Amendment No. 44
to the  Registration  Statement of the  Registrant  on April 28, 2006,  File No.
33-19589, and incorporated herein by reference).

     (10) (a) Master  Distribution and Individual  Shareholder  Services Plan (C
Class),  dated  September  16,  2000  (filed  electronically  as  Exhibit  m3 to
Post-Effective  Amendment  No.  35 to the  Registration  Statement  of  American
Century  Target  Maturities  Trust on April  17,  2001,  File No.  2-94608,  and
incorporated herein by reference).

          (b)  Amendment  No.  1  to  the  Master  Distribution  and  Individual
Shareholder Services Plan (C Class), dated August 1, 2001 (filed  electronically
as Exhibit m5 to Post-Effective  Amendment No. 44 to the Registration  Statement
of American Century  Government Income Trust on July 31, 2001, File No. 2-99222,
and incorporated herein by reference).

          (c)  Amendment  No.  2  to  the  Master  Distribution  and  Individual
Shareholder   Services   Plan  (C  Class),   dated   December   3,  2001  (filed
electronically  as  Exhibit  m7  to  Post-Effective  Amendment  No.  16  to  the
Registration  Statement  of American  Century  Investment  Trust on November 30,
2001, File No. 33-65170, and incorporated herein by reference).

          (d)  Amendment  No.  3  to  the  Master  Distribution  and  Individual
Shareholder Services Plan (C Class), dated July 1, 2002 (filed electronically as
Exhibit m9 to Post-Effective  Amendment No. 17 to the Registration  Statement of
American  Century  Investment  Trust on June 28, 2002,  File No.  33-65170,  and
incorporated herein by reference).

          (e)  Amendment  No.  4  to  the  Master  Distribution  and  Individual
Shareholder   Services   Plan  (C  Class),   dated   September  3,  2002  (filed
electronically  as  Exhibit  m5  to  Post-Effective  Amendment  No.  35  to  the
Registration  Statement of American  Century  Municipal  Trust on September  30,
2002, File No. 2-91229, and incorporated herein by reference).

          (f)  Amendment  No.  5  to  the  Master  Distribution  and  Individual
Shareholder   Services   Plan  (C  Class),   dated   January  2,  2004,   (filed
electronically  as  Exhibit  m6  to  Post-Effective  Amendment  No.  42  to  the
Registration Statement of American Century Municipal Trust on February 26, 2004,
File No. 2-91229, and incorporated herein by reference).

          (g)  Amendment  No.  6  to  the  Master  Distribution  and  Individual
Shareholder Services Plan (C Class), dated May 1, 2004 (filed  electronically as
Exhibit m13 to Post-Effective  Amendment No. 35 to the Registration Statement of
the Registrant on April 29, 2004, File No. 33-19589,  and incorporated herein by
reference).

          (h)  Amendment  No.  7  to  the  Master  Distribution  and  Individual
Shareholder Services Plan (C Class), dated May 1, 2005 (filed  electronically as
Exhibit m15 to Post-Effective  Amendment No. 38 to the Registration Statement of
the Registrant on May 13, 2005, File No. 33-19589,  and  incorporated  herein by
reference).

          (i)  Amendment  No.  8  to  the  Master  Distribution  and  Individual
Shareholder   Services  Plan  (C  Class),   dated   September  29,  2005  (filed
electronically  as  Exhibit  m17  to  Post-Effective  Amendment  No.  41 to  the
Registration  Statement  of the  Registrant  on  September  29,  2005,  File No.
33-19589, and incorporated herein by reference).

          (j)  Amendment  No.  9  to  the  Master  Distribution  and  Individual
Shareholder Services Plan (C Class), dated March 30, 2006 (filed  electronically
as Exhibit m10 to Post-Effective  Amendment No. 50 to the Registration Statement
of American  Century  Municipal Trust on March 31, 2006,  File No. 2-14213,  and
incorporated herein by reference).

          (k) Master  Distribution and Individual  Shareholder  Services Plan (A
Class),  dated  September  3,  2002  (filed  electronically  as  Exhibit  m6  to
Post-Effective  Amendment  No.  34 to the  Registration  Statement  of  American
Century  California  Tax-Free and Municipal  Funds on October 1, 2002,  File No.
2-82734, and incorporated herein by reference).

          (l)  Amendment  No.  1  to  the  Master  Distribution  and  Individual
Shareholder   Services   Plan  (A  Class),   dated   February  27,  2004  (filed
electronically  as  Exhibit  m18  to  Post-Effective  Amendment  No.  104 to the
Registration  Statement of American  Century Mutual Funds,  Inc. on February 26,
2004, File No. 2-14213, and incorporated herein by reference).

          (m)  Amendment  No.  2  to  the  Master  Distribution  and  Individual
Shareholder   Services  Plan  (A  Class),   dated   September  30,  2004  (filed
electronically  as  Exhibit  m22  to  Post-Effective  Amendment  No.  106 to the
Registration  Statement of American  Century Mutual Funds,  Inc. on November 29,
2004, File No. 2-14213, and incorporated herein by reference).

          (n)  Amendment  No.  3  to  the  Master  Distribution  and  Individual
Shareholder   Services   Plan  (A  Class),   dated   November  17,  2004  (filed
electronically  as  Exhibit  m23  to  Post-Effective  Amendment  No.  106 to the
Registration  Statement of American  Century Mutual Funds,  Inc. on November 29,
2004, File No. 2-14213, and incorporated herein by reference).

          (o)  Amendment  No.  4  to  the  Master  Distribution  and  Individual
Shareholder Services Plan (A Class), dated May 1, 2005 (filed  electronically as
Exhibit m13 to Post-Effective  Amendment No. 44 to the Registration Statement of
American  Century  Municipal  Trust.  on May 13,  2005,  File No.  2-91229,  and
incorporated herein by reference).

          (p)  Amendment  No.  5  to  the  Master  Distribution  and  Individual
Shareholder   Services  Plan  (A  Class),   dated   September  29,  2005  (filed
electronically  as  Exhibit  m25  to  Post-Effective  Amendment  No.  38 to  the
Registration  Statement of American Century World Mutual Funds, Inc. on November
30, 2005, File No. 33-39242, and incorporated herein by reference).

          (q)  Amendment  No.  6  to  the  Master  Distribution  and  Individual
Shareholder Services Plan (A Class), dated March 30, 2006 (filed  electronically
as Exhibit m27 to Post-Effective  Amendment No. 23 to the Registration Statement
of American Century  Strategic Asset  Allocations,  Inc. on March 30, 2006, File
No. 33-79482, and incorporated herein by reference).

          (r) Master  Distribution and Individual  Shareholder  Services Plan (B
Class),  dated  September  3,  2002  (filed  electronically  as  Exhibit  m7  to
Post-Effective  Amendment  No.  34 to the  Registration  Statement  of  American
Century  California  Tax-Free and Municipal  Funds on October 1, 2002,  File No.
2-82734, and incorporated herein by reference).

          (s)  Amendment  No.  1  to  the  Master  Distribution  and  Individual
Shareholder   Services   Plan  (B  Class),   dated   February  27,  2004  (filed
electronically  as  Exhibit  m20  to  Post-Effective  Amendment  No.  104 to the
Registration  Statement of American  Century Mutual Funds,  Inc. on February 26,
2004, File No. 2-14213, and incorporated herein by reference).

          (t)  Amendment  No.  2  to  the  Master  Distribution  and  Individual
Shareholder   Services  Plan  (B  Class),   dated   September  30,  2004  (filed
electronically  as Exhibit  m26 to  Post-Effective  No. 106 to the  Registration
Statement of American Century Mutual Funds,  Inc. on November 29, 2004, File No.
2-14213, and incorporated herein by reference).

          (u)  Amendment  No.  3  to  the  Master  Distribution  and  Individual
Shareholder   Services   Plan  (B  Class),   dated   November  17,  2004  (filed
electronically  as  Exhibit  m27  to  Post-Effective  Amendment  No.  106 to the
Registration  Statement of American  Century Mutual Funds,  Inc. on November 29,
2004, File No. 2-14213, and incorporated herein by reference).

          (v)  Amendment  No.  4  to  the  Master  Distribution  and  Individual
Shareholder Services Plan (B Class), dated May 1, 2005 (filed  electronically as
Exhibit m18 to Post-Effective  Amendment No. 44 to the Registration Statement of
Municipal Trust on May 13, 2005, File No. 2-91229,  and  incorporated  herein by
reference).

          (w)  Amendment  No.  5  to  the  Master  Distribution  and  Individual
Shareholder   Services  Plan  (B  Class),   dated   September  29,  2005  (filed
electronically  as  Exhibit  m31  to  Post-Effective  Amendment  No.  38 to  the
Registration  Statement of American Century World Mutual Funds, Inc. on November
30, 2005, File No. 33-39242, and incorporated herein by reference).

          (x)  Amendment  No.  6  to  the  Master  Distribution  and  Individual
Shareholder Services Plan (B Class), dated March 30, 2006 (filed  electronically
as Exhibit m34 to Post-Effective  Amendment No. 23 to the Registration Statement
of American Century  Strategic Asset  Allocations,  Inc. on March 30, 2006, File
No. 33-79482, and incorporated herein by reference).

          (y) Master Distribution and Shareholder Services Plan (Advisor Class),
dated August 1, 1997,  (filed  electronically  as Exhibit m18 to  Post-Effective
Amendment  No. 32 to the  Registration  Statement  of  American  Century  Target
Maturities Trust on January 31, 2000, File No. 2-94608,  and incorporated herein
by reference).

          (z) Amendment to Master  Distribution  and  Shareholder  Services Plan
(Advisor  Class),  dated June 29,  1998 (filed  electronically  as Exhibit m2 to
Post-Effective  Amendment  No.  32 to the  Registration  Statement  of  American
Century  Target  Maturities  Trust on January 31, 2000,  File No.  2-94608,  and
incorporated herein by reference).

          (aa) Amendment No. 1 to Master  Distribution and Shareholder  Services
Plan (Advisor Class),  dated August 1, 2001 (filed  electronically as Exhibit m3
to  Post-Effective  Amendment No. 44 to the  Registration  Statement of American
Century  Government  Income  Trust  on July 31,  2001,  File  No.  2-99222,  and
incorporated herein by reference).

          (bb) Amendment No. 2 to Master  Distribution and Shareholder  Services
Plan (Advisor Class), dated December 3, 2001 (filed electronically as Exhibit m4
to Post-Effective Amendment No. 16 to the Registration Statement of the American
Century  Investment  Trust  on  November  30,  2001,  File  No.  33-65170,   and
incorporated herein by reference).

          (cc) Amendment No. 3 to Master  Distribution and Shareholder  Services
Plan (Advisor Class), dated July 1, 2002 (filed  electronically as Exhibit m5 to
Post-Effective  Amendment  No.  38 to the  Registration  Statement  of  American
Century  Target  Maturities  Trust on January 31, 2005,  File No.  2-94608,  and
incorporated herein by reference).

          (dd) Amendment No. 4 to Master  Distribution and Shareholder  Services
Plan (Advisor Class),  dated May 1, 2004 (filed  electronically as Exhibit m6 to
Post-Effective  Amendment No. 35 to the Registration Statement of the Registrant
on April 29, 2004, File No. 33-19589, and incorporated herein by reference).

          (ee) Amendment No. 5 to Master  Distribution and Shareholder  Services
Plan (Advisor Class), dated July 29, 2005 (filed electronically as Exhibit m7 to
Post-Effective  Amendment  No.  51 to the  Registration  Statement  of  American
Century  Government  Income  Trust  on July 28,  2005,  File  No.  2-99222,  and
incorporated herein by reference).

          (ff)  Amendment  No.  6 to the  Master  Distribution  and  Shareholder
Services Plan (Advisor Class), dated September 29, 2005 (filed electronically as
Exhibit m8 to Post-Effective  Amendment No. 41 to the Registration  Statement of
the Registrant on September 29, 2005, File No. 33-19589, and incorporated herein
by reference).

          (gg) Master Distribution and Individual  Shareholder  Services Plan (R
Class),  dated  August  29,  2003  (filed   electronically  as  Exhibit  m16  to
Post-Effective  Amendment  No.  17 to the  Registration  Statement  of  American
Century Strategic Asset Allocations, Inc. on August 28, 2003, File No. 33-79482,
and incorporated herein by reference).

          (hh)  Amendment  No.  1 to  the  Master  Distribution  and  Individual
Shareholder Services Plan (R Class), dated May 1, 2004 (filed  electronically as
Exhibit m13 to Post-Effective  Amendment No. 35 to the Registration Statement of
the Registrant on April 29, 2004, File No. 33-19589,  and incorporated herein by
reference).

          (ii)  Amendment  No.  2 to  the  Master  Distribution  and  Individual
Shareholder   Services   Plan  (R  Class),   dated   February  24,  2005  (filed
electronically  as  Exhibit  m30  to  Post-Effective  Amendment  No.  22 to  the
Registration Statement of American Century Strategic Asset Allocations,  Inc. on
March 30, 2005, File No. 33-79482, and incorporated herein by reference).

          (jj)  Amendment  No.  3 to  the  Master  Distribution  and  Individual
Shareholder Services Plan (R Class),  dated July 29, 2005 (filed  electronically
as Exhibit m33 to Post-Effective Amendment No. 111 to the Registration Statement
of American Century Mutual Funds,  Inc. on July 28, 2005, File No. 2-14213,  and
incorporated herein by reference).

          (kk)  Amendment  No.  4 to  the  Master  Distribution  and  Individual
Shareholder   Services  Plan  (R  Class),   dated   September  29,  2005  (filed
electronically  as  Exhibit  m22  to  Post-Effective  Amendment  No.  41 to  the
Registration  Statement  of the  Registrant  on  September  29,  2005,  File No.
33-19589, and incorporated herein by reference).

          (ll)  Amendment  No.  5 to  the  Master  Distribution  and  Individual
Shareholder Services Plan (R Class), dated March 30, 2006 (filed  electronically
as Exhibit m40 to Post-Effective  Amendment No. 23 to the Registration Statement
of American Century  Strategic Asset  Allocations,  Inc. on March 30, 2006, File
No. 33-79482, and incorporated herein by reference).

          (mm) Amended and Restated Multiple Class Plan, dated September 3, 2002
(filed  electronically  as Exhibit n to  Post-Effective  Amendment No. 35 to the
Registration  Statement of American  Century  California  Tax-Free and Municipal
Funds on  December  17,  2002,  File No.  2-82734,  and  incorporated  herein by
reference).

          (nn) Amendment No. 1 to the Amended and Restated  Multiple Class Plan,
dated December 31, 2002 (filed  electronically  as Exhibit n2 to  Post-Effective
Amendment No. 39 to the  Registration  Statement of American  Century  Municipal
Trust on  December  23,  2002,  File No.  2-91229,  and  incorporated  herein by
reference).

          (oo) Amendment No. 2 to the Amended and Restated  Multiple Class Plan,
dated  August 29, 2003  (filed  electronically  as Exhibit n3 to  Post-Effective
Amendment No. 17 to the  Registration  Statement of American  Century  Strategic
Asset Allocations,  Inc. on August 28, 2003, File No. 33-79482, and incorporated
herein by reference).

          (pp) Amendment No. 3 to the Amended and Restated  Multiple Class Plan,
dated February 27, 2004 (filed  electronically  as Exhibit n4 to  Post-Effective
Amendment  No. 104 to the  Registration  Statement  of American  Century  Mutual
Funds, Inc. on February 26, 2004, File No. 2-14213,  and incorporated  herein by
reference).

          (qq) Amendment No. 4 to the Amended and Restated  Multiple Class Plan,
dated  May  1,  2004  (filed  electronically  as  Exhibit  n5 to  Post-Effective
Amendment No. 35 to the  Registration  Statement of the  Registrant on April 29,
2004, File No. 33-19589, and incorporated herein by reference).

          (rr) Amendment No. 5 to the Amended and Restated  Multiple Class Plan,
dated  August 1, 2004  (filed  electronically  as Exhibit  n6 to  Post-Effective
Amendment No. 24 to the Registration  Statement of American  Century  Investment
Trust on  August  1,  2004,  File  No.  33-65170,  and  incorporated  herein  by
reference).

          (ss) Amendment No. 6 to the Amended and Restated  Multiple Class Plan,
dated  as  of  September  30,  2004  (filed  electronically  as  Exhibit  n7  to
Post-Effective  Amendment  No.  20 to the  Registration  Statement  of  American
Century  Strategic  Asset  Allocations,  Inc. on September  29,  2004,  File No.
33-79482, and incorporated herein by reference).

          (tt) Amendment No. 7 to the Amended and Restated  Multiple Class Plan,
dated November 17, 2004 (filed  electronically  as Exhibit n8 to  Post-Effective
Amendment  No. 106 to the  Registration  Statement  of American  Century  Mutual
Funds, Inc. on November 29, 2004, File No. 2-14213,  and incorporated  herein by
reference).

          (uu) Amendment No. 8 to the Amended and Restated  Multiple Class Plan,
dated February 24, 2005 (filed  electronically  as Exhibit n9 to  Post-Effective
Amendment No. 22 to the  Registration  Statement of American  Century  Strategic
Asset Allocations,  Inc. on March 30, 2005, File No. 33-79482,  and incorporated
herein by reference).

          (vv) Amendment No. 9 to the Amended and Restated  Multiple Class Plan,
dated July 29,  2005  (filed  electronically  as Exhibit  n10 to  Post-Effective
Amendment  No. 111 to the  Registration  Statement  of American  Century  Mutual
Funds,  Inc. on July 28, 2005,  File No.  2-14213,  and  incorporated  herein by
reference).

          (ww) Amendment No. 10 to the Amended and Restated Multiple Class Plan,
dated September 29, 2005 (filed  electronically as Exhibit n11 to Post-Effective
Amendment No. 41 to the  Registration  Statement of the  Registrant on September
29, 2005, File No. 33-19589, and incorporated herein by reference).

          (xx) Amendment No. 11 to the Amended and Restated Multiple Class Plan,
dated  March 30,  2006 (filed  electronically  as Exhibit n12 to  Post-Effective
Amendment No. 23 to the  Registration  Statement of American  Century  Strategic
Asset Allocations,  Inc. on March 30, 2006, File No. 33-79482,  and incorporated
herein by reference).

     (11)  Opinion  and  Consent  of  Counsel,  dated  October  2,  2006  (filed
electronically  as Exhibit 11 to the Registration  Statement on Form N-14 of the
Registrant on October 2, 2006, File No.  33-19589,  and  incorporated  herein by
reference).

     (12) Form of Opinion  and  Consent of  Counsel  as to the tax  matters  and
consequences  to  shareholders  (filed  electronically  as  Exhibit  12  to  the
Registration  Statement on Form N-14 of the Registrant on October 2, 2006,  File
No. 33-19589, and incorporated herein by reference).

     (13) (a)  Transfer  Agency   Agreement  with  American   Century   Services
Corporation,  dated  August  1,  1997  (filed  electronically  as  Exhibit  9 to
Post-Effective  Amendment  No.  33 to the  Registration  Statement  of  American
Century  Government  Income  Trust  on July 31,  1997,  File  No.  2-99222,  and
incorporated herein by reference).

          (b) Amendment No. 1 to the Transfer Agency Agreement  American Century
Services Corporation, dated June 29, 1998 (filed electronically as Exhibit 9b to
Post-Effective  Amendment  No.  23 to the  Registration  Statement  of  American
Century  Quantitative  Equity Funds on June 29,  1998,  File No.  33-19589,  and
incorporated herein by reference).

          (c) Amendment  No. 2 to the Transfer  Agency  Agreement  with American
Century Services  Corporation,  dated November 20, 2000 (filed electronically as
Exhibit h4 to Post-Effective  Amendment No. 30 to the Registration  Statement of
American Century  California  Tax-Free and Municipal Funds on December 29, 2000,
File No. 2-82734, and incorporated herein by reference).

          (d) Amendment  No. 3 to the Transfer  Agency  Agreement  with American
Century  Services  Corporation,  dated August 1, 2001 (filed  electronically  as
Exhibit h5 to Post-Effective  Amendment No. 44 to the Registration  Statement of
American Century Government Income Trust on July 31, 2001, File No. 2-99222, and
incorporated herein by reference).

          (e) Amendment  No. 4 to the Transfer  Agency  Agreement  with American
Century Services  Corporation,  dated December 3, 2001 (filed  electronically as
Exhibit h6 to Post-Effective  Amendment No. 16 to the Registration  Statement of
American Century  Investment Trust on November 30, 2001, File No. 33-65170,  and
incorporated herein by reference).

          (f) Amendment  No. 5 to the Transfer  Agency  Agreement  with American
Century  Services  Corporation,  dated  July 1, 2002  (filed  electronically  as
Exhibit h6 to Post-Effective  Amendment No. 17 to the Registration  Statement of
American  Century  Investment  Trust on June 28, 2002,  File No.  33-65170,  and
incorporated herein by reference).

          (g) Amendment  No. 6 to the Transfer  Agency  Agreement  with American
Century Services  Corporation,  dated September 3, 2002 (filed electronically as
Exhibit h7 to Post-Effective  Amendment No. 35 to the Registration  Statement of
the Registrant on September 30, 2002, File No. 2-91229,  and incorporated herein
by reference).

          (h) Amendment  No. 7 to the Transfer  Agency  Agreement  with American
Century Services  Corporation,  dated December 31, 2002 (filed electronically as
Exhibit h8 to  Post-Effective  Amendment No. 4 to the Registration  Statement of
American  Century  Variable  Portfolios II, Inc. on December 23, 2002,  File No.
333-46922, and incorporated herein by reference).

          (i) Amendment  No. 8 to the Transfer  Agency  Agreement  with American
Century Services Corporation, dated May 1, 2004 (filed electronically as Exhibit
h10 to Post-Effective Amendment No. 35 to the Registration Statement of American
Century  Quantitative  Equity Funds,  Inc. on April 29, 2004, File No. 33-19589,
and incorporated herein by reference).

          (j) Amendment  No. 9 to the Transfer  Agency  Agreement  with American
Century Services,  LLC, dated May 1, 2005 (filed electronically as Exhibit h9 to
Post-Effective  Amendment  No.  38 to the  Registration  Statement  of  American
Century Quantitative Equity Funds, Inc. on May 13, 2005, File No. 33-19589,  and
incorporated herein by reference).

          (k) Amendment No. 10 to the Transfer  Agency  Agreement  with American
Century Services, LLC, dated September 29, 2005 (filed electronically as Exhibit
h11 to Post-Effective Amendment No. 41 to the Registration Statement of American
Century  Quantitative  Equity  Funds,  Inc.  on  September  29,  2005,  File No.
33-19589, and incorporated herein by reference).

          (l) Amendment No. 11 to the Transfer  Agency  Agreement  with American
Century Services, LLC, dated March 30, 2006 (filed electronically as Exhibit h12
to  Post-Effective  Amendment No. 50 to the  Registration  Statement of American
Century  Municipal Trust on March 31, 2006, File No. 2-14213,  and  incorporated
herein by reference).

          (m) Amendment No. 12 to the Transfer  Agency  Agreement  with American
Century Services, LLC, dated April 28, 2006 (filed electronically as Exhibit h13
to  Post-Effective  Amendment  No.  44 to  the  Registration  Statement  of  the
Registrant on April 28, 2006,  File No.  33-19589,  and  incorporated  herein by
reference).

          (n) Credit  Agreement  with  JPMorgan  Chase Bank,  as  Administrative
Agent,  dated  December  17,  2003  (filed   electronically  as  Exhibit  h9  to
Post-Effective  Amendment  No.  39 to the  Registration  Statement  of  American
Century  Target  Maturities  Trust on January 30, 2004,  File No.  2-94608,  and
incorporated herein by reference).

          (o) Termination,  Replacement and Restatement  Agreement with JPMorgan
Chase Bank N.A.,  as  Administrative  Agent,  dated  December  14,  2005  (filed
electronically  as  Exhibit  h13  to  Post-Effective  Amendment  No.  40 to  the
Registration  Statement of American  Century  California  Tax-Free and Municipal
Funds on  December  29,  2005,  File No.  2-82734,  and  incorporated  herein by
reference).

          (p)  Customer   Identification   Program  Reliance   Agreement  (filed
electronically   as  Exhibit  h2  to  Pre-Effective   Amendment  No.  1  to  the
Registration  Statement of American Century Growth Funds,  Inc. on May 30, 2006,
File No. 333-116351, and incorporated herein by reference).

          (q)  New  Account   Agreement   with  Goldman,   Sachs  &  Co.  (filed
electronically  as  Exhibit  h15  to  Post-Effective  Amendment  No.  41 to  the
Registration  Statement  of the  Registrant  on  September  29,  2005,  File No.
33-19589, and incorporated herein by reference).

          (r)  Prime  Brokerage  Supplement  with  Goldman,  Sachs & Co.  (filed
electronically  as  Exhibit  h16  to  Post-Effective  Amendment  No.  41 to  the
Registration  Statement  of the  Registrant  on  September  29,  2005,  File No.
33-19589, and incorporated herein by reference).

          (s)  Amendment  No.  1 to  Prime  Brokerage  Agreement,  dated  as  of
September 29, 2005, by and between  Goldman,  Sachs & Co. and Long/Short  Equity
Fund,  a series of American  Century  Quantitative  Equity  Funds,  Inc.  (filed
electronically  as  Exhibit  h17  to  Post-Effective  Amendment  No.  41 to  the
Registration  Statement  of the  Registrant  on  September  29,  2005,  File No.
33-19589, and incorporated herein by reference).

     (14) (a)  Consent of  PricewaterhouseCoopers  LLP,  independent  registered
public  accounting  firm,  dated  September  27, 2006 (filed  electronically  as
Exhibit 14(a) to the  Registration  Statement on Form N-14 of the  Registrant on
October 2, 2006, File No. 33-19589, and incorporated herein by reference).

          (b)  Consent of  PricewaterhouseCoopers  LLP,  independent  registered
public accounting firm, dated November 3, 2006, is included herein.

     (15)  Not applicable.

     (16) (a) Power of Attorney,  dated August 25, 2006 (filed electronically as
Exhibit j2 to Post-Effective  Amendment No. 45 to the Registration  Statement of
American Century  Quantitative Equity Funds, Inc. on September 1, 2006, File No.
33-19589, and incorporated herein by reference).

          (b)   Secretary's   Certificate,   dated   August  25,   2006   (filed
electronically  as  Exhibit  j3  to  Post-Effective  Amendment  No.  45  to  the
Registration  Statement of American Century  Quantitative  Equity Funds, Inc. on
September 1, 2006, File No. 33-19589, and incorporated herein by reference).

     (17)  Form of proxy is included herein.

Item 17.  Undertakings

Not applicable.


                                   SIGNATURES


     As required by the  Securities Act of 1933, as amended,  this  Registration
Statement  has been  signed on behalf of the  Registrant,  in the City of Kansas
City, State of Missouri on the 7th day of November, 2006.


                            AMERICAN CENTURY QUANTITATIVE EQUITY FUNDS, INC.
                            (Registrant)


                            By: *
                                -----------------------------------------
                                William M. Lyons
                                President and Principal Executive Officer


     As required by the Securities Act of 1933, this Registration  Statement has
been  signed  by the  following  persons  in  the  capacities  and on the  dates
indicated.

SIGNATURE                      TITLE                              DATE
- ---------                      -----                              ----

*                          President, Principal               November 7, 2006
- ------------------------   Executive Officer
William M. Lyons           and Trustee


*                          Vice President,                    November 7, 2006
- ------------------------   Treasurer and Chief
Robert J. Leach            Financial Officer


*                          Director                           November 7, 2006
- ------------------------
John Freidenrich


*                          Chairman of the                    November 7, 2006
- ------------------------   Board and Director
Ronald J. Gilson


*                          Director                           November 7, 2006
- ------------------------
Kathryn A. Hall


*                          Director                           November 7, 2006
- ------------------------
Myron S. Scholes


*                          Director                           November 7, 2006
- ------------------------
John B. Shoven


*                          Director                           November 7, 2006
- ------------------------
Jeanne D. Wohlers


*By:  /s/ Brian L. Brogan
      -------------------------------------------
      Brian L. Brogan
      Attorney in Fact
      (pursuant to Power of Attorney
      dated August 25, 2006)